Panamanian vs Immigrants from Sudan Self-Care Disability
COMPARE
Panamanian
Immigrants from Sudan
Self-Care Disability
Self-Care Disability Comparison
Panamanians
Immigrants from Sudan
2.5%
SELF-CARE DISABILITY
6.4/ 100
METRIC RATING
210th/ 347
METRIC RANK
2.3%
SELF-CARE DISABILITY
99.8/ 100
METRIC RATING
41st/ 347
METRIC RANK
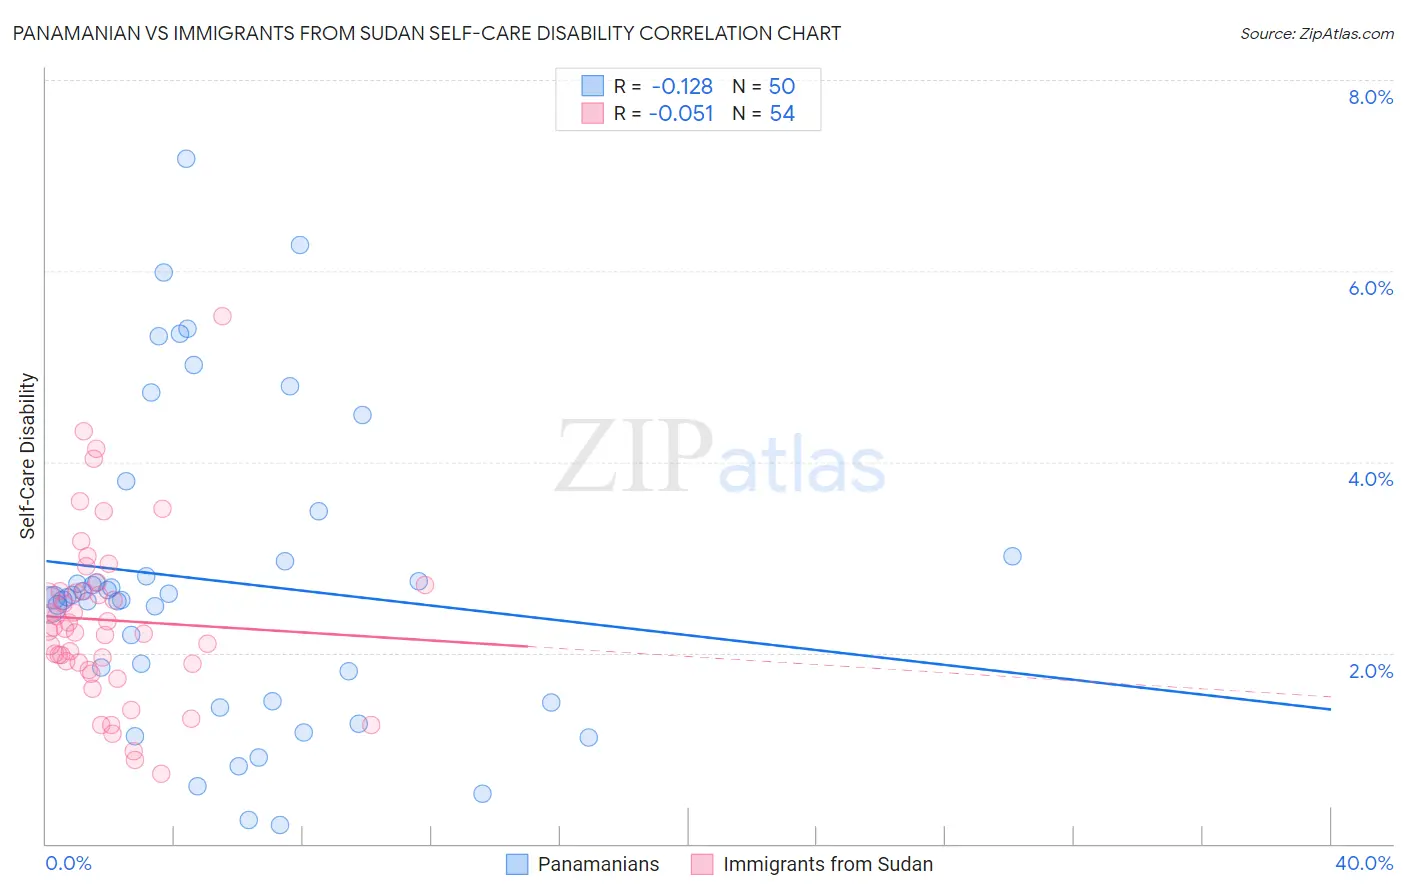
Panamanian vs Immigrants from Sudan Self-Care Disability Correlation Chart
The statistical analysis conducted on geographies consisting of 280,994,783 people shows a poor negative correlation between the proportion of Panamanians and percentage of population with self-care disability in the United States with a correlation coefficient (R) of -0.128 and weighted average of 2.5%. Similarly, the statistical analysis conducted on geographies consisting of 118,937,078 people shows a slight negative correlation between the proportion of Immigrants from Sudan and percentage of population with self-care disability in the United States with a correlation coefficient (R) of -0.051 and weighted average of 2.3%, a difference of 11.7%.
Self-Care Disability Correlation Summary
| Measurement | Panamanian | Immigrants from Sudan |
| Minimum | 0.20% | 0.73% |
| Maximum | 7.2% | 5.5% |
| Range | 7.0% | 4.8% |
| Mean | 2.8% | 2.3% |
| Median | 2.6% | 2.2% |
| Interquartile 25% (IQ1) | 1.5% | 1.9% |
| Interquartile 75% (IQ3) | 3.0% | 2.6% |
| Interquartile Range (IQR) | 1.5% | 0.77% |
| Standard Deviation (Sample) | 1.6% | 0.91% |
| Standard Deviation (Population) | 1.6% | 0.90% |
Similar Demographics by Self-Care Disability
Demographics Similar to Panamanians by Self-Care Disability
In terms of self-care disability, the demographic groups most similar to Panamanians are Malaysian (2.5%, a difference of 0.23%), Native Hawaiian (2.6%, a difference of 0.27%), Samoan (2.6%, a difference of 0.29%), Central American (2.5%, a difference of 0.38%), and Ecuadorian (2.6%, a difference of 0.39%).
| Demographics | Rating | Rank | Self-Care Disability |
| Immigrants | Lebanon | 12.4 /100 | #203 | Poor 2.5% |
| Immigrants | Bahamas | 11.9 /100 | #204 | Poor 2.5% |
| Immigrants | Russia | 11.0 /100 | #205 | Poor 2.5% |
| Alaskan Athabascans | 10.4 /100 | #206 | Poor 2.5% |
| French | 9.9 /100 | #207 | Tragic 2.5% |
| Central Americans | 8.7 /100 | #208 | Tragic 2.5% |
| Malaysians | 7.7 /100 | #209 | Tragic 2.5% |
| Panamanians | 6.4 /100 | #210 | Tragic 2.5% |
| Native Hawaiians | 5.1 /100 | #211 | Tragic 2.6% |
| Samoans | 5.1 /100 | #212 | Tragic 2.6% |
| Ecuadorians | 4.7 /100 | #213 | Tragic 2.6% |
| Immigrants | Honduras | 4.7 /100 | #214 | Tragic 2.6% |
| Immigrants | Thailand | 4.5 /100 | #215 | Tragic 2.6% |
| Whites/Caucasians | 4.4 /100 | #216 | Tragic 2.6% |
| Celtics | 4.4 /100 | #217 | Tragic 2.6% |
Demographics Similar to Immigrants from Sudan by Self-Care Disability
In terms of self-care disability, the demographic groups most similar to Immigrants from Sudan are Iranian (2.3%, a difference of 0.070%), Immigrants from Uganda (2.3%, a difference of 0.10%), Immigrants from Bulgaria (2.3%, a difference of 0.11%), Immigrants from Pakistan (2.3%, a difference of 0.14%), and Immigrants from South Africa (2.3%, a difference of 0.19%).
| Demographics | Rating | Rank | Self-Care Disability |
| Immigrants | Turkey | 99.9 /100 | #34 | Exceptional 2.3% |
| Immigrants | Australia | 99.9 /100 | #35 | Exceptional 2.3% |
| Immigrants | Lithuania | 99.9 /100 | #36 | Exceptional 2.3% |
| Immigrants | Sweden | 99.9 /100 | #37 | Exceptional 2.3% |
| Immigrants | Eastern Africa | 99.9 /100 | #38 | Exceptional 2.3% |
| Immigrants | Bulgaria | 99.8 /100 | #39 | Exceptional 2.3% |
| Iranians | 99.8 /100 | #40 | Exceptional 2.3% |
| Immigrants | Sudan | 99.8 /100 | #41 | Exceptional 2.3% |
| Immigrants | Uganda | 99.8 /100 | #42 | Exceptional 2.3% |
| Immigrants | Pakistan | 99.8 /100 | #43 | Exceptional 2.3% |
| Immigrants | South Africa | 99.8 /100 | #44 | Exceptional 2.3% |
| Norwegians | 99.8 /100 | #45 | Exceptional 2.3% |
| Czechs | 99.8 /100 | #46 | Exceptional 2.3% |
| Jordanians | 99.7 /100 | #47 | Exceptional 2.3% |
| Immigrants | Malaysia | 99.7 /100 | #48 | Exceptional 2.3% |