Panamanian vs Comanche Self-Care Disability
COMPARE
Panamanian
Comanche
Self-Care Disability
Self-Care Disability Comparison
Panamanians
Comanche
2.5%
SELF-CARE DISABILITY
6.4/ 100
METRIC RATING
210th/ 347
METRIC RANK
2.9%
SELF-CARE DISABILITY
0.0/ 100
METRIC RATING
322nd/ 347
METRIC RANK
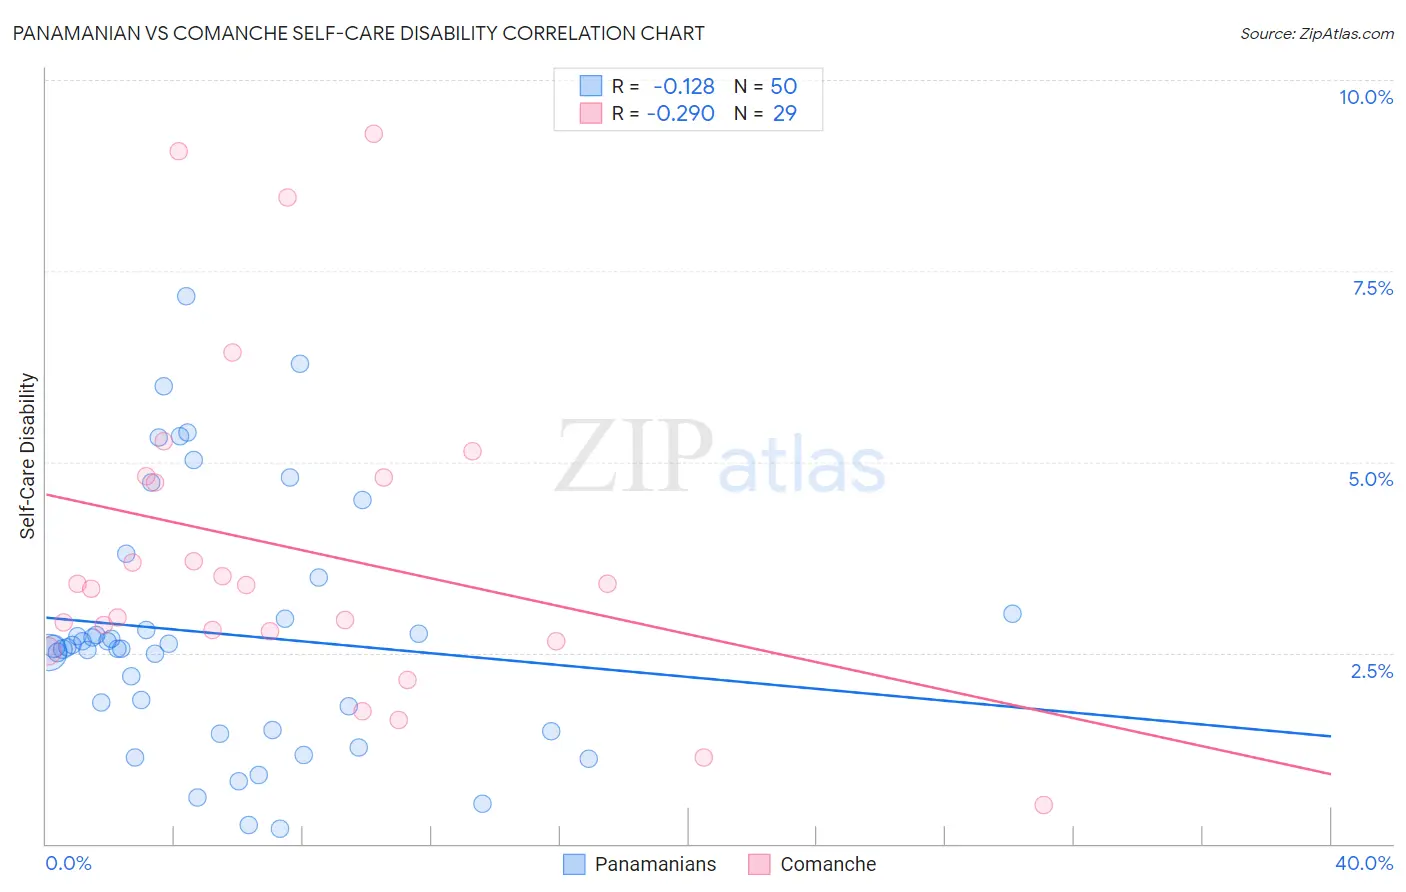
Panamanian vs Comanche Self-Care Disability Correlation Chart
The statistical analysis conducted on geographies consisting of 280,994,783 people shows a poor negative correlation between the proportion of Panamanians and percentage of population with self-care disability in the United States with a correlation coefficient (R) of -0.128 and weighted average of 2.5%. Similarly, the statistical analysis conducted on geographies consisting of 109,703,809 people shows a weak negative correlation between the proportion of Comanche and percentage of population with self-care disability in the United States with a correlation coefficient (R) of -0.290 and weighted average of 2.9%, a difference of 12.9%.
Self-Care Disability Correlation Summary
| Measurement | Panamanian | Comanche |
| Minimum | 0.20% | 0.50% |
| Maximum | 7.2% | 9.3% |
| Range | 7.0% | 8.8% |
| Mean | 2.8% | 3.9% |
| Median | 2.6% | 3.4% |
| Interquartile 25% (IQ1) | 1.5% | 2.7% |
| Interquartile 75% (IQ3) | 3.0% | 4.8% |
| Interquartile Range (IQR) | 1.5% | 2.1% |
| Standard Deviation (Sample) | 1.6% | 2.2% |
| Standard Deviation (Population) | 1.6% | 2.1% |
Similar Demographics by Self-Care Disability
Demographics Similar to Panamanians by Self-Care Disability
In terms of self-care disability, the demographic groups most similar to Panamanians are Malaysian (2.5%, a difference of 0.23%), Native Hawaiian (2.6%, a difference of 0.27%), Samoan (2.6%, a difference of 0.29%), Central American (2.5%, a difference of 0.38%), and Ecuadorian (2.6%, a difference of 0.39%).
| Demographics | Rating | Rank | Self-Care Disability |
| Immigrants | Lebanon | 12.4 /100 | #203 | Poor 2.5% |
| Immigrants | Bahamas | 11.9 /100 | #204 | Poor 2.5% |
| Immigrants | Russia | 11.0 /100 | #205 | Poor 2.5% |
| Alaskan Athabascans | 10.4 /100 | #206 | Poor 2.5% |
| French | 9.9 /100 | #207 | Tragic 2.5% |
| Central Americans | 8.7 /100 | #208 | Tragic 2.5% |
| Malaysians | 7.7 /100 | #209 | Tragic 2.5% |
| Panamanians | 6.4 /100 | #210 | Tragic 2.5% |
| Native Hawaiians | 5.1 /100 | #211 | Tragic 2.6% |
| Samoans | 5.1 /100 | #212 | Tragic 2.6% |
| Ecuadorians | 4.7 /100 | #213 | Tragic 2.6% |
| Immigrants | Honduras | 4.7 /100 | #214 | Tragic 2.6% |
| Immigrants | Thailand | 4.5 /100 | #215 | Tragic 2.6% |
| Whites/Caucasians | 4.4 /100 | #216 | Tragic 2.6% |
| Celtics | 4.4 /100 | #217 | Tragic 2.6% |
Demographics Similar to Comanche by Self-Care Disability
In terms of self-care disability, the demographic groups most similar to Comanche are Seminole (2.9%, a difference of 0.12%), Cherokee (2.9%, a difference of 0.22%), Navajo (2.9%, a difference of 0.32%), Chickasaw (2.9%, a difference of 0.47%), and Spanish American Indian (2.9%, a difference of 0.69%).
| Demographics | Rating | Rank | Self-Care Disability |
| Immigrants | Cuba | 0.0 /100 | #315 | Tragic 2.8% |
| Menominee | 0.0 /100 | #316 | Tragic 2.8% |
| Immigrants | Dominica | 0.0 /100 | #317 | Tragic 2.8% |
| Assyrians/Chaldeans/Syriacs | 0.0 /100 | #318 | Tragic 2.8% |
| Spanish American Indians | 0.0 /100 | #319 | Tragic 2.9% |
| Chickasaw | 0.0 /100 | #320 | Tragic 2.9% |
| Navajo | 0.0 /100 | #321 | Tragic 2.9% |
| Comanche | 0.0 /100 | #322 | Tragic 2.9% |
| Seminole | 0.0 /100 | #323 | Tragic 2.9% |
| Cherokee | 0.0 /100 | #324 | Tragic 2.9% |
| Immigrants | Uzbekistan | 0.0 /100 | #325 | Tragic 2.9% |
| Paiute | 0.0 /100 | #326 | Tragic 2.9% |
| Blacks/African Americans | 0.0 /100 | #327 | Tragic 2.9% |
| Hopi | 0.0 /100 | #328 | Tragic 2.9% |
| Cajuns | 0.0 /100 | #329 | Tragic 2.9% |