Immigrants from Honduras vs Marshallese Self-Care Disability
COMPARE
Immigrants from Honduras
Marshallese
Self-Care Disability
Self-Care Disability Comparison
Immigrants from Honduras
Marshallese
2.6%
SELF-CARE DISABILITY
4.7/ 100
METRIC RATING
214th/ 347
METRIC RANK
2.6%
SELF-CARE DISABILITY
1.2/ 100
METRIC RATING
240th/ 347
METRIC RANK
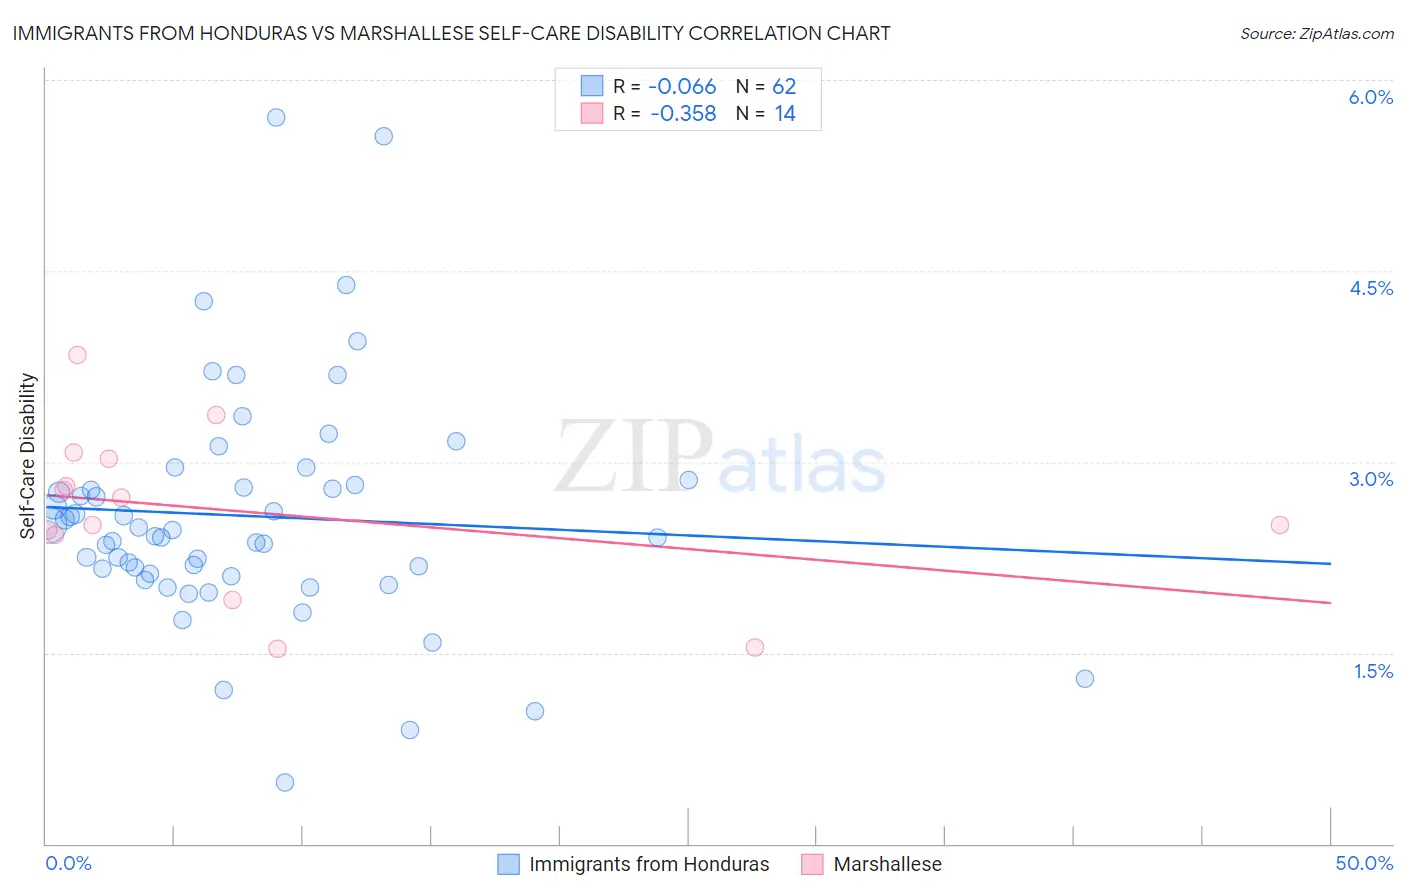
Immigrants from Honduras vs Marshallese Self-Care Disability Correlation Chart
The statistical analysis conducted on geographies consisting of 322,379,490 people shows a slight negative correlation between the proportion of Immigrants from Honduras and percentage of population with self-care disability in the United States with a correlation coefficient (R) of -0.066 and weighted average of 2.6%. Similarly, the statistical analysis conducted on geographies consisting of 14,760,594 people shows a mild negative correlation between the proportion of Marshallese and percentage of population with self-care disability in the United States with a correlation coefficient (R) of -0.358 and weighted average of 2.6%, a difference of 1.6%.
Self-Care Disability Correlation Summary
| Measurement | Immigrants from Honduras | Marshallese |
| Minimum | 0.48% | 1.5% |
| Maximum | 5.7% | 3.8% |
| Range | 5.2% | 2.3% |
| Mean | 2.6% | 2.6% |
| Median | 2.4% | 2.6% |
| Interquartile 25% (IQ1) | 2.1% | 2.4% |
| Interquartile 75% (IQ3) | 2.8% | 3.0% |
| Interquartile Range (IQR) | 0.70% | 0.59% |
| Standard Deviation (Sample) | 0.92% | 0.64% |
| Standard Deviation (Population) | 0.91% | 0.62% |
Similar Demographics by Self-Care Disability
Demographics Similar to Immigrants from Honduras by Self-Care Disability
In terms of self-care disability, the demographic groups most similar to Immigrants from Honduras are Ecuadorian (2.6%, a difference of 0.0%), Immigrants from Thailand (2.6%, a difference of 0.040%), White/Caucasian (2.6%, a difference of 0.070%), Celtic (2.6%, a difference of 0.090%), and Samoan (2.6%, a difference of 0.10%).
| Demographics | Rating | Rank | Self-Care Disability |
| French | 9.9 /100 | #207 | Tragic 2.5% |
| Central Americans | 8.7 /100 | #208 | Tragic 2.5% |
| Malaysians | 7.7 /100 | #209 | Tragic 2.5% |
| Panamanians | 6.4 /100 | #210 | Tragic 2.5% |
| Native Hawaiians | 5.1 /100 | #211 | Tragic 2.6% |
| Samoans | 5.1 /100 | #212 | Tragic 2.6% |
| Ecuadorians | 4.7 /100 | #213 | Tragic 2.6% |
| Immigrants | Honduras | 4.7 /100 | #214 | Tragic 2.6% |
| Immigrants | Thailand | 4.5 /100 | #215 | Tragic 2.6% |
| Whites/Caucasians | 4.4 /100 | #216 | Tragic 2.6% |
| Celtics | 4.4 /100 | #217 | Tragic 2.6% |
| Scotch-Irish | 4.1 /100 | #218 | Tragic 2.6% |
| Immigrants | Moldova | 4.0 /100 | #219 | Tragic 2.6% |
| Sub-Saharan Africans | 4.0 /100 | #220 | Tragic 2.6% |
| Hondurans | 3.8 /100 | #221 | Tragic 2.6% |
Demographics Similar to Marshallese by Self-Care Disability
In terms of self-care disability, the demographic groups most similar to Marshallese are Immigrants from Panama (2.6%, a difference of 0.030%), Senegalese (2.6%, a difference of 0.070%), Immigrants from Syria (2.6%, a difference of 0.17%), Immigrants from Senegal (2.6%, a difference of 0.33%), and Spanish (2.6%, a difference of 0.41%).
| Demographics | Rating | Rank | Self-Care Disability |
| Liberians | 2.1 /100 | #233 | Tragic 2.6% |
| Vietnamese | 2.1 /100 | #234 | Tragic 2.6% |
| Bahamians | 2.0 /100 | #235 | Tragic 2.6% |
| Bermudans | 1.9 /100 | #236 | Tragic 2.6% |
| Immigrants | Senegal | 1.6 /100 | #237 | Tragic 2.6% |
| Senegalese | 1.3 /100 | #238 | Tragic 2.6% |
| Immigrants | Panama | 1.2 /100 | #239 | Tragic 2.6% |
| Marshallese | 1.2 /100 | #240 | Tragic 2.6% |
| Immigrants | Syria | 1.0 /100 | #241 | Tragic 2.6% |
| Spanish | 0.8 /100 | #242 | Tragic 2.6% |
| Hawaiians | 0.8 /100 | #243 | Tragic 2.6% |
| Yuman | 0.8 /100 | #244 | Tragic 2.6% |
| Immigrants | Western Asia | 0.6 /100 | #245 | Tragic 2.6% |
| Cheyenne | 0.6 /100 | #246 | Tragic 2.6% |
| Immigrants | Albania | 0.6 /100 | #247 | Tragic 2.6% |