Immigrants from Honduras vs Welsh Self-Care Disability
COMPARE
Immigrants from Honduras
Welsh
Self-Care Disability
Self-Care Disability Comparison
Immigrants from Honduras
Welsh
2.6%
SELF-CARE DISABILITY
4.7/ 100
METRIC RATING
214th/ 347
METRIC RANK
2.5%
SELF-CARE DISABILITY
50.0/ 100
METRIC RATING
174th/ 347
METRIC RANK
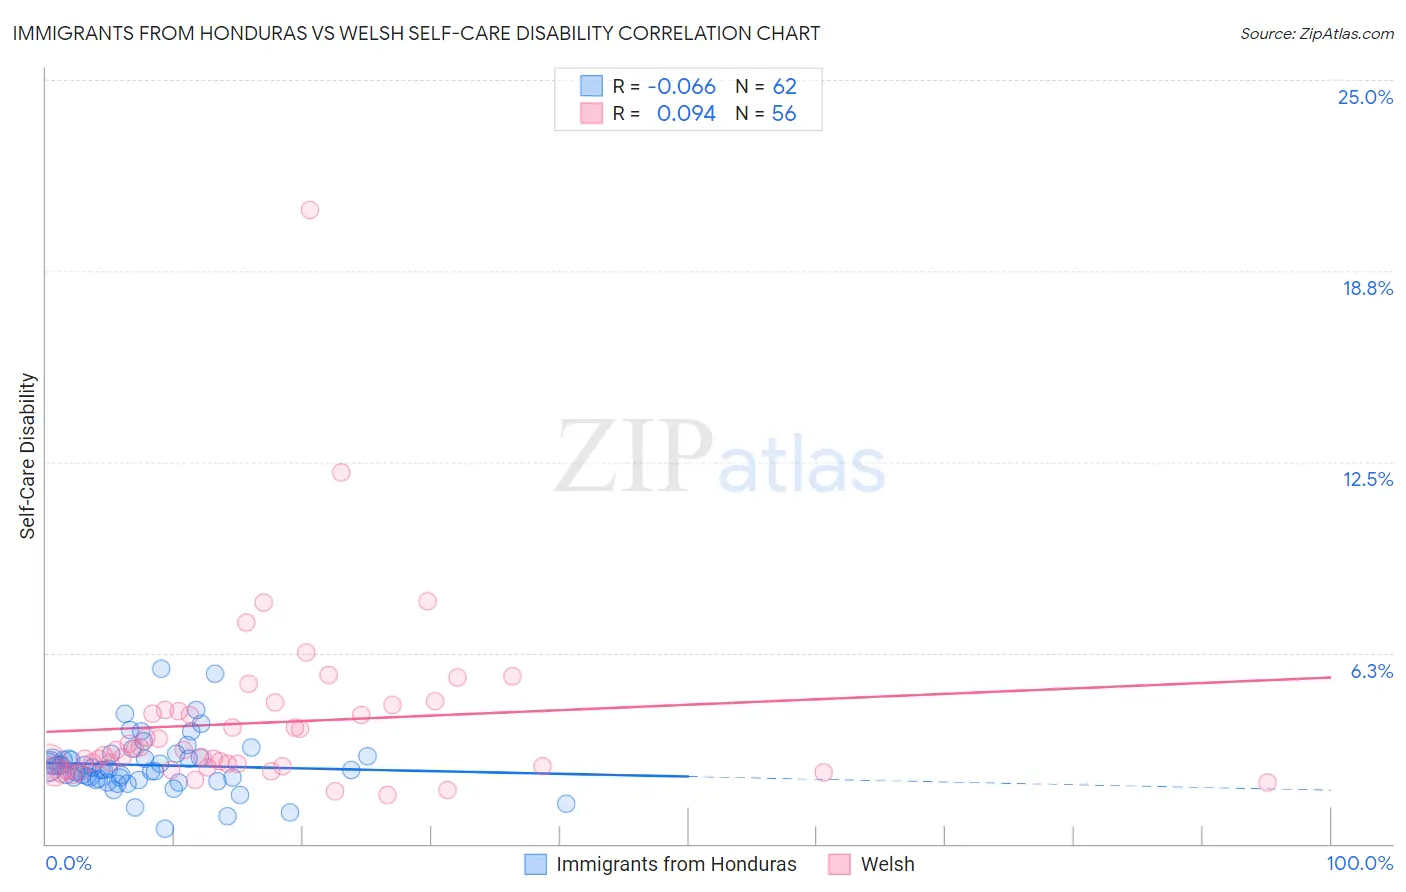
Immigrants from Honduras vs Welsh Self-Care Disability Correlation Chart
The statistical analysis conducted on geographies consisting of 322,379,490 people shows a slight negative correlation between the proportion of Immigrants from Honduras and percentage of population with self-care disability in the United States with a correlation coefficient (R) of -0.066 and weighted average of 2.6%. Similarly, the statistical analysis conducted on geographies consisting of 527,151,887 people shows a slight positive correlation between the proportion of Welsh and percentage of population with self-care disability in the United States with a correlation coefficient (R) of 0.094 and weighted average of 2.5%, a difference of 3.6%.
Self-Care Disability Correlation Summary
| Measurement | Immigrants from Honduras | Welsh |
| Minimum | 0.48% | 1.6% |
| Maximum | 5.7% | 20.7% |
| Range | 5.2% | 19.1% |
| Mean | 2.6% | 4.0% |
| Median | 2.4% | 3.0% |
| Interquartile 25% (IQ1) | 2.1% | 2.5% |
| Interquartile 75% (IQ3) | 2.8% | 4.4% |
| Interquartile Range (IQR) | 0.70% | 1.8% |
| Standard Deviation (Sample) | 0.92% | 2.9% |
| Standard Deviation (Population) | 0.91% | 2.9% |
Similar Demographics by Self-Care Disability
Demographics Similar to Immigrants from Honduras by Self-Care Disability
In terms of self-care disability, the demographic groups most similar to Immigrants from Honduras are Ecuadorian (2.6%, a difference of 0.0%), Immigrants from Thailand (2.6%, a difference of 0.040%), White/Caucasian (2.6%, a difference of 0.070%), Celtic (2.6%, a difference of 0.090%), and Samoan (2.6%, a difference of 0.10%).
| Demographics | Rating | Rank | Self-Care Disability |
| French | 9.9 /100 | #207 | Tragic 2.5% |
| Central Americans | 8.7 /100 | #208 | Tragic 2.5% |
| Malaysians | 7.7 /100 | #209 | Tragic 2.5% |
| Panamanians | 6.4 /100 | #210 | Tragic 2.5% |
| Native Hawaiians | 5.1 /100 | #211 | Tragic 2.6% |
| Samoans | 5.1 /100 | #212 | Tragic 2.6% |
| Ecuadorians | 4.7 /100 | #213 | Tragic 2.6% |
| Immigrants | Honduras | 4.7 /100 | #214 | Tragic 2.6% |
| Immigrants | Thailand | 4.5 /100 | #215 | Tragic 2.6% |
| Whites/Caucasians | 4.4 /100 | #216 | Tragic 2.6% |
| Celtics | 4.4 /100 | #217 | Tragic 2.6% |
| Scotch-Irish | 4.1 /100 | #218 | Tragic 2.6% |
| Immigrants | Moldova | 4.0 /100 | #219 | Tragic 2.6% |
| Sub-Saharan Africans | 4.0 /100 | #220 | Tragic 2.6% |
| Hondurans | 3.8 /100 | #221 | Tragic 2.6% |
Demographics Similar to Welsh by Self-Care Disability
In terms of self-care disability, the demographic groups most similar to Welsh are Immigrants from Bosnia and Herzegovina (2.5%, a difference of 0.020%), Immigrants from Afghanistan (2.5%, a difference of 0.11%), Immigrants from Burma/Myanmar (2.5%, a difference of 0.13%), Immigrants from Kazakhstan (2.5%, a difference of 0.16%), and Pennsylvania German (2.5%, a difference of 0.17%).
| Demographics | Rating | Rank | Self-Care Disability |
| Immigrants | Greece | 57.3 /100 | #167 | Average 2.5% |
| Ute | 57.1 /100 | #168 | Average 2.5% |
| Immigrants | Somalia | 55.9 /100 | #169 | Average 2.5% |
| Scottish | 54.3 /100 | #170 | Average 2.5% |
| Pennsylvania Germans | 53.5 /100 | #171 | Average 2.5% |
| Czechoslovakians | 53.5 /100 | #172 | Average 2.5% |
| Immigrants | Burma/Myanmar | 52.8 /100 | #173 | Average 2.5% |
| Welsh | 50.0 /100 | #174 | Average 2.5% |
| Immigrants | Bosnia and Herzegovina | 49.6 /100 | #175 | Average 2.5% |
| Immigrants | Afghanistan | 47.6 /100 | #176 | Average 2.5% |
| Immigrants | Kazakhstan | 46.7 /100 | #177 | Average 2.5% |
| English | 46.2 /100 | #178 | Average 2.5% |
| Hungarians | 45.5 /100 | #179 | Average 2.5% |
| Indonesians | 41.2 /100 | #180 | Average 2.5% |
| Ghanaians | 40.4 /100 | #181 | Average 2.5% |