Immigrants from Bangladesh vs Immigrants from Singapore Self-Care Disability

COMPARE

Immigrants from Bangladesh
Race
Ancestry
AfghanAfricanAlaska NativeAlaskan AthabascanAlbanianAleutAlsatianAmericanApacheArabArapahoArgentineanArmenianAssyrian/Chaldean/SyriacAustralianAustrianBahamianBangladeshiBarbadianBasqueBelgianBelizeanBermudanBhutaneseBlackfeetBolivianBrazilianBritishBritish West IndianBulgarianBurmeseCajunCambodianCanadianCape VerdeanCarpatho RusynCelticCentral AmericanCentral American IndianCherokeeCheyenneChickasawChileanChineseChippewaChoctawColombianColvilleComancheCosta RicanCreeCreekCroatianCrowCubanCypriotCzechCzechoslovakianDanishDelawareDominicanDutchDutch West IndianEastern EuropeanEcuadorianEgyptianEnglishEstonianEthiopianEuropeanFijianFilipinoFinnishFrenchFrench American IndianFrench CanadianGermanGerman RussianGhanaianGreekGuamanian/ChamorroGuatemalanGuyaneseHaitianHmongHonduranHopiHoumaHungarianIcelanderIndian (Asian)IndonesianInupiatIranianIraqiIrishIroquoisIsraeliItalianJamaicanJapaneseJordanianKenyanKiowaKoreanLaotianLatvianLebaneseLiberianLithuanianLumbeeLuxembourgerMacedonianMalaysianMalteseMarshalleseMenomineeMexicanMexican American IndianMongolianMoroccanNative HawaiianNavajoNepaleseNew ZealanderNicaraguanNigerianNorthern EuropeanNorwegianOkinawanOsageOttawaPaiutePakistaniPalestinianPanamanianParaguayanPennsylvania GermanPeruvianPimaPolishPortuguesePotawatomiPuebloPuerto RicanPuget Sound SalishRomanianRussianSalvadoranSamoanScandinavianScotch-IrishScottishSeminoleSenegaleseSerbianShoshoneSierra LeoneanSiouxSlavicSlovakSloveneSomaliSouth AfricanSouth AmericanSouth American IndianSoviet UnionSpaniardSpanishSpanish AmericanSpanish American IndianSri LankanSubsaharan AfricanSudaneseSwedishSwissSyrianTaiwaneseThaiTlingit-HaidaTohono O'OdhamTonganTrinidadian and TobagonianTsimshianTurkishU.S. Virgin IslanderUgandanUkrainianUruguayanUteVenezuelanVietnameseWelshWest IndianYakamaYaquiYugoslavianYumanYup'ikZimbabwean
Immigration
NonimmigrantsImmigrantsAfghanistanAfricaAlbaniaArgentinaArmeniaAsiaAustraliaAustriaBahamasBangladeshBarbadosBelarusBelgiumBelizeBoliviaBosnia and HerzegovinaBrazilBulgariaBurma/MyanmarCabo VerdeCambodiaCameroonCanadaCaribbeanCentral AmericaChileChinaColombiaCongoCosta RicaCroatiaCubaCzechoslovakiaDenmarkDominicaDominican RepublicEastern AfricaEastern AsiaEastern EuropeEcuadorEgyptEl SalvadorEnglandEritreaEthiopiaEuropeFijiFranceGermanyGhanaGreeceGrenadaGuatemalaGuyanaHaitiHondurasHong KongHungaryIndiaIndonesiaIranIraqIrelandIsraelItalyJamaicaJapanJordanKazakhstanKenyaKoreaKuwaitLaosLatin AmericaLatviaLebanonLiberiaLithuaniaMalaysiaMexicoMicronesiaMiddle AfricaMoldovaMoroccoNepalNetherlandsNicaraguaNigeriaNorth AmericaNorth MacedoniaNorthern AfricaNorthern EuropeNorwayOceaniaPakistanPanamaPeruPhilippinesPolandPortugalRomaniaRussiaSaudi ArabiaScotlandSenegalSerbiaSierra LeoneSomaliaSouth AfricaSouth AmericaSouth Central AsiaSouth Eastern AsiaSouthern EuropeSpainSri LankaSt. Vincent and the GrenadinesSudanSwedenSwitzerlandSyriaTaiwanThailandTrinidad and TobagoTurkeyUgandaUkraineUruguayUzbekistanVenezuelaVietnamWest IndiesWestern AfricaWestern AsiaWestern EuropeYemenZaireZimbabweAzores
Immigrants from Singapore
Race
Ancestry
AfghanAfricanAlaska NativeAlaskan AthabascanAlbanianAleutAlsatianAmericanApacheArabArapahoArgentineanArmenianAssyrian/Chaldean/SyriacAustralianAustrianBahamianBangladeshiBarbadianBasqueBelgianBelizeanBermudanBhutaneseBlackfeetBolivianBrazilianBritishBritish West IndianBulgarianBurmeseCajunCambodianCanadianCape VerdeanCarpatho RusynCelticCentral AmericanCentral American IndianCherokeeCheyenneChickasawChileanChineseChippewaChoctawColombianColvilleComancheCosta RicanCreeCreekCroatianCrowCubanCypriotCzechCzechoslovakianDanishDelawareDominicanDutchDutch West IndianEastern EuropeanEcuadorianEgyptianEnglishEstonianEthiopianEuropeanFijianFilipinoFinnishFrenchFrench American IndianFrench CanadianGermanGerman RussianGhanaianGreekGuamanian/ChamorroGuatemalanGuyaneseHaitianHmongHonduranHopiHoumaHungarianIcelanderIndian (Asian)IndonesianInupiatIranianIraqiIrishIroquoisIsraeliItalianJamaicanJapaneseJordanianKenyanKiowaKoreanLaotianLatvianLebaneseLiberianLithuanianLumbeeLuxembourgerMacedonianMalaysianMalteseMarshalleseMenomineeMexicanMexican American IndianMongolianMoroccanNative HawaiianNavajoNepaleseNew ZealanderNicaraguanNigerianNorthern EuropeanNorwegianOkinawanOsageOttawaPaiutePakistaniPalestinianPanamanianParaguayanPennsylvania GermanPeruvianPimaPolishPortuguesePotawatomiPuebloPuerto RicanPuget Sound SalishRomanianRussianSalvadoranSamoanScandinavianScotch-IrishScottishSeminoleSenegaleseSerbianShoshoneSierra LeoneanSiouxSlavicSlovakSloveneSomaliSouth AfricanSouth AmericanSouth American IndianSoviet UnionSpaniardSpanishSpanish AmericanSpanish American IndianSri LankanSubsaharan AfricanSudaneseSwedishSwissSyrianTaiwaneseThaiTlingit-HaidaTohono O'OdhamTonganTrinidadian and TobagonianTsimshianTurkishU.S. Virgin IslanderUgandanUkrainianUruguayanUteVenezuelanVietnameseWelshWest IndianYakamaYaquiYugoslavianYumanYup'ikZimbabwean
Immigration
NonimmigrantsImmigrantsAfghanistanAfricaAlbaniaArgentinaArmeniaAsiaAustraliaAustriaBahamasBarbadosBelarusBelgiumBelizeBoliviaBosnia and HerzegovinaBrazilBulgariaBurma/MyanmarCabo VerdeCambodiaCameroonCanadaCaribbeanCentral AmericaChileChinaColombiaCongoCosta RicaCroatiaCubaCzechoslovakiaDenmarkDominicaDominican RepublicEastern AfricaEastern AsiaEastern EuropeEcuadorEgyptEl SalvadorEnglandEritreaEthiopiaEuropeFijiFranceGermanyGhanaGreeceGrenadaGuatemalaGuyanaHaitiHondurasHong KongHungaryIndiaIndonesiaIranIraqIrelandIsraelItalyJamaicaJapanJordanKazakhstanKenyaKoreaKuwaitLaosLatin AmericaLatviaLebanonLiberiaLithuaniaMalaysiaMexicoMicronesiaMiddle AfricaMoldovaMoroccoNepalNetherlandsNicaraguaNigeriaNorth AmericaNorth MacedoniaNorthern AfricaNorthern EuropeNorwayOceaniaPakistanPanamaPeruPhilippinesPolandPortugalRomaniaRussiaSaudi ArabiaScotlandSenegalSerbiaSierra LeoneSingaporeSomaliaSouth AfricaSouth AmericaSouth Central AsiaSouth Eastern AsiaSouthern EuropeSpainSri LankaSt. Vincent and the GrenadinesSudanSwedenSwitzerlandSyriaTaiwanThailandTrinidad and TobagoTurkeyUgandaUkraineUruguayUzbekistanVenezuelaVietnamWest IndiesWestern AfricaWestern AsiaWestern EuropeYemenZaireZimbabweAzores
Self-Care Disability
Income
Poverty
Unemployment
Labor Participation
Family Structure
Vehicle Availability
Education Level
Disability

Self-Care Disability Comparison

Immigrants from Bangladesh

Immigrants from Singapore

Tragic
Exceptional
2.6%
SELF-CARE DISABILITY
0.4/ 100
METRIC RATING
252nd/ 347
METRIC RANK
2.1%
SELF-CARE DISABILITY
100.0/ 100
METRIC RATING
4th/ 347
METRIC RANK

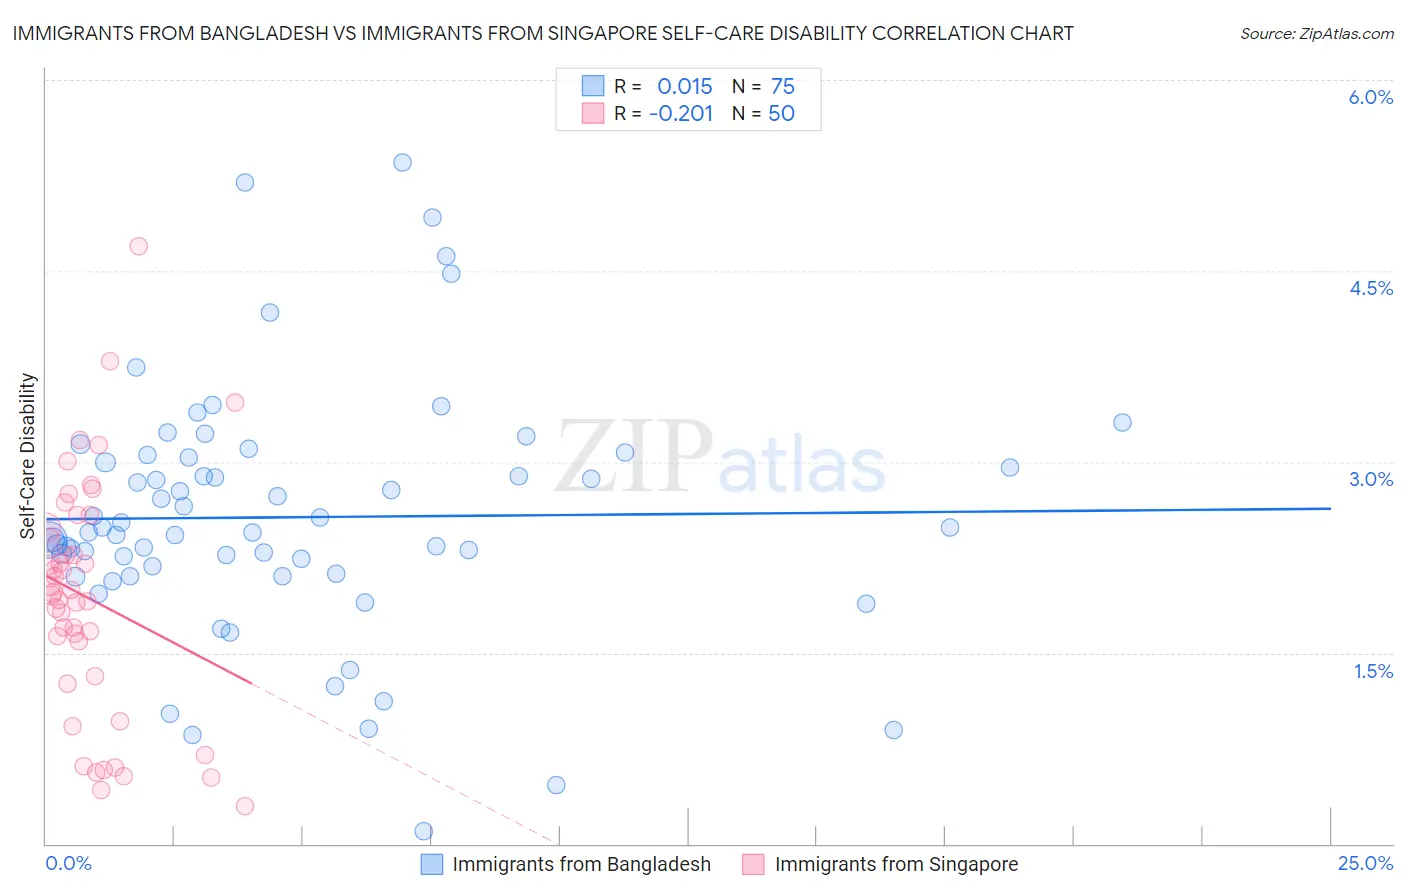
Immigrants from Bangladesh vs Immigrants from Singapore Self-Care Disability Correlation Chart

The statistical analysis conducted on geographies consisting of 203,543,438 people shows no correlation between the proportion of Immigrants from Bangladesh and percentage of population with self-care disability in the United States with a correlation coefficient (R) of 0.015 and weighted average of 2.6%. Similarly, the statistical analysis conducted on geographies consisting of 137,406,292 people shows a weak negative correlation between the proportion of Immigrants from Singapore and percentage of population with self-care disability in the United States with a correlation coefficient (R) of -0.201 and weighted average of 2.1%, a difference of 23.5%.
Immigrants from Bangladesh vs Immigrants from Singapore Self-Care Disability

Self-Care Disability Correlation Summary

MeasurementImmigrants from BangladeshImmigrants from Singapore
Minimum0.094%0.30%
Maximum5.4%4.7%
Range5.3%4.4%
Mean2.6%1.9%
Median2.4%2.0%
Interquartile 25% (IQ1)2.1%1.3%
Interquartile 75% (IQ3)3.0%2.5%
Interquartile Range (IQR)0.92%1.2%
Standard Deviation (Sample)0.97%0.94%
Standard Deviation (Population)0.97%0.93%

Similar Demographics by Self-Care Disability

Demographics Similar to Immigrants from Bangladesh by Self-Care Disability

In terms of self-care disability, the demographic groups most similar to Immigrants from Bangladesh are Immigrants from Liberia (2.6%, a difference of 0.070%), Immigrants from Haiti (2.6%, a difference of 0.080%), Haitian (2.6%, a difference of 0.10%), Tsimshian (2.6%, a difference of 0.14%), and Portuguese (2.6%, a difference of 0.15%).
DemographicsRating | RankSelf-Care Disability
Immigrants | Western Asia
0.6
/100
|
#245
Tragic
2.6%
Cheyenne
0.6
/100
|
#246
Tragic
2.6%
Immigrants | Albania
0.6
/100
|
#247
Tragic
2.6%
Nicaraguans
0.6
/100
|
#248
Tragic
2.6%
Mexican American Indians
0.5
/100
|
#249
Tragic
2.6%
Portuguese
0.4
/100
|
#250
Tragic
2.6%
Immigrants | Liberia
0.4
/100
|
#251
Tragic
2.6%
Immigrants | Bangladesh
0.4
/100
|
#252
Tragic
2.6%
Immigrants | Haiti
0.3
/100
|
#253
Tragic
2.6%
Haitians
0.3
/100
|
#254
Tragic
2.6%
Tsimshian
0.3
/100
|
#255
Tragic
2.6%
Immigrants | Central America
0.3
/100
|
#256
Tragic
2.6%
Potawatomi
0.3
/100
|
#257
Tragic
2.6%
Immigrants | Nonimmigrants
0.3
/100
|
#258
Tragic
2.6%
Immigrants | Belarus
0.2
/100
|
#259
Tragic
2.6%

Demographics Similar to Immigrants from Singapore by Self-Care Disability

In terms of self-care disability, the demographic groups most similar to Immigrants from Singapore are Zimbabwean (2.2%, a difference of 0.98%), Filipino (2.2%, a difference of 1.2%), Immigrants from Bolivia (2.2%, a difference of 1.4%), Bolivian (2.2%, a difference of 1.5%), and Immigrants from Nepal (2.2%, a difference of 1.6%).
DemographicsRating | RankSelf-Care Disability
Yup'ik
100.0
/100
|
#1
Exceptional
1.9%
Immigrants | India
100.0
/100
|
#2
Exceptional
2.0%
Thais
100.0
/100
|
#3
Exceptional
2.1%
Immigrants | Singapore
100.0
/100
|
#4
Exceptional
2.1%
Zimbabweans
100.0
/100
|
#5
Exceptional
2.2%
Filipinos
100.0
/100
|
#6
Exceptional
2.2%
Immigrants | Bolivia
100.0
/100
|
#7
Exceptional
2.2%
Bolivians
100.0
/100
|
#8
Exceptional
2.2%
Immigrants | Nepal
100.0
/100
|
#9
Exceptional
2.2%
Sudanese
100.0
/100
|
#10
Exceptional
2.2%
Immigrants | South Central Asia
100.0
/100
|
#11
Exceptional
2.2%
Immigrants | Ethiopia
100.0
/100
|
#12
Exceptional
2.2%
Ethiopians
100.0
/100
|
#13
Exceptional
2.2%
Luxembourgers
100.0
/100
|
#14
Exceptional
2.2%
Okinawans
100.0
/100
|
#15
Exceptional
2.2%