Honduran vs Bermudan Self-Care Disability
COMPARE
Honduran
Bermudan
Self-Care Disability
Self-Care Disability Comparison
Hondurans
Bermudans
2.6%
SELF-CARE DISABILITY
3.8/ 100
METRIC RATING
221st/ 347
METRIC RANK
2.6%
SELF-CARE DISABILITY
1.9/ 100
METRIC RATING
236th/ 347
METRIC RANK
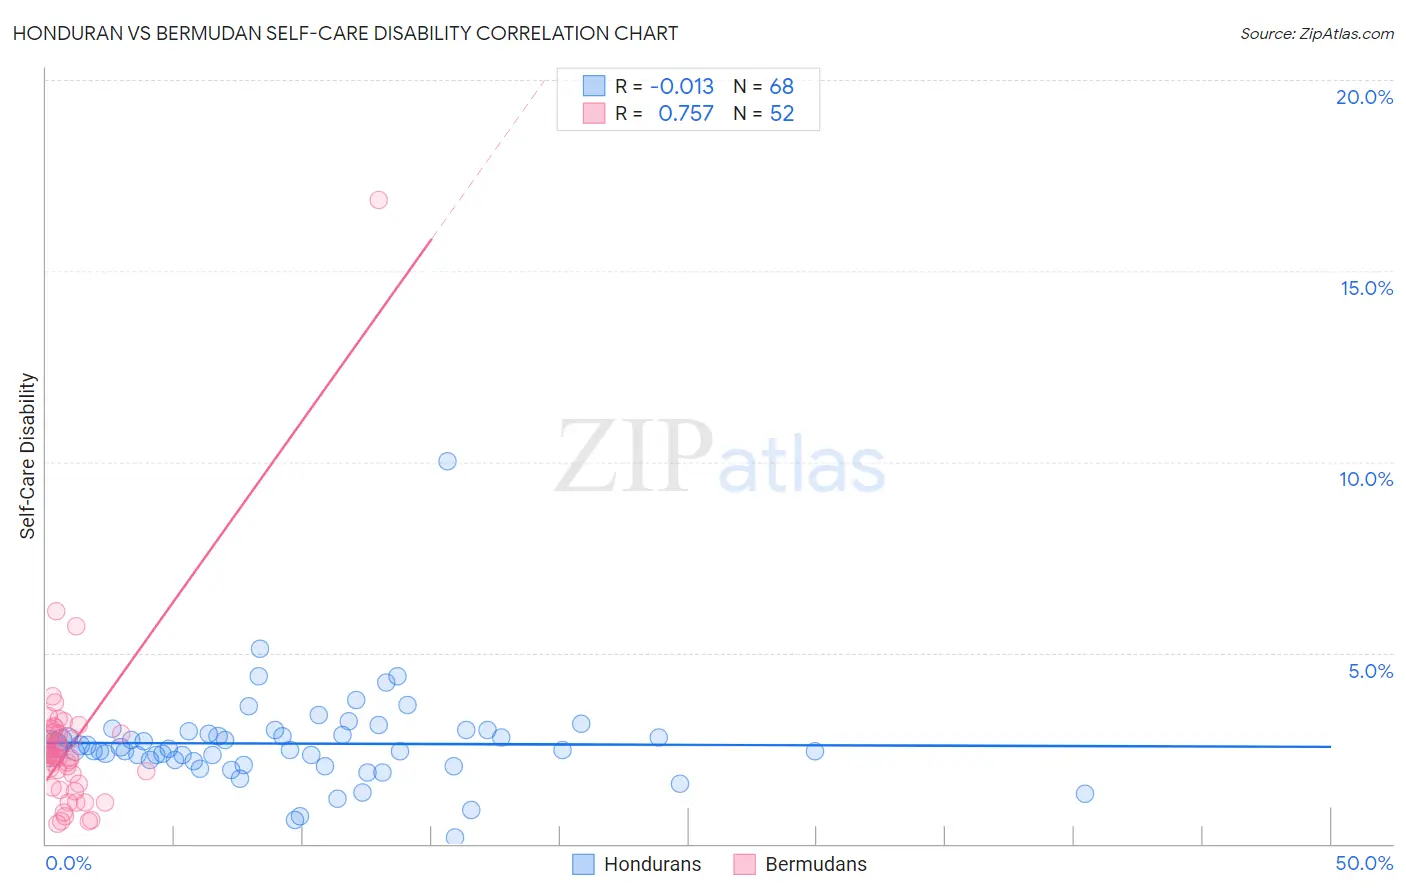
Honduran vs Bermudan Self-Care Disability Correlation Chart
The statistical analysis conducted on geographies consisting of 357,432,362 people shows no correlation between the proportion of Hondurans and percentage of population with self-care disability in the United States with a correlation coefficient (R) of -0.013 and weighted average of 2.6%. Similarly, the statistical analysis conducted on geographies consisting of 55,721,549 people shows a strong positive correlation between the proportion of Bermudans and percentage of population with self-care disability in the United States with a correlation coefficient (R) of 0.757 and weighted average of 2.6%, a difference of 0.83%.
Self-Care Disability Correlation Summary
| Measurement | Honduran | Bermudan |
| Minimum | 0.18% | 0.52% |
| Maximum | 10.0% | 16.9% |
| Range | 9.9% | 16.3% |
| Mean | 2.6% | 2.6% |
| Median | 2.5% | 2.3% |
| Interquartile 25% (IQ1) | 2.2% | 1.5% |
| Interquartile 75% (IQ3) | 2.9% | 2.9% |
| Interquartile Range (IQR) | 0.75% | 1.4% |
| Standard Deviation (Sample) | 1.2% | 2.3% |
| Standard Deviation (Population) | 1.2% | 2.3% |
Demographics Similar to Hondurans and Bermudans by Self-Care Disability
In terms of self-care disability, the demographic groups most similar to Hondurans are Spaniard (2.6%, a difference of 0.010%), French Canadian (2.6%, a difference of 0.020%), Subsaharan African (2.6%, a difference of 0.040%), Immigrants from Moldova (2.6%, a difference of 0.050%), and Osage (2.6%, a difference of 0.070%). Similarly, the demographic groups most similar to Bermudans are Bahamian (2.6%, a difference of 0.070%), Vietnamese (2.6%, a difference of 0.10%), Liberian (2.6%, a difference of 0.11%), Albanian (2.6%, a difference of 0.15%), and Immigrants from Guatemala (2.6%, a difference of 0.18%).
| Demographics | Rating | Rank | Self-Care Disability |
| Scotch-Irish | 4.1 /100 | #218 | Tragic 2.6% |
| Immigrants | Moldova | 4.0 /100 | #219 | Tragic 2.6% |
| Sub-Saharan Africans | 4.0 /100 | #220 | Tragic 2.6% |
| Hondurans | 3.8 /100 | #221 | Tragic 2.6% |
| Spaniards | 3.8 /100 | #222 | Tragic 2.6% |
| French Canadians | 3.8 /100 | #223 | Tragic 2.6% |
| Osage | 3.6 /100 | #224 | Tragic 2.6% |
| Iraqis | 3.2 /100 | #225 | Tragic 2.6% |
| Chinese | 2.9 /100 | #226 | Tragic 2.6% |
| Immigrants | Philippines | 2.7 /100 | #227 | Tragic 2.6% |
| Guatemalans | 2.7 /100 | #228 | Tragic 2.6% |
| Guamanians/Chamorros | 2.5 /100 | #229 | Tragic 2.6% |
| Immigrants | Ecuador | 2.5 /100 | #230 | Tragic 2.6% |
| Immigrants | Guatemala | 2.2 /100 | #231 | Tragic 2.6% |
| Albanians | 2.2 /100 | #232 | Tragic 2.6% |
| Liberians | 2.1 /100 | #233 | Tragic 2.6% |
| Vietnamese | 2.1 /100 | #234 | Tragic 2.6% |
| Bahamians | 2.0 /100 | #235 | Tragic 2.6% |
| Bermudans | 1.9 /100 | #236 | Tragic 2.6% |
| Immigrants | Senegal | 1.6 /100 | #237 | Tragic 2.6% |
| Senegalese | 1.3 /100 | #238 | Tragic 2.6% |