Danish vs Immigrants from Guyana Self-Care Disability
COMPARE
Danish
Immigrants from Guyana
Self-Care Disability
Self-Care Disability Comparison
Danes
Immigrants from Guyana
2.3%
SELF-CARE DISABILITY
99.9/ 100
METRIC RATING
31st/ 347
METRIC RANK
2.8%
SELF-CARE DISABILITY
0.0/ 100
METRIC RATING
299th/ 347
METRIC RANK
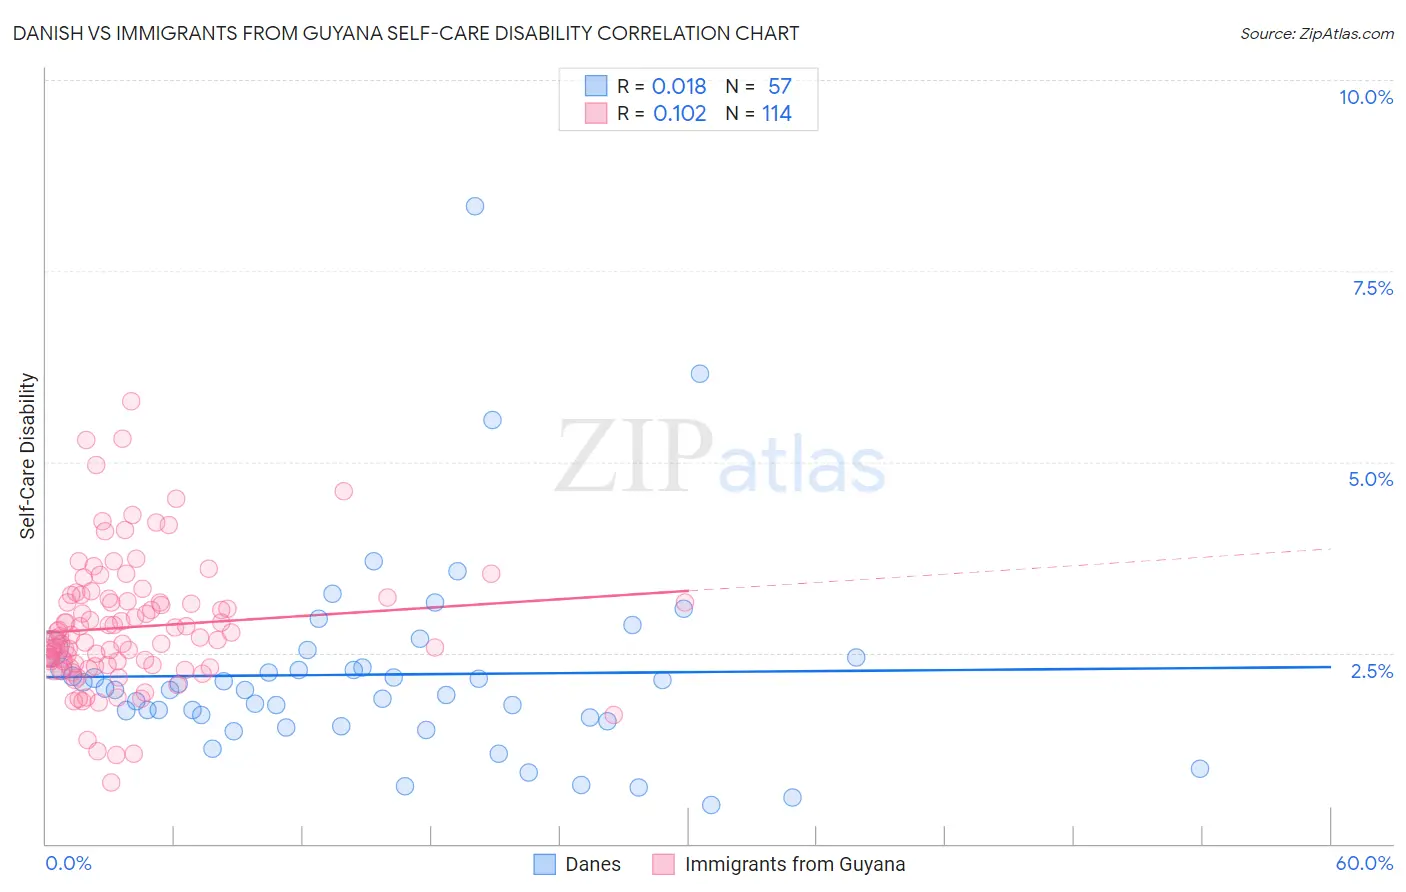
Danish vs Immigrants from Guyana Self-Care Disability Correlation Chart
The statistical analysis conducted on geographies consisting of 473,117,294 people shows no correlation between the proportion of Danes and percentage of population with self-care disability in the United States with a correlation coefficient (R) of 0.018 and weighted average of 2.3%. Similarly, the statistical analysis conducted on geographies consisting of 183,590,282 people shows a poor positive correlation between the proportion of Immigrants from Guyana and percentage of population with self-care disability in the United States with a correlation coefficient (R) of 0.102 and weighted average of 2.8%, a difference of 22.5%.
Self-Care Disability Correlation Summary
| Measurement | Danish | Immigrants from Guyana |
| Minimum | 0.50% | 0.80% |
| Maximum | 8.3% | 5.8% |
| Range | 7.8% | 5.0% |
| Mean | 2.2% | 2.8% |
| Median | 2.0% | 2.7% |
| Interquartile 25% (IQ1) | 1.6% | 2.3% |
| Interquartile 75% (IQ3) | 2.4% | 3.2% |
| Interquartile Range (IQR) | 0.75% | 0.83% |
| Standard Deviation (Sample) | 1.3% | 0.85% |
| Standard Deviation (Population) | 1.3% | 0.84% |
Similar Demographics by Self-Care Disability
Demographics Similar to Danes by Self-Care Disability
In terms of self-care disability, the demographic groups most similar to Danes are Paraguayan (2.3%, a difference of 0.010%), Burmese (2.3%, a difference of 0.070%), Immigrants from Korea (2.3%, a difference of 0.30%), Immigrants from Zimbabwe (2.3%, a difference of 0.34%), and Immigrants from Turkey (2.3%, a difference of 0.35%).
| Demographics | Rating | Rank | Self-Care Disability |
| Cypriots | 100.0 /100 | #24 | Exceptional 2.2% |
| Turks | 100.0 /100 | #25 | Exceptional 2.2% |
| Immigrants | Sri Lanka | 99.9 /100 | #26 | Exceptional 2.2% |
| Venezuelans | 99.9 /100 | #27 | Exceptional 2.2% |
| Inupiat | 99.9 /100 | #28 | Exceptional 2.2% |
| Immigrants | Zimbabwe | 99.9 /100 | #29 | Exceptional 2.3% |
| Paraguayans | 99.9 /100 | #30 | Exceptional 2.3% |
| Danes | 99.9 /100 | #31 | Exceptional 2.3% |
| Burmese | 99.9 /100 | #32 | Exceptional 2.3% |
| Immigrants | Korea | 99.9 /100 | #33 | Exceptional 2.3% |
| Immigrants | Turkey | 99.9 /100 | #34 | Exceptional 2.3% |
| Immigrants | Australia | 99.9 /100 | #35 | Exceptional 2.3% |
| Immigrants | Lithuania | 99.9 /100 | #36 | Exceptional 2.3% |
| Immigrants | Sweden | 99.9 /100 | #37 | Exceptional 2.3% |
| Immigrants | Eastern Africa | 99.9 /100 | #38 | Exceptional 2.3% |
Demographics Similar to Immigrants from Guyana by Self-Care Disability
In terms of self-care disability, the demographic groups most similar to Immigrants from Guyana are American (2.8%, a difference of 0.090%), West Indian (2.8%, a difference of 0.21%), Immigrants from Portugal (2.8%, a difference of 0.29%), Immigrants from Fiji (2.8%, a difference of 0.47%), and Pima (2.8%, a difference of 0.56%).
| Demographics | Rating | Rank | Self-Care Disability |
| Central American Indians | 0.0 /100 | #292 | Tragic 2.7% |
| Belizeans | 0.0 /100 | #293 | Tragic 2.7% |
| Blackfeet | 0.0 /100 | #294 | Tragic 2.7% |
| Barbadians | 0.0 /100 | #295 | Tragic 2.7% |
| Immigrants | Portugal | 0.0 /100 | #296 | Tragic 2.8% |
| West Indians | 0.0 /100 | #297 | Tragic 2.8% |
| Americans | 0.0 /100 | #298 | Tragic 2.8% |
| Immigrants | Guyana | 0.0 /100 | #299 | Tragic 2.8% |
| Immigrants | Fiji | 0.0 /100 | #300 | Tragic 2.8% |
| Pima | 0.0 /100 | #301 | Tragic 2.8% |
| Immigrants | St. Vincent and the Grenadines | 0.0 /100 | #302 | Tragic 2.8% |
| Immigrants | Belize | 0.0 /100 | #303 | Tragic 2.8% |
| Cree | 0.0 /100 | #304 | Tragic 2.8% |
| Immigrants | West Indies | 0.0 /100 | #305 | Tragic 2.8% |
| Aleuts | 0.0 /100 | #306 | Tragic 2.8% |