Danish vs Korean Self-Care Disability
COMPARE
Danish
Korean
Self-Care Disability
Self-Care Disability Comparison
Danes
Koreans
2.3%
SELF-CARE DISABILITY
99.9/ 100
METRIC RATING
31st/ 347
METRIC RANK
2.5%
SELF-CARE DISABILITY
15.5/ 100
METRIC RATING
196th/ 347
METRIC RANK
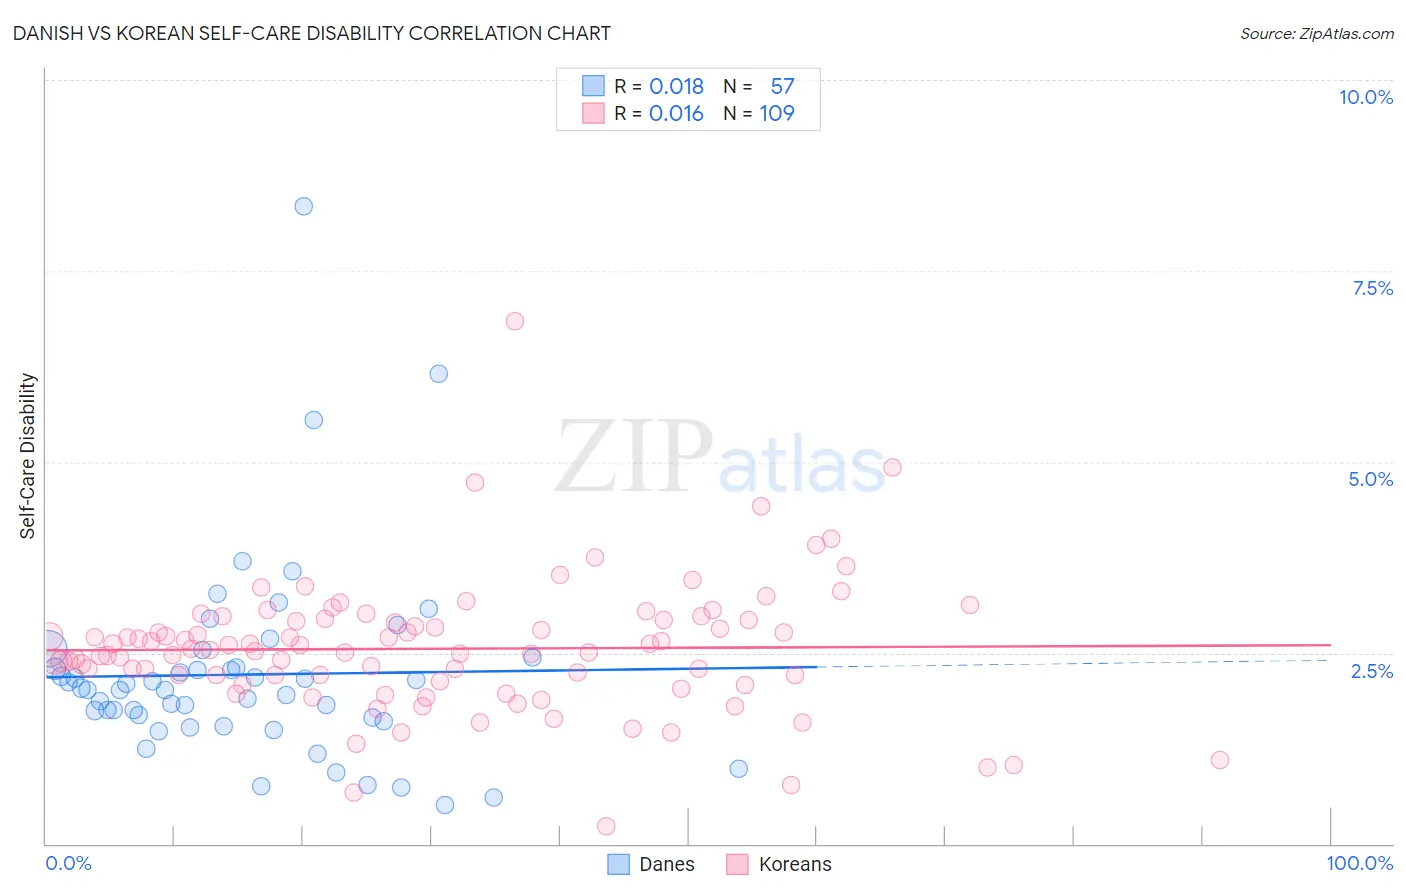
Danish vs Korean Self-Care Disability Correlation Chart
The statistical analysis conducted on geographies consisting of 473,117,294 people shows no correlation between the proportion of Danes and percentage of population with self-care disability in the United States with a correlation coefficient (R) of 0.018 and weighted average of 2.3%. Similarly, the statistical analysis conducted on geographies consisting of 509,747,952 people shows no correlation between the proportion of Koreans and percentage of population with self-care disability in the United States with a correlation coefficient (R) of 0.016 and weighted average of 2.5%, a difference of 11.5%.
Self-Care Disability Correlation Summary
| Measurement | Danish | Korean |
| Minimum | 0.50% | 0.24% |
| Maximum | 8.3% | 6.8% |
| Range | 7.8% | 6.6% |
| Mean | 2.2% | 2.6% |
| Median | 2.0% | 2.5% |
| Interquartile 25% (IQ1) | 1.6% | 2.2% |
| Interquartile 75% (IQ3) | 2.4% | 2.9% |
| Interquartile Range (IQR) | 0.75% | 0.77% |
| Standard Deviation (Sample) | 1.3% | 0.86% |
| Standard Deviation (Population) | 1.3% | 0.86% |
Similar Demographics by Self-Care Disability
Demographics Similar to Danes by Self-Care Disability
In terms of self-care disability, the demographic groups most similar to Danes are Paraguayan (2.3%, a difference of 0.010%), Burmese (2.3%, a difference of 0.070%), Immigrants from Korea (2.3%, a difference of 0.30%), Immigrants from Zimbabwe (2.3%, a difference of 0.34%), and Immigrants from Turkey (2.3%, a difference of 0.35%).
| Demographics | Rating | Rank | Self-Care Disability |
| Cypriots | 100.0 /100 | #24 | Exceptional 2.2% |
| Turks | 100.0 /100 | #25 | Exceptional 2.2% |
| Immigrants | Sri Lanka | 99.9 /100 | #26 | Exceptional 2.2% |
| Venezuelans | 99.9 /100 | #27 | Exceptional 2.2% |
| Inupiat | 99.9 /100 | #28 | Exceptional 2.2% |
| Immigrants | Zimbabwe | 99.9 /100 | #29 | Exceptional 2.3% |
| Paraguayans | 99.9 /100 | #30 | Exceptional 2.3% |
| Danes | 99.9 /100 | #31 | Exceptional 2.3% |
| Burmese | 99.9 /100 | #32 | Exceptional 2.3% |
| Immigrants | Korea | 99.9 /100 | #33 | Exceptional 2.3% |
| Immigrants | Turkey | 99.9 /100 | #34 | Exceptional 2.3% |
| Immigrants | Australia | 99.9 /100 | #35 | Exceptional 2.3% |
| Immigrants | Lithuania | 99.9 /100 | #36 | Exceptional 2.3% |
| Immigrants | Sweden | 99.9 /100 | #37 | Exceptional 2.3% |
| Immigrants | Eastern Africa | 99.9 /100 | #38 | Exceptional 2.3% |
Demographics Similar to Koreans by Self-Care Disability
In terms of self-care disability, the demographic groups most similar to Koreans are Immigrants from Southern Europe (2.5%, a difference of 0.010%), Crow (2.5%, a difference of 0.030%), Immigrants (2.5%, a difference of 0.050%), Immigrants from Ghana (2.5%, a difference of 0.070%), and Immigrants from Germany (2.5%, a difference of 0.20%).
| Demographics | Rating | Rank | Self-Care Disability |
| Immigrants | Eastern Europe | 28.0 /100 | #189 | Fair 2.5% |
| Sioux | 24.6 /100 | #190 | Fair 2.5% |
| Moroccans | 22.9 /100 | #191 | Fair 2.5% |
| Soviet Union | 22.2 /100 | #192 | Fair 2.5% |
| Ukrainians | 21.4 /100 | #193 | Fair 2.5% |
| Immigrants | Germany | 17.9 /100 | #194 | Poor 2.5% |
| Immigrants | Southern Europe | 15.6 /100 | #195 | Poor 2.5% |
| Koreans | 15.5 /100 | #196 | Poor 2.5% |
| Crow | 15.2 /100 | #197 | Poor 2.5% |
| Immigrants | Immigrants | 15.0 /100 | #198 | Poor 2.5% |
| Immigrants | Ghana | 14.7 /100 | #199 | Poor 2.5% |
| Immigrants | Western Africa | 13.3 /100 | #200 | Poor 2.5% |
| Immigrants | South Eastern Asia | 12.9 /100 | #201 | Poor 2.5% |
| Slovaks | 12.6 /100 | #202 | Poor 2.5% |
| Immigrants | Lebanon | 12.4 /100 | #203 | Poor 2.5% |