Zip Codes with the Highest Percentage of Population Employed in Computer & Mathematics in Alaska
RELATED REPORTS & OPTIONS
Computer & Mathematics
Alaska
Compare Zip Codes
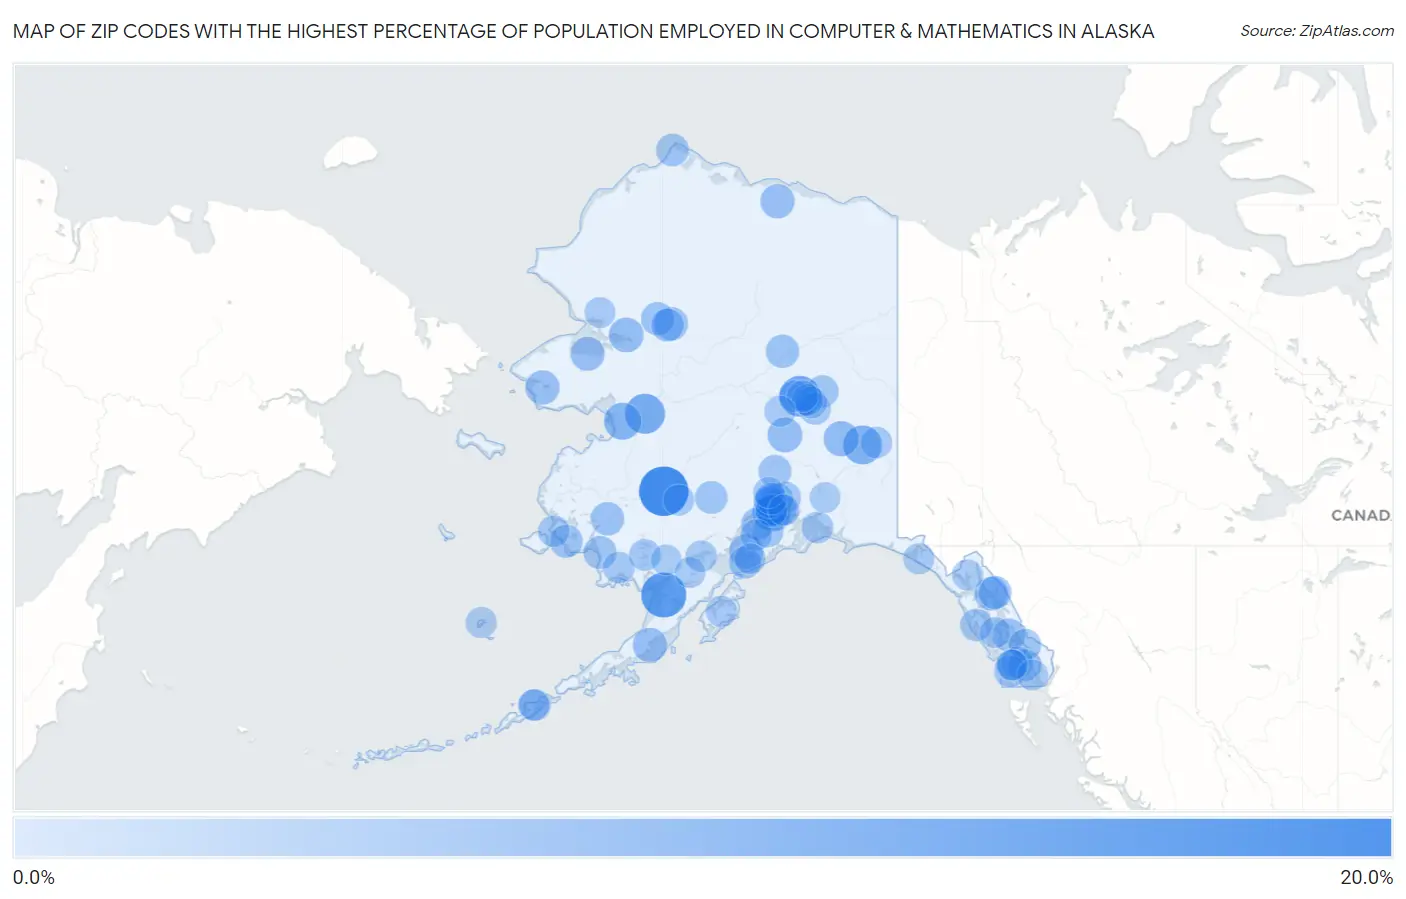
Map of Zip Codes with the Highest Percentage of Population Employed in Computer & Mathematics in Alaska
0.0%
20.0%
Zip Codes with the Highest Percentage of Population Employed in Computer & Mathematics in Alaska
| Zip Code | % Employed | vs State | vs National | |
| 1. | 99656 | 20.0% | 1.9%(+18.1)#1 | 3.5%(+16.5)#132 |
| 2. | 99579 | 15.2% | 1.9%(+13.3)#2 | 3.5%(+11.7)#245 |
| 3. | 99775 | 10.8% | 1.9%(+8.86)#3 | 3.5%(+7.29)#585 |
| 4. | 99748 | 9.9% | 1.9%(+7.96)#4 | 3.5%(+6.39)#721 |
| 5. | 99776 | 8.6% | 1.9%(+6.62)#5 | 3.5%(+5.05)#1,030 |
| 6. | 99684 | 6.8% | 1.9%(+4.85)#6 | 3.5%(+3.28)#1,734 |
| 7. | 99737 | 4.9% | 1.9%(+2.96)#7 | 3.5%(+1.38)#3,489 |
| 8. | 99516 | 4.8% | 1.9%(+2.87)#8 | 3.5%(+1.29)#3,619 |
| 9. | 99755 | 4.4% | 1.9%(+2.46)#9 | 3.5%(+0.885)#4,256 |
| 10. | 99770 | 4.4% | 1.9%(+2.45)#10 | 3.5%(+0.871)#4,278 |
| 11. | 99564 | 4.0% | 1.9%(+2.05)#11 | 3.5%(+0.475)#5,049 |
| 12. | 99519 | 4.0% | 1.9%(+2.02)#12 | 3.5%(+0.439)#5,125 |
| 13. | 99556 | 4.0% | 1.9%(+2.01)#13 | 3.5%(+0.431)#5,140 |
| 14. | 99762 | 3.9% | 1.9%(+1.93)#14 | 3.5%(+0.350)#5,299 |
| 15. | 99736 | 3.8% | 1.9%(+1.83)#15 | 3.5%(+0.249)#5,551 |
| 16. | 99515 | 3.3% | 1.9%(+1.37)#16 | 3.5%(-0.204)#6,718 |
| 17. | 99824 | 3.3% | 1.9%(+1.32)#17 | 3.5%(-0.253)#6,866 |
| 18. | 99751 | 3.2% | 1.9%(+1.28)#18 | 3.5%(-0.299)#7,020 |
| 19. | 99551 | 3.2% | 1.9%(+1.24)#19 | 3.5%(-0.333)#7,121 |
| 20. | 99506 | 3.0% | 1.9%(+1.09)#20 | 3.5%(-0.490)#7,621 |
| 21. | 99701 | 2.9% | 1.9%(+1.00)#21 | 3.5%(-0.576)#7,940 |
| 22. | 99786 | 2.9% | 1.9%(+0.952)#22 | 3.5%(-0.626)#8,110 |
| 23. | 99517 | 2.8% | 1.9%(+0.818)#23 | 3.5%(-0.760)#8,582 |
| 24. | 99801 | 2.8% | 1.9%(+0.805)#24 | 3.5%(-0.773)#8,621 |
| 25. | 99655 | 2.7% | 1.9%(+0.777)#25 | 3.5%(-0.801)#8,730 |
| 26. | 99833 | 2.7% | 1.9%(+0.748)#26 | 3.5%(-0.830)#8,843 |
| 27. | 99507 | 2.7% | 1.9%(+0.709)#27 | 3.5%(-0.868)#9,003 |
| 28. | 99502 | 2.6% | 1.9%(+0.686)#28 | 3.5%(-0.892)#9,094 |
| 29. | 99561 | 2.6% | 1.9%(+0.617)#29 | 3.5%(-0.960)#9,355 |
| 30. | 99518 | 2.5% | 1.9%(+0.590)#30 | 3.5%(-0.987)#9,477 |
| 31. | 99577 | 2.5% | 1.9%(+0.587)#31 | 3.5%(-0.990)#9,490 |
| 32. | 99773 | 2.5% | 1.9%(+0.585)#32 | 3.5%(-0.993)#9,506 |
| 33. | 99676 | 2.4% | 1.9%(+0.447)#33 | 3.5%(-1.13)#10,062 |
| 34. | 99723 | 2.4% | 1.9%(+0.442)#34 | 3.5%(-1.14)#10,080 |
| 35. | 99503 | 2.3% | 1.9%(+0.375)#35 | 3.5%(-1.20)#10,355 |
| 36. | 99611 | 2.2% | 1.9%(+0.285)#36 | 3.5%(-1.29)#10,753 |
| 37. | 99504 | 2.1% | 1.9%(+0.191)#37 | 3.5%(-1.39)#11,179 |
| 38. | 99835 | 2.1% | 1.9%(+0.105)#38 | 3.5%(-1.47)#11,559 |
| 39. | 99652 | 2.0% | 1.9%(+0.028)#39 | 3.5%(-1.55)#11,923 |
| 40. | 99929 | 2.0% | 1.9%(+0.016)#40 | 3.5%(-1.56)#11,973 |
| 41. | 99712 | 1.8% | 1.9%(-0.122)#41 | 3.5%(-1.70)#12,650 |
| 42. | 99572 | 1.8% | 1.9%(-0.192)#42 | 3.5%(-1.77)#12,954 |
| 43. | 99663 | 1.7% | 1.9%(-0.213)#43 | 3.5%(-1.79)#13,071 |
| 44. | 99645 | 1.7% | 1.9%(-0.292)#44 | 3.5%(-1.87)#13,488 |
| 45. | 99709 | 1.6% | 1.9%(-0.391)#45 | 3.5%(-1.97)#14,043 |
| 46. | 99714 | 1.6% | 1.9%(-0.396)#46 | 3.5%(-1.97)#14,080 |
| 47. | 99901 | 1.5% | 1.9%(-0.426)#47 | 3.5%(-2.00)#14,244 |
| 48. | 99919 | 1.5% | 1.9%(-0.432)#48 | 3.5%(-2.01)#14,274 |
| 49. | 99654 | 1.5% | 1.9%(-0.454)#49 | 3.5%(-2.03)#14,413 |
| 50. | 99922 | 1.5% | 1.9%(-0.465)#50 | 3.5%(-2.04)#14,491 |
| 51. | 99508 | 1.5% | 1.9%(-0.496)#51 | 3.5%(-2.07)#14,658 |
| 52. | 99623 | 1.4% | 1.9%(-0.528)#52 | 3.5%(-2.11)#14,838 |
| 53. | 99685 | 1.4% | 1.9%(-0.596)#53 | 3.5%(-2.17)#15,229 |
| 54. | 99576 | 1.3% | 1.9%(-0.616)#54 | 3.5%(-2.19)#15,340 |
| 55. | 99501 | 1.3% | 1.9%(-0.673)#55 | 3.5%(-2.25)#15,685 |
| 56. | 99780 | 1.3% | 1.9%(-0.683)#56 | 3.5%(-2.26)#15,756 |
| 57. | 99702 | 1.3% | 1.9%(-0.697)#57 | 3.5%(-2.27)#15,822 |
| 58. | 99574 | 1.2% | 1.9%(-0.720)#58 | 3.5%(-2.30)#15,978 |
| 59. | 99678 | 1.2% | 1.9%(-0.742)#59 | 3.5%(-2.32)#16,108 |
| 60. | 99694 | 1.2% | 1.9%(-0.758)#60 | 3.5%(-2.34)#16,196 |
| 61. | 99705 | 1.2% | 1.9%(-0.767)#61 | 3.5%(-2.35)#16,243 |
| 62. | 99669 | 1.1% | 1.9%(-0.810)#62 | 3.5%(-2.39)#16,497 |
| 63. | 99703 | 1.1% | 1.9%(-0.811)#63 | 3.5%(-2.39)#16,507 |
| 64. | 99637 | 1.1% | 1.9%(-0.827)#64 | 3.5%(-2.41)#16,625 |
| 65. | 99606 | 1.1% | 1.9%(-0.894)#65 | 3.5%(-2.47)#17,066 |
| 66. | 99925 | 0.89% | 1.9%(-1.06)#66 | 3.5%(-2.64)#18,123 |
| 67. | 99692 | 0.85% | 1.9%(-1.10)#67 | 3.5%(-2.67)#18,328 |
| 68. | 99688 | 0.84% | 1.9%(-1.11)#68 | 3.5%(-2.69)#18,418 |
| 69. | 99557 | 0.82% | 1.9%(-1.12)#69 | 3.5%(-2.70)#18,495 |
| 70. | 99760 | 0.80% | 1.9%(-1.14)#70 | 3.5%(-2.72)#18,623 |
| 71. | 99567 | 0.80% | 1.9%(-1.15)#71 | 3.5%(-2.73)#18,646 |
| 72. | 99660 | 0.75% | 1.9%(-1.19)#72 | 3.5%(-2.77)#18,935 |
| 73. | 99926 | 0.65% | 1.9%(-1.30)#73 | 3.5%(-2.88)#19,563 |
| 74. | 99615 | 0.62% | 1.9%(-1.32)#74 | 3.5%(-2.90)#19,724 |
| 75. | 99689 | 0.62% | 1.9%(-1.33)#75 | 3.5%(-2.90)#19,743 |
| 76. | 99827 | 0.60% | 1.9%(-1.35)#76 | 3.5%(-2.92)#19,870 |
| 77. | 99830 | 0.54% | 1.9%(-1.40)#77 | 3.5%(-2.98)#20,219 |
| 78. | 99603 | 0.53% | 1.9%(-1.41)#78 | 3.5%(-2.99)#20,284 |
| 79. | 99752 | 0.50% | 1.9%(-1.45)#79 | 3.5%(-3.02)#20,490 |
| 80. | 99636 | 0.42% | 1.9%(-1.52)#80 | 3.5%(-3.10)#20,932 |
| 81. | 99613 | 0.41% | 1.9%(-1.53)#81 | 3.5%(-3.11)#20,987 |
| 82. | 99921 | 0.41% | 1.9%(-1.54)#82 | 3.5%(-3.11)#21,000 |
| 83. | 99573 | 0.28% | 1.9%(-1.66)#83 | 3.5%(-3.24)#21,695 |
Common Questions
What are the Top 10 Zip Codes with the Highest Percentage of Population Employed in Computer & Mathematics in Alaska?
Top 10 Zip Codes with the Highest Percentage of Population Employed in Computer & Mathematics in Alaska are:
What zip code has the Highest Percentage of Population Employed in Computer & Mathematics in Alaska?
99656 has the Highest Percentage of Population Employed in Computer & Mathematics in Alaska with 20.0%.
What is the Percentage of Population Employed in Computer & Mathematics in the State of Alaska?
Percentage of Population Employed in Computer & Mathematics in Alaska is 1.9%.
What is the Percentage of Population Employed in Computer & Mathematics in the United States?
Percentage of Population Employed in Computer & Mathematics in the United States is 3.5%.