Zip Codes with the Highest Percentage of Population Employed in Computer & Mathematics in New Jersey
RELATED REPORTS & OPTIONS
Computer & Mathematics
New Jersey
Compare Zip Codes
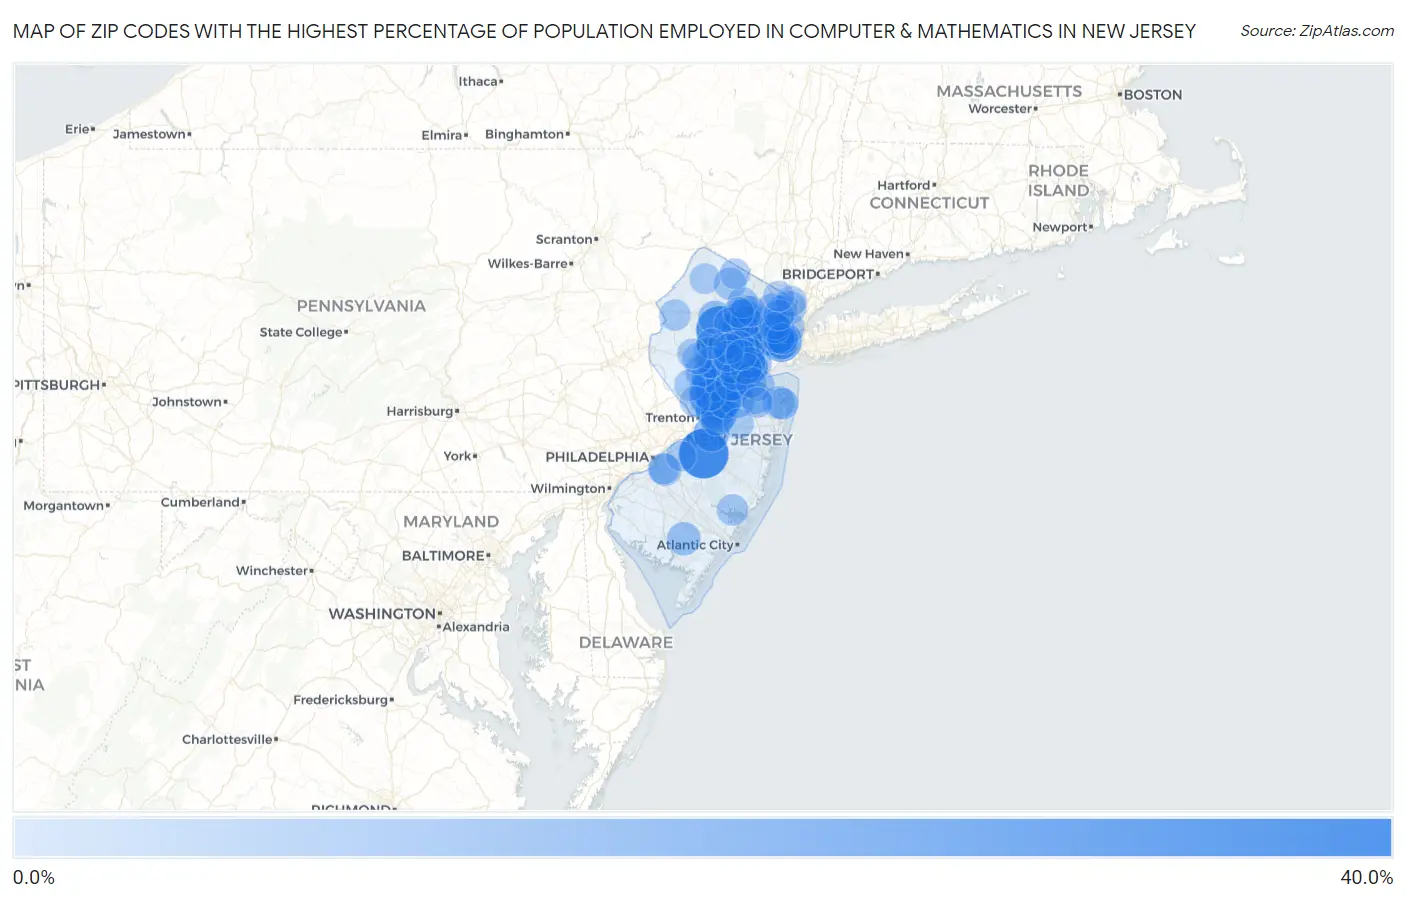
Map of Zip Codes with the Highest Percentage of Population Employed in Computer & Mathematics in New Jersey
0.0%
40.0%
Zip Codes with the Highest Percentage of Population Employed in Computer & Mathematics in New Jersey
| Zip Code | % Employed | vs State | vs National | |
| 1. | 08011 | 34.4% | 4.5%(+29.8)#1 | 3.5%(+30.9)#34 |
| 2. | 07970 | 31.5% | 4.5%(+27.0)#2 | 3.5%(+28.0)#42 |
| 3. | 08536 | 23.8% | 4.5%(+19.3)#3 | 3.5%(+20.3)#87 |
| 4. | 08820 | 22.4% | 4.5%(+17.8)#4 | 3.5%(+18.8)#102 |
| 5. | 07310 | 22.2% | 4.5%(+17.7)#5 | 3.5%(+18.7)#106 |
| 6. | 08542 | 20.5% | 4.5%(+16.0)#6 | 3.5%(+17.0)#123 |
| 7. | 08550 | 19.1% | 4.5%(+14.6)#7 | 3.5%(+15.6)#149 |
| 8. | 08502 | 16.8% | 4.5%(+12.2)#8 | 3.5%(+13.2)#194 |
| 9. | 07094 | 15.6% | 4.5%(+11.1)#9 | 3.5%(+12.1)#227 |
| 10. | 08561 | 15.4% | 4.5%(+10.9)#10 | 3.5%(+11.9)#235 |
| 11. | 07034 | 15.4% | 4.5%(+10.8)#11 | 3.5%(+11.8)#239 |
| 12. | 08823 | 14.3% | 4.5%(+9.77)#12 | 3.5%(+10.8)#286 |
| 13. | 08515 | 14.0% | 4.5%(+9.50)#13 | 3.5%(+10.5)#310 |
| 14. | 08830 | 13.3% | 4.5%(+8.81)#14 | 3.5%(+9.81)#339 |
| 15. | 07306 | 13.1% | 4.5%(+8.54)#15 | 3.5%(+9.54)#358 |
| 16. | 08817 | 13.0% | 4.5%(+8.47)#16 | 3.5%(+9.47)#364 |
| 17. | 08852 | 12.9% | 4.5%(+8.41)#17 | 3.5%(+9.41)#367 |
| 18. | 07302 | 12.8% | 4.5%(+8.32)#18 | 3.5%(+9.32)#373 |
| 19. | 08824 | 12.6% | 4.5%(+8.03)#19 | 3.5%(+9.03)#395 |
| 20. | 08810 | 12.1% | 4.5%(+7.61)#20 | 3.5%(+8.61)#429 |
| 21. | 07054 | 12.0% | 4.5%(+7.51)#21 | 3.5%(+8.51)#435 |
| 22. | 08558 | 11.5% | 4.5%(+7.01)#22 | 3.5%(+8.01)#488 |
| 23. | 08836 | 11.4% | 4.5%(+6.91)#23 | 3.5%(+7.91)#504 |
| 24. | 08691 | 11.2% | 4.5%(+6.72)#24 | 3.5%(+7.72)#532 |
| 25. | 07029 | 11.1% | 4.5%(+6.57)#25 | 3.5%(+7.57)#552 |
| 26. | 07847 | 11.0% | 4.5%(+6.44)#26 | 3.5%(+7.44)#562 |
| 27. | 07001 | 10.9% | 4.5%(+6.38)#27 | 3.5%(+7.38)#568 |
| 28. | 08837 | 10.9% | 4.5%(+6.33)#28 | 3.5%(+7.33)#579 |
| 29. | 08340 | 10.7% | 4.5%(+6.18)#29 | 3.5%(+7.18)#605 |
| 30. | 07311 | 10.7% | 4.5%(+6.16)#30 | 3.5%(+7.16)#607 |
| 31. | 08831 | 10.5% | 4.5%(+5.99)#31 | 3.5%(+6.99)#629 |
| 32. | 08807 | 10.5% | 4.5%(+5.99)#32 | 3.5%(+6.99)#630 |
| 33. | 07009 | 10.4% | 4.5%(+5.83)#33 | 3.5%(+6.84)#651 |
| 34. | 07751 | 10.3% | 4.5%(+5.82)#34 | 3.5%(+6.82)#653 |
| 35. | 08816 | 10.3% | 4.5%(+5.81)#35 | 3.5%(+6.81)#655 |
| 36. | 07922 | 10.3% | 4.5%(+5.73)#36 | 3.5%(+6.73)#670 |
| 37. | 07041 | 10.1% | 4.5%(+5.59)#37 | 3.5%(+6.59)#691 |
| 38. | 07627 | 10.0% | 4.5%(+5.49)#38 | 3.5%(+6.49)#709 |
| 39. | 07410 | 9.9% | 4.5%(+5.34)#39 | 3.5%(+6.34)#729 |
| 40. | 07045 | 9.8% | 4.5%(+5.31)#40 | 3.5%(+6.31)#736 |
| 41. | 07702 | 9.6% | 4.5%(+5.10)#41 | 3.5%(+6.10)#766 |
| 42. | 07039 | 9.3% | 4.5%(+4.82)#42 | 3.5%(+5.82)#827 |
| 43. | 07092 | 9.3% | 4.5%(+4.81)#43 | 3.5%(+5.81)#829 |
| 44. | 08873 | 9.2% | 4.5%(+4.68)#44 | 3.5%(+5.68)#850 |
| 45. | 07981 | 9.2% | 4.5%(+4.64)#45 | 3.5%(+5.64)#863 |
| 46. | 07927 | 9.2% | 4.5%(+4.63)#46 | 3.5%(+5.63)#867 |
| 47. | 08512 | 9.1% | 4.5%(+4.62)#47 | 3.5%(+5.62)#869 |
| 48. | 07078 | 9.1% | 4.5%(+4.60)#48 | 3.5%(+5.60)#874 |
| 49. | 07460 | 9.0% | 4.5%(+4.43)#49 | 3.5%(+5.43)#911 |
| 50. | 07020 | 8.8% | 4.5%(+4.30)#50 | 3.5%(+5.30)#947 |
| 51. | 07027 | 8.8% | 4.5%(+4.24)#51 | 3.5%(+5.24)#965 |
| 52. | 08844 | 8.7% | 4.5%(+4.21)#52 | 3.5%(+5.21)#972 |
| 53. | 08007 | 8.7% | 4.5%(+4.18)#53 | 3.5%(+5.18)#985 |
| 54. | 07950 | 8.5% | 4.5%(+3.94)#54 | 3.5%(+4.94)#1,060 |
| 55. | 07721 | 8.5% | 4.5%(+3.94)#55 | 3.5%(+4.94)#1,062 |
| 56. | 07307 | 8.4% | 4.5%(+3.91)#56 | 3.5%(+4.91)#1,071 |
| 57. | 07920 | 8.4% | 4.5%(+3.86)#57 | 3.5%(+4.86)#1,086 |
| 58. | 07933 | 8.4% | 4.5%(+3.84)#58 | 3.5%(+4.84)#1,090 |
| 59. | 08540 | 8.3% | 4.5%(+3.80)#59 | 3.5%(+4.80)#1,109 |
| 60. | 07661 | 8.3% | 4.5%(+3.78)#60 | 3.5%(+4.78)#1,117 |
| 61. | 08902 | 8.3% | 4.5%(+3.77)#61 | 3.5%(+4.77)#1,118 |
| 62. | 08853 | 8.2% | 4.5%(+3.68)#62 | 3.5%(+4.68)#1,148 |
| 63. | 07757 | 8.2% | 4.5%(+3.66)#63 | 3.5%(+4.66)#1,152 |
| 64. | 08854 | 8.0% | 4.5%(+3.50)#64 | 3.5%(+4.50)#1,196 |
| 65. | 07082 | 7.9% | 4.5%(+3.34)#65 | 3.5%(+4.34)#1,250 |
| 66. | 07075 | 7.9% | 4.5%(+3.34)#66 | 3.5%(+4.34)#1,253 |
| 67. | 07921 | 7.8% | 4.5%(+3.31)#67 | 3.5%(+4.31)#1,269 |
| 68. | 08551 | 7.8% | 4.5%(+3.30)#68 | 3.5%(+4.30)#1,270 |
| 69. | 07073 | 7.8% | 4.5%(+3.28)#69 | 3.5%(+4.28)#1,283 |
| 70. | 07095 | 7.8% | 4.5%(+3.26)#70 | 3.5%(+4.26)#1,290 |
| 71. | 07844 | 7.8% | 4.5%(+3.25)#71 | 3.5%(+4.25)#1,295 |
| 72. | 08224 | 7.8% | 4.5%(+3.24)#72 | 3.5%(+4.24)#1,298 |
| 73. | 08035 | 7.7% | 4.5%(+3.19)#73 | 3.5%(+4.19)#1,313 |
| 74. | 08876 | 7.7% | 4.5%(+3.15)#74 | 3.5%(+4.15)#1,326 |
| 75. | 07058 | 7.6% | 4.5%(+3.05)#75 | 3.5%(+4.05)#1,358 |
| 76. | 07974 | 7.6% | 4.5%(+3.04)#76 | 3.5%(+4.05)#1,359 |
| 77. | 07030 | 7.5% | 4.5%(+2.95)#77 | 3.5%(+3.95)#1,397 |
| 78. | 08812 | 7.4% | 4.5%(+2.89)#78 | 3.5%(+3.89)#1,421 |
| 79. | 08904 | 7.4% | 4.5%(+2.86)#79 | 3.5%(+3.86)#1,434 |
| 80. | 07067 | 7.3% | 4.5%(+2.80)#80 | 3.5%(+3.80)#1,453 |
| 81. | 08840 | 7.3% | 4.5%(+2.74)#81 | 3.5%(+3.74)#1,484 |
| 82. | 08889 | 7.2% | 4.5%(+2.68)#82 | 3.5%(+3.68)#1,510 |
| 83. | 07059 | 7.0% | 4.5%(+2.51)#83 | 3.5%(+3.51)#1,605 |
| 84. | 07648 | 6.9% | 4.5%(+2.38)#84 | 3.5%(+3.38)#1,678 |
| 85. | 07035 | 6.8% | 4.5%(+2.29)#85 | 3.5%(+3.29)#1,730 |
| 86. | 07607 | 6.8% | 4.5%(+2.29)#86 | 3.5%(+3.29)#1,732 |
| 87. | 07405 | 6.8% | 4.5%(+2.25)#87 | 3.5%(+3.25)#1,750 |
| 88. | 07677 | 6.7% | 4.5%(+2.22)#88 | 3.5%(+3.22)#1,767 |
| 89. | 07980 | 6.7% | 4.5%(+2.16)#89 | 3.5%(+3.16)#1,808 |
| 90. | 08859 | 6.7% | 4.5%(+2.14)#90 | 3.5%(+3.14)#1,825 |
| 91. | 07822 | 6.7% | 4.5%(+2.13)#91 | 3.5%(+3.13)#1,832 |
| 92. | 07005 | 6.5% | 4.5%(+1.99)#92 | 3.5%(+2.99)#1,917 |
| 93. | 08534 | 6.5% | 4.5%(+1.97)#93 | 3.5%(+2.97)#1,929 |
| 94. | 07422 | 6.5% | 4.5%(+1.97)#94 | 3.5%(+2.97)#1,932 |
| 95. | 07023 | 6.5% | 4.5%(+1.96)#95 | 3.5%(+2.96)#1,943 |
| 96. | 07746 | 6.4% | 4.5%(+1.89)#96 | 3.5%(+2.89)#1,995 |
| 97. | 07977 | 6.4% | 4.5%(+1.84)#97 | 3.5%(+2.84)#2,032 |
| 98. | 08510 | 6.3% | 4.5%(+1.79)#98 | 3.5%(+2.79)#2,068 |
| 99. | 08833 | 6.2% | 4.5%(+1.65)#99 | 3.5%(+2.65)#2,165 |
| 100. | 08054 | 6.1% | 4.5%(+1.58)#100 | 3.5%(+2.59)#2,218 |
Common Questions
What are the Top 10 Zip Codes with the Highest Percentage of Population Employed in Computer & Mathematics in New Jersey?
Top 10 Zip Codes with the Highest Percentage of Population Employed in Computer & Mathematics in New Jersey are:
What zip code has the Highest Percentage of Population Employed in Computer & Mathematics in New Jersey?
08011 has the Highest Percentage of Population Employed in Computer & Mathematics in New Jersey with 34.4%.
What is the Percentage of Population Employed in Computer & Mathematics in the State of New Jersey?
Percentage of Population Employed in Computer & Mathematics in New Jersey is 4.5%.
What is the Percentage of Population Employed in Computer & Mathematics in the United States?
Percentage of Population Employed in Computer & Mathematics in the United States is 3.5%.