Zip Codes with the Highest Percentage of Population Employed in Computer & Mathematics in Montana
RELATED REPORTS & OPTIONS
Computer & Mathematics
Montana
Compare Zip Codes
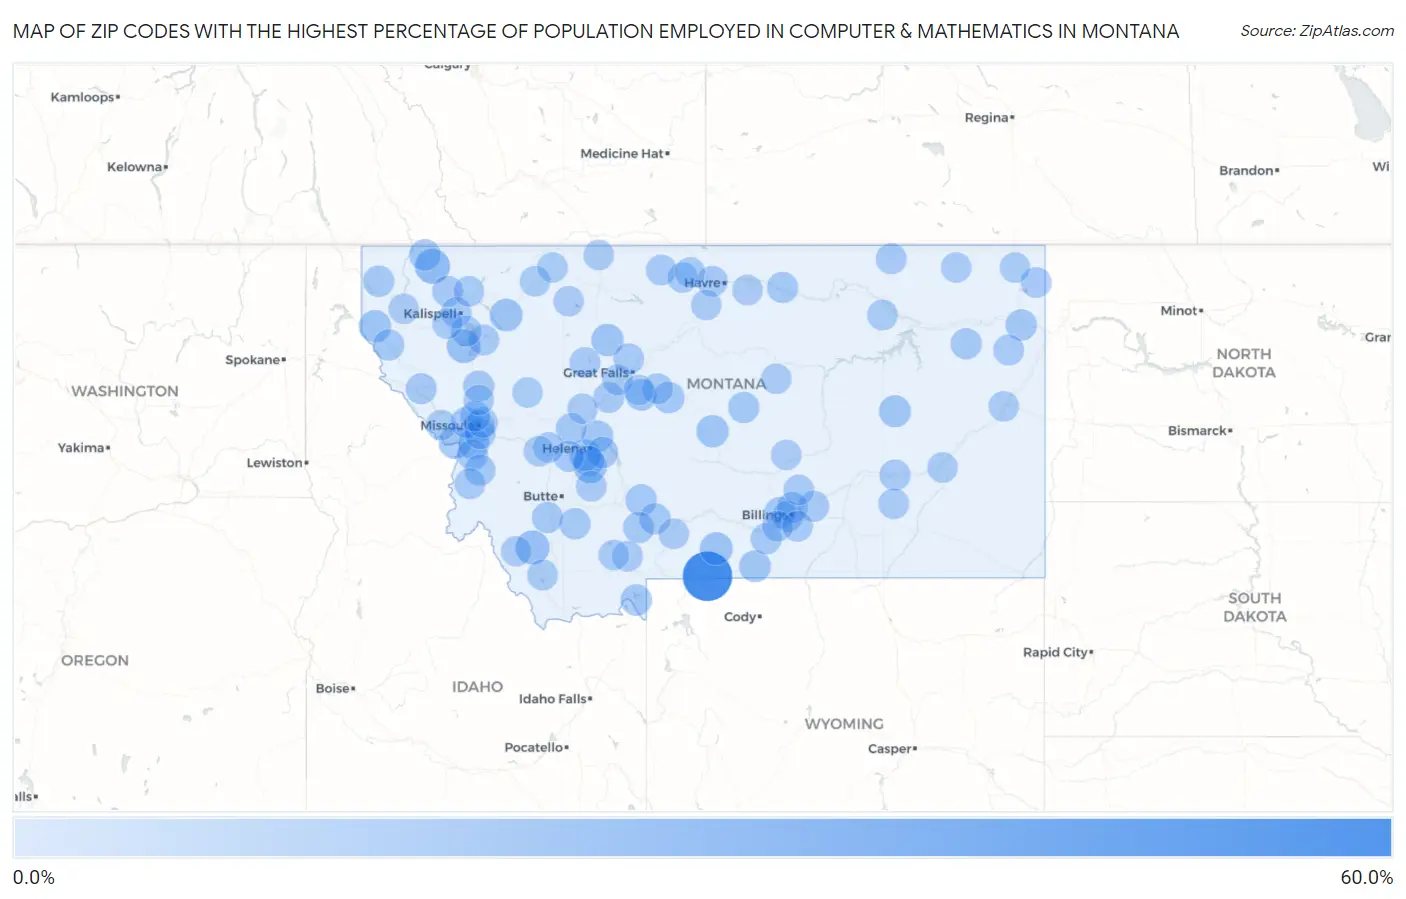
Map of Zip Codes with the Highest Percentage of Population Employed in Computer & Mathematics in Montana
0.0%
60.0%
Zip Codes with the Highest Percentage of Population Employed in Computer & Mathematics in Montana
| Zip Code | % Employed | vs State | vs National | |
| 1. | 59081 | 56.9% | 2.2%(+54.7)#1 | 3.5%(+53.3)#9 |
| 2. | 59918 | 14.1% | 2.2%(+11.9)#2 | 3.5%(+10.6)#300 |
| 3. | 59746 | 11.5% | 2.2%(+9.36)#3 | 3.5%(+8.01)#487 |
| 4. | 59638 | 10.3% | 2.2%(+8.15)#4 | 3.5%(+6.80)#658 |
| 5. | 59910 | 10.3% | 2.2%(+8.11)#5 | 3.5%(+6.76)#662 |
| 6. | 59061 | 7.8% | 2.2%(+5.64)#6 | 3.5%(+4.29)#1,277 |
| 7. | 59936 | 7.6% | 2.2%(+5.45)#7 | 3.5%(+4.10)#1,341 |
| 8. | 59847 | 7.5% | 2.2%(+5.29)#8 | 3.5%(+3.94)#1,399 |
| 9. | 59433 | 7.0% | 2.2%(+4.80)#9 | 3.5%(+3.45)#1,636 |
| 10. | 59853 | 6.6% | 2.2%(+4.39)#10 | 3.5%(+3.04)#1,880 |
| 11. | 59418 | 6.1% | 2.2%(+3.89)#11 | 3.5%(+2.54)#2,265 |
| 12. | 59322 | 5.6% | 2.2%(+3.38)#12 | 3.5%(+2.03)#2,727 |
| 13. | 59601 | 5.0% | 2.2%(+2.84)#13 | 3.5%(+1.49)#3,337 |
| 14. | 59007 | 5.0% | 2.2%(+2.78)#14 | 3.5%(+1.43)#3,425 |
| 15. | 59602 | 4.5% | 2.2%(+2.29)#15 | 3.5%(+0.942)#4,137 |
| 16. | 59801 | 4.3% | 2.2%(+2.16)#16 | 3.5%(+0.809)#4,371 |
| 17. | 59917 | 4.3% | 2.2%(+2.08)#17 | 3.5%(+0.726)#4,516 |
| 18. | 59469 | 4.1% | 2.2%(+1.93)#18 | 3.5%(+0.585)#4,796 |
| 19. | 59758 | 4.0% | 2.2%(+1.81)#19 | 3.5%(+0.459)#5,083 |
| 20. | 59714 | 4.0% | 2.2%(+1.80)#20 | 3.5%(+0.446)#5,115 |
| 21. | 59480 | 3.9% | 2.2%(+1.77)#21 | 3.5%(+0.423)#5,158 |
| 22. | 59715 | 3.8% | 2.2%(+1.58)#22 | 3.5%(+0.227)#5,591 |
| 23. | 59935 | 3.7% | 2.2%(+1.55)#23 | 3.5%(+0.205)#5,643 |
| 24. | 59218 | 3.7% | 2.2%(+1.49)#24 | 3.5%(+0.136)#5,817 |
| 25. | 59718 | 3.6% | 2.2%(+1.45)#25 | 3.5%(+0.105)#5,893 |
| 26. | 59751 | 3.6% | 2.2%(+1.40)#26 | 3.5%(+0.047)#6,007 |
| 27. | 59833 | 3.5% | 2.2%(+1.35)#27 | 3.5%(+0.003)#6,140 |
| 28. | 59874 | 3.5% | 2.2%(+1.35)#28 | 3.5%(-0.003)#6,154 |
| 29. | 59635 | 3.5% | 2.2%(+1.35)#29 | 3.5%(-0.004)#6,155 |
| 30. | 59865 | 3.4% | 2.2%(+1.22)#30 | 3.5%(-0.129)#6,495 |
| 31. | 59634 | 3.3% | 2.2%(+1.13)#31 | 3.5%(-0.217)#6,750 |
| 32. | 59457 | 3.3% | 2.2%(+1.08)#32 | 3.5%(-0.273)#6,934 |
| 33. | 59727 | 3.2% | 2.2%(+1.07)#33 | 3.5%(-0.278)#6,953 |
| 34. | 59106 | 3.1% | 2.2%(+0.960)#34 | 3.5%(-0.389)#7,309 |
| 35. | 59274 | 3.0% | 2.2%(+0.855)#35 | 3.5%(-0.494)#7,639 |
| 36. | 59041 | 3.0% | 2.2%(+0.823)#36 | 3.5%(-0.526)#7,754 |
| 37. | 59526 | 2.9% | 2.2%(+0.762)#37 | 3.5%(-0.587)#7,973 |
| 38. | 59633 | 2.9% | 2.2%(+0.715)#38 | 3.5%(-0.634)#8,139 |
| 39. | 59866 | 2.8% | 2.2%(+0.626)#39 | 3.5%(-0.723)#8,443 |
| 40. | 59870 | 2.7% | 2.2%(+0.541)#40 | 3.5%(-0.809)#8,763 |
| 41. | 59828 | 2.7% | 2.2%(+0.534)#41 | 3.5%(-0.816)#8,785 |
| 42. | 59421 | 2.7% | 2.2%(+0.512)#42 | 3.5%(-0.838)#8,883 |
| 43. | 59804 | 2.7% | 2.2%(+0.508)#43 | 3.5%(-0.841)#8,906 |
| 44. | 59327 | 2.7% | 2.2%(+0.494)#44 | 3.5%(-0.855)#8,955 |
| 45. | 59102 | 2.6% | 2.2%(+0.458)#45 | 3.5%(-0.892)#9,092 |
| 46. | 59006 | 2.6% | 2.2%(+0.456)#46 | 3.5%(-0.893)#9,102 |
| 47. | 59250 | 2.6% | 2.2%(+0.415)#47 | 3.5%(-0.934)#9,250 |
| 48. | 59105 | 2.6% | 2.2%(+0.401)#48 | 3.5%(-0.949)#9,309 |
| 49. | 59728 | 2.5% | 2.2%(+0.300)#49 | 3.5%(-1.05)#9,745 |
| 50. | 59911 | 2.3% | 2.2%(+0.095)#50 | 3.5%(-1.25)#10,597 |
| 51. | 59937 | 2.3% | 2.2%(+0.094)#51 | 3.5%(-1.25)#10,601 |
| 52. | 59243 | 2.3% | 2.2%(+0.087)#52 | 3.5%(-1.26)#10,633 |
| 53. | 59412 | 2.2% | 2.2%(+0.068)#53 | 3.5%(-1.28)#10,707 |
| 54. | 59044 | 2.2% | 2.2%(+0.019)#54 | 3.5%(-1.33)#10,912 |
| 55. | 59803 | 2.1% | 2.2%(-0.035)#55 | 3.5%(-1.38)#11,167 |
| 56. | 59840 | 2.1% | 2.2%(-0.041)#56 | 3.5%(-1.39)#11,192 |
| 57. | 59101 | 2.1% | 2.2%(-0.060)#57 | 3.5%(-1.41)#11,278 |
| 58. | 59436 | 2.0% | 2.2%(-0.134)#58 | 3.5%(-1.48)#11,606 |
| 59. | 59531 | 1.9% | 2.2%(-0.264)#59 | 3.5%(-1.61)#12,240 |
| 60. | 59716 | 1.9% | 2.2%(-0.276)#60 | 3.5%(-1.63)#12,304 |
| 61. | 59922 | 1.9% | 2.2%(-0.291)#61 | 3.5%(-1.64)#12,379 |
| 62. | 59485 | 1.9% | 2.2%(-0.294)#62 | 3.5%(-1.64)#12,385 |
| 63. | 59404 | 1.8% | 2.2%(-0.331)#63 | 3.5%(-1.68)#12,556 |
| 64. | 59219 | 1.8% | 2.2%(-0.357)#64 | 3.5%(-1.71)#12,673 |
| 65. | 59725 | 1.8% | 2.2%(-0.369)#65 | 3.5%(-1.72)#12,727 |
| 66. | 59731 | 1.8% | 2.2%(-0.390)#66 | 3.5%(-1.74)#12,818 |
| 67. | 59230 | 1.8% | 2.2%(-0.401)#67 | 3.5%(-1.75)#12,866 |
| 68. | 59632 | 1.8% | 2.2%(-0.406)#68 | 3.5%(-1.76)#12,888 |
| 69. | 59901 | 1.8% | 2.2%(-0.413)#69 | 3.5%(-1.76)#12,909 |
| 70. | 59501 | 1.7% | 2.2%(-0.443)#70 | 3.5%(-1.79)#13,074 |
| 71. | 59323 | 1.7% | 2.2%(-0.463)#71 | 3.5%(-1.81)#13,177 |
| 72. | 59079 | 1.7% | 2.2%(-0.506)#72 | 3.5%(-1.85)#13,420 |
| 73. | 59912 | 1.6% | 2.2%(-0.575)#73 | 3.5%(-1.92)#13,801 |
| 74. | 59802 | 1.5% | 2.2%(-0.633)#74 | 3.5%(-1.98)#14,135 |
| 75. | 59808 | 1.5% | 2.2%(-0.667)#75 | 3.5%(-2.02)#14,324 |
| 76. | 59523 | 1.5% | 2.2%(-0.722)#76 | 3.5%(-2.07)#14,653 |
| 77. | 59417 | 1.4% | 2.2%(-0.727)#77 | 3.5%(-2.08)#14,671 |
| 78. | 59736 | 1.4% | 2.2%(-0.747)#78 | 3.5%(-2.10)#14,787 |
| 79. | 59047 | 1.4% | 2.2%(-0.751)#79 | 3.5%(-2.10)#14,811 |
| 80. | 59729 | 1.4% | 2.2%(-0.768)#80 | 3.5%(-2.12)#14,905 |
| 81. | 59254 | 1.4% | 2.2%(-0.773)#81 | 3.5%(-2.12)#14,938 |
| 82. | 59471 | 1.3% | 2.2%(-0.842)#82 | 3.5%(-2.19)#15,334 |
| 83. | 59482 | 1.3% | 2.2%(-0.849)#83 | 3.5%(-2.20)#15,367 |
| 84. | 59486 | 1.3% | 2.2%(-0.891)#84 | 3.5%(-2.24)#15,613 |
| 85. | 59920 | 1.3% | 2.2%(-0.922)#85 | 3.5%(-2.27)#15,803 |
| 86. | 59528 | 1.3% | 2.2%(-0.925)#86 | 3.5%(-2.27)#15,833 |
| 87. | 59427 | 1.2% | 2.2%(-0.930)#87 | 3.5%(-2.28)#15,870 |
| 88. | 59521 | 1.2% | 2.2%(-0.947)#88 | 3.5%(-2.30)#15,971 |
| 89. | 59648 | 1.2% | 2.2%(-0.948)#89 | 3.5%(-2.30)#15,980 |
| 90. | 59405 | 1.2% | 2.2%(-0.966)#90 | 3.5%(-2.32)#16,079 |
| 91. | 59733 | 1.2% | 2.2%(-0.970)#91 | 3.5%(-2.32)#16,111 |
| 92. | 59330 | 1.2% | 2.2%(-0.981)#92 | 3.5%(-2.33)#16,166 |
| 93. | 59263 | 1.2% | 2.2%(-0.997)#93 | 3.5%(-2.35)#16,249 |
| 94. | 59525 | 1.1% | 2.2%(-1.05)#94 | 3.5%(-2.40)#16,599 |
| 95. | 59301 | 1.1% | 2.2%(-1.05)#95 | 3.5%(-2.40)#16,605 |
| 96. | 59072 | 1.1% | 2.2%(-1.07)#96 | 3.5%(-2.42)#16,738 |
| 97. | 59923 | 1.1% | 2.2%(-1.07)#97 | 3.5%(-2.42)#16,747 |
| 98. | 59854 | 1.1% | 2.2%(-1.10)#98 | 3.5%(-2.45)#16,919 |
| 99. | 59820 | 1.0% | 2.2%(-1.15)#99 | 3.5%(-2.50)#17,204 |
| 100. | 59821 | 1.0% | 2.2%(-1.15)#100 | 3.5%(-2.50)#17,213 |
Common Questions
What are the Top 10 Zip Codes with the Highest Percentage of Population Employed in Computer & Mathematics in Montana?
Top 10 Zip Codes with the Highest Percentage of Population Employed in Computer & Mathematics in Montana are:
What zip code has the Highest Percentage of Population Employed in Computer & Mathematics in Montana?
59081 has the Highest Percentage of Population Employed in Computer & Mathematics in Montana with 56.9%.
What is the Percentage of Population Employed in Computer & Mathematics in the State of Montana?
Percentage of Population Employed in Computer & Mathematics in Montana is 2.2%.
What is the Percentage of Population Employed in Computer & Mathematics in the United States?
Percentage of Population Employed in Computer & Mathematics in the United States is 3.5%.