Zip Codes with the Highest Percentage of Population Employed in Computer & Mathematics in Nebraska
RELATED REPORTS & OPTIONS
Computer & Mathematics
Nebraska
Compare Zip Codes
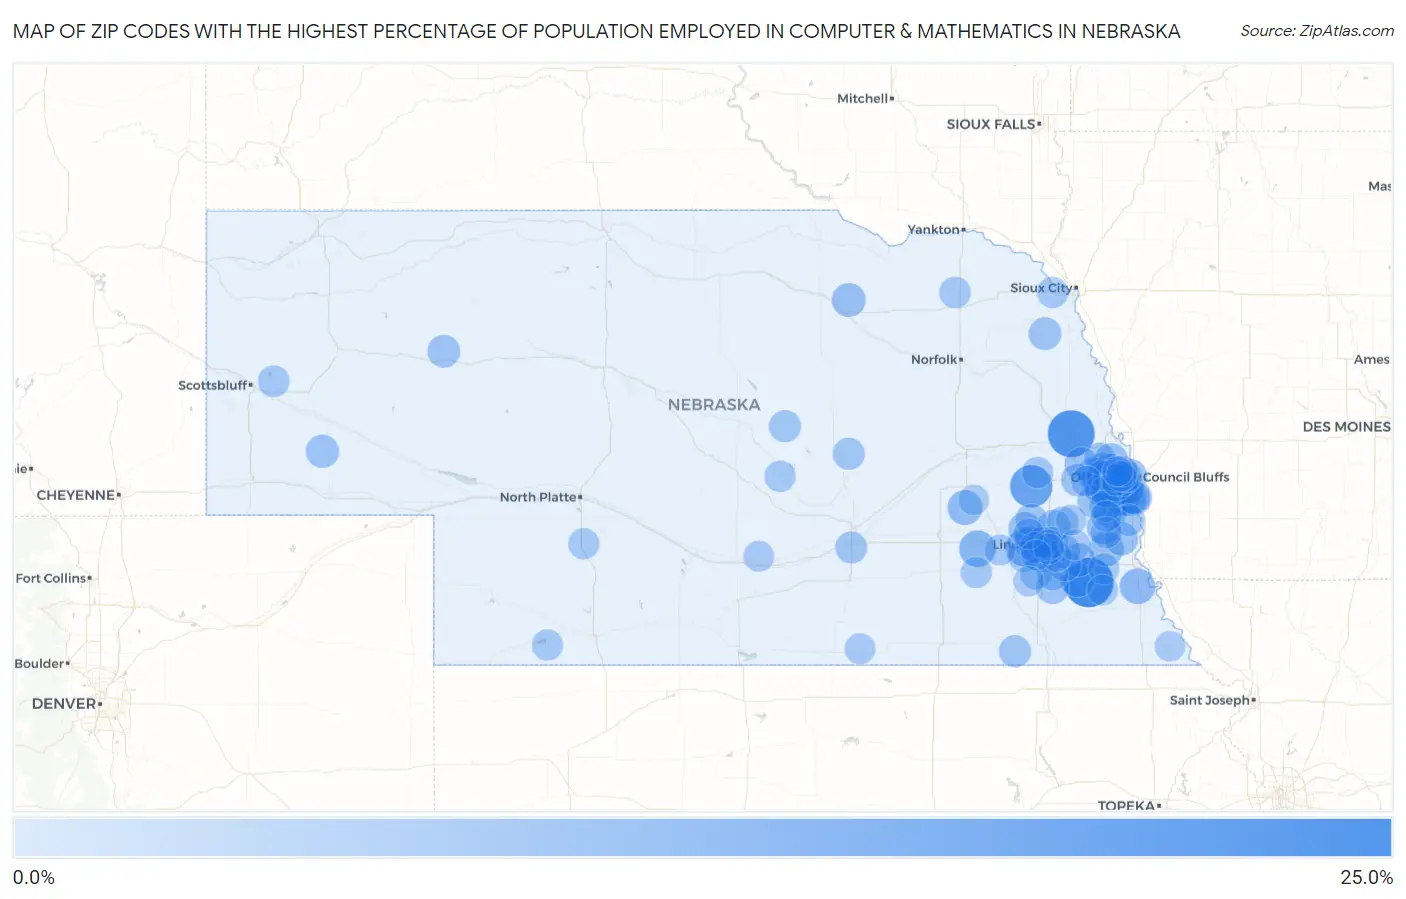
Map of Zip Codes with the Highest Percentage of Population Employed in Computer & Mathematics in Nebraska
0.0%
25.0%
Zip Codes with the Highest Percentage of Population Employed in Computer & Mathematics in Nebraska
| Zip Code | % Employed | vs State | vs National | |
| 1. | 68324 | 21.9% | 3.2%(+18.7)#1 | 3.5%(+18.4)#109 |
| 2. | 68044 | 19.2% | 3.2%(+16.1)#2 | 3.5%(+15.7)#146 |
| 3. | 68070 | 14.7% | 3.2%(+11.5)#3 | 3.5%(+11.2)#269 |
| 4. | 68532 | 10.6% | 3.2%(+7.42)#4 | 3.5%(+7.06)#616 |
| 5. | 68313 | 8.9% | 3.2%(+5.72)#5 | 3.5%(+5.36)#930 |
| 6. | 68133 | 8.4% | 3.2%(+5.24)#6 | 3.5%(+4.88)#1,077 |
| 7. | 68379 | 8.0% | 3.2%(+4.84)#7 | 3.5%(+4.48)#1,206 |
| 8. | 68046 | 7.8% | 3.2%(+4.65)#8 | 3.5%(+4.29)#1,280 |
| 9. | 68367 | 7.3% | 3.2%(+4.09)#9 | 3.5%(+3.73)#1,490 |
| 10. | 68102 | 7.1% | 3.2%(+3.93)#10 | 3.5%(+3.57)#1,576 |
| 11. | 68307 | 7.0% | 3.2%(+3.83)#11 | 3.5%(+3.47)#1,625 |
| 12. | 68116 | 6.7% | 3.2%(+3.50)#12 | 3.5%(+3.14)#1,817 |
| 13. | 68123 | 6.6% | 3.2%(+3.47)#13 | 3.5%(+3.11)#1,839 |
| 14. | 68005 | 6.6% | 3.2%(+3.41)#14 | 3.5%(+3.04)#1,877 |
| 15. | 68344 | 6.6% | 3.2%(+3.39)#15 | 3.5%(+3.03)#1,891 |
| 16. | 68144 | 6.5% | 3.2%(+3.33)#16 | 3.5%(+2.97)#1,934 |
| 17. | 68137 | 6.5% | 3.2%(+3.30)#17 | 3.5%(+2.94)#1,956 |
| 18. | 68403 | 6.4% | 3.2%(+3.26)#18 | 3.5%(+2.90)#1,982 |
| 19. | 68512 | 6.4% | 3.2%(+3.21)#19 | 3.5%(+2.85)#2,022 |
| 20. | 68503 | 6.3% | 3.2%(+3.17)#20 | 3.5%(+2.81)#2,051 |
| 21. | 68130 | 6.2% | 3.2%(+3.07)#21 | 3.5%(+2.71)#2,120 |
| 22. | 68157 | 6.2% | 3.2%(+3.06)#22 | 3.5%(+2.70)#2,132 |
| 23. | 68132 | 6.2% | 3.2%(+3.05)#23 | 3.5%(+2.69)#2,135 |
| 24. | 68766 | 6.2% | 3.2%(+3.04)#24 | 3.5%(+2.68)#2,139 |
| 25. | 68016 | 6.1% | 3.2%(+2.91)#25 | 3.5%(+2.55)#2,249 |
| 26. | 68413 | 6.1% | 3.2%(+2.91)#26 | 3.5%(+2.55)#2,254 |
| 27. | 68135 | 6.0% | 3.2%(+2.79)#27 | 3.5%(+2.43)#2,355 |
| 28. | 68402 | 6.0% | 3.2%(+2.79)#28 | 3.5%(+2.43)#2,360 |
| 29. | 68142 | 5.9% | 3.2%(+2.76)#29 | 3.5%(+2.40)#2,386 |
| 30. | 68418 | 5.8% | 3.2%(+2.67)#30 | 3.5%(+2.31)#2,475 |
| 31. | 68128 | 5.8% | 3.2%(+2.59)#31 | 3.5%(+2.23)#2,534 |
| 32. | 68147 | 5.6% | 3.2%(+2.44)#32 | 3.5%(+2.08)#2,670 |
| 33. | 69131 | 5.6% | 3.2%(+2.44)#33 | 3.5%(+2.08)#2,673 |
| 34. | 68461 | 5.5% | 3.2%(+2.35)#34 | 3.5%(+1.99)#2,763 |
| 35. | 68022 | 5.5% | 3.2%(+2.33)#35 | 3.5%(+1.97)#2,796 |
| 36. | 68064 | 5.4% | 3.2%(+2.28)#36 | 3.5%(+1.92)#2,843 |
| 37. | 68358 | 5.4% | 3.2%(+2.22)#37 | 3.5%(+1.86)#2,907 |
| 38. | 68113 | 5.4% | 3.2%(+2.19)#38 | 3.5%(+1.83)#2,945 |
| 39. | 68528 | 5.4% | 3.2%(+2.19)#39 | 3.5%(+1.83)#2,950 |
| 40. | 68517 | 5.3% | 3.2%(+2.10)#40 | 3.5%(+1.74)#3,061 |
| 41. | 68073 | 5.2% | 3.2%(+2.08)#41 | 3.5%(+1.72)#3,075 |
| 42. | 68164 | 5.2% | 3.2%(+2.07)#42 | 3.5%(+1.71)#3,084 |
| 43. | 68028 | 5.2% | 3.2%(+2.06)#43 | 3.5%(+1.70)#3,097 |
| 44. | 68516 | 5.2% | 3.2%(+2.06)#44 | 3.5%(+1.70)#3,100 |
| 45. | 69333 | 5.1% | 3.2%(+1.98)#45 | 3.5%(+1.62)#3,182 |
| 46. | 68062 | 5.1% | 3.2%(+1.96)#46 | 3.5%(+1.60)#3,199 |
| 47. | 68106 | 5.0% | 3.2%(+1.80)#47 | 3.5%(+1.44)#3,403 |
| 48. | 68136 | 4.9% | 3.2%(+1.73)#48 | 3.5%(+1.37)#3,515 |
| 49. | 68118 | 4.9% | 3.2%(+1.70)#49 | 3.5%(+1.34)#3,552 |
| 50. | 68114 | 4.9% | 3.2%(+1.70)#50 | 3.5%(+1.34)#3,558 |
| 51. | 68154 | 4.8% | 3.2%(+1.66)#51 | 3.5%(+1.30)#3,614 |
| 52. | 68127 | 4.7% | 3.2%(+1.57)#52 | 3.5%(+1.21)#3,727 |
| 53. | 68317 | 4.7% | 3.2%(+1.55)#53 | 3.5%(+1.19)#3,781 |
| 54. | 68131 | 4.7% | 3.2%(+1.50)#54 | 3.5%(+1.14)#3,837 |
| 55. | 68342 | 4.7% | 3.2%(+1.49)#55 | 3.5%(+1.13)#3,865 |
| 56. | 68428 | 4.6% | 3.2%(+1.45)#56 | 3.5%(+1.09)#3,918 |
| 57. | 68007 | 4.6% | 3.2%(+1.42)#57 | 3.5%(+1.06)#3,971 |
| 58. | 68882 | 4.5% | 3.2%(+1.35)#58 | 3.5%(+0.992)#4,054 |
| 59. | 68862 | 4.5% | 3.2%(+1.34)#59 | 3.5%(+0.981)#4,067 |
| 60. | 68048 | 4.4% | 3.2%(+1.26)#60 | 3.5%(+0.904)#4,221 |
| 61. | 68138 | 4.4% | 3.2%(+1.25)#61 | 3.5%(+0.890)#4,245 |
| 62. | 68832 | 4.4% | 3.2%(+1.24)#62 | 3.5%(+0.878)#4,267 |
| 63. | 68059 | 4.3% | 3.2%(+1.15)#63 | 3.5%(+0.793)#4,402 |
| 64. | 68462 | 4.3% | 3.2%(+1.11)#64 | 3.5%(+0.751)#4,473 |
| 65. | 68404 | 4.2% | 3.2%(+1.06)#65 | 3.5%(+0.695)#4,575 |
| 66. | 68339 | 4.2% | 3.2%(+1.01)#66 | 3.5%(+0.649)#4,661 |
| 67. | 69356 | 4.0% | 3.2%(+0.845)#67 | 3.5%(+0.484)#5,018 |
| 68. | 68749 | 4.0% | 3.2%(+0.836)#68 | 3.5%(+0.475)#5,050 |
| 69. | 68463 | 3.9% | 3.2%(+0.783)#69 | 3.5%(+0.423)#5,156 |
| 70. | 68124 | 3.9% | 3.2%(+0.700)#70 | 3.5%(+0.339)#5,327 |
| 71. | 68040 | 3.8% | 3.2%(+0.666)#71 | 3.5%(+0.305)#5,404 |
| 72. | 68505 | 3.8% | 3.2%(+0.634)#72 | 3.5%(+0.274)#5,485 |
| 73. | 68037 | 3.8% | 3.2%(+0.588)#73 | 3.5%(+0.228)#5,590 |
| 74. | 68359 | 3.7% | 3.2%(+0.558)#74 | 3.5%(+0.197)#5,665 |
| 75. | 68853 | 3.7% | 3.2%(+0.540)#75 | 3.5%(+0.179)#5,718 |
| 76. | 68743 | 3.7% | 3.2%(+0.512)#76 | 3.5%(+0.152)#5,787 |
| 77. | 69170 | 3.6% | 3.2%(+0.486)#77 | 3.5%(+0.125)#5,842 |
| 78. | 69044 | 3.6% | 3.2%(+0.480)#78 | 3.5%(+0.119)#5,859 |
| 79. | 68372 | 3.6% | 3.2%(+0.441)#79 | 3.5%(+0.080)#5,948 |
| 80. | 68526 | 3.6% | 3.2%(+0.432)#80 | 3.5%(+0.071)#5,964 |
| 81. | 68446 | 3.6% | 3.2%(+0.422)#81 | 3.5%(+0.061)#5,983 |
| 82. | 68508 | 3.5% | 3.2%(+0.350)#82 | 3.5%(-0.010)#6,173 |
| 83. | 68522 | 3.5% | 3.2%(+0.314)#83 | 3.5%(-0.046)#6,256 |
| 84. | 68329 | 3.4% | 3.2%(+0.265)#84 | 3.5%(-0.096)#6,395 |
| 85. | 68405 | 3.4% | 3.2%(+0.246)#85 | 3.5%(-0.114)#6,459 |
| 86. | 68104 | 3.4% | 3.2%(+0.223)#86 | 3.5%(-0.138)#6,522 |
| 87. | 68942 | 3.4% | 3.2%(+0.201)#87 | 3.5%(-0.159)#6,582 |
| 88. | 68845 | 3.3% | 3.2%(+0.153)#88 | 3.5%(-0.208)#6,726 |
| 89. | 68510 | 3.3% | 3.2%(+0.121)#89 | 3.5%(-0.239)#6,827 |
| 90. | 68347 | 3.3% | 3.2%(+0.103)#90 | 3.5%(-0.258)#6,886 |
| 91. | 68069 | 3.2% | 3.2%(+0.080)#91 | 3.5%(-0.280)#6,964 |
| 92. | 68506 | 3.2% | 3.2%(+0.074)#92 | 3.5%(-0.287)#6,983 |
| 93. | 68524 | 3.2% | 3.2%(+0.027)#93 | 3.5%(-0.333)#7,115 |
| 94. | 68523 | 3.2% | 3.2%(+0.027)#94 | 3.5%(-0.333)#7,118 |
| 95. | 68182 | 3.2% | 3.2%(+0.027)#95 | 3.5%(-0.333)#7,120 |
| 96. | 68366 | 3.1% | 3.2%(-0.107)#96 | 3.5%(-0.468)#7,541 |
| 97. | 68368 | 3.0% | 3.2%(-0.134)#97 | 3.5%(-0.494)#7,638 |
| 98. | 68667 | 3.0% | 3.2%(-0.134)#98 | 3.5%(-0.494)#7,640 |
| 99. | 68355 | 3.0% | 3.2%(-0.198)#99 | 3.5%(-0.558)#7,859 |
| 100. | 68134 | 2.9% | 3.2%(-0.286)#100 | 3.5%(-0.646)#8,177 |
Common Questions
What are the Top 10 Zip Codes with the Highest Percentage of Population Employed in Computer & Mathematics in Nebraska?
Top 10 Zip Codes with the Highest Percentage of Population Employed in Computer & Mathematics in Nebraska are:
What zip code has the Highest Percentage of Population Employed in Computer & Mathematics in Nebraska?
68324 has the Highest Percentage of Population Employed in Computer & Mathematics in Nebraska with 21.9%.
What is the Percentage of Population Employed in Computer & Mathematics in the State of Nebraska?
Percentage of Population Employed in Computer & Mathematics in Nebraska is 3.2%.
What is the Percentage of Population Employed in Computer & Mathematics in the United States?
Percentage of Population Employed in Computer & Mathematics in the United States is 3.5%.