Zip Codes with the Highest Percentage of Population Employed in Computer & Mathematics in Rhode Island

RELATED REPORTS & OPTIONS

Computer & Mathematics
Population
Families and Households
Female Fertility
Female Fertility (Unmarried)
Race (Community Size)
Race (Percentage)
Ancestry (Community Size)
AfghanAfricanAlaska NativeAlaskan AthabascanAlbanianAleutAlsatianAmericanApacheArabArapahoArgentineanArmenianAssyrian / Chaldean / SyriacAustralianAustrianBahamianBangladeshiBarbadianBasqueBelgianBelizeanBermudanBhutaneseBlackfeetBolivianBrazilianBritishBritish West IndianBulgarianBurmeseCajunCambodianCanadianCape VerdeanCarpatho RusynCelticCentral AmericanCentral American IndianCherokeeCheyenneChickasawChileanChineseChippewaChoctawColombianColvilleComancheCosta RicanCreeCreekCroatianCrowCubanCypriotCzechCzechoslovakianDanishDelawareDominicanDutchDutch West IndianEastern EuropeanEcuadorianEgyptianEnglishEstonianEthiopianEuropeanFijianFilipinoFinnishFrenchFrench American IndianFrench CanadianGermanGerman RussianGhanaianGreekGuamanian / ChamorroGuatemalanGuyaneseHaitianHmongHonduranHopiHoumaHungarianIcelanderIndian (Asian)IndonesianInupiatIranianIraqiIrishIroquoisIsraeliItalianJamaicanJapaneseJordanianKenyanKiowaKoreanLaotianLatvianLebaneseLiberianLithuanianLumbeeLuxembourgerMacedonianMalaysianMalteseMarshalleseMenomineeMexicanMexican American IndianMongolianMoroccanNative HawaiianNavajoNepaleseNew ZealanderNicaraguanNigerianNorthern EuropeanNorwegianOkinawanOsageOttawaPaiutePakistaniPalestinianPanamanianParaguayanPennsylvania GermanPeruvianPimaPolishPortuguesePotawatomiPuebloPuerto RicanPuget Sound SalishRomanianRussianSalvadoranSamoanScandinavianScotch-IrishScottishSeminoleSenegaleseSerbianShoshoneSierra LeoneanSiouxSlavicSlovakSloveneSomaliSouth AfricanSouth AmericanSouth American IndianSoviet UnionSpaniardSpanishSpanish AmericanSpanish American IndianSri LankanSubsaharan AfricanSudaneseSwedishSwissSyrianTaiwaneseThaiTlingit-HaidaTohono O'OdhamTonganTrinidadian and TobagonianTsimshianTurkishU.S. Virgin IslanderUgandanUkrainianUruguayanUteVenezuelanVietnameseWelshWest IndianYakamaYaquiYugoslavianYumanYup'ikZimbabwean
Ancestry (Percentage)
AfghanAfricanAlaska NativeAlaskan AthabascanAlbanianAleutAlsatianAmericanApacheArabArapahoArgentineanArmenianAssyrian / Chaldean / SyriacAustralianAustrianBahamianBangladeshiBarbadianBasqueBelgianBelizeanBermudanBhutaneseBlackfeetBolivianBrazilianBritishBritish West IndianBulgarianBurmeseCajunCambodianCanadianCape VerdeanCarpatho RusynCelticCentral AmericanCentral American IndianCherokeeCheyenneChickasawChileanChineseChippewaChoctawColombianColvilleComancheCosta RicanCreeCreekCroatianCrowCubanCypriotCzechCzechoslovakianDanishDelawareDominicanDutchDutch West IndianEastern EuropeanEcuadorianEgyptianEnglishEstonianEthiopianEuropeanFijianFilipinoFinnishFrenchFrench American IndianFrench CanadianGermanGerman RussianGhanaianGreekGuamanian / ChamorroGuatemalanGuyaneseHaitianHmongHonduranHopiHoumaHungarianIcelanderIndian (Asian)IndonesianInupiatIranianIraqiIrishIroquoisIsraeliItalianJamaicanJapaneseJordanianKenyanKiowaKoreanLaotianLatvianLebaneseLiberianLithuanianLumbeeLuxembourgerMacedonianMalaysianMalteseMarshalleseMenomineeMexicanMexican American IndianMongolianMoroccanNative HawaiianNavajoNepaleseNew ZealanderNicaraguanNigerianNorthern EuropeanNorwegianOkinawanOsageOttawaPaiutePakistaniPalestinianPanamanianParaguayanPennsylvania GermanPeruvianPimaPolishPortuguesePotawatomiPuebloPuerto RicanPuget Sound SalishRomanianRussianSalvadoranSamoanScandinavianScotch-IrishScottishSeminoleSenegaleseSerbianShoshoneSierra LeoneanSiouxSlavicSlovakSloveneSomaliSouth AfricanSouth AmericanSouth American IndianSoviet UnionSpaniardSpanishSpanish AmericanSpanish American IndianSri LankanSubsaharan AfricanSudaneseSwedishSwissSyrianTaiwaneseThaiTlingit-HaidaTohono O'OdhamTonganTrinidadian and TobagonianTsimshianTurkishU.S. Virgin IslanderUgandanUkrainianUruguayanUteVenezuelanVietnameseWelshWest IndianYakamaYaquiYugoslavianYumanYup'ikZimbabwean
Immigrant Origin (Total)
AfghanistanAfricaAlbaniaArgentinaArmeniaAsiaAustraliaAustriaAzoresBahamasBangladeshBarbadosBelarusBelgiumBelizeBoliviaBosnia and HerzegovinaBrazilBulgariaBurma / MyanmarCabo VerdeCambodiaCameroonCanadaCaribbeanCentral AmericaChileChinaColombiaCongoCosta RicaCroatiaCubaCzechoslovakiaDenmarkDominicaDominican RepublicEastern AfricaEastern AsiaEastern EuropeEcuadorEgyptEl SalvadorEnglandEritreaEthiopiaEuropeFijiFranceGermanyGhanaGreeceGrenadaGuatemalaGuyanaHaitiHondurasHong KongHungaryIndiaIndonesiaIranIraqIrelandIsraelItalyJamaicaJapanJordanKazakhstanKenyaKoreaKuwaitLaosLatin AmericaLatviaLebanonLiberiaLithuaniaMalaysiaMexicoMicronesiaMiddle AfricaMoldovaMoroccoNepalNetherlandsNicaraguaNigeriaNorth MacedoniaNorthern AfricaNorthern EuropeNorwayOceaniaPakistanPanamaPeruPhilippinesPolandPortugalRomaniaRussiaSaudi ArabiaScotlandSenegalSerbiaSierra LeoneSingaporeSomaliaSouth AfricaSouth AmericaSouth Central AsiaSouth Eastern AsiaSouthern EuropeSpainSri LankaSt. Vincent and the GrenadinesSudanSwedenSwitzerlandSyriaTaiwanThailandTrinidad and TobagoTurkeyUgandaUkraineUruguayUzbekistanVenezuelaVietnamWest IndiesWestern AfricaWestern AsiaWestern EuropeYemenZaireZimbabwe
Immigrant Origin (Percentage)
AfghanistanAfricaAlbaniaArgentinaArmeniaAsiaAustraliaAustriaAzoresBahamasBangladeshBarbadosBelarusBelgiumBelizeBoliviaBosnia and HerzegovinaBrazilBulgariaBurma / MyanmarCabo VerdeCambodiaCameroonCanadaCaribbeanCentral AmericaChileChinaColombiaCongoCosta RicaCroatiaCubaCzechoslovakiaDenmarkDominicaDominican RepublicEastern AfricaEastern AsiaEastern EuropeEcuadorEgyptEl SalvadorEnglandEritreaEthiopiaEuropeFijiFranceGermanyGhanaGreeceGrenadaGuatemalaGuyanaHaitiHondurasHong KongHungaryIndiaIndonesiaIranIraqIrelandIsraelItalyJamaicaJapanJordanKazakhstanKenyaKoreaKuwaitLaosLatin AmericaLatviaLebanonLiberiaLithuaniaMalaysiaMexicoMicronesiaMiddle AfricaMoldovaMoroccoNepalNetherlandsNicaraguaNigeriaNorth MacedoniaNorthern AfricaNorthern EuropeNorwayOceaniaPakistanPanamaPeruPhilippinesPolandPortugalRomaniaRussiaSaudi ArabiaScotlandSenegalSerbiaSierra LeoneSingaporeSomaliaSouth AfricaSouth AmericaSouth Central AsiaSouth Eastern AsiaSouthern EuropeSpainSri LankaSt. Vincent and the GrenadinesSudanSwedenSwitzerlandSyriaTaiwanThailandTrinidad and TobagoTurkeyUgandaUkraineUruguayUzbekistanVenezuelaVietnamWest IndiesWestern AfricaWestern AsiaWestern EuropeYemenZaireZimbabwe
Income
Income (Families)
Income (Households)
Poverty
Poverty (Families)
Unemployment
Employment Occupations
Employment Industries
Employer Class
Commute Time
Commute Means
School Enrollment
Education by Degree Field
Occupancy
Finances
Physical Characteristics
Rhode Island
Compare Zip Codes
Comparison Subject

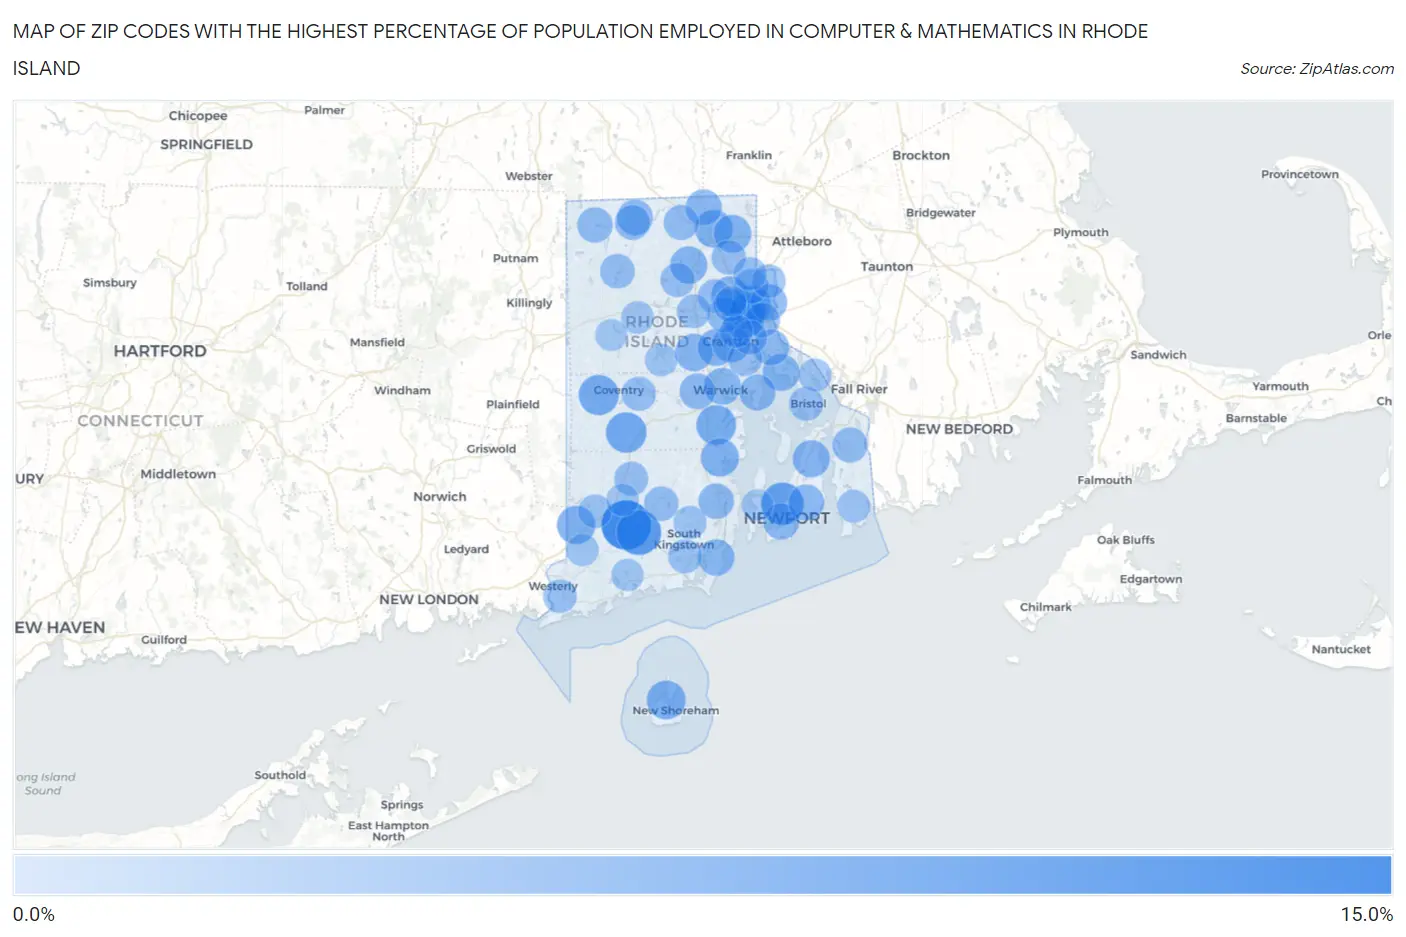
Map of Zip Codes with the Highest Percentage of Population Employed in Computer & Mathematics in Rhode Island

0.0%
15.0%
Zip Codes with the Highest Percentage of Population Employed in Computer & Mathematics in Rhode Island Map

Zip Codes with the Highest Percentage of Population Employed in Computer & Mathematics in Rhode Island

Zip Code % Employed vs State vs National
1.0281211.9%3.2%(+8.66)#13.5%(+8.33)#456
2.028758.9%3.2%(+5.67)#23.5%(+5.34)#939
3.028417.5%3.2%(+4.27)#33.5%(+3.93)#1,404
4.029037.1%3.2%(+3.90)#43.5%(+3.56)#1,578
5.028176.3%3.2%(+3.13)#53.5%(+2.79)#2,067
6.028276.0%3.2%(+2.84)#63.5%(+2.50)#2,296
7.028185.7%3.2%(+2.56)#73.5%(+2.22)#2,542
8.029065.6%3.2%(+2.40)#83.5%(+2.06)#2,696
9.028075.2%3.2%(+1.99)#93.5%(+1.66)#3,151
10.028334.9%3.2%(+1.73)#103.5%(+1.39)#3,476
11.028524.7%3.2%(+1.49)#113.5%(+1.16)#3,815
12.028384.6%3.2%(+1.41)#123.5%(+1.08)#3,944
13.028644.5%3.2%(+1.36)#133.5%(+1.02)#4,017
14.029214.3%3.2%(+1.14)#143.5%(+0.801)#4,384
15.029044.3%3.2%(+1.08)#153.5%(+0.740)#4,489
16.029104.3%3.2%(+1.07)#163.5%(+0.735)#4,496
17.029174.2%3.2%(+1.00)#173.5%(+0.664)#4,629
18.028714.2%3.2%(+0.993)#183.5%(+0.655)#4,646
19.029204.1%3.2%(+0.962)#193.5%(+0.624)#4,709
20.028864.0%3.2%(+0.854)#203.5%(+0.516)#4,940
21.028064.0%3.2%(+0.828)#213.5%(+0.490)#5,006
22.029124.0%3.2%(+0.816)#223.5%(+0.478)#5,031
23.029163.8%3.2%(+0.637)#233.5%(+0.299)#5,413
24.028823.8%3.2%(+0.598)#243.5%(+0.260)#5,525
25.028953.6%3.2%(+0.422)#253.5%(+0.084)#5,943
26.028403.6%3.2%(+0.400)#263.5%(+0.062)#5,981
27.028423.5%3.2%(+0.281)#273.5%(-0.057)#6,285
28.028893.5%3.2%(+0.272)#283.5%(-0.066)#6,315
29.028933.4%3.2%(+0.235)#293.5%(-0.102)#6,418
30.029153.3%3.2%(+0.125)#303.5%(-0.213)#6,741
31.028263.3%3.2%(+0.122)#313.5%(-0.216)#6,748
32.028743.2%3.2%(+0.034)#323.5%(-0.304)#7,032
33.028593.2%3.2%(-0.021)#333.5%(-0.358)#7,204
34.029093.1%3.2%(-0.082)#343.5%(-0.420)#7,395
35.028962.9%3.2%(-0.253)#353.5%(-0.591)#7,987
36.028782.9%3.2%(-0.260)#363.5%(-0.598)#8,010
37.028302.9%3.2%(-0.273)#373.5%(-0.611)#8,055
38.028142.7%3.2%(-0.468)#383.5%(-0.806)#8,752
39.028922.6%3.2%(-0.578)#393.5%(-0.916)#9,175
40.029142.6%3.2%(-0.599)#403.5%(-0.936)#9,256
41.028602.6%3.2%(-0.626)#413.5%(-0.964)#9,373
42.028652.5%3.2%(-0.693)#423.5%(-1.03)#9,669
43.028882.5%3.2%(-0.735)#433.5%(-1.07)#9,831
44.029052.4%3.2%(-0.759)#443.5%(-1.10)#9,934
45.028162.4%3.2%(-0.791)#453.5%(-1.13)#10,055
46.028282.4%3.2%(-0.818)#463.5%(-1.16)#10,159
47.029112.3%3.2%(-0.845)#473.5%(-1.18)#10,264
48.028222.3%3.2%(-0.855)#483.5%(-1.19)#10,306
49.028092.3%3.2%(-0.857)#493.5%(-1.19)#10,317
50.029192.2%3.2%(-1.01)#503.5%(-1.34)#10,982
51.028792.2%3.2%(-1.02)#513.5%(-1.36)#11,041
52.028912.1%3.2%(-1.13)#523.5%(-1.46)#11,520
53.028322.0%3.2%(-1.15)#533.5%(-1.49)#11,656
54.028612.0%3.2%(-1.16)#543.5%(-1.50)#11,687
55.029081.9%3.2%(-1.26)#553.5%(-1.60)#12,153
56.028631.9%3.2%(-1.32)#563.5%(-1.66)#12,475
57.029071.8%3.2%(-1.43)#573.5%(-1.76)#12,915
58.028811.8%3.2%(-1.43)#583.5%(-1.77)#12,959
59.028371.7%3.2%(-1.45)#593.5%(-1.78)#13,032
60.028851.6%3.2%(-1.57)#603.5%(-1.91)#13,721
61.028571.6%3.2%(-1.61)#613.5%(-1.95)#13,964
62.028311.5%3.2%(-1.70)#623.5%(-2.04)#14,456
63.028981.3%3.2%(-1.84)#633.5%(-2.18)#15,268
64.028041.3%3.2%(-1.86)#643.5%(-2.20)#15,380
65.028131.2%3.2%(-1.98)#653.5%(-2.31)#16,066
66.028251.1%3.2%(-2.06)#663.5%(-2.40)#16,606
67.028350.78%3.2%(-2.40)#673.5%(-2.74)#18,734
68.029180.33%3.2%(-2.86)#683.5%(-3.20)#21,473

Common Questions

What are the Top 10 Zip Codes with the Highest Percentage of Population Employed in Computer & Mathematics in Rhode Island?
Top 10 Zip Codes with the Highest Percentage of Population Employed in Computer & Mathematics in Rhode Island are:
#1
11.9%
#2
8.9%
#3
7.5%
#4
7.1%
#5
6.3%
#6
6.0%
#7
5.7%
#8
5.6%
#9
5.2%
#10
4.9%
What zip code has the Highest Percentage of Population Employed in Computer & Mathematics in Rhode Island?
02812 has the Highest Percentage of Population Employed in Computer & Mathematics in Rhode Island with 11.9%.
What is the Percentage of Population Employed in Computer & Mathematics in the State of Rhode Island?
Percentage of Population Employed in Computer & Mathematics in Rhode Island is 3.2%.
What is the Percentage of Population Employed in Computer & Mathematics in the United States?
Percentage of Population Employed in Computer & Mathematics in the United States is 3.5%.