Zip Codes with the Highest Percentage of Population Employed in Computer & Mathematics in New Hampshire
RELATED REPORTS & OPTIONS
Computer & Mathematics
New Hampshire
Compare Zip Codes
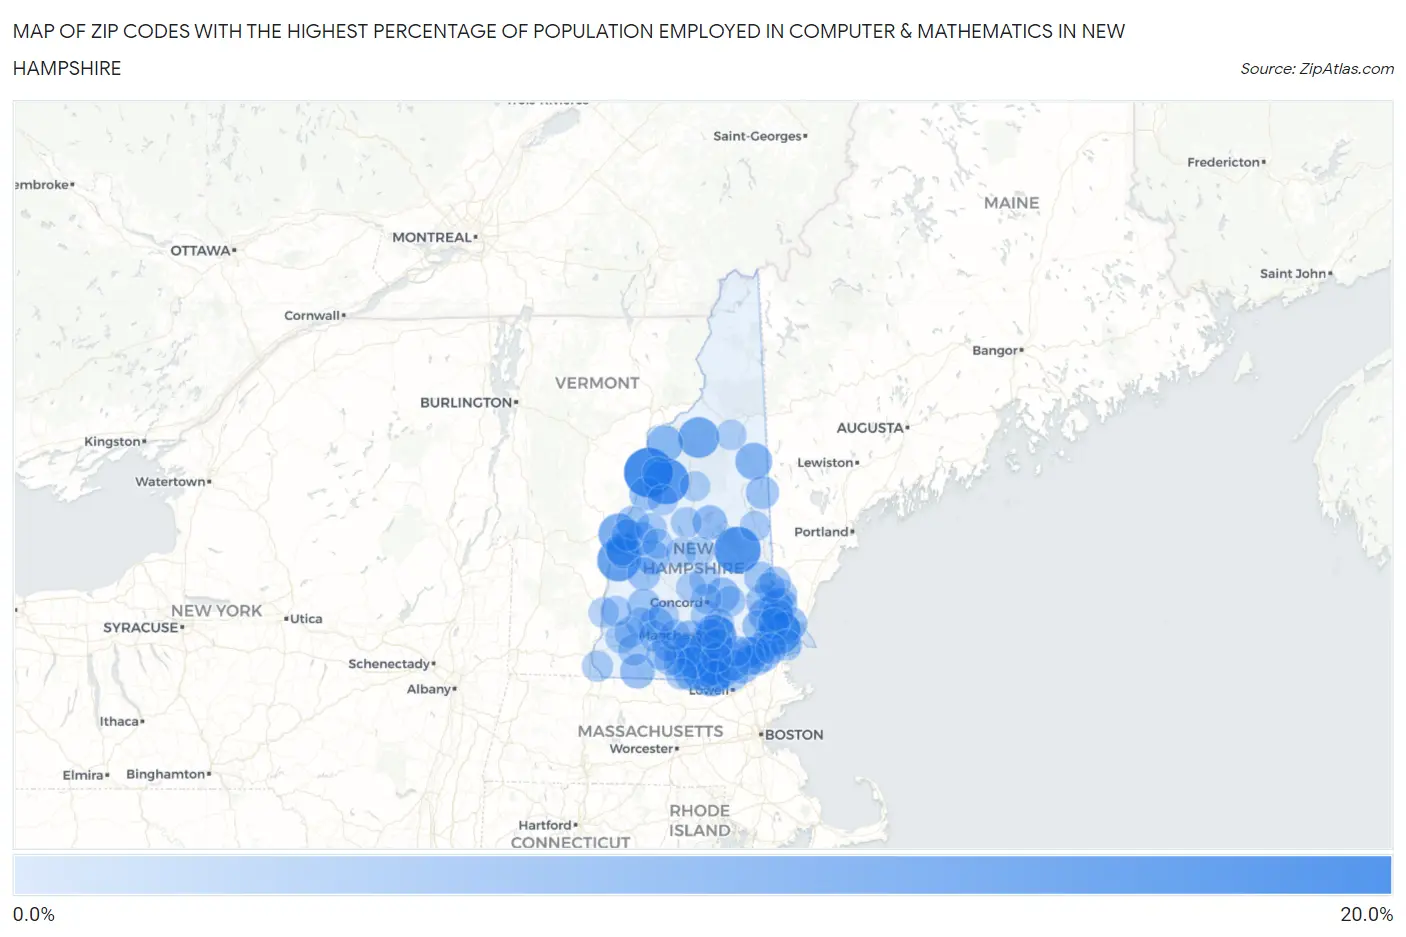
Map of Zip Codes with the Highest Percentage of Population Employed in Computer & Mathematics in New Hampshire
0.0%
20.0%
Zip Codes with the Highest Percentage of Population Employed in Computer & Mathematics in New Hampshire
| Zip Code | % Employed | vs State | vs National | |
| 1. | 03765 | 18.7% | 4.1%(+14.6)#1 | 3.5%(+15.1)#157 |
| 2. | 03810 | 16.0% | 4.1%(+12.0)#2 | 3.5%(+12.5)#216 |
| 3. | 03238 | 15.6% | 4.1%(+11.6)#3 | 3.5%(+12.1)#228 |
| 4. | 03745 | 13.3% | 4.1%(+9.21)#4 | 3.5%(+9.74)#346 |
| 5. | 03101 | 13.2% | 4.1%(+9.14)#5 | 3.5%(+9.67)#350 |
| 6. | 03885 | 12.9% | 4.1%(+8.85)#6 | 3.5%(+9.38)#369 |
| 7. | 03574 | 11.5% | 4.1%(+7.40)#7 | 3.5%(+7.93)#498 |
| 8. | 03784 | 11.3% | 4.1%(+7.20)#8 | 3.5%(+7.74)#529 |
| 9. | 03062 | 10.7% | 4.1%(+6.68)#9 | 3.5%(+7.22)#599 |
| 10. | 03845 | 8.3% | 4.1%(+4.26)#10 | 3.5%(+4.79)#1,112 |
| 11. | 03049 | 8.0% | 4.1%(+3.92)#11 | 3.5%(+4.45)#1,216 |
| 12. | 03585 | 7.8% | 4.1%(+3.79)#12 | 3.5%(+4.32)#1,261 |
| 13. | 03054 | 7.6% | 4.1%(+3.57)#13 | 3.5%(+4.10)#1,343 |
| 14. | 03031 | 7.5% | 4.1%(+3.48)#14 | 3.5%(+4.01)#1,376 |
| 15. | 03861 | 6.7% | 4.1%(+2.62)#15 | 3.5%(+3.15)#1,810 |
| 16. | 03770 | 6.6% | 4.1%(+2.57)#16 | 3.5%(+3.10)#1,843 |
| 17. | 03440 | 6.6% | 4.1%(+2.50)#17 | 3.5%(+3.03)#1,881 |
| 18. | 03053 | 6.5% | 4.1%(+2.46)#18 | 3.5%(+2.99)#1,916 |
| 19. | 03258 | 6.5% | 4.1%(+2.42)#19 | 3.5%(+2.95)#1,946 |
| 20. | 03447 | 6.5% | 4.1%(+2.40)#20 | 3.5%(+2.93)#1,966 |
| 21. | 03070 | 6.4% | 4.1%(+2.38)#21 | 3.5%(+2.91)#1,978 |
| 22. | 03820 | 6.4% | 4.1%(+2.31)#22 | 3.5%(+2.84)#2,029 |
| 23. | 03079 | 6.3% | 4.1%(+2.28)#23 | 3.5%(+2.81)#2,050 |
| 24. | 03226 | 6.3% | 4.1%(+2.27)#24 | 3.5%(+2.80)#2,057 |
| 25. | 03823 | 6.3% | 4.1%(+2.26)#25 | 3.5%(+2.79)#2,064 |
| 26. | 03051 | 6.3% | 4.1%(+2.25)#26 | 3.5%(+2.79)#2,075 |
| 27. | 03284 | 6.3% | 4.1%(+2.25)#27 | 3.5%(+2.78)#2,078 |
| 28. | 03801 | 6.2% | 4.1%(+2.11)#28 | 3.5%(+2.64)#2,170 |
| 29. | 03063 | 6.1% | 4.1%(+2.07)#29 | 3.5%(+2.60)#2,203 |
| 30. | 03833 | 6.0% | 4.1%(+1.98)#30 | 3.5%(+2.51)#2,284 |
| 31. | 03781 | 6.0% | 4.1%(+1.91)#31 | 3.5%(+2.45)#2,336 |
| 32. | 03033 | 6.0% | 4.1%(+1.90)#32 | 3.5%(+2.43)#2,352 |
| 33. | 03110 | 5.9% | 4.1%(+1.86)#33 | 3.5%(+2.39)#2,395 |
| 34. | 03748 | 5.6% | 4.1%(+1.58)#34 | 3.5%(+2.11)#2,648 |
| 35. | 03777 | 5.6% | 4.1%(+1.52)#35 | 3.5%(+2.05)#2,700 |
| 36. | 03840 | 5.5% | 4.1%(+1.47)#36 | 3.5%(+2.00)#2,751 |
| 37. | 03858 | 5.3% | 4.1%(+1.27)#37 | 3.5%(+1.80)#2,972 |
| 38. | 03832 | 5.3% | 4.1%(+1.24)#38 | 3.5%(+1.77)#3,009 |
| 39. | 03825 | 5.3% | 4.1%(+1.21)#39 | 3.5%(+1.74)#3,052 |
| 40. | 03782 | 5.2% | 4.1%(+1.12)#40 | 3.5%(+1.65)#3,155 |
| 41. | 03755 | 5.2% | 4.1%(+1.10)#41 | 3.5%(+1.63)#3,170 |
| 42. | 03280 | 5.1% | 4.1%(+1.05)#42 | 3.5%(+1.58)#3,218 |
| 43. | 03064 | 5.1% | 4.1%(+1.04)#43 | 3.5%(+1.57)#3,236 |
| 44. | 03082 | 5.0% | 4.1%(+0.937)#44 | 3.5%(+1.47)#3,362 |
| 45. | 03042 | 5.0% | 4.1%(+0.916)#45 | 3.5%(+1.45)#3,387 |
| 46. | 03086 | 4.9% | 4.1%(+0.867)#46 | 3.5%(+1.40)#3,464 |
| 47. | 03865 | 4.9% | 4.1%(+0.846)#47 | 3.5%(+1.38)#3,499 |
| 48. | 03848 | 4.9% | 4.1%(+0.818)#48 | 3.5%(+1.35)#3,535 |
| 49. | 03047 | 4.8% | 4.1%(+0.769)#49 | 3.5%(+1.30)#3,608 |
| 50. | 03826 | 4.8% | 4.1%(+0.722)#50 | 3.5%(+1.25)#3,670 |
| 51. | 03057 | 4.7% | 4.1%(+0.662)#51 | 3.5%(+1.19)#3,765 |
| 52. | 03766 | 4.6% | 4.1%(+0.571)#52 | 3.5%(+1.10)#3,900 |
| 53. | 03841 | 4.5% | 4.1%(+0.415)#53 | 3.5%(+0.947)#4,129 |
| 54. | 03878 | 4.4% | 4.1%(+0.300)#54 | 3.5%(+0.832)#4,334 |
| 55. | 03060 | 4.3% | 4.1%(+0.262)#55 | 3.5%(+0.794)#4,397 |
| 56. | 03824 | 4.3% | 4.1%(+0.249)#56 | 3.5%(+0.781)#4,423 |
| 57. | 03076 | 4.2% | 4.1%(+0.190)#57 | 3.5%(+0.722)#4,523 |
| 58. | 03835 | 4.2% | 4.1%(+0.158)#58 | 3.5%(+0.690)#4,582 |
| 59. | 03868 | 4.1% | 4.1%(+0.083)#59 | 3.5%(+0.615)#4,729 |
| 60. | 03857 | 4.1% | 4.1%(+0.044)#60 | 3.5%(+0.576)#4,815 |
| 61. | 03055 | 4.1% | 4.1%(+0.009)#61 | 3.5%(+0.541)#4,894 |
| 62. | 03431 | 4.1% | 4.1%(-0.004)#62 | 3.5%(+0.528)#4,917 |
| 63. | 03455 | 4.1% | 4.1%(-0.005)#63 | 3.5%(+0.527)#4,918 |
| 64. | 03087 | 4.0% | 4.1%(-0.044)#64 | 3.5%(+0.488)#5,009 |
| 65. | 03048 | 4.0% | 4.1%(-0.083)#65 | 3.5%(+0.449)#5,104 |
| 66. | 03842 | 3.9% | 4.1%(-0.206)#66 | 3.5%(+0.326)#5,357 |
| 67. | 03780 | 3.8% | 4.1%(-0.223)#67 | 3.5%(+0.309)#5,395 |
| 68. | 03104 | 3.8% | 4.1%(-0.247)#68 | 3.5%(+0.285)#5,458 |
| 69. | 03741 | 3.8% | 4.1%(-0.282)#69 | 3.5%(+0.250)#5,545 |
| 70. | 03464 | 3.7% | 4.1%(-0.318)#70 | 3.5%(+0.214)#5,624 |
| 71. | 03449 | 3.7% | 4.1%(-0.325)#71 | 3.5%(+0.207)#5,638 |
| 72. | 03084 | 3.6% | 4.1%(-0.415)#72 | 3.5%(+0.117)#5,861 |
| 73. | 03445 | 3.6% | 4.1%(-0.416)#73 | 3.5%(+0.116)#5,866 |
| 74. | 03451 | 3.6% | 4.1%(-0.451)#74 | 3.5%(+0.081)#5,947 |
| 75. | 03224 | 3.6% | 4.1%(-0.488)#75 | 3.5%(+0.044)#6,016 |
| 76. | 03811 | 3.6% | 4.1%(-0.494)#76 | 3.5%(+0.038)#6,033 |
| 77. | 03827 | 3.5% | 4.1%(-0.557)#77 | 3.5%(-0.025)#6,207 |
| 78. | 03264 | 3.5% | 4.1%(-0.573)#78 | 3.5%(-0.041)#6,246 |
| 79. | 03234 | 3.5% | 4.1%(-0.584)#79 | 3.5%(-0.052)#6,273 |
| 80. | 03304 | 3.4% | 4.1%(-0.632)#80 | 3.5%(-0.100)#6,411 |
| 81. | 03038 | 3.4% | 4.1%(-0.680)#81 | 3.5%(-0.148)#6,550 |
| 82. | 03458 | 3.4% | 4.1%(-0.694)#82 | 3.5%(-0.162)#6,590 |
| 83. | 03106 | 3.4% | 4.1%(-0.705)#83 | 3.5%(-0.173)#6,617 |
| 84. | 03043 | 3.3% | 4.1%(-0.709)#84 | 3.5%(-0.177)#6,630 |
| 85. | 03244 | 3.3% | 4.1%(-0.732)#85 | 3.5%(-0.200)#6,705 |
| 86. | 03103 | 3.3% | 4.1%(-0.741)#86 | 3.5%(-0.209)#6,728 |
| 87. | 03602 | 3.3% | 4.1%(-0.765)#87 | 3.5%(-0.233)#6,809 |
| 88. | 03609 | 3.3% | 4.1%(-0.767)#88 | 3.5%(-0.235)#6,815 |
| 89. | 03301 | 3.3% | 4.1%(-0.776)#89 | 3.5%(-0.244)#6,839 |
| 90. | 03052 | 3.3% | 4.1%(-0.796)#90 | 3.5%(-0.264)#6,909 |
| 91. | 03282 | 3.2% | 4.1%(-0.849)#91 | 3.5%(-0.317)#7,071 |
| 92. | 03867 | 3.2% | 4.1%(-0.873)#92 | 3.5%(-0.341)#7,144 |
| 93. | 03864 | 3.2% | 4.1%(-0.900)#93 | 3.5%(-0.368)#7,236 |
| 94. | 03240 | 3.2% | 4.1%(-0.906)#94 | 3.5%(-0.374)#7,259 |
| 95. | 03303 | 3.1% | 4.1%(-0.947)#95 | 3.5%(-0.415)#7,380 |
| 96. | 03102 | 3.1% | 4.1%(-0.964)#96 | 3.5%(-0.432)#7,425 |
| 97. | 03593 | 3.0% | 4.1%(-1.01)#97 | 3.5%(-0.481)#7,586 |
| 98. | 03269 | 3.0% | 4.1%(-1.03)#98 | 3.5%(-0.494)#7,633 |
| 99. | 03285 | 3.0% | 4.1%(-1.07)#99 | 3.5%(-0.542)#7,811 |
| 100. | 03243 | 3.0% | 4.1%(-1.09)#100 | 3.5%(-0.556)#7,849 |
Common Questions
What are the Top 10 Zip Codes with the Highest Percentage of Population Employed in Computer & Mathematics in New Hampshire?
Top 10 Zip Codes with the Highest Percentage of Population Employed in Computer & Mathematics in New Hampshire are:
What zip code has the Highest Percentage of Population Employed in Computer & Mathematics in New Hampshire?
03765 has the Highest Percentage of Population Employed in Computer & Mathematics in New Hampshire with 18.7%.
What is the Percentage of Population Employed in Computer & Mathematics in the State of New Hampshire?
Percentage of Population Employed in Computer & Mathematics in New Hampshire is 4.1%.
What is the Percentage of Population Employed in Computer & Mathematics in the United States?
Percentage of Population Employed in Computer & Mathematics in the United States is 3.5%.