Zip Codes with the Highest Percentage of Population Employed in Computer & Mathematics in Pennsylvania
RELATED REPORTS & OPTIONS
Computer & Mathematics
Pennsylvania
Compare Zip Codes
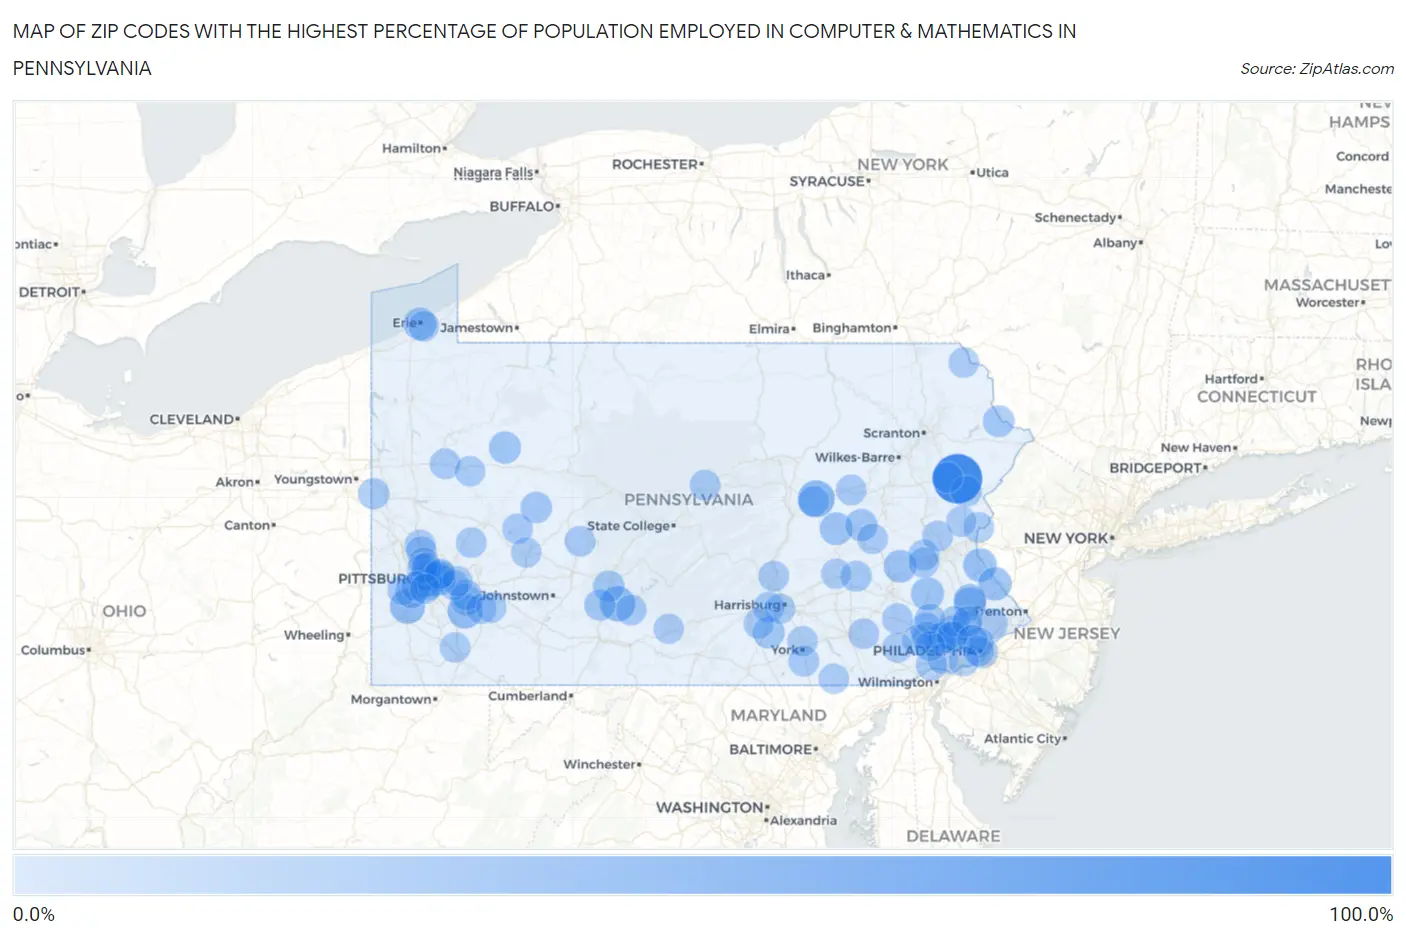
Map of Zip Codes with the Highest Percentage of Population Employed in Computer & Mathematics in Pennsylvania
0.0%
100.0%
Zip Codes with the Highest Percentage of Population Employed in Computer & Mathematics in Pennsylvania
| Zip Code | % Employed | vs State | vs National | |
| 1. | 18349 | 100.0% | 3.3%(+96.7)#1 | 3.5%(+96.5)#1 |
| 2. | 17822 | 37.5% | 3.3%(+34.2)#2 | 3.5%(+34.0)#25 |
| 3. | 16631 | 30.0% | 3.3%(+26.7)#3 | 3.5%(+26.5)#51 |
| 4. | 15363 | 29.1% | 3.3%(+25.8)#4 | 3.5%(+25.6)#55 |
| 5. | 15698 | 27.7% | 3.3%(+24.5)#5 | 3.5%(+24.2)#64 |
| 6. | 18921 | 21.9% | 3.3%(+18.7)#6 | 3.5%(+18.4)#108 |
| 7. | 18933 | 21.1% | 3.3%(+17.9)#7 | 3.5%(+17.6)#114 |
| 8. | 19545 | 19.3% | 3.3%(+16.0)#8 | 3.5%(+15.8)#144 |
| 9. | 17840 | 18.6% | 3.3%(+15.3)#9 | 3.5%(+15.1)#158 |
| 10. | 19564 | 18.5% | 3.3%(+15.2)#10 | 3.5%(+15.0)#163 |
| 11. | 16501 | 18.3% | 3.3%(+15.1)#11 | 3.5%(+14.8)#167 |
| 12. | 18915 | 18.0% | 3.3%(+14.7)#12 | 3.5%(+14.4)#176 |
| 13. | 17934 | 15.7% | 3.3%(+12.5)#13 | 3.5%(+12.2)#225 |
| 14. | 19425 | 15.4% | 3.3%(+12.1)#14 | 3.5%(+11.9)#234 |
| 15. | 16235 | 15.3% | 3.3%(+12.0)#15 | 3.5%(+11.8)#240 |
| 16. | 18932 | 15.2% | 3.3%(+11.9)#16 | 3.5%(+11.6)#247 |
| 17. | 15691 | 14.5% | 3.3%(+11.3)#17 | 3.5%(+11.0)#276 |
| 18. | 17323 | 14.5% | 3.3%(+11.2)#18 | 3.5%(+11.0)#277 |
| 19. | 15031 | 14.1% | 3.3%(+10.8)#19 | 3.5%(+10.5)#302 |
| 20. | 19406 | 13.5% | 3.3%(+10.2)#20 | 3.5%(+9.95)#336 |
| 21. | 18435 | 13.2% | 3.3%(+9.89)#21 | 3.5%(+9.64)#351 |
| 22. | 15744 | 12.9% | 3.3%(+9.63)#22 | 3.5%(+9.38)#368 |
| 23. | 19341 | 12.8% | 3.3%(+9.52)#23 | 3.5%(+9.27)#376 |
| 24. | 15220 | 12.8% | 3.3%(+9.48)#24 | 3.5%(+9.24)#378 |
| 25. | 16665 | 12.1% | 3.3%(+8.79)#25 | 3.5%(+8.54)#432 |
| 26. | 16670 | 11.8% | 3.3%(+8.49)#26 | 3.5%(+8.24)#471 |
| 27. | 18321 | 11.0% | 3.3%(+7.69)#27 | 3.5%(+7.44)#561 |
| 28. | 19355 | 10.9% | 3.3%(+7.63)#28 | 3.5%(+7.38)#567 |
| 29. | 16132 | 10.9% | 3.3%(+7.59)#29 | 3.5%(+7.34)#573 |
| 30. | 15222 | 10.4% | 3.3%(+7.14)#30 | 3.5%(+6.90)#645 |
| 31. | 19106 | 10.4% | 3.3%(+7.13)#31 | 3.5%(+6.88)#649 |
| 32. | 19550 | 10.1% | 3.3%(+6.86)#32 | 3.5%(+6.61)#685 |
| 33. | 17868 | 10.1% | 3.3%(+6.79)#33 | 3.5%(+6.55)#700 |
| 34. | 17050 | 9.9% | 3.3%(+6.60)#34 | 3.5%(+6.36)#727 |
| 35. | 19301 | 9.8% | 3.3%(+6.57)#35 | 3.5%(+6.32)#733 |
| 36. | 19317 | 9.6% | 3.3%(+6.34)#36 | 3.5%(+6.09)#769 |
| 37. | 18051 | 9.6% | 3.3%(+6.29)#37 | 3.5%(+6.04)#781 |
| 38. | 18350 | 9.3% | 3.3%(+6.04)#38 | 3.5%(+5.79)#835 |
| 39. | 17407 | 9.2% | 3.3%(+5.92)#39 | 3.5%(+5.67)#853 |
| 40. | 15086 | 9.2% | 3.3%(+5.90)#40 | 3.5%(+5.65)#860 |
| 41. | 15692 | 9.0% | 3.3%(+5.68)#41 | 3.5%(+5.43)#909 |
| 42. | 18059 | 8.9% | 3.3%(+5.62)#42 | 3.5%(+5.37)#928 |
| 43. | 19333 | 8.9% | 3.3%(+5.60)#43 | 3.5%(+5.35)#932 |
| 44. | 19543 | 8.9% | 3.3%(+5.60)#44 | 3.5%(+5.35)#933 |
| 45. | 19462 | 8.8% | 3.3%(+5.56)#45 | 3.5%(+5.32)#943 |
| 46. | 15090 | 8.8% | 3.3%(+5.53)#46 | 3.5%(+5.28)#951 |
| 47. | 16372 | 8.7% | 3.3%(+5.46)#47 | 3.5%(+5.21)#973 |
| 48. | 17069 | 8.7% | 3.3%(+5.45)#48 | 3.5%(+5.20)#977 |
| 49. | 16675 | 8.7% | 3.3%(+5.42)#49 | 3.5%(+5.17)#993 |
| 50. | 16826 | 8.7% | 3.3%(+5.40)#50 | 3.5%(+5.15)#999 |
| 51. | 15203 | 8.5% | 3.3%(+5.26)#51 | 3.5%(+5.02)#1,039 |
| 52. | 16678 | 8.5% | 3.3%(+5.21)#52 | 3.5%(+4.96)#1,056 |
| 53. | 16250 | 8.4% | 3.3%(+5.13)#53 | 3.5%(+4.89)#1,076 |
| 54. | 18631 | 8.4% | 3.3%(+5.12)#54 | 3.5%(+4.87)#1,080 |
| 55. | 17505 | 8.3% | 3.3%(+5.07)#55 | 3.5%(+4.82)#1,097 |
| 56. | 17930 | 8.3% | 3.3%(+5.06)#56 | 3.5%(+4.81)#1,104 |
| 57. | 19009 | 8.3% | 3.3%(+5.01)#57 | 3.5%(+4.76)#1,120 |
| 58. | 16546 | 8.3% | 3.3%(+5.01)#58 | 3.5%(+4.76)#1,121 |
| 59. | 18031 | 8.2% | 3.3%(+4.95)#59 | 3.5%(+4.70)#1,143 |
| 60. | 19129 | 8.2% | 3.3%(+4.88)#60 | 3.5%(+4.63)#1,162 |
| 61. | 15233 | 8.1% | 3.3%(+4.82)#61 | 3.5%(+4.58)#1,179 |
| 62. | 19335 | 8.1% | 3.3%(+4.81)#62 | 3.5%(+4.56)#1,184 |
| 63. | 19403 | 8.0% | 3.3%(+4.71)#63 | 3.5%(+4.46)#1,212 |
| 64. | 15217 | 8.0% | 3.3%(+4.69)#64 | 3.5%(+4.44)#1,218 |
| 65. | 15208 | 7.9% | 3.3%(+4.58)#65 | 3.5%(+4.33)#1,258 |
| 66. | 15682 | 7.8% | 3.3%(+4.57)#66 | 3.5%(+4.32)#1,263 |
| 67. | 18063 | 7.8% | 3.3%(+4.52)#67 | 3.5%(+4.28)#1,285 |
| 68. | 19103 | 7.7% | 3.3%(+4.46)#68 | 3.5%(+4.21)#1,303 |
| 69. | 18437 | 7.7% | 3.3%(+4.42)#69 | 3.5%(+4.17)#1,322 |
| 70. | 17011 | 7.6% | 3.3%(+4.36)#70 | 3.5%(+4.11)#1,338 |
| 71. | 15232 | 7.5% | 3.3%(+4.24)#71 | 3.5%(+3.99)#1,385 |
| 72. | 15226 | 7.4% | 3.3%(+4.15)#72 | 3.5%(+3.91)#1,414 |
| 73. | 15616 | 7.4% | 3.3%(+4.09)#73 | 3.5%(+3.84)#1,437 |
| 74. | 17321 | 7.3% | 3.3%(+4.00)#74 | 3.5%(+3.75)#1,477 |
| 75. | 16054 | 7.3% | 3.3%(+4.00)#75 | 3.5%(+3.75)#1,478 |
| 76. | 19475 | 7.3% | 3.3%(+3.99)#76 | 3.5%(+3.75)#1,479 |
| 77. | 19342 | 7.3% | 3.3%(+3.99)#77 | 3.5%(+3.74)#1,482 |
| 78. | 15237 | 7.2% | 3.3%(+3.95)#78 | 3.5%(+3.70)#1,496 |
| 79. | 15449 | 7.2% | 3.3%(+3.94)#79 | 3.5%(+3.69)#1,502 |
| 80. | 19369 | 7.2% | 3.3%(+3.92)#80 | 3.5%(+3.68)#1,512 |
| 81. | 15148 | 7.2% | 3.3%(+3.92)#81 | 3.5%(+3.67)#1,514 |
| 82. | 19087 | 7.2% | 3.3%(+3.91)#82 | 3.5%(+3.66)#1,520 |
| 83. | 17318 | 7.1% | 3.3%(+3.87)#83 | 3.5%(+3.62)#1,547 |
| 84. | 15705 | 7.1% | 3.3%(+3.84)#84 | 3.5%(+3.59)#1,562 |
| 85. | 17026 | 7.1% | 3.3%(+3.78)#85 | 3.5%(+3.54)#1,592 |
| 86. | 17007 | 7.1% | 3.3%(+3.78)#86 | 3.5%(+3.53)#1,593 |
| 87. | 19380 | 7.0% | 3.3%(+3.77)#87 | 3.5%(+3.52)#1,596 |
| 88. | 15202 | 7.0% | 3.3%(+3.76)#88 | 3.5%(+3.52)#1,602 |
| 89. | 19422 | 7.0% | 3.3%(+3.74)#89 | 3.5%(+3.49)#1,614 |
| 90. | 15229 | 7.0% | 3.3%(+3.74)#90 | 3.5%(+3.49)#1,618 |
| 91. | 15676 | 7.0% | 3.3%(+3.73)#91 | 3.5%(+3.48)#1,620 |
| 92. | 15057 | 7.0% | 3.3%(+3.70)#92 | 3.5%(+3.45)#1,638 |
| 93. | 18091 | 7.0% | 3.3%(+3.69)#93 | 3.5%(+3.44)#1,643 |
| 94. | 19127 | 7.0% | 3.3%(+3.68)#94 | 3.5%(+3.44)#1,650 |
| 95. | 15142 | 6.9% | 3.3%(+3.66)#95 | 3.5%(+3.41)#1,661 |
| 96. | 15146 | 6.9% | 3.3%(+3.65)#96 | 3.5%(+3.40)#1,665 |
| 97. | 15206 | 6.9% | 3.3%(+3.65)#97 | 3.5%(+3.40)#1,667 |
| 98. | 17215 | 6.9% | 3.3%(+3.62)#98 | 3.5%(+3.37)#1,681 |
| 99. | 15228 | 6.9% | 3.3%(+3.60)#99 | 3.5%(+3.35)#1,689 |
| 100. | 19076 | 6.8% | 3.3%(+3.52)#100 | 3.5%(+3.27)#1,735 |
Common Questions
What are the Top 10 Zip Codes with the Highest Percentage of Population Employed in Computer & Mathematics in Pennsylvania?
Top 10 Zip Codes with the Highest Percentage of Population Employed in Computer & Mathematics in Pennsylvania are:
What zip code has the Highest Percentage of Population Employed in Computer & Mathematics in Pennsylvania?
18349 has the Highest Percentage of Population Employed in Computer & Mathematics in Pennsylvania with 100.0%.
What is the Percentage of Population Employed in Computer & Mathematics in the State of Pennsylvania?
Percentage of Population Employed in Computer & Mathematics in Pennsylvania is 3.3%.
What is the Percentage of Population Employed in Computer & Mathematics in the United States?
Percentage of Population Employed in Computer & Mathematics in the United States is 3.5%.