Zip Codes with the Highest Percentage of Population Employed in Computer & Mathematics in Kansas
RELATED REPORTS & OPTIONS
Computer & Mathematics
Kansas
Compare Zip Codes
Map of Zip Codes with the Highest Percentage of Population Employed in Computer & Mathematics in Kansas
0.0%
20.0%
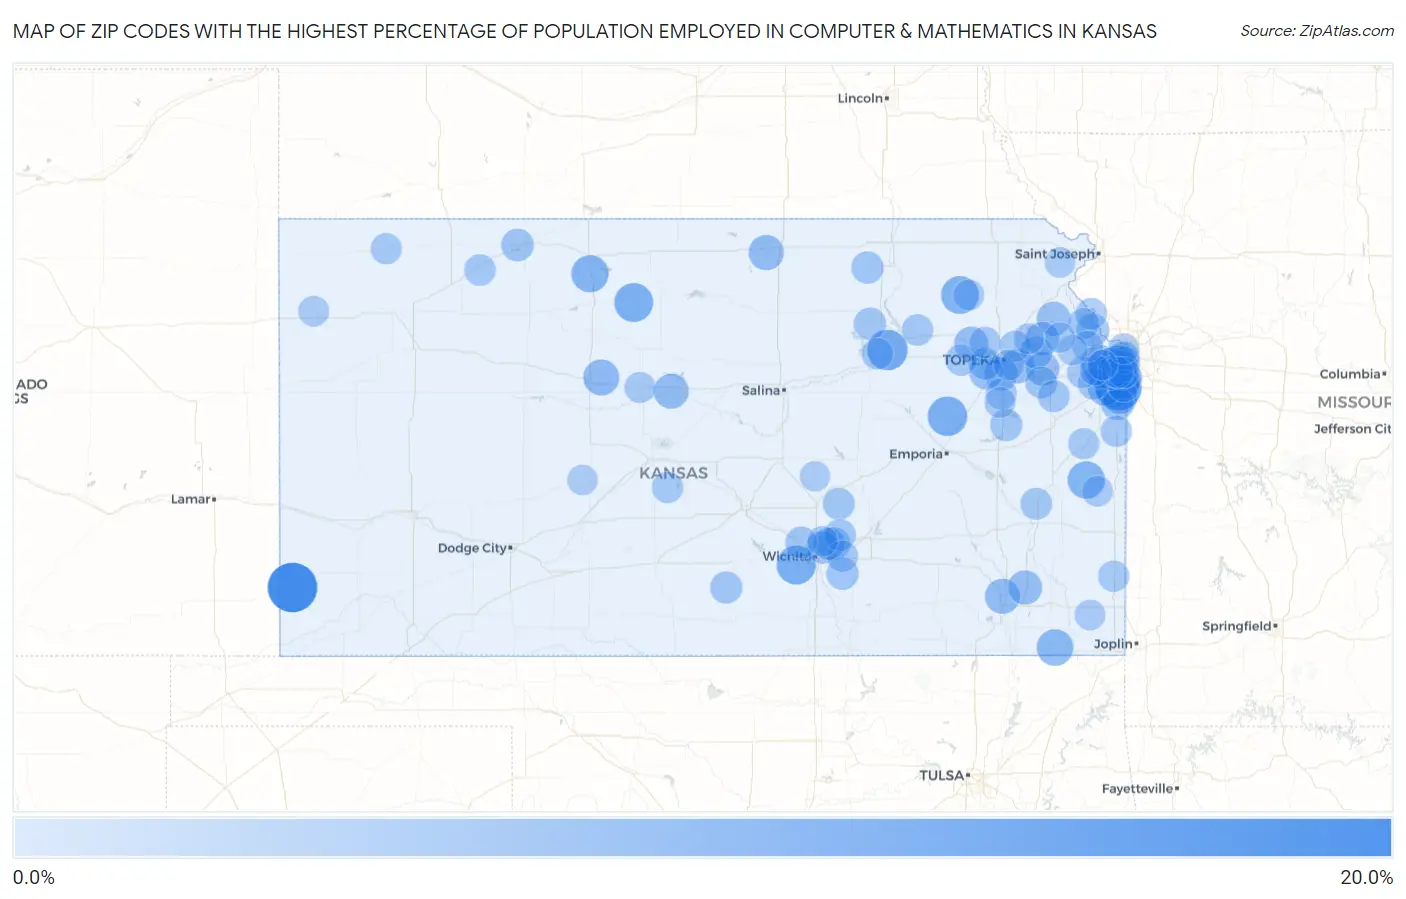
Zip Codes with the Highest Percentage of Population Employed in Computer & Mathematics in Kansas
| Zip Code | % Employed | vs State | vs National | |
| 1. | 67862 | 19.4% | 3.0%(+16.5)#1 | 3.5%(+15.9)#139 |
| 2. | 66223 | 16.0% | 3.0%(+13.0)#2 | 3.5%(+12.5)#217 |
| 3. | 66517 | 11.6% | 3.0%(+8.61)#3 | 3.5%(+8.06)#483 |
| 4. | 66833 | 10.8% | 3.0%(+7.81)#4 | 3.5%(+7.27)#590 |
| 5. | 67227 | 10.6% | 3.0%(+7.60)#5 | 3.5%(+7.05)#619 |
| 6. | 67623 | 10.3% | 3.0%(+7.28)#6 | 3.5%(+6.73)#669 |
| 7. | 66211 | 9.9% | 3.0%(+6.88)#7 | 3.5%(+6.33)#731 |
| 8. | 66432 | 9.5% | 3.0%(+6.48)#8 | 3.5%(+5.93)#808 |
| 9. | 66014 | 9.1% | 3.0%(+6.07)#9 | 3.5%(+5.53)#895 |
| 10. | 67639 | 8.9% | 3.0%(+5.92)#10 | 3.5%(+5.38)#926 |
| 11. | 66221 | 8.7% | 3.0%(+5.76)#11 | 3.5%(+5.21)#971 |
| 12. | 67332 | 8.3% | 3.0%(+5.35)#12 | 3.5%(+4.81)#1,105 |
| 13. | 66213 | 8.1% | 3.0%(+5.13)#13 | 3.5%(+4.58)#1,177 |
| 14. | 67627 | 7.9% | 3.0%(+4.89)#14 | 3.5%(+4.34)#1,252 |
| 15. | 66210 | 7.8% | 3.0%(+4.86)#15 | 3.5%(+4.31)#1,266 |
| 16. | 66209 | 7.8% | 3.0%(+4.81)#16 | 3.5%(+4.27)#1,287 |
| 17. | 66226 | 7.6% | 3.0%(+4.62)#17 | 3.5%(+4.08)#1,350 |
| 18. | 66085 | 7.3% | 3.0%(+4.29)#18 | 3.5%(+3.75)#1,480 |
| 19. | 66966 | 7.2% | 3.0%(+4.24)#19 | 3.5%(+3.70)#1,497 |
| 20. | 66203 | 7.2% | 3.0%(+4.20)#20 | 3.5%(+3.66)#1,526 |
| 21. | 66757 | 7.2% | 3.0%(+4.18)#21 | 3.5%(+3.63)#1,538 |
| 22. | 66219 | 7.0% | 3.0%(+4.05)#22 | 3.5%(+3.51)#1,606 |
| 23. | 67634 | 7.0% | 3.0%(+4.04)#23 | 3.5%(+3.49)#1,617 |
| 24. | 66202 | 6.9% | 3.0%(+3.93)#24 | 3.5%(+3.39)#1,674 |
| 25. | 66204 | 6.7% | 3.0%(+3.69)#25 | 3.5%(+3.15)#1,813 |
| 26. | 66542 | 6.5% | 3.0%(+3.48)#26 | 3.5%(+2.93)#1,968 |
| 27. | 66776 | 6.4% | 3.0%(+3.40)#27 | 3.5%(+2.86)#2,012 |
| 28. | 66533 | 6.3% | 3.0%(+3.36)#28 | 3.5%(+2.81)#2,047 |
| 29. | 66062 | 6.3% | 3.0%(+3.34)#29 | 3.5%(+2.79)#2,065 |
| 30. | 66097 | 6.3% | 3.0%(+3.31)#30 | 3.5%(+2.76)#2,093 |
| 31. | 66049 | 6.1% | 3.0%(+3.14)#31 | 3.5%(+2.59)#2,213 |
| 32. | 66066 | 6.1% | 3.0%(+3.09)#32 | 3.5%(+2.54)#2,259 |
| 33. | 66217 | 6.0% | 3.0%(+2.97)#33 | 3.5%(+2.43)#2,353 |
| 34. | 66619 | 6.0% | 3.0%(+2.97)#34 | 3.5%(+2.43)#2,354 |
| 35. | 66610 | 5.9% | 3.0%(+2.94)#35 | 3.5%(+2.39)#2,391 |
| 36. | 67228 | 5.3% | 3.0%(+2.36)#36 | 3.5%(+1.81)#2,959 |
| 37. | 66043 | 5.2% | 3.0%(+2.24)#37 | 3.5%(+1.70)#3,103 |
| 38. | 66013 | 5.2% | 3.0%(+2.24)#38 | 3.5%(+1.69)#3,104 |
| 39. | 66215 | 5.1% | 3.0%(+2.12)#39 | 3.5%(+1.57)#3,229 |
| 40. | 66073 | 5.1% | 3.0%(+2.10)#40 | 3.5%(+1.56)#3,244 |
| 41. | 67654 | 5.0% | 3.0%(+2.05)#41 | 3.5%(+1.51)#3,325 |
| 42. | 66216 | 5.0% | 3.0%(+1.97)#42 | 3.5%(+1.43)#3,420 |
| 43. | 67220 | 4.9% | 3.0%(+1.96)#43 | 3.5%(+1.41)#3,438 |
| 44. | 66531 | 4.9% | 3.0%(+1.95)#44 | 3.5%(+1.41)#3,446 |
| 45. | 66933 | 4.9% | 3.0%(+1.88)#45 | 3.5%(+1.34)#3,557 |
| 46. | 66205 | 4.9% | 3.0%(+1.88)#46 | 3.5%(+1.33)#3,561 |
| 47. | 66614 | 4.8% | 3.0%(+1.82)#47 | 3.5%(+1.27)#3,651 |
| 48. | 66207 | 4.8% | 3.0%(+1.79)#48 | 3.5%(+1.24)#3,686 |
| 49. | 67133 | 4.7% | 3.0%(+1.76)#49 | 3.5%(+1.21)#3,730 |
| 50. | 66451 | 4.7% | 3.0%(+1.75)#50 | 3.5%(+1.21)#3,746 |
| 51. | 66220 | 4.7% | 3.0%(+1.73)#51 | 3.5%(+1.19)#3,780 |
| 52. | 67142 | 4.7% | 3.0%(+1.73)#52 | 3.5%(+1.18)#3,792 |
| 53. | 67226 | 4.7% | 3.0%(+1.70)#53 | 3.5%(+1.16)#3,819 |
| 54. | 66208 | 4.5% | 3.0%(+1.54)#54 | 3.5%(+0.994)#4,048 |
| 55. | 67041 | 4.5% | 3.0%(+1.50)#55 | 3.5%(+0.953)#4,118 |
| 56. | 67101 | 4.5% | 3.0%(+1.49)#56 | 3.5%(+0.942)#4,139 |
| 57. | 66214 | 4.5% | 3.0%(+1.48)#57 | 3.5%(+0.931)#4,168 |
| 58. | 66103 | 4.4% | 3.0%(+1.42)#58 | 3.5%(+0.872)#4,276 |
| 59. | 66015 | 4.4% | 3.0%(+1.41)#59 | 3.5%(+0.861)#4,288 |
| 60. | 66047 | 4.4% | 3.0%(+1.40)#60 | 3.5%(+0.856)#4,299 |
| 61. | 66006 | 4.4% | 3.0%(+1.40)#61 | 3.5%(+0.855)#4,300 |
| 62. | 67017 | 4.4% | 3.0%(+1.37)#62 | 3.5%(+0.827)#4,339 |
| 63. | 66061 | 4.3% | 3.0%(+1.31)#63 | 3.5%(+0.767)#4,451 |
| 64. | 66224 | 4.3% | 3.0%(+1.28)#64 | 3.5%(+0.738)#4,492 |
| 65. | 67643 | 4.2% | 3.0%(+1.25)#65 | 3.5%(+0.701)#4,565 |
| 66. | 66206 | 4.2% | 3.0%(+1.20)#66 | 3.5%(+0.652)#4,654 |
| 67. | 66212 | 4.1% | 3.0%(+1.17)#67 | 3.5%(+0.624)#4,712 |
| 68. | 66535 | 4.1% | 3.0%(+1.16)#68 | 3.5%(+0.615)#4,727 |
| 69. | 66507 | 4.1% | 3.0%(+1.15)#69 | 3.5%(+0.604)#4,763 |
| 70. | 66027 | 4.1% | 3.0%(+1.13)#70 | 3.5%(+0.587)#4,791 |
| 71. | 66539 | 4.1% | 3.0%(+1.13)#71 | 3.5%(+0.586)#4,793 |
| 72. | 66442 | 4.1% | 3.0%(+1.12)#72 | 3.5%(+0.573)#4,823 |
| 73. | 66053 | 4.1% | 3.0%(+1.07)#73 | 3.5%(+0.528)#4,916 |
| 74. | 67002 | 4.0% | 3.0%(+0.998)#74 | 3.5%(+0.454)#5,094 |
| 75. | 66414 | 4.0% | 3.0%(+0.993)#75 | 3.5%(+0.448)#5,105 |
| 76. | 67545 | 4.0% | 3.0%(+0.980)#76 | 3.5%(+0.436)#5,134 |
| 77. | 66018 | 3.9% | 3.0%(+0.937)#77 | 3.5%(+0.392)#5,220 |
| 78. | 66712 | 3.9% | 3.0%(+0.900)#78 | 3.5%(+0.356)#5,286 |
| 79. | 67730 | 3.9% | 3.0%(+0.899)#79 | 3.5%(+0.355)#5,287 |
| 80. | 66064 | 3.9% | 3.0%(+0.883)#80 | 3.5%(+0.338)#5,330 |
| 81. | 66617 | 3.8% | 3.0%(+0.845)#81 | 3.5%(+0.300)#5,412 |
| 82. | 67665 | 3.8% | 3.0%(+0.837)#82 | 3.5%(+0.293)#5,439 |
| 83. | 66048 | 3.8% | 3.0%(+0.831)#83 | 3.5%(+0.287)#5,454 |
| 84. | 66540 | 3.7% | 3.0%(+0.709)#84 | 3.5%(+0.164)#5,756 |
| 85. | 66227 | 3.7% | 3.0%(+0.682)#85 | 3.5%(+0.137)#5,814 |
| 86. | 66007 | 3.7% | 3.0%(+0.672)#86 | 3.5%(+0.128)#5,831 |
| 87. | 66101 | 3.6% | 3.0%(+0.608)#87 | 3.5%(+0.063)#5,977 |
| 88. | 67735 | 3.6% | 3.0%(+0.586)#88 | 3.5%(+0.042)#6,021 |
| 89. | 66537 | 3.6% | 3.0%(+0.586)#89 | 3.5%(+0.041)#6,024 |
| 90. | 66070 | 3.5% | 3.0%(+0.508)#90 | 3.5%(-0.036)#6,238 |
| 91. | 66056 | 3.5% | 3.0%(+0.483)#91 | 3.5%(-0.061)#6,302 |
| 92. | 66605 | 3.4% | 3.0%(+0.453)#92 | 3.5%(-0.091)#6,391 |
| 93. | 67067 | 3.4% | 3.0%(+0.445)#93 | 3.5%(-0.099)#6,407 |
| 94. | 66782 | 3.4% | 3.0%(+0.410)#94 | 3.5%(-0.135)#6,512 |
| 95. | 66008 | 3.3% | 3.0%(+0.326)#95 | 3.5%(-0.219)#6,758 |
| 96. | 66086 | 3.2% | 3.0%(+0.269)#96 | 3.5%(-0.275)#6,944 |
| 97. | 66054 | 3.2% | 3.0%(+0.261)#97 | 3.5%(-0.283)#6,971 |
| 98. | 66218 | 3.2% | 3.0%(+0.261)#98 | 3.5%(-0.284)#6,972 |
| 99. | 67053 | 3.2% | 3.0%(+0.259)#99 | 3.5%(-0.286)#6,980 |
| 100. | 67574 | 3.2% | 3.0%(+0.246)#100 | 3.5%(-0.299)#7,018 |
Common Questions
What are the Top 10 Zip Codes with the Highest Percentage of Population Employed in Computer & Mathematics in Kansas?
Top 10 Zip Codes with the Highest Percentage of Population Employed in Computer & Mathematics in Kansas are:
What zip code has the Highest Percentage of Population Employed in Computer & Mathematics in Kansas?
67862 has the Highest Percentage of Population Employed in Computer & Mathematics in Kansas with 19.4%.
What is the Percentage of Population Employed in Computer & Mathematics in the State of Kansas?
Percentage of Population Employed in Computer & Mathematics in Kansas is 3.0%.
What is the Percentage of Population Employed in Computer & Mathematics in the United States?
Percentage of Population Employed in Computer & Mathematics in the United States is 3.5%.