Zip Codes with the Highest Percentage of Population Employed in Computer & Mathematics in Puerto Rico
RELATED REPORTS & OPTIONS
Computer & Mathematics
Puerto Rico
Compare Zip Codes
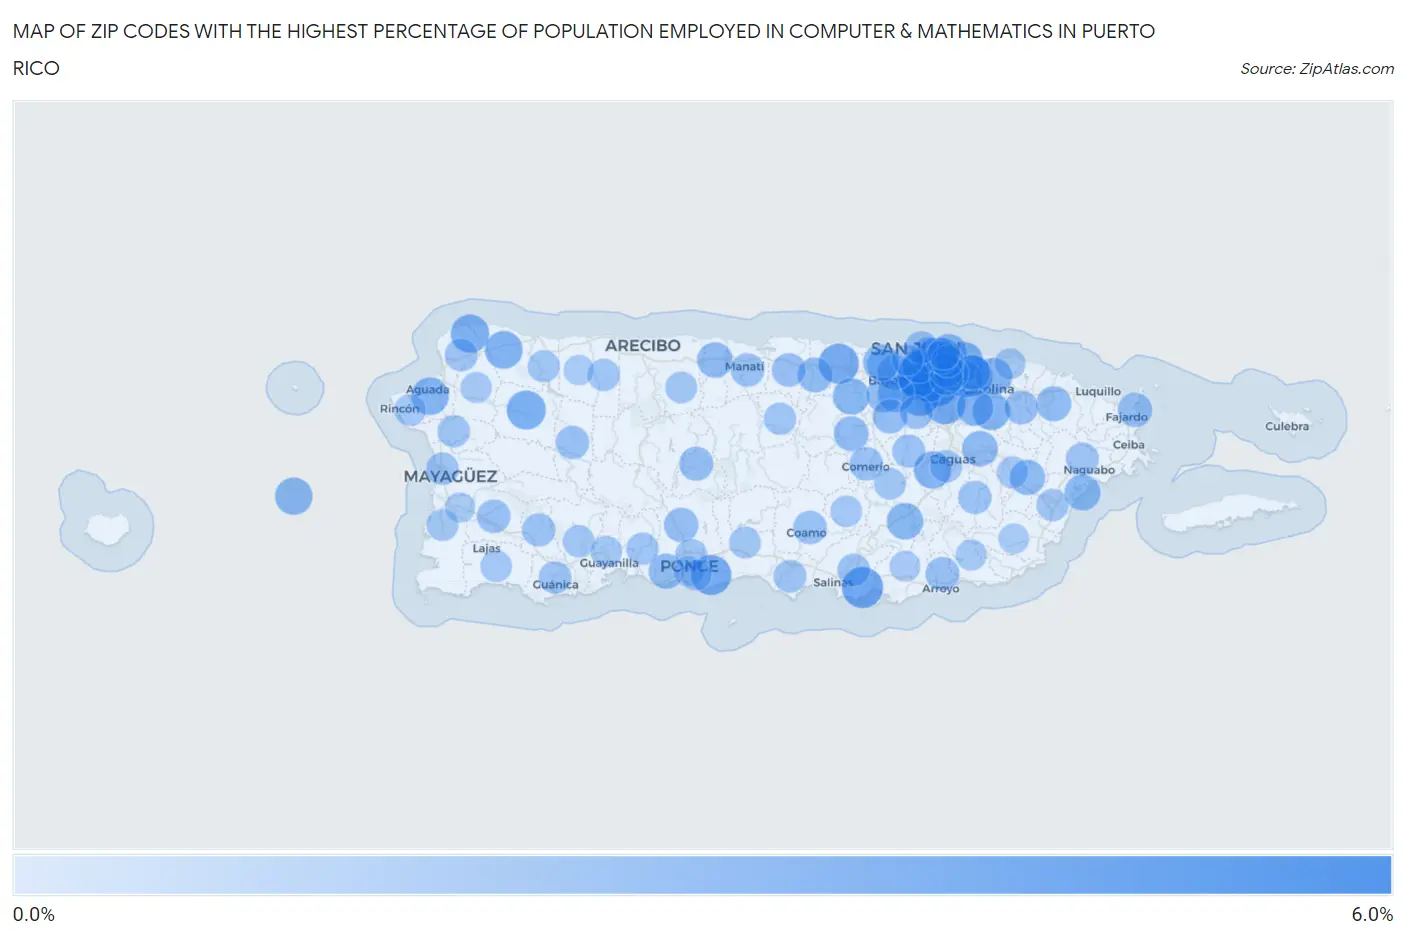
Map of Zip Codes with the Highest Percentage of Population Employed in Computer & Mathematics in Puerto Rico
0.0%
6.0%
Zip Codes with the Highest Percentage of Population Employed in Computer & Mathematics in Puerto Rico
| Zip Code | % Employed | vs State | vs National | |
| 1. | 00968 | 5.2% | 1.2%(+3.96)#1 | 3.5%(+1.68)#3,121 |
| 2. | 00927 | 3.6% | 1.2%(+2.35)#2 | 3.5%(+0.067)#5,968 |
| 3. | 00918 | 3.4% | 1.2%(+2.14)#3 | 3.5%(-0.143)#6,541 |
| 4. | 00909 | 3.3% | 1.2%(+2.04)#4 | 3.5%(-0.238)#6,824 |
| 5. | 00704 | 3.0% | 1.2%(+1.77)#5 | 3.5%(-0.512)#7,693 |
| 6. | 00926 | 2.9% | 1.2%(+1.69)#6 | 3.5%(-0.592)#7,996 |
| 7. | 00982 | 2.7% | 1.2%(+1.50)#7 | 3.5%(-0.782)#8,662 |
| 8. | 00646 | 2.7% | 1.2%(+1.50)#8 | 3.5%(-0.786)#8,677 |
| 9. | 00715 | 2.7% | 1.2%(+1.49)#9 | 3.5%(-0.788)#8,687 |
| 10. | 00969 | 2.6% | 1.2%(+1.32)#10 | 3.5%(-0.963)#9,369 |
| 11. | 00685 | 2.4% | 1.2%(+1.19)#11 | 3.5%(-1.09)#9,908 |
| 12. | 00979 | 2.4% | 1.2%(+1.12)#12 | 3.5%(-1.16)#10,181 |
| 13. | 00690 | 2.3% | 1.2%(+1.03)#13 | 3.5%(-1.25)#10,598 |
| 14. | 00662 | 2.1% | 1.2%(+0.869)#14 | 3.5%(-1.41)#11,301 |
| 15. | 00987 | 2.1% | 1.2%(+0.809)#15 | 3.5%(-1.47)#11,553 |
| 16. | 00920 | 2.0% | 1.2%(+0.806)#16 | 3.5%(-1.48)#11,574 |
| 17. | 00602 | 2.0% | 1.2%(+0.785)#17 | 3.5%(-1.50)#11,678 |
| 18. | 00680 | 2.0% | 1.2%(+0.767)#18 | 3.5%(-1.52)#11,762 |
| 19. | 00727 | 2.0% | 1.2%(+0.744)#19 | 3.5%(-1.54)#11,857 |
| 20. | 00921 | 1.9% | 1.2%(+0.687)#20 | 3.5%(-1.60)#12,155 |
| 21. | 00924 | 1.9% | 1.2%(+0.670)#21 | 3.5%(-1.61)#12,230 |
| 22. | 00985 | 1.9% | 1.2%(+0.629)#22 | 3.5%(-1.65)#12,431 |
| 23. | 00913 | 1.8% | 1.2%(+0.607)#23 | 3.5%(-1.68)#12,531 |
| 24. | 00976 | 1.8% | 1.2%(+0.600)#24 | 3.5%(-1.68)#12,563 |
| 25. | 00736 | 1.8% | 1.2%(+0.550)#25 | 3.5%(-1.73)#12,782 |
| 26. | 00966 | 1.8% | 1.2%(+0.518)#26 | 3.5%(-1.76)#12,921 |
| 27. | 00953 | 1.7% | 1.2%(+0.503)#27 | 3.5%(-1.78)#12,996 |
| 28. | 00959 | 1.7% | 1.2%(+0.494)#28 | 3.5%(-1.79)#13,052 |
| 29. | 00949 | 1.7% | 1.2%(+0.474)#29 | 3.5%(-1.81)#13,141 |
| 30. | 00741 | 1.6% | 1.2%(+0.394)#30 | 3.5%(-1.89)#13,597 |
| 31. | 00617 | 1.5% | 1.2%(+0.288)#31 | 3.5%(-1.99)#14,189 |
| 32. | 00778 | 1.5% | 1.2%(+0.282)#32 | 3.5%(-2.00)#14,228 |
| 33. | 00983 | 1.5% | 1.2%(+0.258)#33 | 3.5%(-2.02)#14,365 |
| 34. | 00907 | 1.5% | 1.2%(+0.218)#34 | 3.5%(-2.06)#14,607 |
| 35. | 00771 | 1.4% | 1.2%(+0.203)#35 | 3.5%(-2.08)#14,694 |
| 36. | 00961 | 1.4% | 1.2%(+0.199)#36 | 3.5%(-2.08)#14,715 |
| 37. | 00728 | 1.4% | 1.2%(+0.185)#37 | 3.5%(-2.10)#14,790 |
| 38. | 00745 | 1.4% | 1.2%(+0.161)#38 | 3.5%(-2.12)#14,931 |
| 39. | 00719 | 1.4% | 1.2%(+0.111)#39 | 3.5%(-2.17)#15,212 |
| 40. | 00692 | 1.3% | 1.2%(+0.104)#40 | 3.5%(-2.18)#15,244 |
| 41. | 00957 | 1.3% | 1.2%(+0.088)#41 | 3.5%(-2.19)#15,344 |
| 42. | 00956 | 1.3% | 1.2%(+0.032)#42 | 3.5%(-2.25)#15,679 |
| 43. | 00923 | 1.3% | 1.2%(+0.021)#43 | 3.5%(-2.26)#15,754 |
| 44. | 00731 | 1.2% | 1.2%(-0.018)#44 | 3.5%(-2.30)#15,999 |
| 45. | 00738 | 1.2% | 1.2%(-0.026)#45 | 3.5%(-2.31)#16,043 |
| 46. | 00917 | 1.2% | 1.2%(-0.055)#46 | 3.5%(-2.34)#16,197 |
| 47. | 00664 | 1.1% | 1.2%(-0.107)#47 | 3.5%(-2.39)#16,503 |
| 48. | 00714 | 1.1% | 1.2%(-0.160)#48 | 3.5%(-2.44)#16,852 |
| 49. | 00729 | 1.1% | 1.2%(-0.160)#49 | 3.5%(-2.44)#16,860 |
| 50. | 00693 | 1.0% | 1.2%(-0.193)#50 | 3.5%(-2.47)#17,077 |
| 51. | 00965 | 1.0% | 1.2%(-0.215)#51 | 3.5%(-2.50)#17,212 |
| 52. | 00683 | 1.0% | 1.2%(-0.220)#52 | 3.5%(-2.50)#17,237 |
| 53. | 00769 | 1.0% | 1.2%(-0.228)#53 | 3.5%(-2.51)#17,281 |
| 54. | 00674 | 1.0% | 1.2%(-0.230)#54 | 3.5%(-2.51)#17,303 |
| 55. | 00782 | 1.00% | 1.2%(-0.245)#55 | 3.5%(-2.53)#17,406 |
| 56. | 00925 | 0.99% | 1.2%(-0.250)#56 | 3.5%(-2.53)#17,438 |
| 57. | 00669 | 0.95% | 1.2%(-0.294)#57 | 3.5%(-2.58)#17,702 |
| 58. | 00637 | 0.93% | 1.2%(-0.314)#58 | 3.5%(-2.60)#17,830 |
| 59. | 00754 | 0.92% | 1.2%(-0.324)#59 | 3.5%(-2.61)#17,906 |
| 60. | 00912 | 0.92% | 1.2%(-0.324)#60 | 3.5%(-2.61)#17,908 |
| 61. | 00971 | 0.91% | 1.2%(-0.332)#61 | 3.5%(-2.61)#17,964 |
| 62. | 00703 | 0.90% | 1.2%(-0.347)#62 | 3.5%(-2.63)#18,070 |
| 63. | 00901 | 0.82% | 1.2%(-0.423)#63 | 3.5%(-2.70)#18,516 |
| 64. | 00757 | 0.82% | 1.2%(-0.425)#64 | 3.5%(-2.71)#18,533 |
| 65. | 00603 | 0.82% | 1.2%(-0.427)#65 | 3.5%(-2.71)#18,546 |
| 66. | 00718 | 0.77% | 1.2%(-0.472)#66 | 3.5%(-2.75)#18,808 |
| 67. | 00682 | 0.76% | 1.2%(-0.480)#67 | 3.5%(-2.76)#18,861 |
| 68. | 00751 | 0.76% | 1.2%(-0.485)#68 | 3.5%(-2.77)#18,899 |
| 69. | 00653 | 0.75% | 1.2%(-0.491)#69 | 3.5%(-2.77)#18,938 |
| 70. | 00725 | 0.72% | 1.2%(-0.523)#70 | 3.5%(-2.81)#19,138 |
| 71. | 00687 | 0.71% | 1.2%(-0.532)#71 | 3.5%(-2.81)#19,185 |
| 72. | 00610 | 0.71% | 1.2%(-0.534)#72 | 3.5%(-2.82)#19,195 |
| 73. | 00659 | 0.71% | 1.2%(-0.537)#73 | 3.5%(-2.82)#19,218 |
| 74. | 00624 | 0.70% | 1.2%(-0.544)#74 | 3.5%(-2.83)#19,267 |
| 75. | 00791 | 0.69% | 1.2%(-0.554)#75 | 3.5%(-2.84)#19,328 |
| 76. | 00915 | 0.68% | 1.2%(-0.568)#76 | 3.5%(-2.85)#19,414 |
| 77. | 00952 | 0.67% | 1.2%(-0.577)#77 | 3.5%(-2.86)#19,463 |
| 78. | 00730 | 0.65% | 1.2%(-0.591)#78 | 3.5%(-2.87)#19,552 |
| 79. | 00911 | 0.65% | 1.2%(-0.592)#79 | 3.5%(-2.87)#19,560 |
| 80. | 00678 | 0.63% | 1.2%(-0.616)#80 | 3.5%(-2.90)#19,702 |
| 81. | 00698 | 0.59% | 1.2%(-0.648)#81 | 3.5%(-2.93)#19,911 |
| 82. | 00739 | 0.57% | 1.2%(-0.669)#82 | 3.5%(-2.95)#20,030 |
| 83. | 00688 | 0.56% | 1.2%(-0.679)#83 | 3.5%(-2.96)#20,082 |
| 84. | 00795 | 0.56% | 1.2%(-0.687)#84 | 3.5%(-2.97)#20,137 |
| 85. | 00623 | 0.55% | 1.2%(-0.692)#85 | 3.5%(-2.97)#20,179 |
| 86. | 00677 | 0.51% | 1.2%(-0.729)#86 | 3.5%(-3.01)#20,405 |
| 87. | 00667 | 0.49% | 1.2%(-0.753)#87 | 3.5%(-3.03)#20,552 |
| 88. | 00656 | 0.49% | 1.2%(-0.757)#88 | 3.5%(-3.04)#20,575 |
| 89. | 00777 | 0.48% | 1.2%(-0.759)#89 | 3.5%(-3.04)#20,587 |
| 90. | 00705 | 0.46% | 1.2%(-0.781)#90 | 3.5%(-3.06)#20,721 |
| 91. | 00962 | 0.46% | 1.2%(-0.787)#91 | 3.5%(-3.07)#20,752 |
| 92. | 00676 | 0.41% | 1.2%(-0.834)#92 | 3.5%(-3.12)#21,013 |
| 93. | 00723 | 0.37% | 1.2%(-0.871)#93 | 3.5%(-3.15)#21,219 |
| 94. | 00772 | 0.33% | 1.2%(-0.909)#94 | 3.5%(-3.19)#21,444 |
| 95. | 00717 | 0.30% | 1.2%(-0.940)#95 | 3.5%(-3.22)#21,604 |
| 96. | 00784 | 0.29% | 1.2%(-0.952)#96 | 3.5%(-3.23)#21,666 |
| 97. | 00716 | 0.29% | 1.2%(-0.956)#97 | 3.5%(-3.24)#21,687 |
| 98. | 00767 | 0.24% | 1.2%(-1.01)#98 | 3.5%(-3.29)#21,921 |
| 99. | 00660 | 0.20% | 1.2%(-1.04)#99 | 3.5%(-3.32)#22,063 |
| 100. | 00627 | 0.17% | 1.2%(-1.07)#100 | 3.5%(-3.35)#22,151 |
1
2Common Questions
What are the Top 10 Zip Codes with the Highest Percentage of Population Employed in Computer & Mathematics in Puerto Rico?
Top 10 Zip Codes with the Highest Percentage of Population Employed in Computer & Mathematics in Puerto Rico are:
What zip code has the Highest Percentage of Population Employed in Computer & Mathematics in Puerto Rico?
00968 has the Highest Percentage of Population Employed in Computer & Mathematics in Puerto Rico with 5.2%.
What is the Percentage of Population Employed in Computer & Mathematics in the State of Puerto Rico?
Percentage of Population Employed in Computer & Mathematics in Puerto Rico is 1.2%.
What is the Percentage of Population Employed in Computer & Mathematics in the United States?
Percentage of Population Employed in Computer & Mathematics in the United States is 3.5%.