Zip Codes with the Highest Percentage of Population Employed in Computer & Mathematics in Virginia
RELATED REPORTS & OPTIONS
Computer & Mathematics
Virginia
Compare Zip Codes
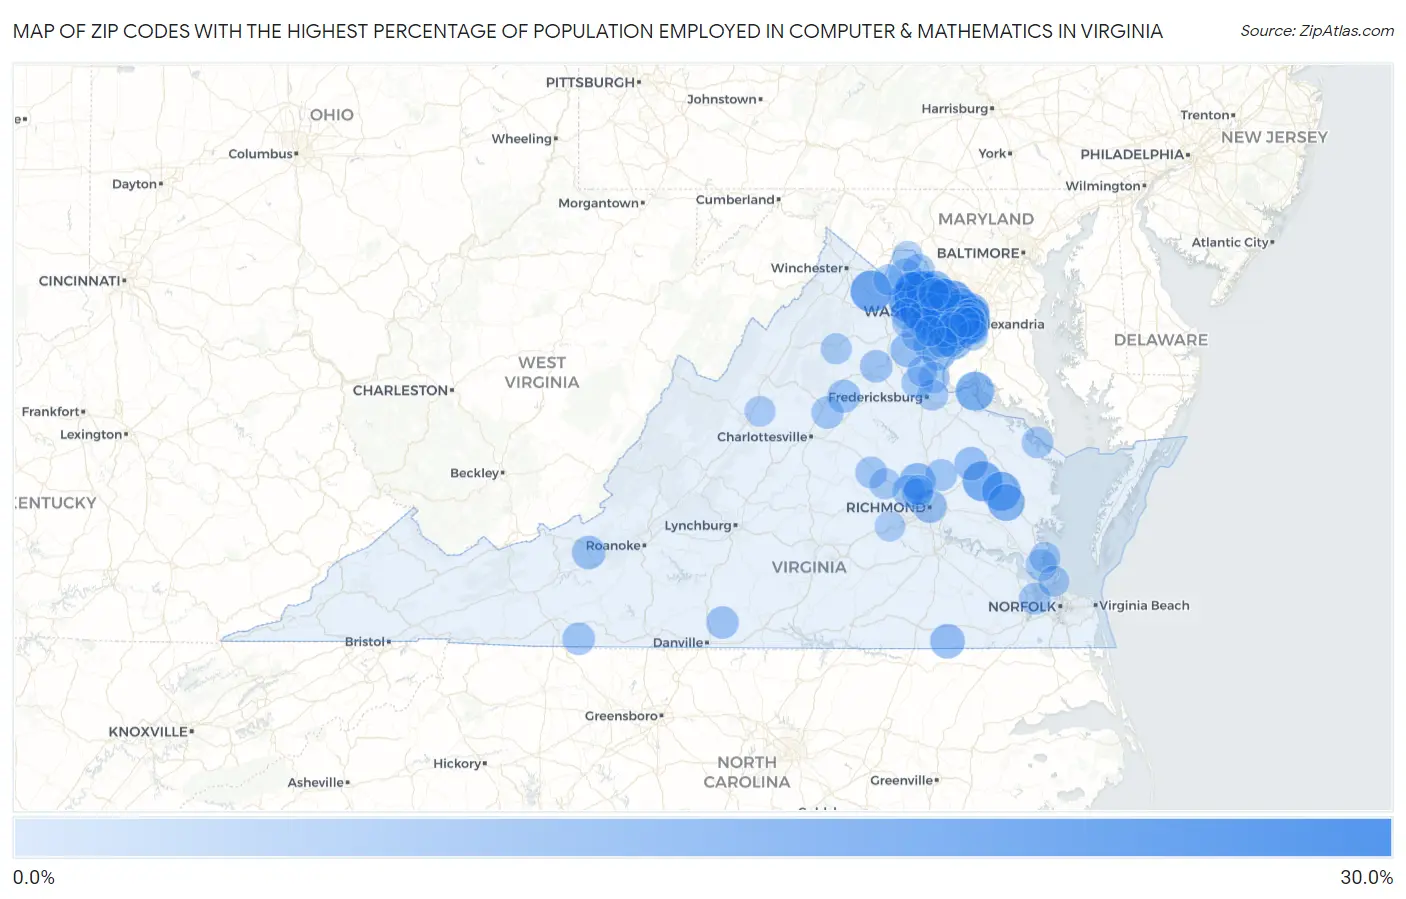
Map of Zip Codes with the Highest Percentage of Population Employed in Computer & Mathematics in Virginia
0.0%
30.0%
Zip Codes with the Highest Percentage of Population Employed in Computer & Mathematics in Virginia
| Zip Code | % Employed | vs State | vs National | |
| 1. | 20148 | 25.9% | 6.2%(+19.6)#1 | 3.5%(+22.3)#71 |
| 2. | 20171 | 21.9% | 6.2%(+15.7)#2 | 3.5%(+18.4)#107 |
| 3. | 20105 | 19.5% | 6.2%(+13.2)#3 | 3.5%(+15.9)#138 |
| 4. | 20152 | 19.4% | 6.2%(+13.2)#4 | 3.5%(+15.9)#141 |
| 5. | 20130 | 18.3% | 6.2%(+12.1)#5 | 3.5%(+14.8)#168 |
| 6. | 22102 | 18.2% | 6.2%(+12.0)#6 | 3.5%(+14.7)#170 |
| 7. | 22033 | 17.4% | 6.2%(+11.1)#7 | 3.5%(+13.9)#187 |
| 8. | 20166 | 17.1% | 6.2%(+10.9)#8 | 3.5%(+13.6)#190 |
| 9. | 23177 | 16.8% | 6.2%(+10.5)#9 | 3.5%(+13.2)#193 |
| 10. | 20194 | 16.4% | 6.2%(+10.2)#10 | 3.5%(+12.9)#203 |
| 11. | 22027 | 16.2% | 6.2%(+9.96)#11 | 3.5%(+12.7)#213 |
| 12. | 23091 | 15.8% | 6.2%(+9.59)#12 | 3.5%(+12.3)#222 |
| 13. | 22448 | 15.8% | 6.2%(+9.52)#13 | 3.5%(+12.2)#223 |
| 14. | 20190 | 15.3% | 6.2%(+9.02)#14 | 3.5%(+11.7)#242 |
| 15. | 22181 | 15.1% | 6.2%(+8.85)#15 | 3.5%(+11.6)#250 |
| 16. | 20147 | 14.9% | 6.2%(+8.71)#16 | 3.5%(+11.4)#258 |
| 17. | 22203 | 14.8% | 6.2%(+8.55)#17 | 3.5%(+11.3)#266 |
| 18. | 22180 | 14.6% | 6.2%(+8.38)#18 | 3.5%(+11.1)#272 |
| 19. | 22031 | 14.6% | 6.2%(+8.37)#19 | 3.5%(+11.1)#273 |
| 20. | 22030 | 14.2% | 6.2%(+8.00)#20 | 3.5%(+10.7)#292 |
| 21. | 20191 | 14.1% | 6.2%(+7.88)#21 | 3.5%(+10.6)#299 |
| 22. | 23110 | 14.0% | 6.2%(+7.81)#22 | 3.5%(+10.5)#306 |
| 23. | 20120 | 14.0% | 6.2%(+7.79)#23 | 3.5%(+10.5)#308 |
| 24. | 22201 | 13.9% | 6.2%(+7.68)#24 | 3.5%(+10.4)#316 |
| 25. | 22043 | 13.7% | 6.2%(+7.45)#25 | 3.5%(+10.2)#325 |
| 26. | 22315 | 13.6% | 6.2%(+7.38)#26 | 3.5%(+10.1)#326 |
| 27. | 23059 | 13.6% | 6.2%(+7.33)#27 | 3.5%(+10.0)#328 |
| 28. | 22209 | 13.1% | 6.2%(+6.88)#28 | 3.5%(+9.59)#354 |
| 29. | 20165 | 13.0% | 6.2%(+6.80)#29 | 3.5%(+9.51)#360 |
| 30. | 22182 | 13.0% | 6.2%(+6.78)#30 | 3.5%(+9.49)#361 |
| 31. | 22310 | 13.0% | 6.2%(+6.77)#31 | 3.5%(+9.48)#363 |
| 32. | 20124 | 12.5% | 6.2%(+6.28)#32 | 3.5%(+8.99)#396 |
| 33. | 22301 | 12.4% | 6.2%(+6.18)#33 | 3.5%(+8.89)#404 |
| 34. | 22213 | 12.4% | 6.2%(+6.15)#34 | 3.5%(+8.86)#407 |
| 35. | 20170 | 12.3% | 6.2%(+6.09)#35 | 3.5%(+8.80)#411 |
| 36. | 22153 | 12.2% | 6.2%(+5.96)#36 | 3.5%(+8.67)#423 |
| 37. | 23828 | 12.1% | 6.2%(+5.84)#37 | 3.5%(+8.55)#431 |
| 38. | 22032 | 11.8% | 6.2%(+5.59)#38 | 3.5%(+8.30)#461 |
| 39. | 20119 | 11.8% | 6.2%(+5.54)#39 | 3.5%(+8.25)#468 |
| 40. | 22303 | 11.6% | 6.2%(+5.39)#40 | 3.5%(+8.10)#479 |
| 41. | 22015 | 11.6% | 6.2%(+5.38)#41 | 3.5%(+8.09)#480 |
| 42. | 22124 | 11.5% | 6.2%(+5.27)#42 | 3.5%(+7.98)#493 |
| 43. | 22046 | 11.5% | 6.2%(+5.25)#43 | 3.5%(+7.96)#495 |
| 44. | 20112 | 11.3% | 6.2%(+5.08)#44 | 3.5%(+7.79)#519 |
| 45. | 22101 | 11.3% | 6.2%(+5.06)#45 | 3.5%(+7.77)#522 |
| 46. | 23219 | 11.2% | 6.2%(+4.99)#46 | 3.5%(+7.70)#535 |
| 47. | 22202 | 11.2% | 6.2%(+4.95)#47 | 3.5%(+7.66)#539 |
| 48. | 20151 | 11.1% | 6.2%(+4.90)#48 | 3.5%(+7.61)#543 |
| 49. | 23148 | 11.1% | 6.2%(+4.89)#49 | 3.5%(+7.60)#545 |
| 50. | 24061 | 11.1% | 6.2%(+4.84)#50 | 3.5%(+7.56)#553 |
| 51. | 22079 | 10.9% | 6.2%(+4.63)#51 | 3.5%(+7.34)#575 |
| 52. | 22025 | 10.8% | 6.2%(+4.55)#52 | 3.5%(+7.26)#594 |
| 53. | 22204 | 10.7% | 6.2%(+4.47)#53 | 3.5%(+7.18)#604 |
| 54. | 22732 | 10.6% | 6.2%(+4.40)#54 | 3.5%(+7.11)#612 |
| 55. | 20158 | 10.5% | 6.2%(+4.22)#55 | 3.5%(+6.94)#640 |
| 56. | 22066 | 10.4% | 6.2%(+4.18)#56 | 3.5%(+6.89)#647 |
| 57. | 23233 | 10.3% | 6.2%(+4.10)#57 | 3.5%(+6.81)#657 |
| 58. | 20121 | 10.2% | 6.2%(+3.93)#58 | 3.5%(+6.64)#679 |
| 59. | 24053 | 10.1% | 6.2%(+3.87)#59 | 3.5%(+6.58)#693 |
| 60. | 22714 | 10.1% | 6.2%(+3.86)#60 | 3.5%(+6.57)#695 |
| 61. | 24566 | 10.1% | 6.2%(+3.84)#61 | 3.5%(+6.55)#698 |
| 62. | 22923 | 10.0% | 6.2%(+3.78)#62 | 3.5%(+6.49)#708 |
| 63. | 20136 | 9.7% | 6.2%(+3.46)#63 | 3.5%(+6.17)#756 |
| 64. | 20176 | 9.5% | 6.2%(+3.31)#64 | 3.5%(+6.02)#786 |
| 65. | 22125 | 9.5% | 6.2%(+3.25)#65 | 3.5%(+5.96)#799 |
| 66. | 23153 | 9.4% | 6.2%(+3.19)#66 | 3.5%(+5.91)#810 |
| 67. | 22039 | 9.4% | 6.2%(+3.19)#67 | 3.5%(+5.90)#811 |
| 68. | 23069 | 9.4% | 6.2%(+3.18)#68 | 3.5%(+5.89)#812 |
| 69. | 23436 | 9.4% | 6.2%(+3.14)#69 | 3.5%(+5.86)#819 |
| 70. | 22151 | 9.4% | 6.2%(+3.14)#70 | 3.5%(+5.85)#821 |
| 71. | 20175 | 9.4% | 6.2%(+3.12)#71 | 3.5%(+5.83)#825 |
| 72. | 22406 | 9.4% | 6.2%(+3.12)#72 | 3.5%(+5.83)#826 |
| 73. | 22206 | 9.3% | 6.2%(+3.09)#73 | 3.5%(+5.80)#831 |
| 74. | 23693 | 9.2% | 6.2%(+2.99)#74 | 3.5%(+5.70)#847 |
| 75. | 22511 | 9.2% | 6.2%(+2.97)#75 | 3.5%(+5.68)#851 |
| 76. | 22302 | 9.1% | 6.2%(+2.91)#76 | 3.5%(+5.62)#870 |
| 77. | 22307 | 9.0% | 6.2%(+2.78)#77 | 3.5%(+5.49)#901 |
| 78. | 20164 | 9.0% | 6.2%(+2.73)#78 | 3.5%(+5.44)#906 |
| 79. | 23102 | 9.0% | 6.2%(+2.72)#79 | 3.5%(+5.43)#910 |
| 80. | 22554 | 9.0% | 6.2%(+2.71)#80 | 3.5%(+5.43)#914 |
| 81. | 23294 | 8.9% | 6.2%(+2.70)#81 | 3.5%(+5.42)#918 |
| 82. | 20141 | 8.9% | 6.2%(+2.64)#82 | 3.5%(+5.35)#934 |
| 83. | 22405 | 8.9% | 6.2%(+2.63)#83 | 3.5%(+5.35)#935 |
| 84. | 22314 | 8.7% | 6.2%(+2.51)#84 | 3.5%(+5.22)#968 |
| 85. | 22150 | 8.7% | 6.2%(+2.49)#85 | 3.5%(+5.20)#975 |
| 86. | 22740 | 8.7% | 6.2%(+2.47)#86 | 3.5%(+5.18)#987 |
| 87. | 22308 | 8.7% | 6.2%(+2.45)#87 | 3.5%(+5.16)#997 |
| 88. | 23696 | 8.7% | 6.2%(+2.44)#88 | 3.5%(+5.15)#1,000 |
| 89. | 23668 | 8.7% | 6.2%(+2.43)#89 | 3.5%(+5.14)#1,003 |
| 90. | 24437 | 8.5% | 6.2%(+2.29)#90 | 3.5%(+5.00)#1,045 |
| 91. | 22556 | 8.5% | 6.2%(+2.28)#91 | 3.5%(+5.00)#1,046 |
| 92. | 20169 | 8.5% | 6.2%(+2.25)#92 | 3.5%(+4.96)#1,057 |
| 93. | 20155 | 8.4% | 6.2%(+2.19)#93 | 3.5%(+4.90)#1,073 |
| 94. | 22152 | 8.4% | 6.2%(+2.14)#94 | 3.5%(+4.86)#1,087 |
| 95. | 22192 | 8.2% | 6.2%(+2.01)#95 | 3.5%(+4.72)#1,136 |
| 96. | 23120 | 8.2% | 6.2%(+1.99)#96 | 3.5%(+4.70)#1,144 |
| 97. | 20180 | 8.2% | 6.2%(+1.93)#97 | 3.5%(+4.64)#1,156 |
| 98. | 23060 | 8.2% | 6.2%(+1.92)#98 | 3.5%(+4.63)#1,160 |
| 99. | 22304 | 8.1% | 6.2%(+1.89)#99 | 3.5%(+4.60)#1,169 |
| 100. | 20111 | 8.1% | 6.2%(+1.87)#100 | 3.5%(+4.58)#1,178 |
Common Questions
What are the Top 10 Zip Codes with the Highest Percentage of Population Employed in Computer & Mathematics in Virginia?
Top 10 Zip Codes with the Highest Percentage of Population Employed in Computer & Mathematics in Virginia are:
What zip code has the Highest Percentage of Population Employed in Computer & Mathematics in Virginia?
20148 has the Highest Percentage of Population Employed in Computer & Mathematics in Virginia with 25.9%.
What is the Percentage of Population Employed in Computer & Mathematics in the State of Virginia?
Percentage of Population Employed in Computer & Mathematics in Virginia is 6.2%.
What is the Percentage of Population Employed in Computer & Mathematics in the United States?
Percentage of Population Employed in Computer & Mathematics in the United States is 3.5%.