Zip Codes with the Highest Percentage of Population Employed in Computer & Mathematics in Connecticut
RELATED REPORTS & OPTIONS
Computer & Mathematics
Connecticut
Compare Zip Codes
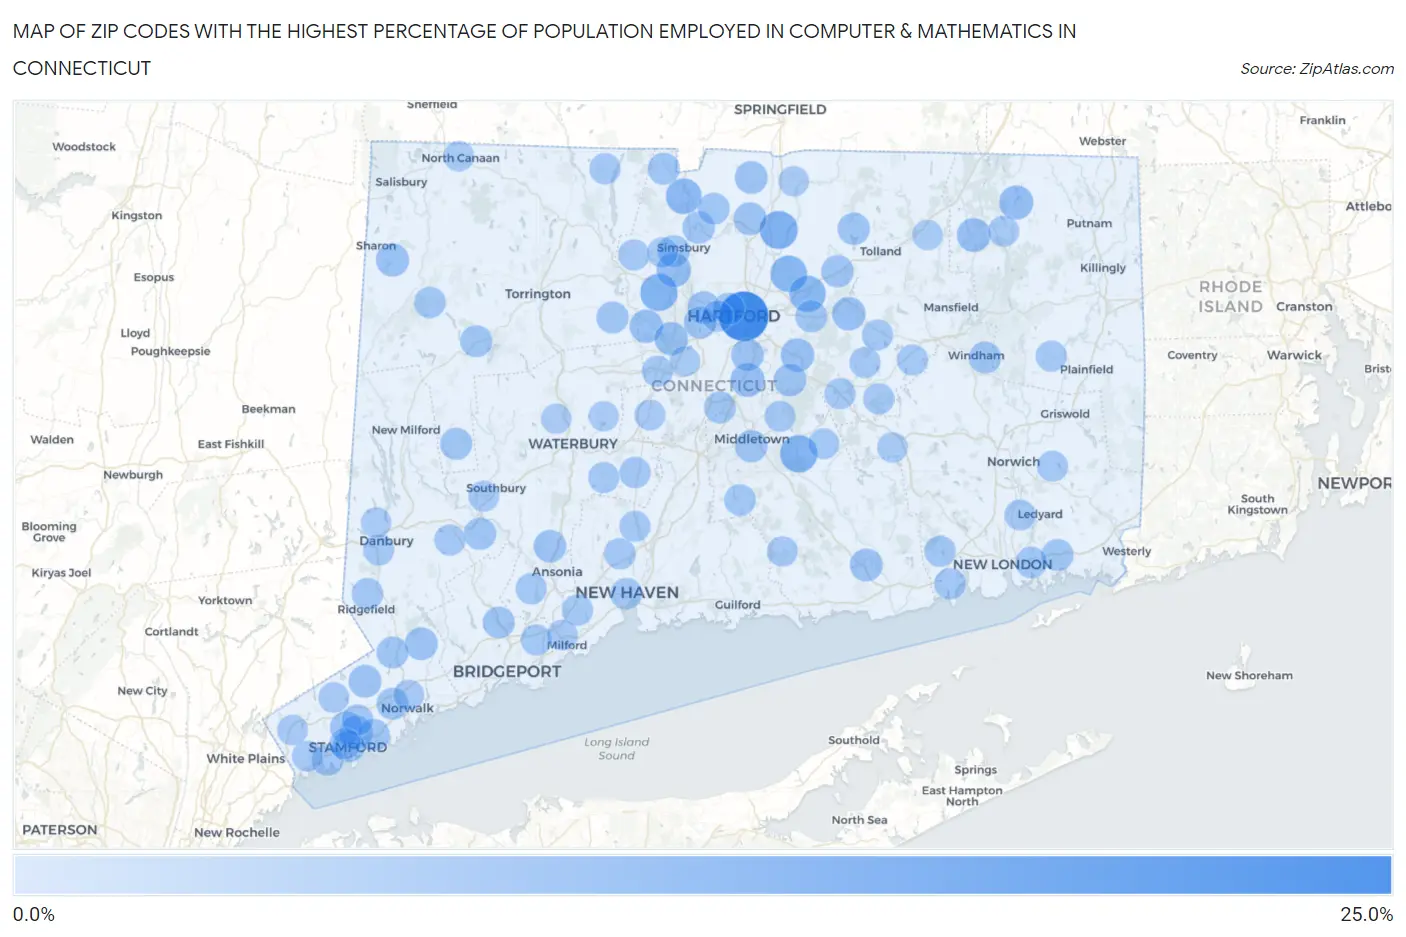
Map of Zip Codes with the Highest Percentage of Population Employed in Computer & Mathematics in Connecticut
0.0%
25.0%
Zip Codes with the Highest Percentage of Population Employed in Computer & Mathematics in Connecticut
| Zip Code | % Employed | vs State | vs National | |
| 1. | 06103 | 23.8% | 3.4%(+20.4)#1 | 3.5%(+20.3)#89 |
| 2. | 06088 | 11.4% | 3.4%(+8.01)#2 | 3.5%(+7.90)#506 |
| 3. | 06001 | 10.9% | 3.4%(+7.51)#3 | 3.5%(+7.39)#566 |
| 4. | 06456 | 10.8% | 3.4%(+7.38)#4 | 3.5%(+7.27)#591 |
| 5. | 06074 | 9.9% | 3.4%(+6.51)#5 | 3.5%(+6.40)#720 |
| 6. | 06042 | 9.7% | 3.4%(+6.28)#6 | 3.5%(+6.17)#757 |
| 7. | 06035 | 8.9% | 3.4%(+5.53)#7 | 3.5%(+5.42)#917 |
| 8. | 06089 | 7.6% | 3.4%(+4.22)#8 | 3.5%(+4.11)#1,340 |
| 9. | 06282 | 7.3% | 3.4%(+3.89)#9 | 3.5%(+3.78)#1,465 |
| 10. | 06067 | 7.0% | 3.4%(+3.60)#10 | 3.5%(+3.49)#1,619 |
| 11. | 06278 | 7.0% | 3.4%(+3.58)#11 | 3.5%(+3.47)#1,627 |
| 12. | 06085 | 6.7% | 3.4%(+3.31)#12 | 3.5%(+3.20)#1,781 |
| 13. | 06043 | 6.7% | 3.4%(+3.26)#13 | 3.5%(+3.15)#1,815 |
| 14. | 06033 | 6.7% | 3.4%(+3.24)#14 | 3.5%(+3.13)#1,831 |
| 15. | 06032 | 6.5% | 3.4%(+3.08)#15 | 3.5%(+2.96)#1,937 |
| 16. | 06906 | 6.4% | 3.4%(+2.98)#16 | 3.5%(+2.86)#2,008 |
| 17. | 06069 | 6.3% | 3.4%(+2.90)#17 | 3.5%(+2.79)#2,070 |
| 18. | 06096 | 6.1% | 3.4%(+2.67)#18 | 3.5%(+2.55)#2,242 |
| 19. | 06426 | 6.0% | 3.4%(+2.63)#19 | 3.5%(+2.52)#2,276 |
| 20. | 06840 | 6.0% | 3.4%(+2.55)#20 | 3.5%(+2.44)#2,346 |
| 21. | 06883 | 5.9% | 3.4%(+2.52)#21 | 3.5%(+2.40)#2,379 |
| 22. | 06078 | 5.9% | 3.4%(+2.50)#22 | 3.5%(+2.39)#2,393 |
| 23. | 06117 | 5.8% | 3.4%(+2.42)#23 | 3.5%(+2.31)#2,476 |
| 24. | 06483 | 5.8% | 3.4%(+2.41)#24 | 3.5%(+2.29)#2,486 |
| 25. | 06109 | 5.8% | 3.4%(+2.39)#25 | 3.5%(+2.28)#2,494 |
| 26. | 06073 | 5.7% | 3.4%(+2.32)#26 | 3.5%(+2.21)#2,549 |
| 27. | 06066 | 5.6% | 3.4%(+2.15)#27 | 3.5%(+2.04)#2,713 |
| 28. | 06107 | 5.5% | 3.4%(+2.14)#28 | 3.5%(+2.02)#2,731 |
| 29. | 06081 | 5.5% | 3.4%(+2.12)#29 | 3.5%(+2.01)#2,744 |
| 30. | 06482 | 5.5% | 3.4%(+2.10)#30 | 3.5%(+1.99)#2,767 |
| 31. | 06457 | 5.5% | 3.4%(+2.07)#31 | 3.5%(+1.96)#2,801 |
| 32. | 06905 | 5.5% | 3.4%(+2.04)#32 | 3.5%(+1.93)#2,837 |
| 33. | 06029 | 5.4% | 3.4%(+2.02)#33 | 3.5%(+1.91)#2,856 |
| 34. | 06820 | 5.3% | 3.4%(+1.86)#34 | 3.5%(+1.74)#3,046 |
| 35. | 06901 | 5.2% | 3.4%(+1.82)#35 | 3.5%(+1.71)#3,088 |
| 36. | 06060 | 5.2% | 3.4%(+1.80)#36 | 3.5%(+1.68)#3,118 |
| 37. | 06783 | 5.2% | 3.4%(+1.79)#37 | 3.5%(+1.68)#3,123 |
| 38. | 06070 | 5.2% | 3.4%(+1.79)#38 | 3.5%(+1.67)#3,129 |
| 39. | 06750 | 5.2% | 3.4%(+1.79)#39 | 3.5%(+1.67)#3,130 |
| 40. | 06040 | 5.2% | 3.4%(+1.78)#40 | 3.5%(+1.67)#3,131 |
| 41. | 06013 | 5.2% | 3.4%(+1.78)#41 | 3.5%(+1.66)#3,139 |
| 42. | 06850 | 5.2% | 3.4%(+1.75)#42 | 3.5%(+1.64)#3,164 |
| 43. | 06280 | 5.1% | 3.4%(+1.72)#43 | 3.5%(+1.61)#3,191 |
| 44. | 06105 | 5.1% | 3.4%(+1.72)#44 | 3.5%(+1.61)#3,193 |
| 45. | 06023 | 5.1% | 3.4%(+1.70)#45 | 3.5%(+1.59)#3,211 |
| 46. | 06897 | 5.0% | 3.4%(+1.57)#46 | 3.5%(+1.46)#3,379 |
| 47. | 06355 | 5.0% | 3.4%(+1.56)#47 | 3.5%(+1.45)#3,389 |
| 48. | 06026 | 4.9% | 3.4%(+1.52)#48 | 3.5%(+1.41)#3,452 |
| 49. | 06611 | 4.9% | 3.4%(+1.50)#49 | 3.5%(+1.39)#3,483 |
| 50. | 06510 | 4.7% | 3.4%(+1.30)#50 | 3.5%(+1.19)#3,784 |
| 51. | 06340 | 4.7% | 3.4%(+1.27)#51 | 3.5%(+1.16)#3,818 |
| 52. | 06422 | 4.7% | 3.4%(+1.26)#52 | 3.5%(+1.15)#3,835 |
| 53. | 06878 | 4.6% | 3.4%(+1.22)#53 | 3.5%(+1.11)#3,890 |
| 54. | 06877 | 4.6% | 3.4%(+1.21)#54 | 3.5%(+1.10)#3,907 |
| 55. | 06754 | 4.6% | 3.4%(+1.20)#55 | 3.5%(+1.09)#3,926 |
| 56. | 06357 | 4.6% | 3.4%(+1.14)#56 | 3.5%(+1.03)#4,010 |
| 57. | 06410 | 4.5% | 3.4%(+1.08)#57 | 3.5%(+0.972)#4,080 |
| 58. | 06514 | 4.5% | 3.4%(+1.08)#58 | 3.5%(+0.970)#4,084 |
| 59. | 06333 | 4.5% | 3.4%(+1.07)#59 | 3.5%(+0.961)#4,100 |
| 60. | 06907 | 4.5% | 3.4%(+1.05)#60 | 3.5%(+0.940)#4,146 |
| 61. | 06091 | 4.4% | 3.4%(+1.03)#61 | 3.5%(+0.920)#4,193 |
| 62. | 06902 | 4.4% | 3.4%(+0.969)#62 | 3.5%(+0.856)#4,297 |
| 63. | 06477 | 4.3% | 3.4%(+0.925)#63 | 3.5%(+0.813)#4,366 |
| 64. | 06470 | 4.3% | 3.4%(+0.911)#64 | 3.5%(+0.799)#4,386 |
| 65. | 06119 | 4.3% | 3.4%(+0.887)#65 | 3.5%(+0.775)#4,433 |
| 66. | 06447 | 4.3% | 3.4%(+0.872)#66 | 3.5%(+0.760)#4,460 |
| 67. | 06484 | 4.3% | 3.4%(+0.864)#67 | 3.5%(+0.751)#4,470 |
| 68. | 06614 | 4.3% | 3.4%(+0.860)#68 | 3.5%(+0.748)#4,476 |
| 69. | 06712 | 4.3% | 3.4%(+0.853)#69 | 3.5%(+0.741)#4,485 |
| 70. | 06019 | 4.2% | 3.4%(+0.819)#70 | 3.5%(+0.707)#4,555 |
| 71. | 06231 | 4.2% | 3.4%(+0.814)#71 | 3.5%(+0.702)#4,562 |
| 72. | 06062 | 4.2% | 3.4%(+0.783)#72 | 3.5%(+0.671)#4,617 |
| 73. | 06518 | 4.2% | 3.4%(+0.778)#73 | 3.5%(+0.665)#4,627 |
| 74. | 06331 | 4.2% | 3.4%(+0.778)#74 | 3.5%(+0.665)#4,628 |
| 75. | 06248 | 4.2% | 3.4%(+0.768)#75 | 3.5%(+0.656)#4,645 |
| 76. | 06232 | 4.2% | 3.4%(+0.762)#76 | 3.5%(+0.649)#4,662 |
| 77. | 06237 | 4.2% | 3.4%(+0.742)#77 | 3.5%(+0.630)#4,695 |
| 78. | 06335 | 4.2% | 3.4%(+0.738)#78 | 3.5%(+0.626)#4,703 |
| 79. | 06365 | 4.1% | 3.4%(+0.724)#79 | 3.5%(+0.612)#4,738 |
| 80. | 06810 | 4.1% | 3.4%(+0.708)#80 | 3.5%(+0.596)#4,772 |
| 81. | 06480 | 4.1% | 3.4%(+0.669)#81 | 3.5%(+0.556)#4,851 |
| 82. | 06424 | 4.1% | 3.4%(+0.660)#82 | 3.5%(+0.548)#4,873 |
| 83. | 06242 | 4.0% | 3.4%(+0.607)#83 | 3.5%(+0.495)#4,995 |
| 84. | 06489 | 4.0% | 3.4%(+0.570)#84 | 3.5%(+0.458)#5,085 |
| 85. | 06488 | 4.0% | 3.4%(+0.565)#85 | 3.5%(+0.453)#5,097 |
| 86. | 06830 | 4.0% | 3.4%(+0.556)#86 | 3.5%(+0.443)#5,118 |
| 87. | 06461 | 3.9% | 3.4%(+0.485)#87 | 3.5%(+0.373)#5,257 |
| 88. | 06851 | 3.7% | 3.4%(+0.316)#88 | 3.5%(+0.203)#5,649 |
| 89. | 06903 | 3.7% | 3.4%(+0.306)#89 | 3.5%(+0.194)#5,674 |
| 90. | 06419 | 3.7% | 3.4%(+0.300)#90 | 3.5%(+0.187)#5,691 |
| 91. | 06831 | 3.7% | 3.4%(+0.285)#91 | 3.5%(+0.173)#5,735 |
| 92. | 06415 | 3.7% | 3.4%(+0.268)#92 | 3.5%(+0.155)#5,781 |
| 93. | 06092 | 3.7% | 3.4%(+0.249)#93 | 3.5%(+0.136)#5,816 |
| 94. | 06018 | 3.6% | 3.4%(+0.219)#94 | 3.5%(+0.106)#5,891 |
| 95. | 06811 | 3.6% | 3.4%(+0.203)#95 | 3.5%(+0.091)#5,925 |
| 96. | 06279 | 3.6% | 3.4%(+0.186)#96 | 3.5%(+0.074)#5,960 |
| 97. | 06779 | 3.5% | 3.4%(+0.097)#97 | 3.5%(-0.015)#6,184 |
| 98. | 06082 | 3.5% | 3.4%(+0.094)#98 | 3.5%(-0.018)#6,193 |
| 99. | 06053 | 3.5% | 3.4%(+0.050)#99 | 3.5%(-0.062)#6,304 |
| 100. | 06716 | 3.4% | 3.4%(+0.022)#100 | 3.5%(-0.090)#6,385 |
Common Questions
What are the Top 10 Zip Codes with the Highest Percentage of Population Employed in Computer & Mathematics in Connecticut?
Top 10 Zip Codes with the Highest Percentage of Population Employed in Computer & Mathematics in Connecticut are:
What zip code has the Highest Percentage of Population Employed in Computer & Mathematics in Connecticut?
06103 has the Highest Percentage of Population Employed in Computer & Mathematics in Connecticut with 23.8%.
What is the Percentage of Population Employed in Computer & Mathematics in the State of Connecticut?
Percentage of Population Employed in Computer & Mathematics in Connecticut is 3.4%.
What is the Percentage of Population Employed in Computer & Mathematics in the United States?
Percentage of Population Employed in Computer & Mathematics in the United States is 3.5%.