Zip Codes with the Highest Percentage of Population Employed in Computer & Mathematics in Arkansas
RELATED REPORTS & OPTIONS
Computer & Mathematics
Arkansas
Compare Zip Codes
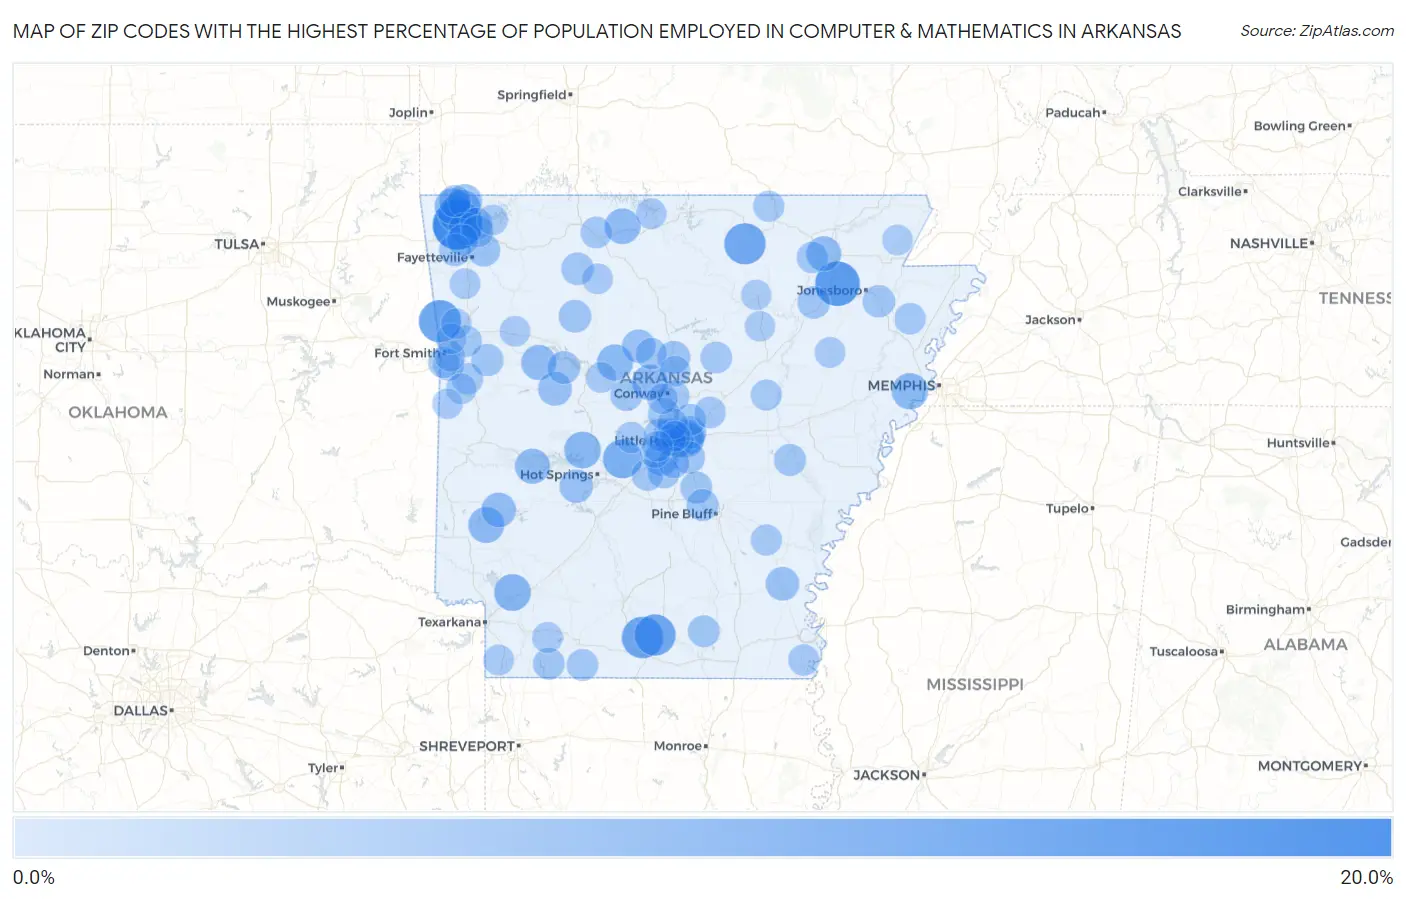
Map of Zip Codes with the Highest Percentage of Population Employed in Computer & Mathematics in Arkansas
0.0%
20.0%
Zip Codes with the Highest Percentage of Population Employed in Computer & Mathematics in Arkansas
| Zip Code | % Employed | vs State | vs National | |
| 1. | 72713 | 18.5% | 2.2%(+16.4)#1 | 3.5%(+15.0)#160 |
| 2. | 72427 | 14.3% | 2.2%(+12.1)#2 | 3.5%(+10.8)#287 |
| 3. | 72955 | 12.2% | 2.2%(+10.1)#3 | 3.5%(+8.69)#421 |
| 4. | 71759 | 11.5% | 2.2%(+9.38)#4 | 3.5%(+8.01)#485 |
| 5. | 71724 | 11.3% | 2.2%(+9.19)#5 | 3.5%(+7.82)#514 |
| 6. | 72536 | 11.3% | 2.2%(+9.16)#6 | 3.5%(+7.80)#518 |
| 7. | 72087 | 9.5% | 2.2%(+7.37)#7 | 3.5%(+6.00)#789 |
| 8. | 72712 | 7.8% | 2.2%(+5.63)#8 | 3.5%(+4.27)#1,288 |
| 9. | 71838 | 7.6% | 2.2%(+5.41)#9 | 3.5%(+4.04)#1,361 |
| 10. | 71949 | 7.4% | 2.2%(+5.24)#10 | 3.5%(+3.87)#1,432 |
| 11. | 72332 | 7.1% | 2.2%(+4.98)#11 | 3.5%(+3.62)#1,548 |
| 12. | 72823 | 7.0% | 2.2%(+4.80)#12 | 3.5%(+3.44)#1,647 |
| 13. | 71833 | 6.9% | 2.2%(+4.70)#13 | 3.5%(+3.34)#1,702 |
| 14. | 72719 | 6.8% | 2.2%(+4.63)#14 | 3.5%(+3.26)#1,742 |
| 15. | 72127 | 6.7% | 2.2%(+4.56)#15 | 3.5%(+3.19)#1,785 |
| 16. | 72739 | 6.6% | 2.2%(+4.45)#16 | 3.5%(+3.08)#1,853 |
| 17. | 72672 | 6.5% | 2.2%(+4.38)#17 | 3.5%(+3.02)#1,900 |
| 18. | 71957 | 6.1% | 2.2%(+3.94)#18 | 3.5%(+2.57)#2,229 |
| 19. | 72865 | 6.1% | 2.2%(+3.92)#19 | 3.5%(+2.55)#2,251 |
| 20. | 72457 | 6.0% | 2.2%(+3.83)#20 | 3.5%(+2.46)#2,325 |
| 21. | 72202 | 5.9% | 2.2%(+3.71)#21 | 3.5%(+2.34)#2,442 |
| 22. | 71959 | 5.7% | 2.2%(+3.58)#22 | 3.5%(+2.22)#2,543 |
| 23. | 72114 | 5.7% | 2.2%(+3.54)#23 | 3.5%(+2.17)#2,595 |
| 24. | 72714 | 5.2% | 2.2%(+3.06)#24 | 3.5%(+1.69)#3,111 |
| 25. | 72824 | 5.0% | 2.2%(+2.89)#25 | 3.5%(+1.52)#3,303 |
| 26. | 71670 | 4.9% | 2.2%(+2.73)#26 | 3.5%(+1.36)#3,525 |
| 27. | 72022 | 4.8% | 2.2%(+2.63)#27 | 3.5%(+1.26)#3,657 |
| 28. | 71964 | 4.7% | 2.2%(+2.59)#28 | 3.5%(+1.22)#3,712 |
| 29. | 72030 | 4.7% | 2.2%(+2.55)#29 | 3.5%(+1.18)#3,788 |
| 30. | 72039 | 4.3% | 2.2%(+2.18)#30 | 3.5%(+0.817)#4,358 |
| 31. | 72703 | 4.3% | 2.2%(+2.16)#31 | 3.5%(+0.794)#4,400 |
| 32. | 72212 | 4.3% | 2.2%(+2.16)#32 | 3.5%(+0.790)#4,405 |
| 33. | 72835 | 4.2% | 2.2%(+2.06)#33 | 3.5%(+0.692)#4,577 |
| 34. | 72718 | 4.1% | 2.2%(+1.97)#34 | 3.5%(+0.608)#4,747 |
| 35. | 72839 | 4.1% | 2.2%(+1.91)#35 | 3.5%(+0.545)#4,882 |
| 36. | 72116 | 4.0% | 2.2%(+1.83)#36 | 3.5%(+0.462)#5,079 |
| 37. | 72205 | 4.0% | 2.2%(+1.81)#37 | 3.5%(+0.439)#5,127 |
| 38. | 72473 | 3.9% | 2.2%(+1.79)#38 | 3.5%(+0.418)#5,171 |
| 39. | 72206 | 3.9% | 2.2%(+1.78)#39 | 3.5%(+0.414)#5,176 |
| 40. | 72641 | 3.9% | 2.2%(+1.74)#40 | 3.5%(+0.378)#5,245 |
| 41. | 72223 | 3.7% | 2.2%(+1.58)#41 | 3.5%(+0.210)#5,633 |
| 42. | 72411 | 3.7% | 2.2%(+1.57)#42 | 3.5%(+0.205)#5,644 |
| 43. | 72933 | 3.6% | 2.2%(+1.49)#43 | 3.5%(+0.125)#5,838 |
| 44. | 72758 | 3.6% | 2.2%(+1.45)#44 | 3.5%(+0.086)#5,936 |
| 45. | 72745 | 3.5% | 2.2%(+1.39)#45 | 3.5%(+0.021)#6,082 |
| 46. | 72704 | 3.5% | 2.2%(+1.37)#46 | 3.5%(+0.007)#6,128 |
| 47. | 72134 | 3.5% | 2.2%(+1.35)#47 | 3.5%(-0.016)#6,188 |
| 48. | 72132 | 3.5% | 2.2%(+1.35)#48 | 3.5%(-0.022)#6,200 |
| 49. | 72120 | 3.5% | 2.2%(+1.29)#49 | 3.5%(-0.074)#6,344 |
| 50. | 71602 | 3.4% | 2.2%(+1.28)#50 | 3.5%(-0.084)#6,369 |
| 51. | 72715 | 3.4% | 2.2%(+1.28)#51 | 3.5%(-0.087)#6,377 |
| 52. | 72125 | 3.4% | 2.2%(+1.26)#52 | 3.5%(-0.106)#6,428 |
| 53. | 71861 | 3.3% | 2.2%(+1.16)#53 | 3.5%(-0.202)#6,711 |
| 54. | 71647 | 3.3% | 2.2%(+1.15)#54 | 3.5%(-0.217)#6,751 |
| 55. | 72011 | 3.3% | 2.2%(+1.15)#55 | 3.5%(-0.220)#6,760 |
| 56. | 71740 | 3.3% | 2.2%(+1.13)#56 | 3.5%(-0.233)#6,810 |
| 57. | 72015 | 3.3% | 2.2%(+1.13)#57 | 3.5%(-0.235)#6,814 |
| 58. | 72211 | 3.3% | 2.2%(+1.09)#58 | 3.5%(-0.273)#6,932 |
| 59. | 72137 | 3.2% | 2.2%(+1.08)#59 | 3.5%(-0.289)#6,992 |
| 60. | 72032 | 3.2% | 2.2%(+1.04)#60 | 3.5%(-0.323)#7,086 |
| 61. | 72458 | 3.2% | 2.2%(+1.01)#61 | 3.5%(-0.357)#7,200 |
| 62. | 72601 | 3.1% | 2.2%(+0.991)#62 | 3.5%(-0.376)#7,269 |
| 63. | 72023 | 3.1% | 2.2%(+0.972)#63 | 3.5%(-0.395)#7,329 |
| 64. | 72921 | 3.0% | 2.2%(+0.880)#64 | 3.5%(-0.487)#7,613 |
| 65. | 72027 | 3.0% | 2.2%(+0.872)#65 | 3.5%(-0.494)#7,635 |
| 66. | 72106 | 3.0% | 2.2%(+0.869)#66 | 3.5%(-0.498)#7,649 |
| 67. | 72936 | 3.0% | 2.2%(+0.844)#67 | 3.5%(-0.522)#7,738 |
| 68. | 72354 | 3.0% | 2.2%(+0.843)#68 | 3.5%(-0.523)#7,741 |
| 69. | 72103 | 3.0% | 2.2%(+0.839)#69 | 3.5%(-0.527)#7,759 |
| 70. | 72122 | 2.9% | 2.2%(+0.759)#70 | 3.5%(-0.608)#8,048 |
| 71. | 72916 | 2.9% | 2.2%(+0.747)#71 | 3.5%(-0.620)#8,084 |
| 72. | 71640 | 2.9% | 2.2%(+0.725)#72 | 3.5%(-0.641)#8,160 |
| 73. | 72908 | 2.9% | 2.2%(+0.695)#73 | 3.5%(-0.672)#8,274 |
| 74. | 72762 | 2.8% | 2.2%(+0.632)#74 | 3.5%(-0.734)#8,489 |
| 75. | 71643 | 2.7% | 2.2%(+0.576)#75 | 3.5%(-0.790)#8,694 |
| 76. | 72554 | 2.7% | 2.2%(+0.508)#76 | 3.5%(-0.859)#8,967 |
| 77. | 72060 | 2.6% | 2.2%(+0.488)#77 | 3.5%(-0.879)#9,038 |
| 78. | 71860 | 2.6% | 2.2%(+0.413)#78 | 3.5%(-0.954)#9,321 |
| 79. | 72058 | 2.5% | 2.2%(+0.372)#79 | 3.5%(-0.995)#9,518 |
| 80. | 72619 | 2.5% | 2.2%(+0.347)#80 | 3.5%(-1.02)#9,623 |
| 81. | 72113 | 2.5% | 2.2%(+0.322)#81 | 3.5%(-1.04)#9,729 |
| 82. | 72227 | 2.5% | 2.2%(+0.298)#82 | 3.5%(-1.07)#9,818 |
| 83. | 72002 | 2.4% | 2.2%(+0.249)#83 | 3.5%(-1.12)#10,009 |
| 84. | 72774 | 2.4% | 2.2%(+0.243)#84 | 3.5%(-1.12)#10,033 |
| 85. | 72655 | 2.4% | 2.2%(+0.242)#85 | 3.5%(-1.12)#10,038 |
| 86. | 72034 | 2.4% | 2.2%(+0.234)#86 | 3.5%(-1.13)#10,068 |
| 87. | 72347 | 2.4% | 2.2%(+0.214)#87 | 3.5%(-1.15)#10,143 |
| 88. | 72858 | 2.4% | 2.2%(+0.211)#88 | 3.5%(-1.16)#10,158 |
| 89. | 71834 | 2.4% | 2.2%(+0.203)#89 | 3.5%(-1.16)#10,192 |
| 90. | 72949 | 2.4% | 2.2%(+0.198)#90 | 3.5%(-1.17)#10,206 |
| 91. | 72940 | 2.4% | 2.2%(+0.197)#91 | 3.5%(-1.17)#10,210 |
| 92. | 72903 | 2.3% | 2.2%(+0.168)#92 | 3.5%(-1.20)#10,335 |
| 93. | 72210 | 2.3% | 2.2%(+0.165)#93 | 3.5%(-1.20)#10,350 |
| 94. | 72443 | 2.3% | 2.2%(+0.162)#94 | 3.5%(-1.20)#10,368 |
| 95. | 72756 | 2.3% | 2.2%(+0.148)#95 | 3.5%(-1.22)#10,418 |
| 96. | 72956 | 2.3% | 2.2%(+0.141)#96 | 3.5%(-1.23)#10,450 |
| 97. | 72501 | 2.3% | 2.2%(+0.131)#97 | 3.5%(-1.24)#10,510 |
| 98. | 72952 | 2.3% | 2.2%(+0.129)#98 | 3.5%(-1.24)#10,524 |
| 99. | 72568 | 2.2% | 2.2%(+0.025)#99 | 3.5%(-1.34)#10,972 |
| 100. | 72938 | 2.2% | 2.2%(-0.005)#100 | 3.5%(-1.37)#11,106 |
Common Questions
What are the Top 10 Zip Codes with the Highest Percentage of Population Employed in Computer & Mathematics in Arkansas?
Top 10 Zip Codes with the Highest Percentage of Population Employed in Computer & Mathematics in Arkansas are:
What zip code has the Highest Percentage of Population Employed in Computer & Mathematics in Arkansas?
72713 has the Highest Percentage of Population Employed in Computer & Mathematics in Arkansas with 18.5%.
What is the Percentage of Population Employed in Computer & Mathematics in the State of Arkansas?
Percentage of Population Employed in Computer & Mathematics in Arkansas is 2.2%.
What is the Percentage of Population Employed in Computer & Mathematics in the United States?
Percentage of Population Employed in Computer & Mathematics in the United States is 3.5%.