Deltana, AK Map & Demographics
Deltana Map
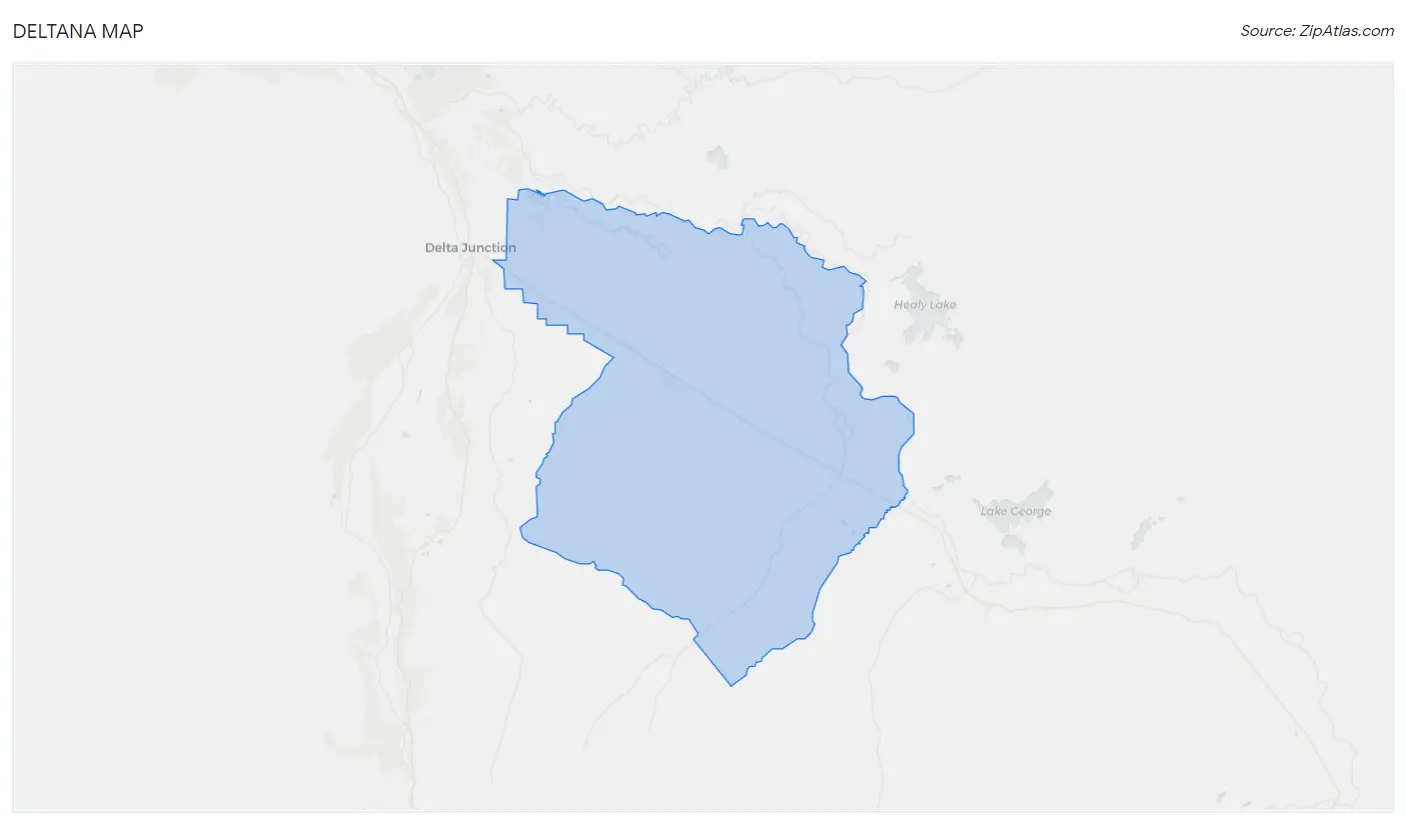
Deltana Overview
$34,958
PER CAPITA INCOME
$108,125
AVG FAMILY INCOME
$105,250
AVG HOUSEHOLD INCOME
47.0%
WAGE / INCOME GAP [ % ]
53.0¢/ $1
WAGE / INCOME GAP [ $ ]
0.35
INEQUALITY / GINI INDEX
2,059
TOTAL POPULATION
1,001
MALE POPULATION
1,058
FEMALE POPULATION
94.61
MALES / 100 FEMALES
105.69
FEMALES / 100 MALES
33.2
MEDIAN AGE
3.6
AVG FAMILY SIZE
3.2
AVG HOUSEHOLD SIZE
888
LABOR FORCE [ PEOPLE ]
62.4%
PERCENT IN LABOR FORCE
3.2%
UNEMPLOYMENT RATE
Income in Deltana
Income Overview in Deltana
Per Capita Income in Deltana is $34,958, while median incomes of families and households are $108,125 and $105,250 respectively.
| Characteristic | Number | Measure |
| Per Capita Income | 2,059 | $34,958 |
| Median Family Income | 527 | $108,125 |
| Mean Family Income | 527 | $111,905 |
| Median Household Income | 647 | $105,250 |
| Mean Household Income | 647 | $106,271 |
| Income Deficit | 527 | $0 |
| Wage / Income Gap (%) | 2,059 | 47.00% |
| Wage / Income Gap ($) | 2,059 | 53.00¢ per $1 |
| Gini / Inequality Index | 2,059 | 0.35 |
Earnings by Sex in Deltana
Average Earnings in Deltana are $55,523, $70,758 for men and $37,500 for women, a difference of 47.0%.
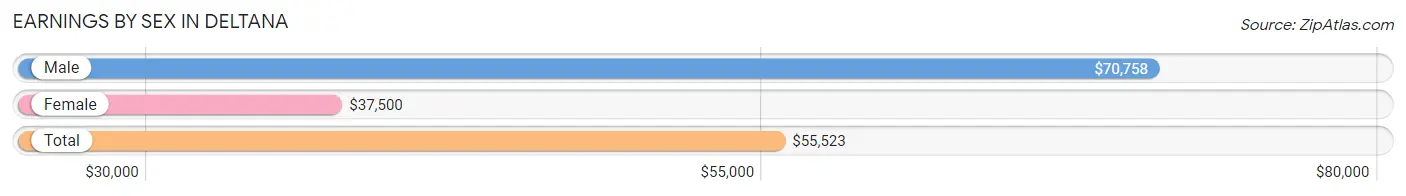
| Sex | Number | Average Earnings |
| Male | 552 (58.2%) | $70,758 |
| Female | 396 (41.8%) | $37,500 |
| Total | 948 (100.0%) | $55,523 |
Earnings by Sex by Income Bracket in Deltana
The most common earnings brackets in Deltana are $75,000 to $99,999 for men (118 | 21.4%) and $55,000 to $64,999 for women (70 | 17.7%).
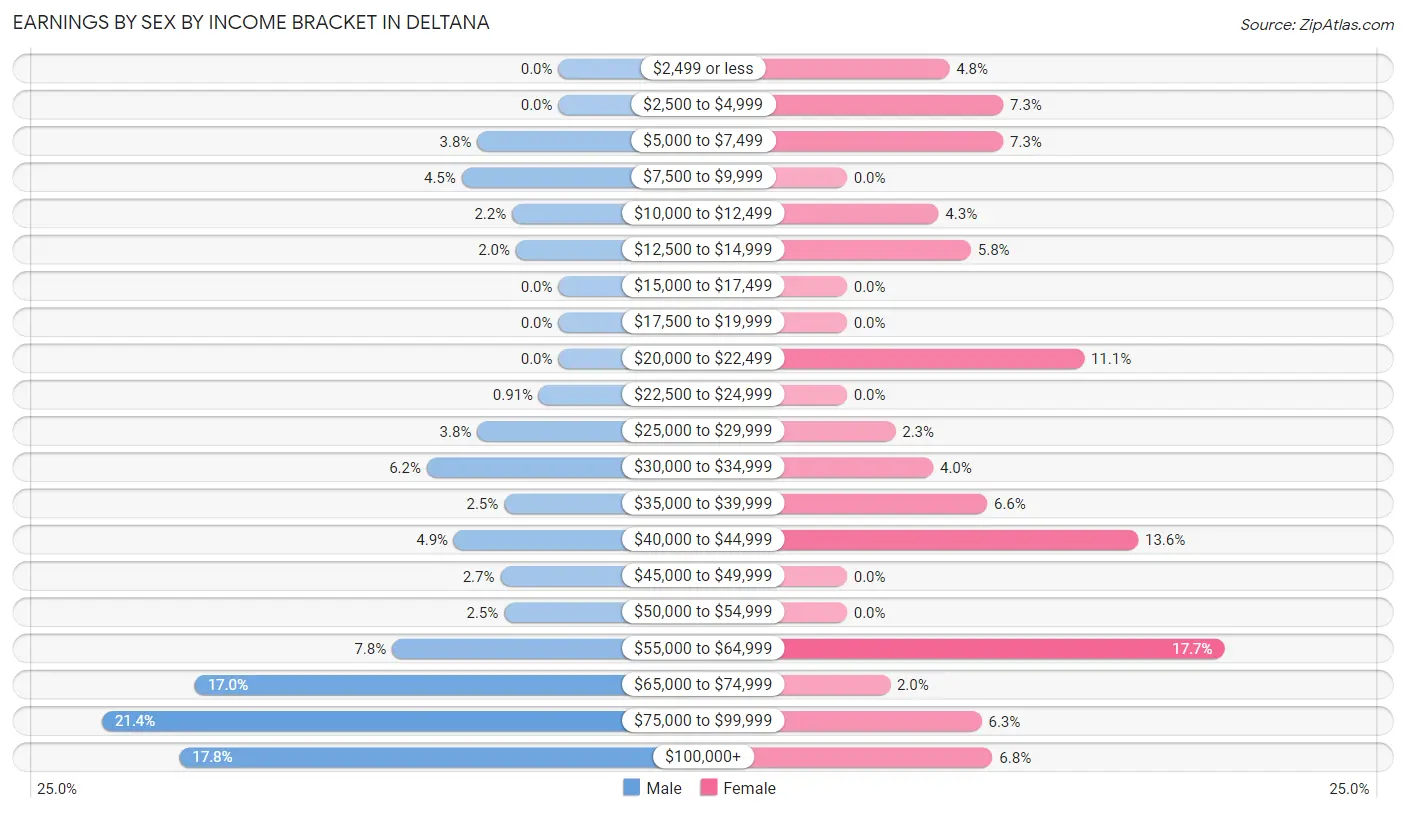
| Income | Male | Female |
| $2,499 or less | 0 (0.0%) | 19 (4.8%) |
| $2,500 to $4,999 | 0 (0.0%) | 29 (7.3%) |
| $5,000 to $7,499 | 21 (3.8%) | 29 (7.3%) |
| $7,500 to $9,999 | 25 (4.5%) | 0 (0.0%) |
| $10,000 to $12,499 | 12 (2.2%) | 17 (4.3%) |
| $12,500 to $14,999 | 11 (2.0%) | 23 (5.8%) |
| $15,000 to $17,499 | 0 (0.0%) | 0 (0.0%) |
| $17,500 to $19,999 | 0 (0.0%) | 0 (0.0%) |
| $20,000 to $22,499 | 0 (0.0%) | 44 (11.1%) |
| $22,500 to $24,999 | 5 (0.9%) | 0 (0.0%) |
| $25,000 to $29,999 | 21 (3.8%) | 9 (2.3%) |
| $30,000 to $34,999 | 34 (6.2%) | 16 (4.0%) |
| $35,000 to $39,999 | 14 (2.5%) | 26 (6.6%) |
| $40,000 to $44,999 | 27 (4.9%) | 54 (13.6%) |
| $45,000 to $49,999 | 15 (2.7%) | 0 (0.0%) |
| $50,000 to $54,999 | 14 (2.5%) | 0 (0.0%) |
| $55,000 to $64,999 | 43 (7.8%) | 70 (17.7%) |
| $65,000 to $74,999 | 94 (17.0%) | 8 (2.0%) |
| $75,000 to $99,999 | 118 (21.4%) | 25 (6.3%) |
| $100,000+ | 98 (17.7%) | 27 (6.8%) |
| Total | 552 (100.0%) | 396 (100.0%) |
Earnings by Sex by Educational Attainment in Deltana
Average earnings in Deltana are $72,045 for men and $40,417 for women, a difference of 43.9%. Men with an educational attainment of bachelor's degree enjoy the highest average annual earnings of $149,875, while those with college or associate's degree education earn the least with $57,000. Women with an educational attainment of high school diploma earn the most with the average annual earnings of $38,750, while those with high school diploma education have the smallest earnings of $38,750.
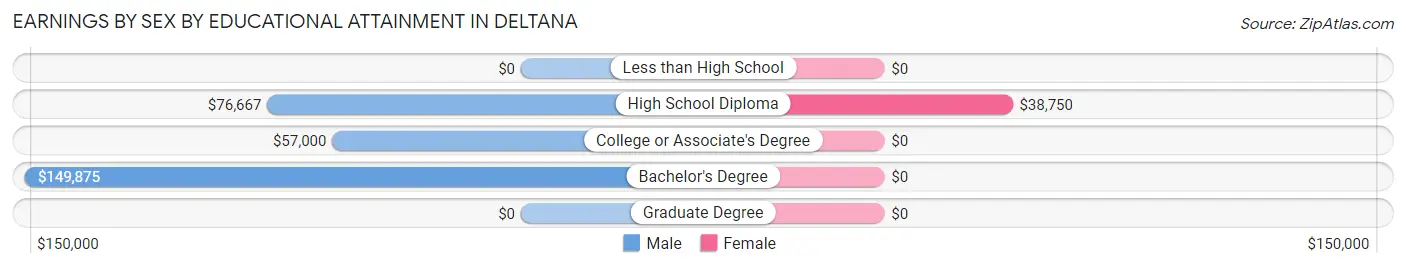
| Educational Attainment | Male Income | Female Income |
| Less than High School | - | - |
| High School Diploma | $76,667 | $38,750 |
| College or Associate's Degree | $57,000 | $0 |
| Bachelor's Degree | $149,875 | $0 |
| Graduate Degree | - | - |
| Total | $72,045 | $40,417 |
Family Income in Deltana
Family Income Brackets in Deltana
According to the Deltana family income data, there are 178 families falling into the $100,000 to $149,999 income range, which is the most common income bracket and makes up 33.8% of all families. Conversely, the $25,000 to $34,999 income bracket is the least frequent group with only 3 families (0.6%) belonging to this category.
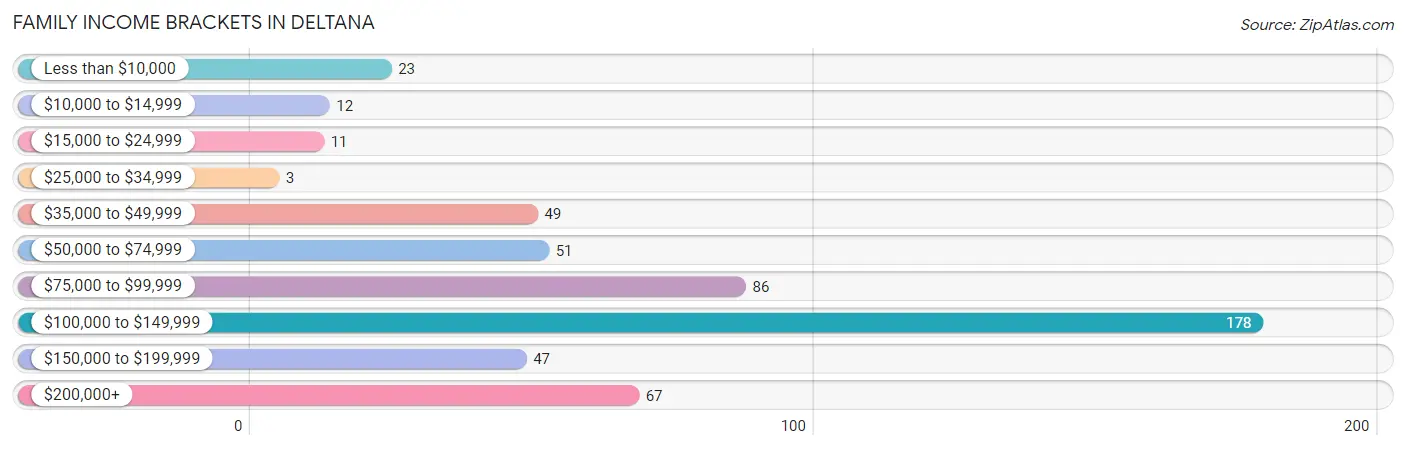
| Income Bracket | # Families | % Families |
| Less than $10,000 | 23 | 4.4% |
| $10,000 to $14,999 | 12 | 2.3% |
| $15,000 to $24,999 | 11 | 2.1% |
| $25,000 to $34,999 | 3 | 0.6% |
| $35,000 to $49,999 | 49 | 9.3% |
| $50,000 to $74,999 | 51 | 9.7% |
| $75,000 to $99,999 | 86 | 16.3% |
| $100,000 to $149,999 | 178 | 33.8% |
| $150,000 to $199,999 | 47 | 8.9% |
| $200,000+ | 67 | 12.7% |
Family Income by Famaliy Size in Deltana
4-person families (76 | 14.4%) account for the highest median family income in Deltana with $130,385 per family, while 2-person families (171 | 32.5%) have the highest median income of $50,062 per family member.
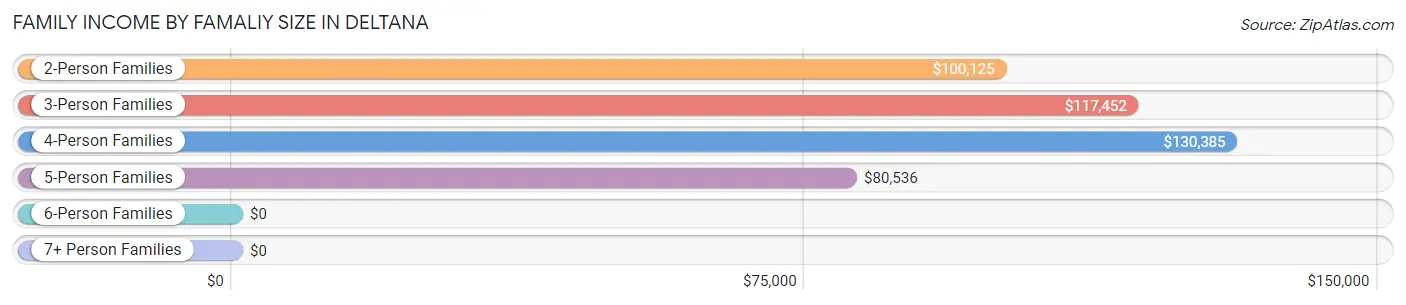
| Income Bracket | # Families | Median Income |
| 2-Person Families | 171 (32.5%) | $100,125 |
| 3-Person Families | 127 (24.1%) | $117,452 |
| 4-Person Families | 76 (14.4%) | $130,385 |
| 5-Person Families | 133 (25.2%) | $80,536 |
| 6-Person Families | 9 (1.7%) | $0 |
| 7+ Person Families | 11 (2.1%) | $0 |
| Total | 527 (100.0%) | $108,125 |
Family Income by Number of Earners in Deltana
The median family income in Deltana is $108,125, with families comprising 3+ earners (78) having the highest median family income of $176,071, while families with no earners (100) have the lowest median family income of $64,500, accounting for 14.8% and 19.0% of families, respectively.
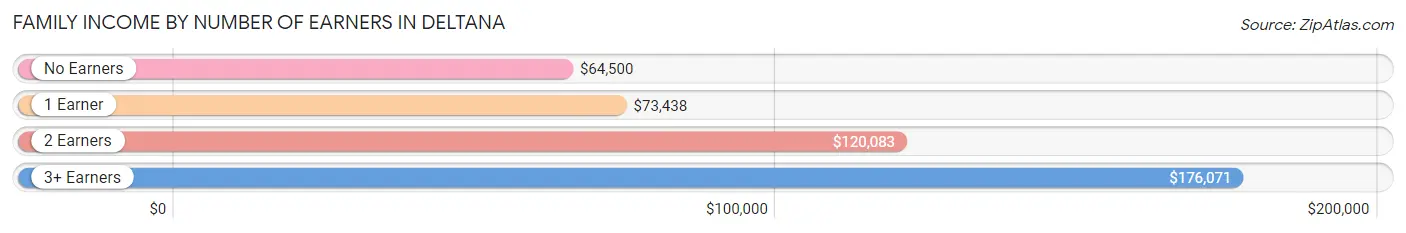
| Number of Earners | # Families | Median Income |
| No Earners | 100 (19.0%) | $64,500 |
| 1 Earner | 152 (28.8%) | $73,438 |
| 2 Earners | 197 (37.4%) | $120,083 |
| 3+ Earners | 78 (14.8%) | $176,071 |
| Total | 527 (100.0%) | $108,125 |
Household Income in Deltana
Household Income Brackets in Deltana
With 208 households falling in the category, the $100,000 to $149,999 income range is the most frequent in Deltana, accounting for 32.2% of all households. In contrast, only 12 households (1.8%) fall into the $10,000 to $14,999 income bracket, making it the least populous group.
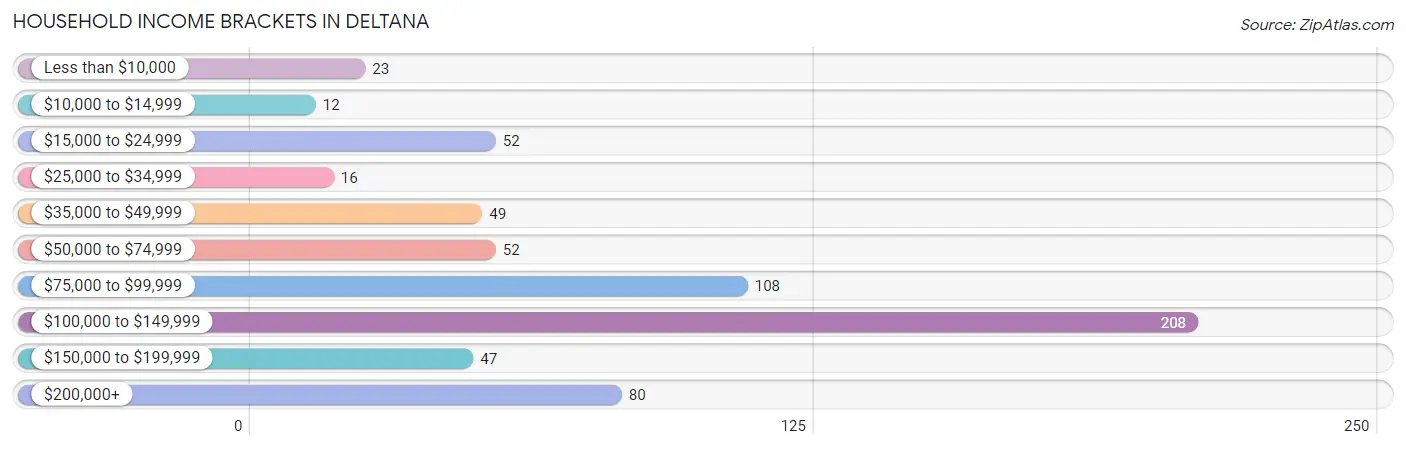
| Income Bracket | # Households | % Households |
| Less than $10,000 | 23 | 3.6% |
| $10,000 to $14,999 | 12 | 1.9% |
| $15,000 to $24,999 | 52 | 8.0% |
| $25,000 to $34,999 | 16 | 2.5% |
| $35,000 to $49,999 | 49 | 7.6% |
| $50,000 to $74,999 | 52 | 8.0% |
| $75,000 to $99,999 | 108 | 16.7% |
| $100,000 to $149,999 | 208 | 32.1% |
| $150,000 to $199,999 | 47 | 7.3% |
| $200,000+ | 80 | 12.4% |
Household Income by Householder Age in Deltana
The median household income in Deltana is $105,250, with the highest median household income of $113,200 found in the 45 to 64 years age bracket for the primary householder. A total of 226 households (34.9%) fall into this category. Meanwhile, the 15 to 24 years age bracket for the primary householder has the lowest median household income of $0, with 5 households (0.8%) in this group.
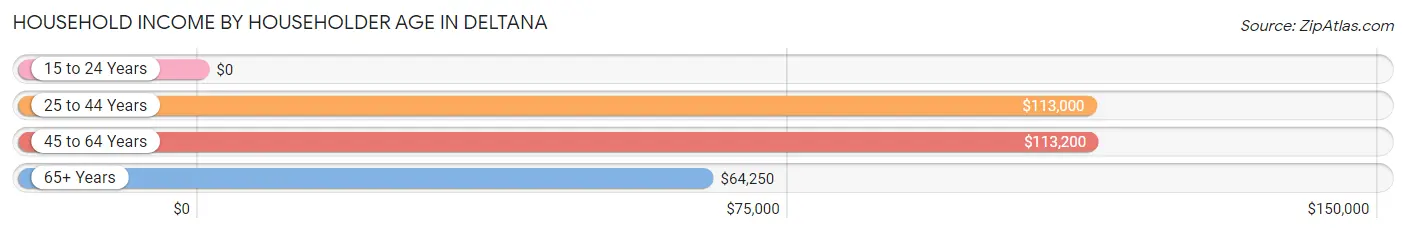
| Income Bracket | # Households | Median Income |
| 15 to 24 Years | 5 (0.8%) | $0 |
| 25 to 44 Years | 274 (42.3%) | $113,000 |
| 45 to 64 Years | 226 (34.9%) | $113,200 |
| 65+ Years | 142 (22.0%) | $64,250 |
| Total | 647 (100.0%) | $105,250 |
Poverty in Deltana
Income Below Poverty by Sex and Age in Deltana
With 10.8% poverty level for males and 11.8% for females among the residents of Deltana, under 5 year old males and under 5 year old females are the most vulnerable to poverty, with 28 males (57.1%) and 36 females (31.0%) in their respective age groups living below the poverty level.
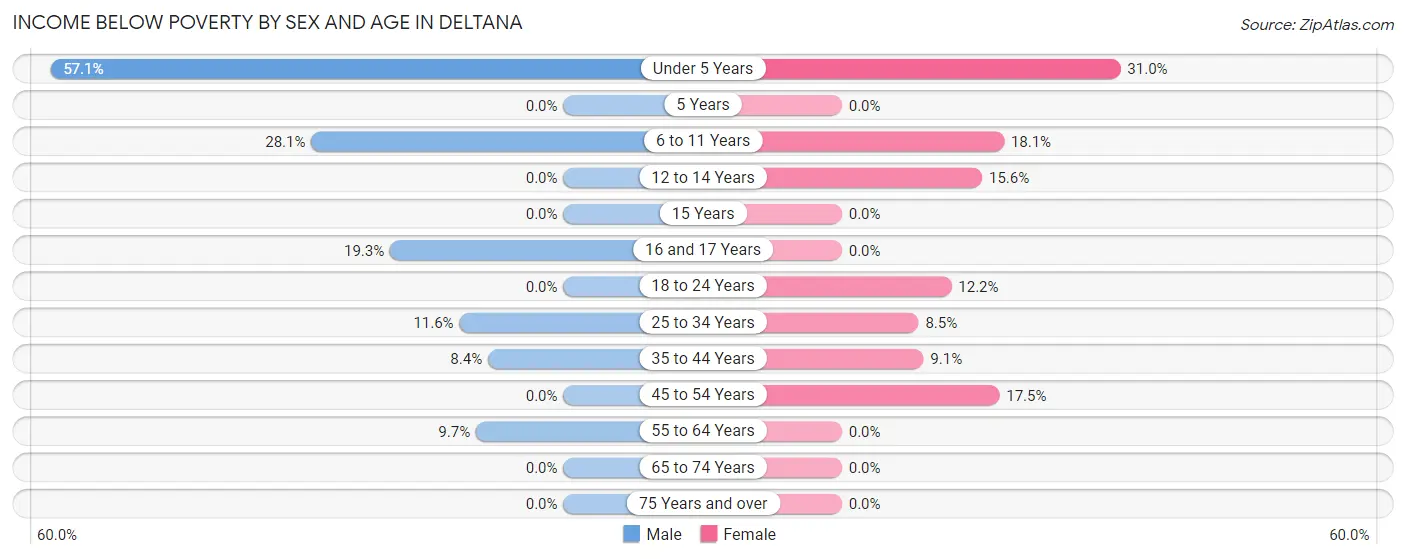
| Age Bracket | Male | Female |
| Under 5 Years | 28 (57.1%) | 36 (31.0%) |
| 5 Years | 0 (0.0%) | 0 (0.0%) |
| 6 to 11 Years | 32 (28.1%) | 26 (18.1%) |
| 12 to 14 Years | 0 (0.0%) | 10 (15.6%) |
| 15 Years | 0 (0.0%) | 0 (0.0%) |
| 16 and 17 Years | 11 (19.3%) | 0 (0.0%) |
| 18 to 24 Years | 0 (0.0%) | 5 (12.2%) |
| 25 to 34 Years | 14 (11.6%) | 14 (8.5%) |
| 35 to 44 Years | 12 (8.4%) | 13 (9.1%) |
| 45 to 54 Years | 0 (0.0%) | 20 (17.5%) |
| 55 to 64 Years | 11 (9.7%) | 0 (0.0%) |
| 65 to 74 Years | 0 (0.0%) | 0 (0.0%) |
| 75 Years and over | 0 (0.0%) | 0 (0.0%) |
| Total | 108 (10.8%) | 124 (11.8%) |
Income Above Poverty by Sex and Age in Deltana
According to the poverty statistics in Deltana, males aged 5 years and females aged 5 years are the age groups that are most secure financially, with 100.0% of males and 100.0% of females in these age groups living above the poverty line.
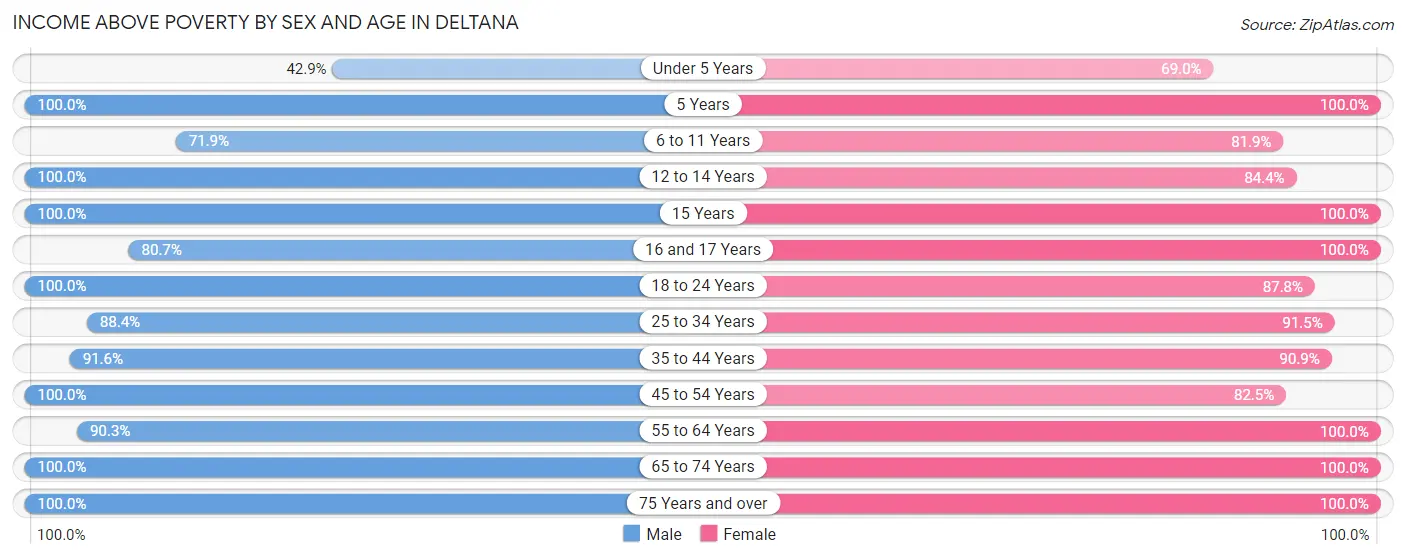
| Age Bracket | Male | Female |
| Under 5 Years | 21 (42.9%) | 80 (69.0%) |
| 5 Years | 36 (100.0%) | 46 (100.0%) |
| 6 to 11 Years | 82 (71.9%) | 118 (81.9%) |
| 12 to 14 Years | 36 (100.0%) | 54 (84.4%) |
| 15 Years | 12 (100.0%) | 8 (100.0%) |
| 16 and 17 Years | 46 (80.7%) | 33 (100.0%) |
| 18 to 24 Years | 41 (100.0%) | 36 (87.8%) |
| 25 to 34 Years | 107 (88.4%) | 150 (91.5%) |
| 35 to 44 Years | 131 (91.6%) | 130 (90.9%) |
| 45 to 54 Years | 171 (100.0%) | 94 (82.5%) |
| 55 to 64 Years | 102 (90.3%) | 58 (100.0%) |
| 65 to 74 Years | 68 (100.0%) | 105 (100.0%) |
| 75 Years and over | 40 (100.0%) | 11 (100.0%) |
| Total | 893 (89.2%) | 923 (88.2%) |
Income Below Poverty Among Married-Couple Families in Deltana
The poverty statistics for married-couple families in Deltana show that 8.1% or 37 of the total 458 families live below the poverty line. Families with 3 or 4 children have the highest poverty rate of 24.5%, comprising of 26 families. On the other hand, families with 1 or 2 children have the lowest poverty rate of 0.0%, which includes 0 families.
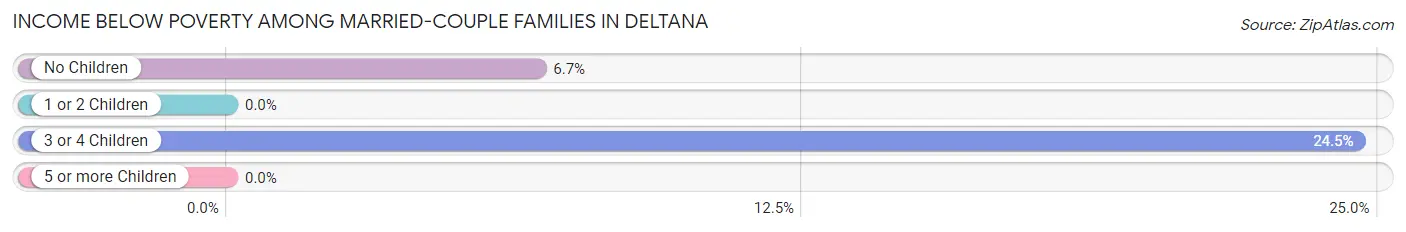
| Children | Above Poverty | Below Poverty |
| No Children | 153 (93.3%) | 11 (6.7%) |
| 1 or 2 Children | 177 (100.0%) | 0 (0.0%) |
| 3 or 4 Children | 80 (75.5%) | 26 (24.5%) |
| 5 or more Children | 11 (100.0%) | 0 (0.0%) |
| Total | 421 (91.9%) | 37 (8.1%) |
Income Below Poverty Among Single-Parent Households in Deltana
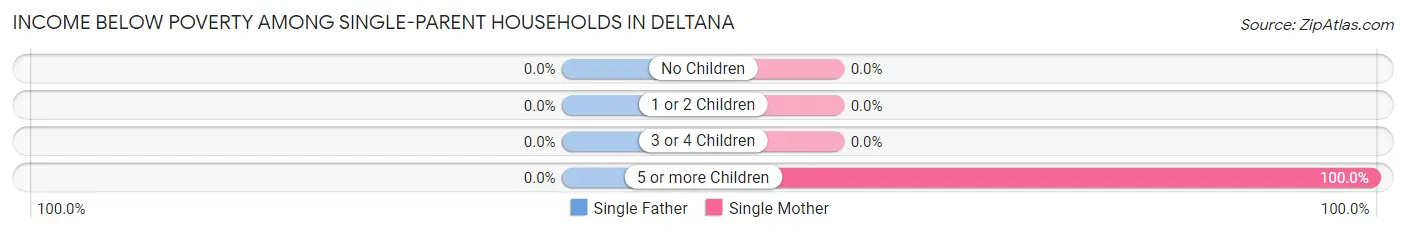
| Children | Single Father | Single Mother |
| No Children | 0 (0.0%) | 0 (0.0%) |
| 1 or 2 Children | 0 (0.0%) | 0 (0.0%) |
| 3 or 4 Children | 0 (0.0%) | 0 (0.0%) |
| 5 or more Children | 0 (0.0%) | 9 (100.0%) |
| Total | 0 (0.0%) | 9 (29.0%) |
Income Below Poverty Among Married-Couple vs Single-Parent Households in Deltana
The poverty data for Deltana shows that 37 of the married-couple family households (8.1%) and 9 of the single-parent households (13.0%) are living below the poverty level. Within the married-couple family households, those with 3 or 4 children have the highest poverty rate, with 26 households (24.5%) falling below the poverty line. Among the single-parent households, those with 5 or more children have the highest poverty rate, with 9 household (100.0%) living below poverty.
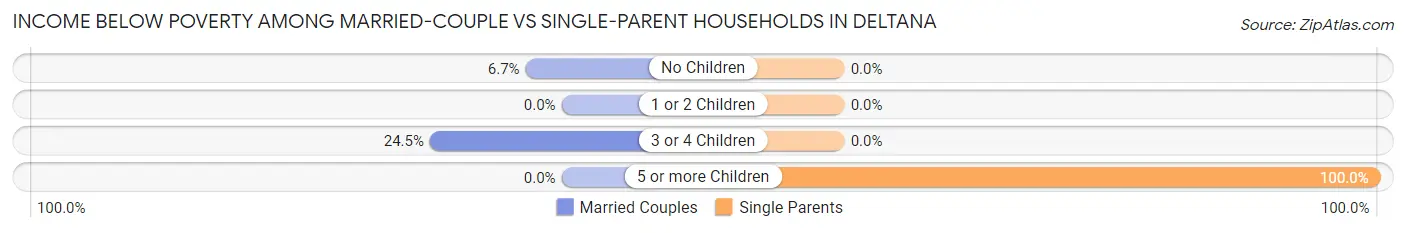
| Children | Married-Couple Families | Single-Parent Households |
| No Children | 11 (6.7%) | 0 (0.0%) |
| 1 or 2 Children | 0 (0.0%) | 0 (0.0%) |
| 3 or 4 Children | 26 (24.5%) | 0 (0.0%) |
| 5 or more Children | 0 (0.0%) | 9 (100.0%) |
| Total | 37 (8.1%) | 9 (13.0%) |
Race in Deltana
The most populous races in Deltana are White / Caucasian (1,810 | 87.9%), Hispanic or Latino (173 | 8.4%), and Some other Race (93 | 4.5%).
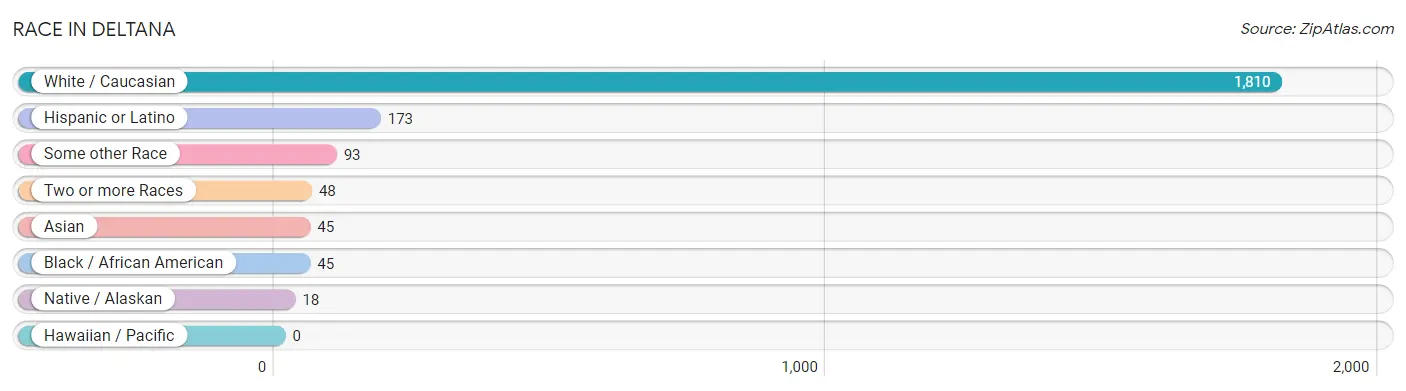
| Race | # Population | % Population |
| Asian | 45 | 2.2% |
| Black / African American | 45 | 2.2% |
| Hawaiian / Pacific | 0 | 0.0% |
| Hispanic or Latino | 173 | 8.4% |
| Native / Alaskan | 18 | 0.9% |
| White / Caucasian | 1,810 | 87.9% |
| Two or more Races | 48 | 2.3% |
| Some other Race | 93 | 4.5% |
| Total | 2,059 | 100.0% |
Ancestry in Deltana
The most populous ancestries reported in Deltana are German (496 | 24.1%), Irish (385 | 18.7%), English (210 | 10.2%), Ukrainian (197 | 9.6%), and Russian (177 | 8.6%), together accounting for 71.2% of all Deltana residents.
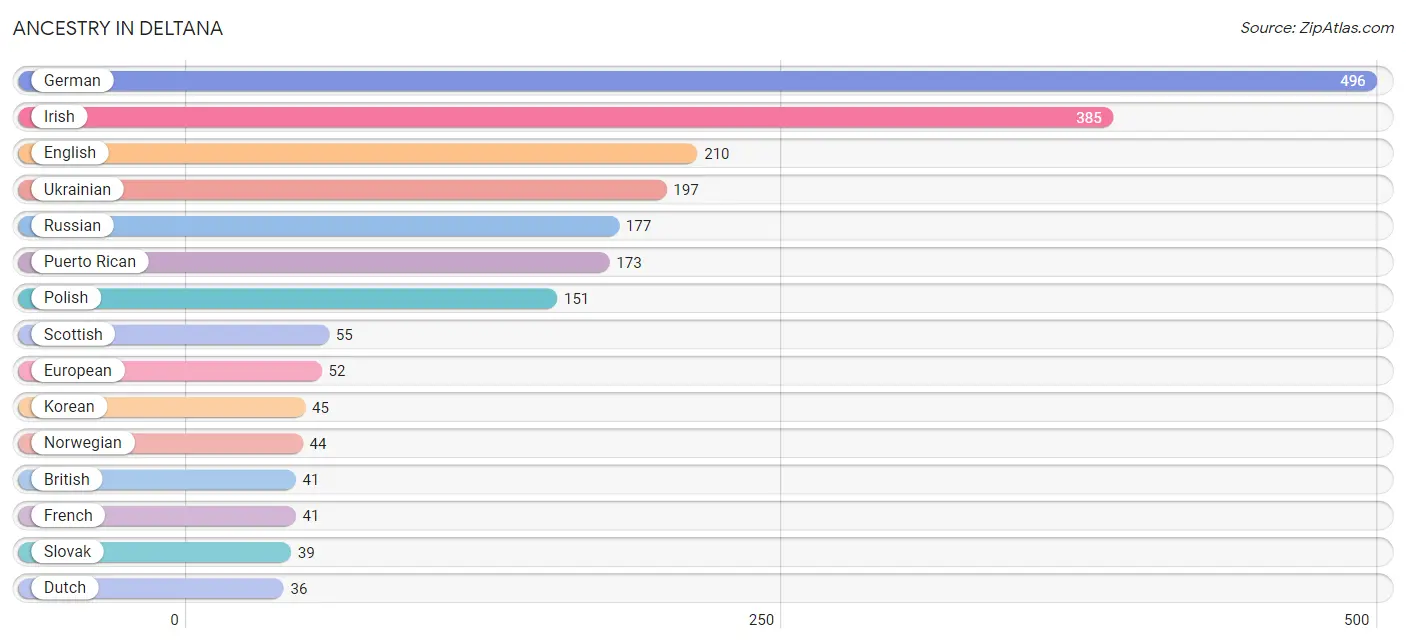
| Ancestry | # Population | % Population |
| African | 8 | 0.4% |
| British | 41 | 2.0% |
| Cherokee | 6 | 0.3% |
| Dutch | 36 | 1.8% |
| Eastern European | 18 | 0.9% |
| English | 210 | 10.2% |
| European | 52 | 2.5% |
| French | 41 | 2.0% |
| German | 496 | 24.1% |
| Hungarian | 8 | 0.4% |
| Inupiat | 24 | 1.2% |
| Irish | 385 | 18.7% |
| Italian | 13 | 0.6% |
| Korean | 45 | 2.2% |
| Norwegian | 44 | 2.1% |
| Polish | 151 | 7.3% |
| Puerto Rican | 173 | 8.4% |
| Romanian | 11 | 0.5% |
| Russian | 177 | 8.6% |
| Scandinavian | 35 | 1.7% |
| Scotch-Irish | 27 | 1.3% |
| Scottish | 55 | 2.7% |
| Slovak | 39 | 1.9% |
| Subsaharan African | 8 | 0.4% |
| Swedish | 23 | 1.1% |
| Ukrainian | 197 | 9.6% |
| Yup'ik | 9 | 0.4% | View All 27 Rows |
Immigrants in Deltana
The most numerous immigrant groups reported in Deltana came from Europe (133 | 6.5%), Eastern Europe (106 | 5.1%), Ukraine (68 | 3.3%), Asia (67 | 3.3%), and Philippines (45 | 2.2%), together accounting for 20.4% of all Deltana residents.
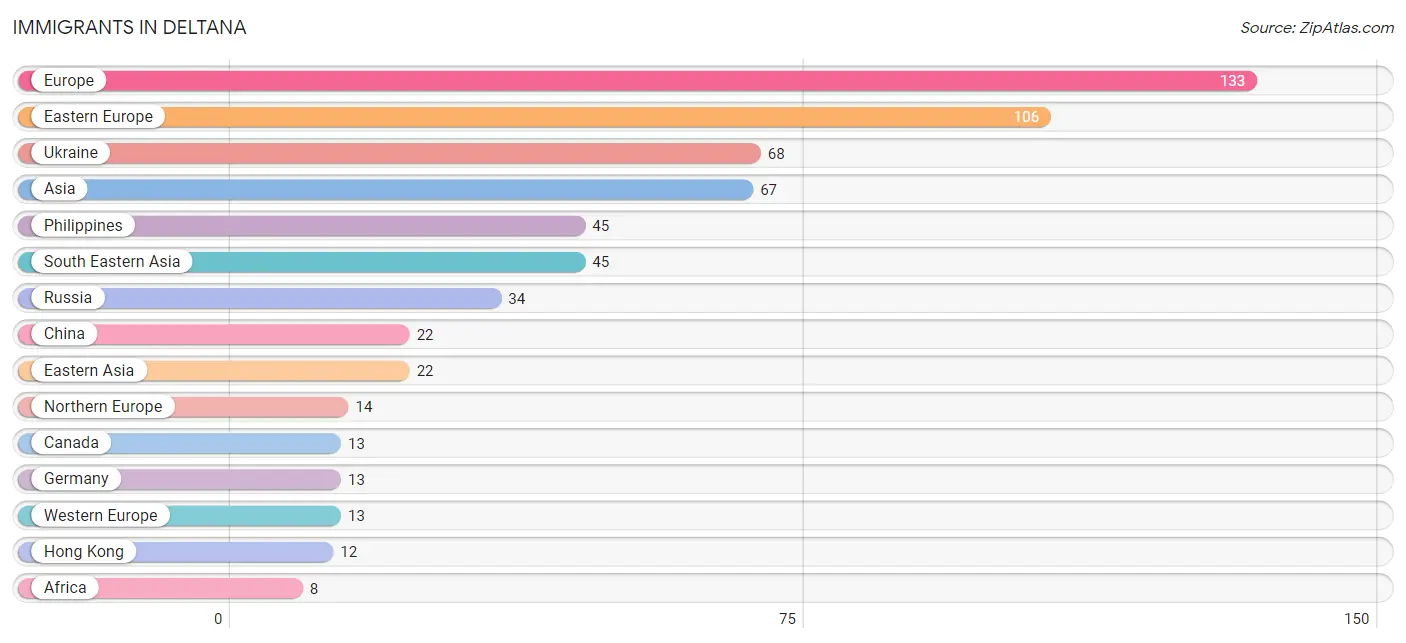
| Immigration Origin | # Population | % Population |
| Africa | 8 | 0.4% |
| Asia | 67 | 3.3% |
| Canada | 13 | 0.6% |
| China | 22 | 1.1% |
| Eastern Africa | 8 | 0.4% |
| Eastern Asia | 22 | 1.1% |
| Eastern Europe | 106 | 5.1% |
| Europe | 133 | 6.5% |
| Germany | 13 | 0.6% |
| Hong Kong | 12 | 0.6% |
| Moldova | 4 | 0.2% |
| Northern Europe | 14 | 0.7% |
| Philippines | 45 | 2.2% |
| Russia | 34 | 1.7% |
| South Eastern Asia | 45 | 2.2% |
| Uganda | 8 | 0.4% |
| Ukraine | 68 | 3.3% |
| Western Europe | 13 | 0.6% | View All 18 Rows |
Sex and Age in Deltana
Sex and Age in Deltana
The most populous age groups in Deltana are 5 to 9 Years (122 | 12.2%) for men and 10 to 14 Years (147 | 13.9%) for women.
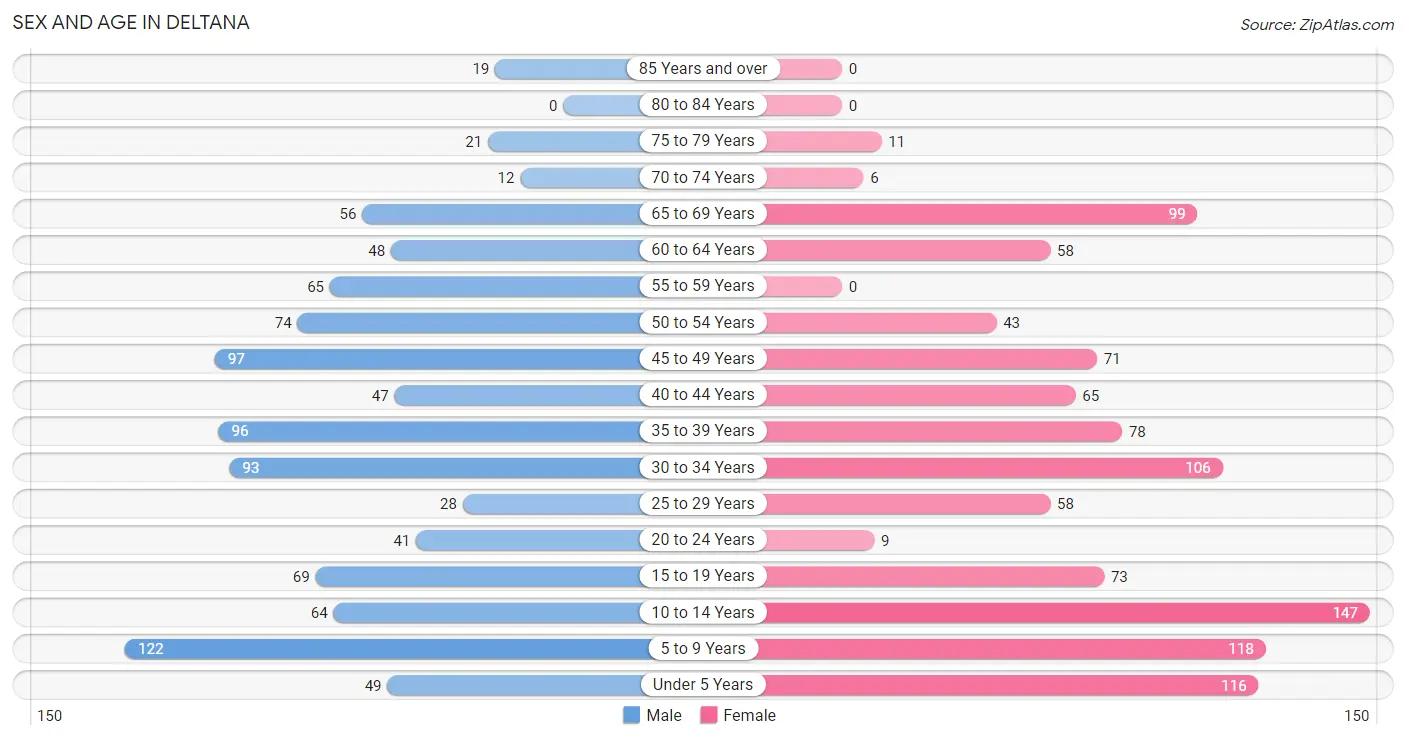
| Age Bracket | Male | Female |
| Under 5 Years | 49 (4.9%) | 116 (11.0%) |
| 5 to 9 Years | 122 (12.2%) | 118 (11.2%) |
| 10 to 14 Years | 64 (6.4%) | 147 (13.9%) |
| 15 to 19 Years | 69 (6.9%) | 73 (6.9%) |
| 20 to 24 Years | 41 (4.1%) | 9 (0.9%) |
| 25 to 29 Years | 28 (2.8%) | 58 (5.5%) |
| 30 to 34 Years | 93 (9.3%) | 106 (10.0%) |
| 35 to 39 Years | 96 (9.6%) | 78 (7.4%) |
| 40 to 44 Years | 47 (4.7%) | 65 (6.1%) |
| 45 to 49 Years | 97 (9.7%) | 71 (6.7%) |
| 50 to 54 Years | 74 (7.4%) | 43 (4.1%) |
| 55 to 59 Years | 65 (6.5%) | 0 (0.0%) |
| 60 to 64 Years | 48 (4.8%) | 58 (5.5%) |
| 65 to 69 Years | 56 (5.6%) | 99 (9.4%) |
| 70 to 74 Years | 12 (1.2%) | 6 (0.6%) |
| 75 to 79 Years | 21 (2.1%) | 11 (1.0%) |
| 80 to 84 Years | 0 (0.0%) | 0 (0.0%) |
| 85 Years and over | 19 (1.9%) | 0 (0.0%) |
| Total | 1,001 (100.0%) | 1,058 (100.0%) |
Families and Households in Deltana
Median Family Size in Deltana
The median family size in Deltana is 3.62 persons per family, with single female/mother families (31 | 5.9%) accounting for the largest median family size of 5.65 persons per family. On the other hand, single male/father families (38 | 7.2%) represent the smallest median family size with 3.39 persons per family.
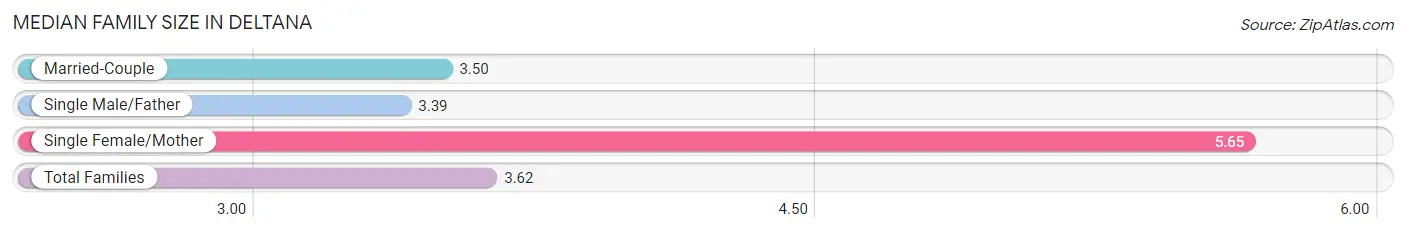
| Family Type | # Families | Family Size |
| Married-Couple | 458 (86.9%) | 3.50 |
| Single Male/Father | 38 (7.2%) | 3.39 |
| Single Female/Mother | 31 (5.9%) | 5.65 |
| Total Families | 527 (100.0%) | 3.62 |
Median Household Size in Deltana
The median household size in Deltana is 3.18 persons per household, with single female/mother households (31 | 4.8%) accounting for the largest median household size of 5.65 persons per household. non-family households (120 | 18.5%) represent the smallest median household size with 1.23 persons per household.
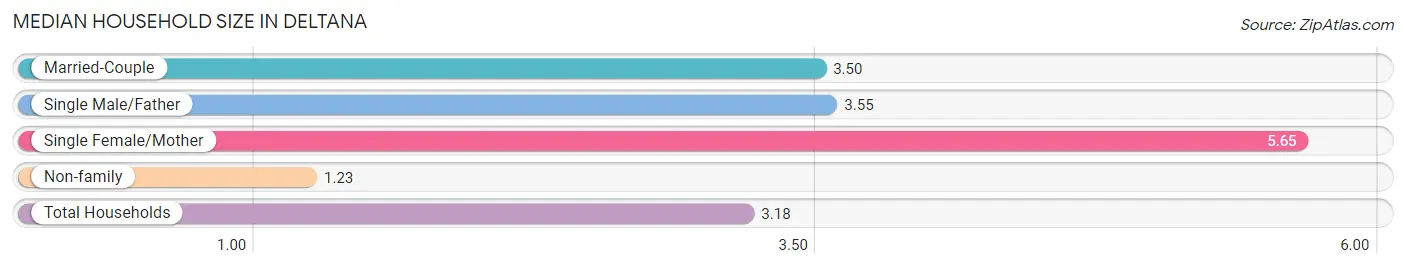
| Household Type | # Households | Household Size |
| Married-Couple | 458 (70.8%) | 3.50 |
| Single Male/Father | 38 (5.9%) | 3.55 |
| Single Female/Mother | 31 (4.8%) | 5.65 |
| Non-family | 120 (18.5%) | 1.23 |
| Total Households | 647 (100.0%) | 3.18 |
Household Size by Marriage Status in Deltana
Out of a total of 647 households in Deltana, 527 (81.5%) are family households, while 120 (18.5%) are nonfamily households. The most numerous type of family households are 2-person households, comprising 171, and the most common type of nonfamily households are 1-person households, comprising 97.
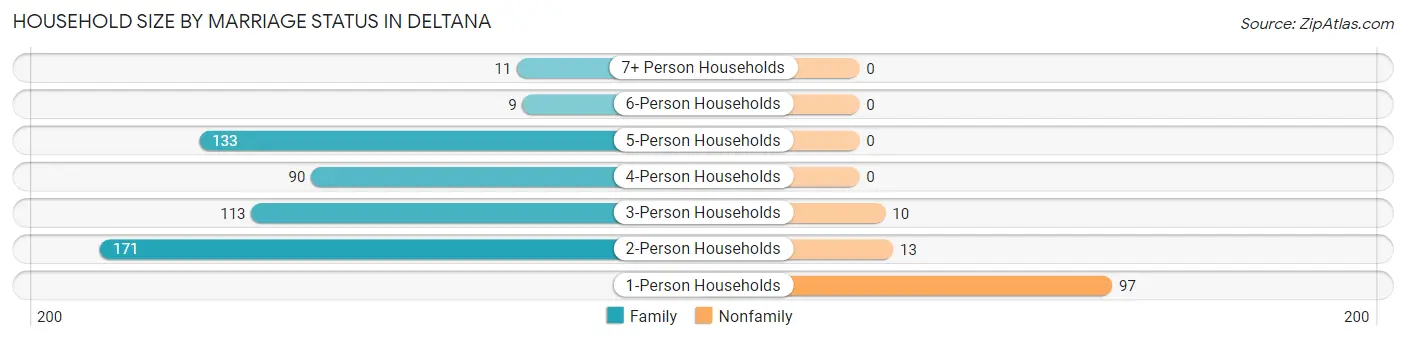
| Household Size | Family Households | Nonfamily Households |
| 1-Person Households | - | 97 (15.0%) |
| 2-Person Households | 171 (26.4%) | 13 (2.0%) |
| 3-Person Households | 113 (17.5%) | 10 (1.5%) |
| 4-Person Households | 90 (13.9%) | 0 (0.0%) |
| 5-Person Households | 133 (20.6%) | 0 (0.0%) |
| 6-Person Households | 9 (1.4%) | 0 (0.0%) |
| 7+ Person Households | 11 (1.7%) | 0 (0.0%) |
| Total | 527 (81.5%) | 120 (18.5%) |
Female Fertility in Deltana
Fertility by Age in Deltana
Average fertility rate in Deltana is 47.0 births per 1,000 women. Women in the age bracket of 20 to 34 years have the highest fertility rate with 127.0 births per 1,000 women. Women in the age bracket of 20 to 34 years acount for 100.0% of all women with births.
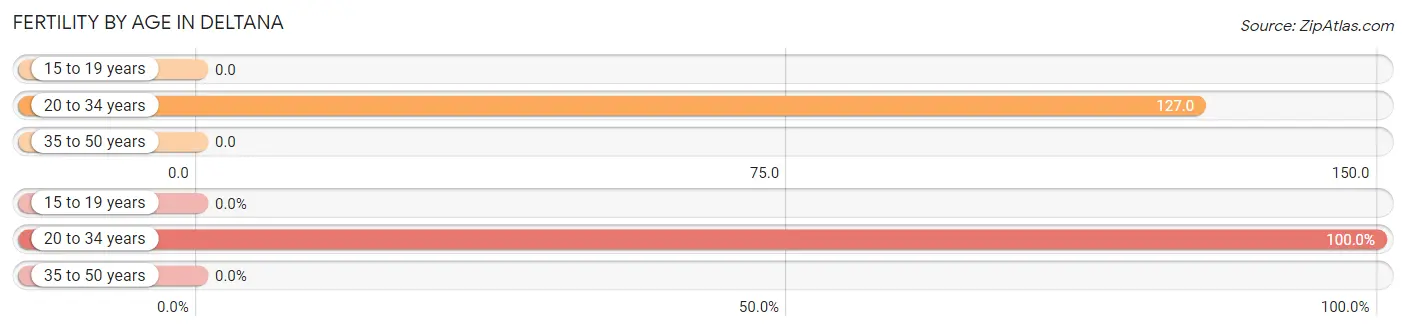
| Age Bracket | Women with Births | Births / 1,000 Women |
| 15 to 19 years | 0 (0.0%) | 0.0 |
| 20 to 34 years | 22 (100.0%) | 127.0 |
| 35 to 50 years | 0 (0.0%) | 0.0 |
| Total | 22 (100.0%) | 47.0 |
Fertility by Age by Marriage Status in Deltana
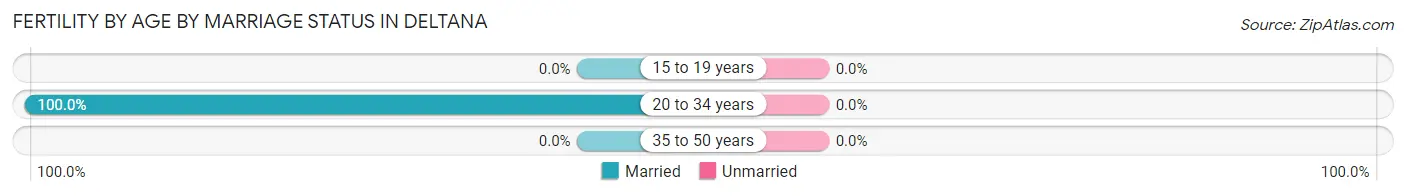
| Age Bracket | Married | Unmarried |
| 15 to 19 years | 0 (0.0%) | 0 (0.0%) |
| 20 to 34 years | 22 (100.0%) | 0 (0.0%) |
| 35 to 50 years | 0 (0.0%) | 0 (0.0%) |
| Total | 22 (100.0%) | 0 (0.0%) |
Fertility by Education in Deltana
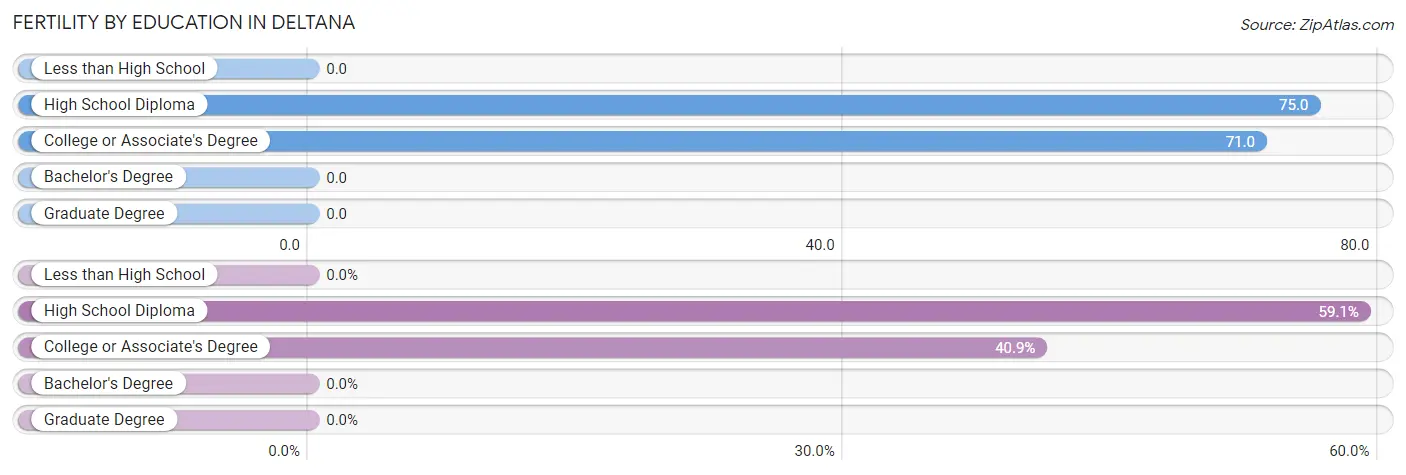
| Educational Attainment | Women with Births | Births / 1,000 Women |
| Less than High School | 0 (0.0%) | 0.0 |
| High School Diploma | 13 (59.1%) | 75.0 |
| College or Associate's Degree | 9 (40.9%) | 71.0 |
| Bachelor's Degree | 0 (0.0%) | 0.0 |
| Graduate Degree | 0 (0.0%) | 0.0 |
| Total | 22 (100.0%) | 47.0 |
Fertility by Education by Marriage Status in Deltana
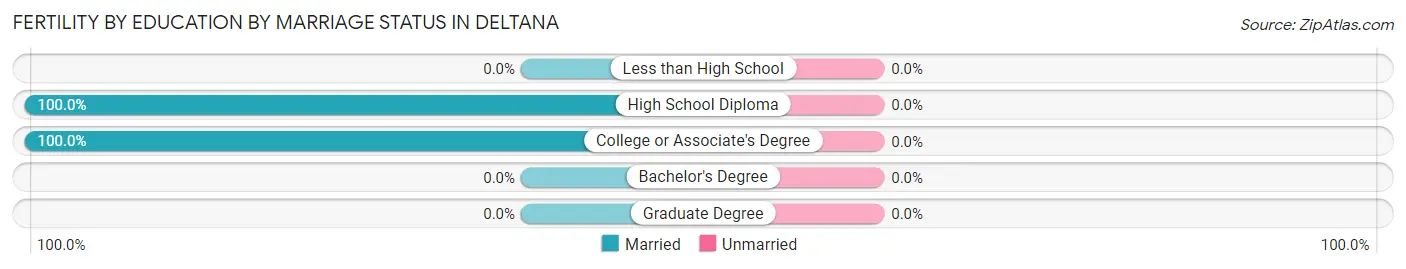
| Educational Attainment | Married | Unmarried |
| Less than High School | 0 (0.0%) | 0 (0.0%) |
| High School Diploma | 13 (100.0%) | 0 (0.0%) |
| College or Associate's Degree | 9 (100.0%) | 0 (0.0%) |
| Bachelor's Degree | 0 (0.0%) | 0 (0.0%) |
| Graduate Degree | 0 (0.0%) | 0 (0.0%) |
| Total | 22 (100.0%) | 0 (0.0%) |
Employment Characteristics in Deltana
Employment by Class of Employer in Deltana
Among the 812 employed individuals in Deltana, private company employees (362 | 44.6%), federal government employees (192 | 23.6%), and local government employees (136 | 16.8%) make up the most common classes of employment.
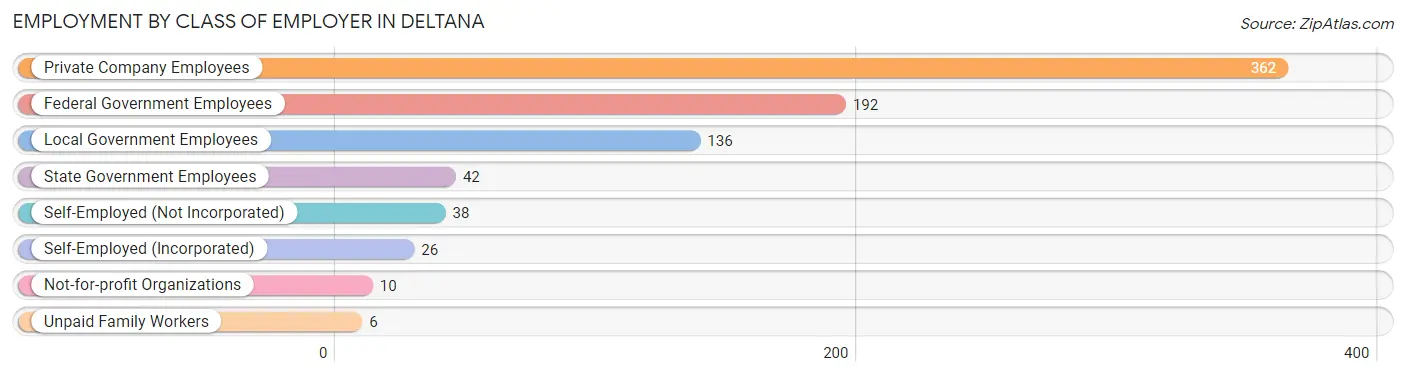
| Employer Class | # Employees | % Employees |
| Private Company Employees | 362 | 44.6% |
| Self-Employed (Incorporated) | 26 | 3.2% |
| Self-Employed (Not Incorporated) | 38 | 4.7% |
| Not-for-profit Organizations | 10 | 1.2% |
| Local Government Employees | 136 | 16.8% |
| State Government Employees | 42 | 5.2% |
| Federal Government Employees | 192 | 23.6% |
| Unpaid Family Workers | 6 | 0.7% |
| Total | 812 | 100.0% |
Employment Status by Age in Deltana
According to the labor force statistics for Deltana, out of the total population over 16 years of age (1,423), 62.4% or 888 individuals are in the labor force, with 3.2% or 28 of them unemployed. The age group with the highest labor force participation rate is 25 to 29 years, with 100.0% or 86 individuals in the labor force. Within the labor force, the 25 to 29 years age range has the highest percentage of unemployed individuals, with 16.3% or 14 of them being unemployed.
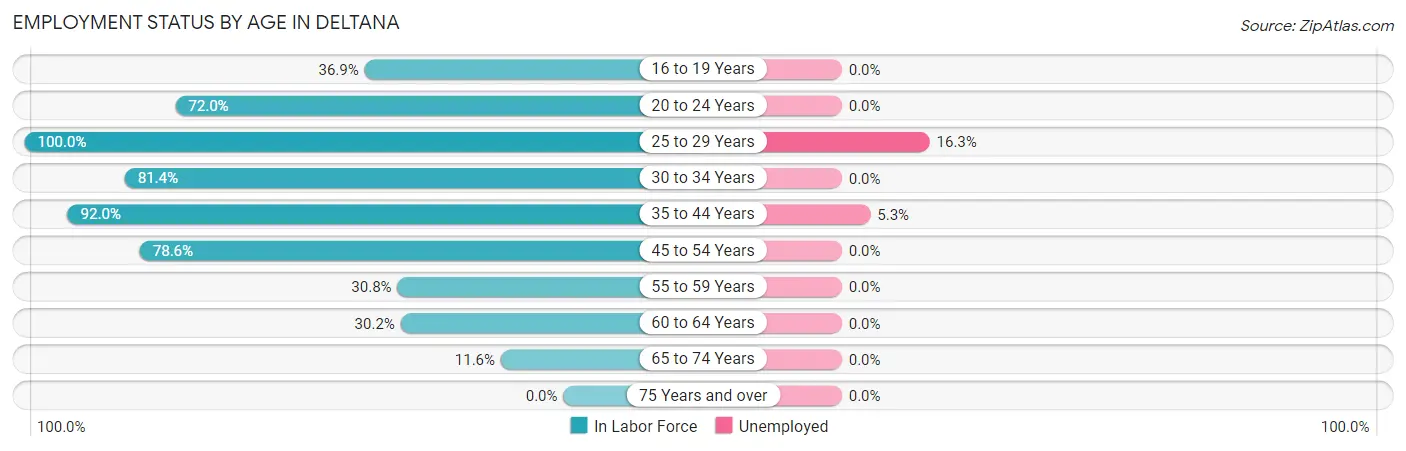
| Age Bracket | In Labor Force | Unemployed |
| 16 to 19 Years | 45 (36.9%) | 0 (0.0%) |
| 20 to 24 Years | 36 (72.0%) | 0 (0.0%) |
| 25 to 29 Years | 86 (100.0%) | 14 (16.3%) |
| 30 to 34 Years | 162 (81.4%) | 0 (0.0%) |
| 35 to 44 Years | 263 (92.0%) | 14 (5.3%) |
| 45 to 54 Years | 224 (78.6%) | 0 (0.0%) |
| 55 to 59 Years | 20 (30.8%) | 0 (0.0%) |
| 60 to 64 Years | 32 (30.2%) | 0 (0.0%) |
| 65 to 74 Years | 20 (11.6%) | 0 (0.0%) |
| 75 Years and over | 0 (0.0%) | 0 (0.0%) |
| Total | 888 (62.4%) | 28 (3.2%) |
Employment Status by Educational Attainment in Deltana
According to labor force statistics for Deltana, 76.6% of individuals (787) out of the total population between 25 and 64 years of age (1,027) are in the labor force, with 3.7% or 29 of them being unemployed. The group with the highest labor force participation rate are those with the educational attainment of high school diploma, with 79.9% or 298 individuals in the labor force. Within the labor force, individuals with college / associate degree education have the highest percentage of unemployment, with 10.0% or 28 of them being unemployed.
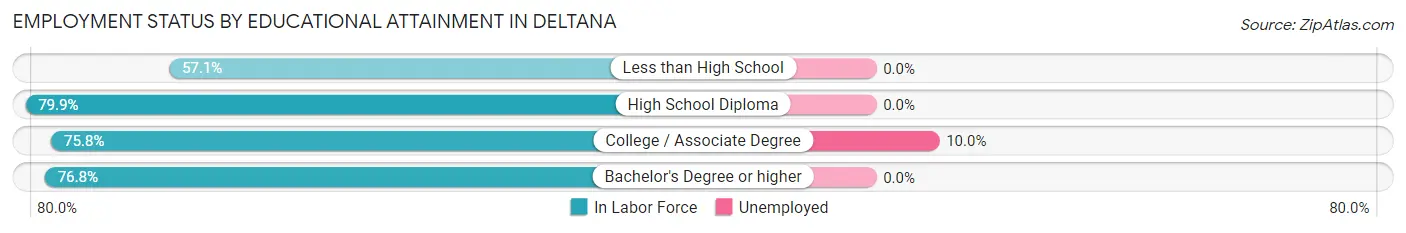
| Educational Attainment | In Labor Force | Unemployed |
| Less than High School | 28 (57.1%) | 0 (0.0%) |
| High School Diploma | 298 (79.9%) | 0 (0.0%) |
| College / Associate Degree | 279 (75.8%) | 37 (10.0%) |
| Bachelor's Degree or higher | 182 (76.8%) | 0 (0.0%) |
| Total | 787 (76.6%) | 38 (3.7%) |
Employment Occupations by Sex in Deltana
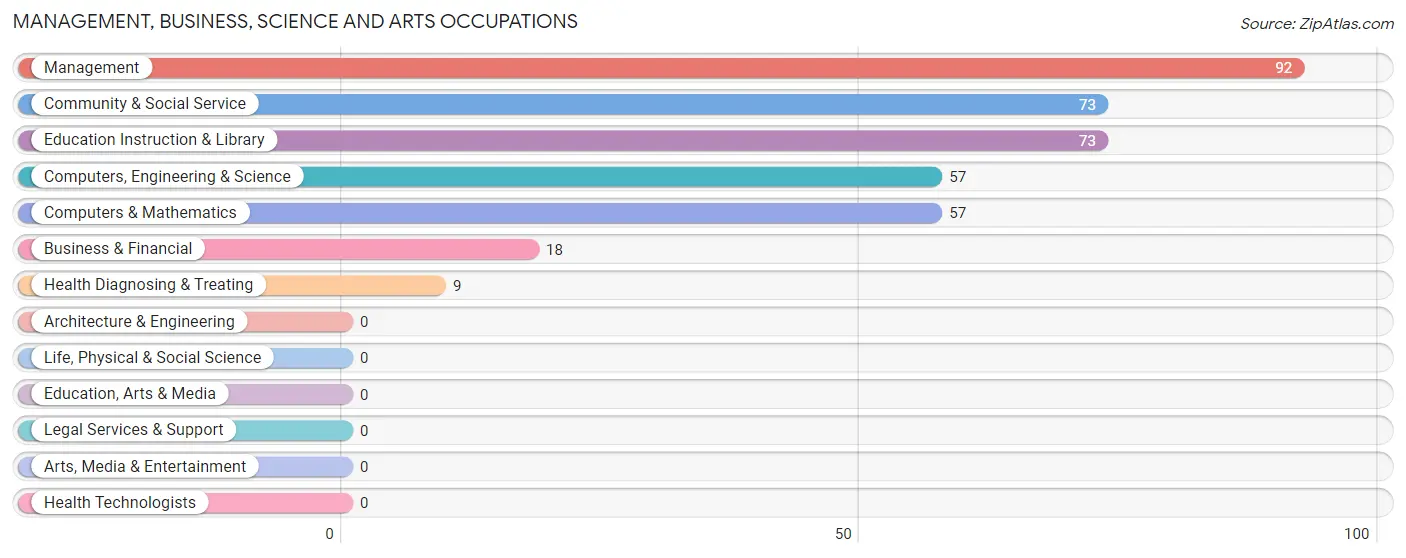
Management, Business, Science and Arts Occupations
The most common Management, Business, Science and Arts occupations in Deltana are Management (92 | 11.0%), Community & Social Service (73 | 8.7%), Education Instruction & Library (73 | 8.7%), Computers, Engineering & Science (57 | 6.8%), and Computers & Mathematics (57 | 6.8%).
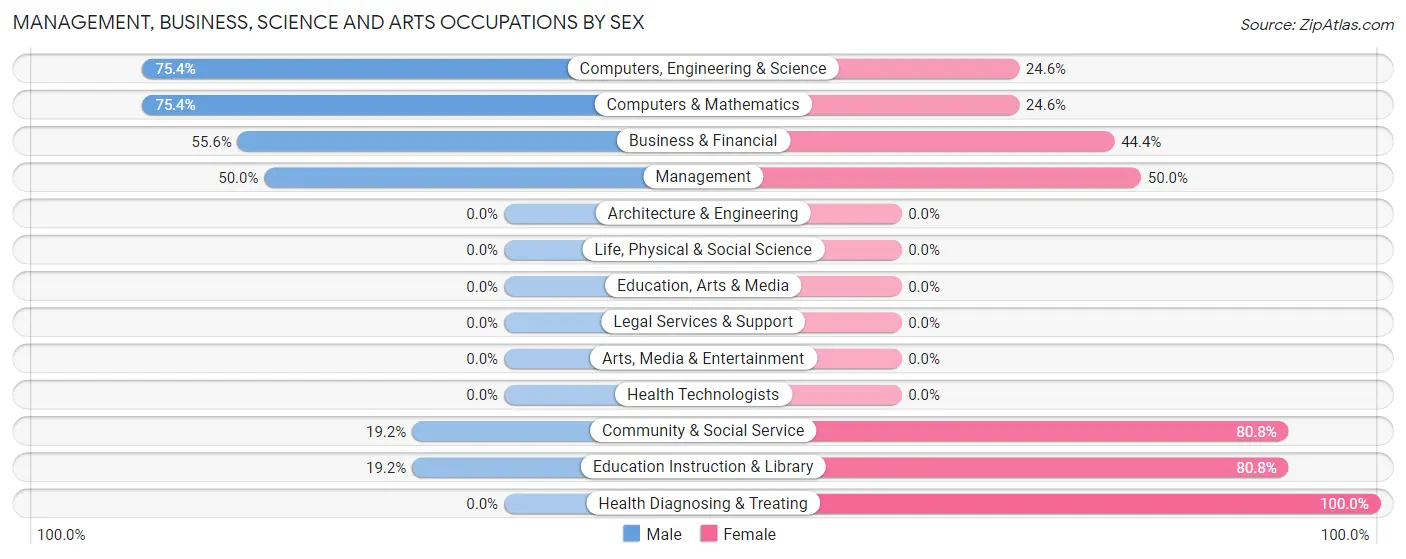
Management, Business, Science and Arts Occupations by Sex
Within the Management, Business, Science and Arts occupations in Deltana, the most male-oriented occupations are Computers, Engineering & Science (75.4%), Computers & Mathematics (75.4%), and Business & Financial (55.6%), while the most female-oriented occupations are Health Diagnosing & Treating (100.0%), Community & Social Service (80.8%), and Education Instruction & Library (80.8%).
| Occupation | Male | Female |
| Management | 46 (50.0%) | 46 (50.0%) |
| Business & Financial | 10 (55.6%) | 8 (44.4%) |
| Computers, Engineering & Science | 43 (75.4%) | 14 (24.6%) |
| Computers & Mathematics | 43 (75.4%) | 14 (24.6%) |
| Architecture & Engineering | 0 (0.0%) | 0 (0.0%) |
| Life, Physical & Social Science | 0 (0.0%) | 0 (0.0%) |
| Community & Social Service | 14 (19.2%) | 59 (80.8%) |
| Education, Arts & Media | 0 (0.0%) | 0 (0.0%) |
| Legal Services & Support | 0 (0.0%) | 0 (0.0%) |
| Education Instruction & Library | 14 (19.2%) | 59 (80.8%) |
| Arts, Media & Entertainment | 0 (0.0%) | 0 (0.0%) |
| Health Diagnosing & Treating | 0 (0.0%) | 9 (100.0%) |
| Health Technologists | 0 (0.0%) | 0 (0.0%) |
| Total (Category) | 113 (45.4%) | 136 (54.6%) |
| Total (Overall) | 470 (55.9%) | 370 (44.1%) |
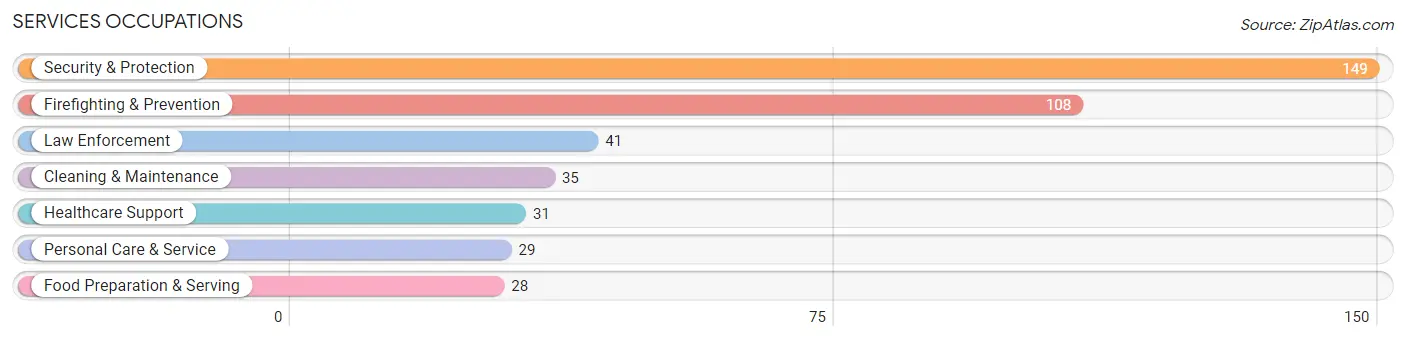
Services Occupations
The most common Services occupations in Deltana are Security & Protection (149 | 17.7%), Firefighting & Prevention (108 | 12.9%), Law Enforcement (41 | 4.9%), Cleaning & Maintenance (35 | 4.2%), and Healthcare Support (31 | 3.7%).
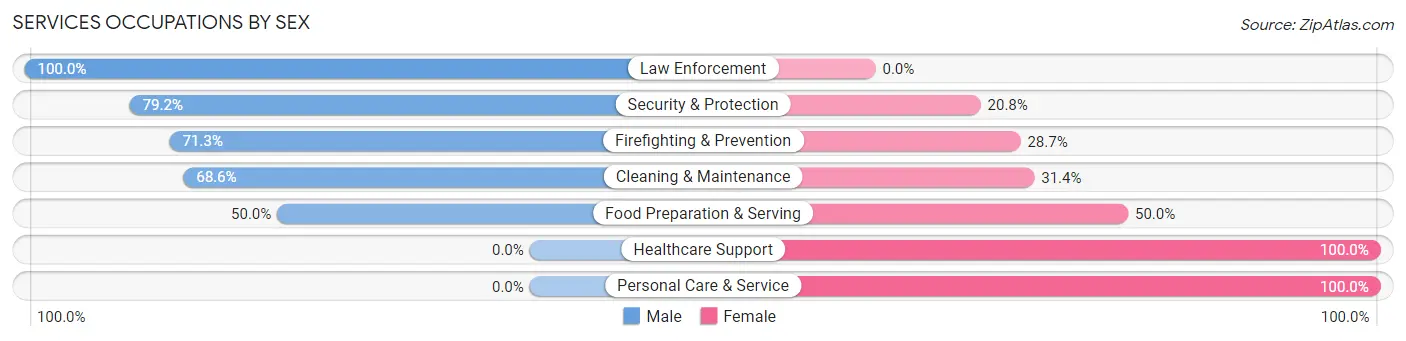
Services Occupations by Sex
Within the Services occupations in Deltana, the most male-oriented occupations are Law Enforcement (100.0%), Security & Protection (79.2%), and Firefighting & Prevention (71.3%), while the most female-oriented occupations are Healthcare Support (100.0%), Personal Care & Service (100.0%), and Food Preparation & Serving (50.0%).
| Occupation | Male | Female |
| Healthcare Support | 0 (0.0%) | 31 (100.0%) |
| Security & Protection | 118 (79.2%) | 31 (20.8%) |
| Firefighting & Prevention | 77 (71.3%) | 31 (28.7%) |
| Law Enforcement | 41 (100.0%) | 0 (0.0%) |
| Food Preparation & Serving | 14 (50.0%) | 14 (50.0%) |
| Cleaning & Maintenance | 24 (68.6%) | 11 (31.4%) |
| Personal Care & Service | 0 (0.0%) | 29 (100.0%) |
| Total (Category) | 156 (57.4%) | 116 (42.6%) |
| Total (Overall) | 470 (55.9%) | 370 (44.1%) |
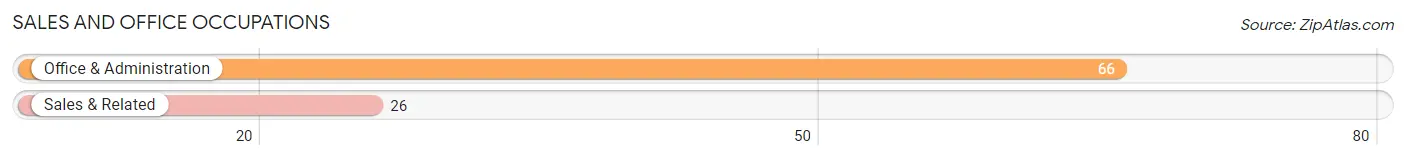
Sales and Office Occupations
The most common Sales and Office occupations in Deltana are Office & Administration (66 | 7.9%), and Sales & Related (26 | 3.1%).
Sales and Office Occupations by Sex
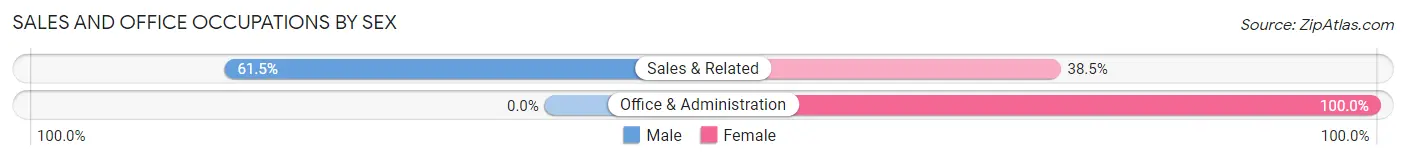
| Occupation | Male | Female |
| Sales & Related | 16 (61.5%) | 10 (38.5%) |
| Office & Administration | 0 (0.0%) | 66 (100.0%) |
| Total (Category) | 16 (17.4%) | 76 (82.6%) |
| Total (Overall) | 470 (55.9%) | 370 (44.1%) |
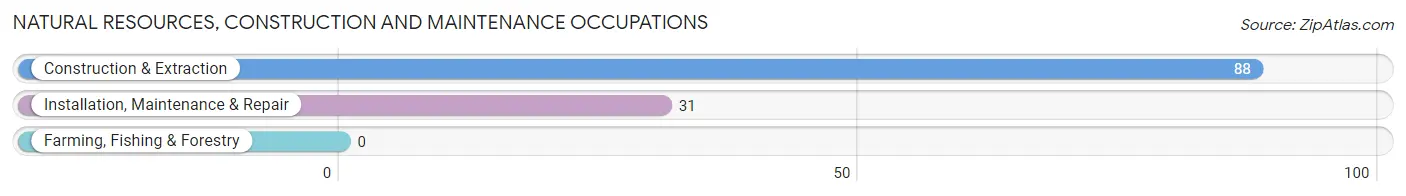
Natural Resources, Construction and Maintenance Occupations
The most common Natural Resources, Construction and Maintenance occupations in Deltana are Construction & Extraction (88 | 10.5%), and Installation, Maintenance & Repair (31 | 3.7%).
Natural Resources, Construction and Maintenance Occupations by Sex
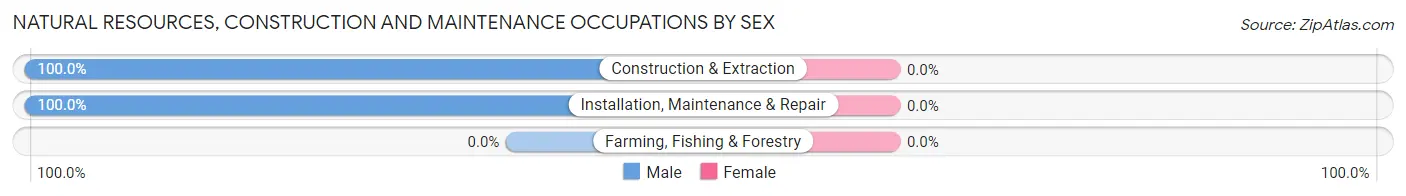
| Occupation | Male | Female |
| Farming, Fishing & Forestry | 0 (0.0%) | 0 (0.0%) |
| Construction & Extraction | 88 (100.0%) | 0 (0.0%) |
| Installation, Maintenance & Repair | 31 (100.0%) | 0 (0.0%) |
| Total (Category) | 119 (100.0%) | 0 (0.0%) |
| Total (Overall) | 470 (55.9%) | 370 (44.1%) |
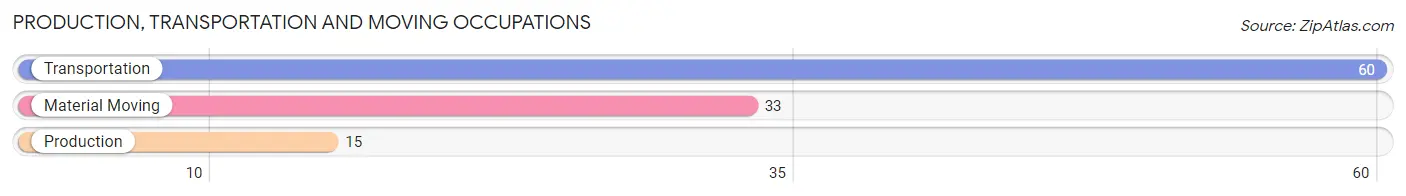
Production, Transportation and Moving Occupations
The most common Production, Transportation and Moving occupations in Deltana are Transportation (60 | 7.1%), Material Moving (33 | 3.9%), and Production (15 | 1.8%).
Production, Transportation and Moving Occupations by Sex
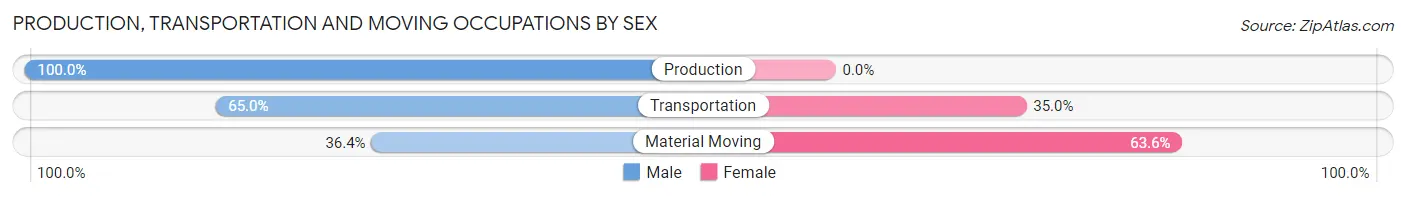
| Occupation | Male | Female |
| Production | 15 (100.0%) | 0 (0.0%) |
| Transportation | 39 (65.0%) | 21 (35.0%) |
| Material Moving | 12 (36.4%) | 21 (63.6%) |
| Total (Category) | 66 (61.1%) | 42 (38.9%) |
| Total (Overall) | 470 (55.9%) | 370 (44.1%) |
Employment Industries by Sex in Deltana
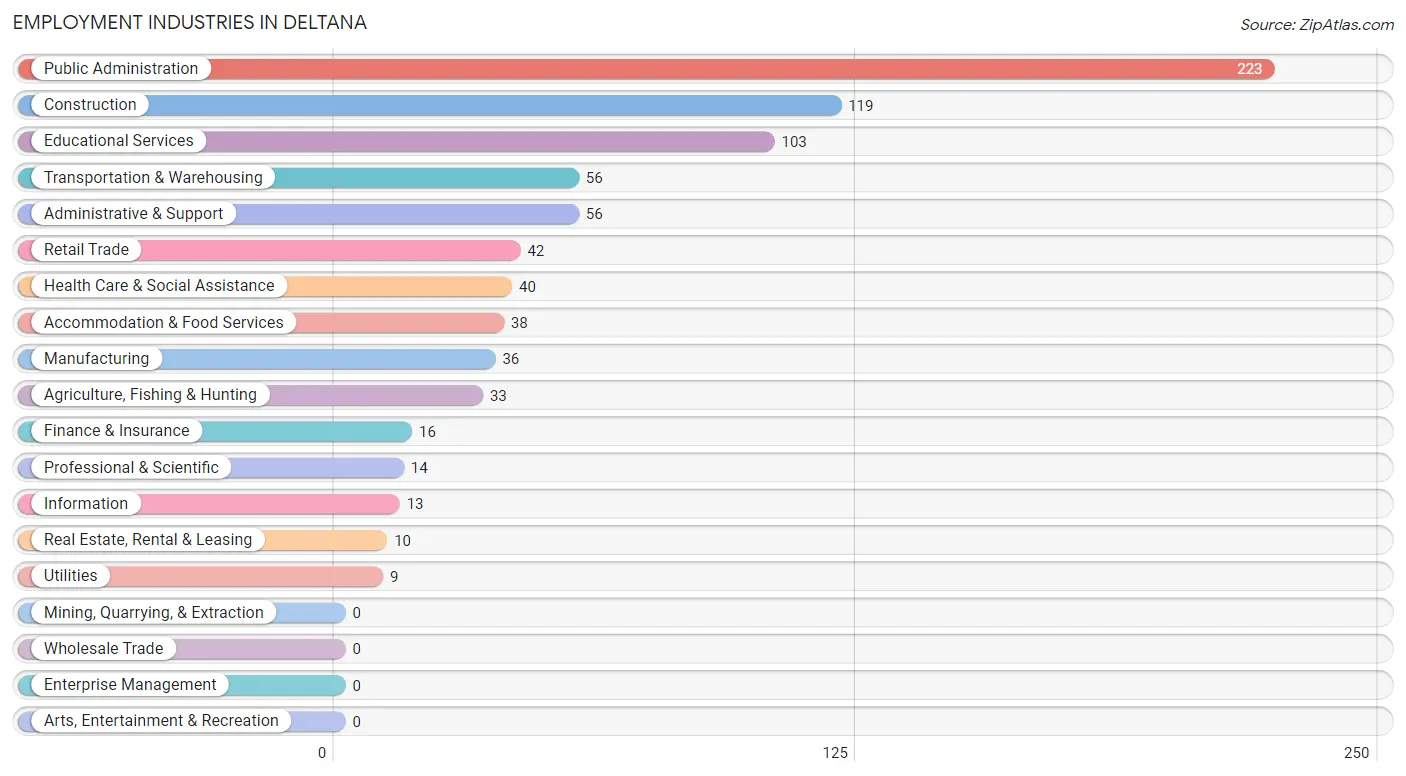
Employment Industries in Deltana
The major employment industries in Deltana include Public Administration (223 | 26.6%), Construction (119 | 14.2%), Educational Services (103 | 12.3%), Transportation & Warehousing (56 | 6.7%), and Administrative & Support (56 | 6.7%).
Employment Industries by Sex in Deltana
The Deltana industries that see more men than women are Manufacturing (100.0%), Information (100.0%), and Professional & Scientific (100.0%), whereas the industries that tend to have a higher number of women are Utilities (100.0%), Real Estate, Rental & Leasing (100.0%), and Health Care & Social Assistance (100.0%).
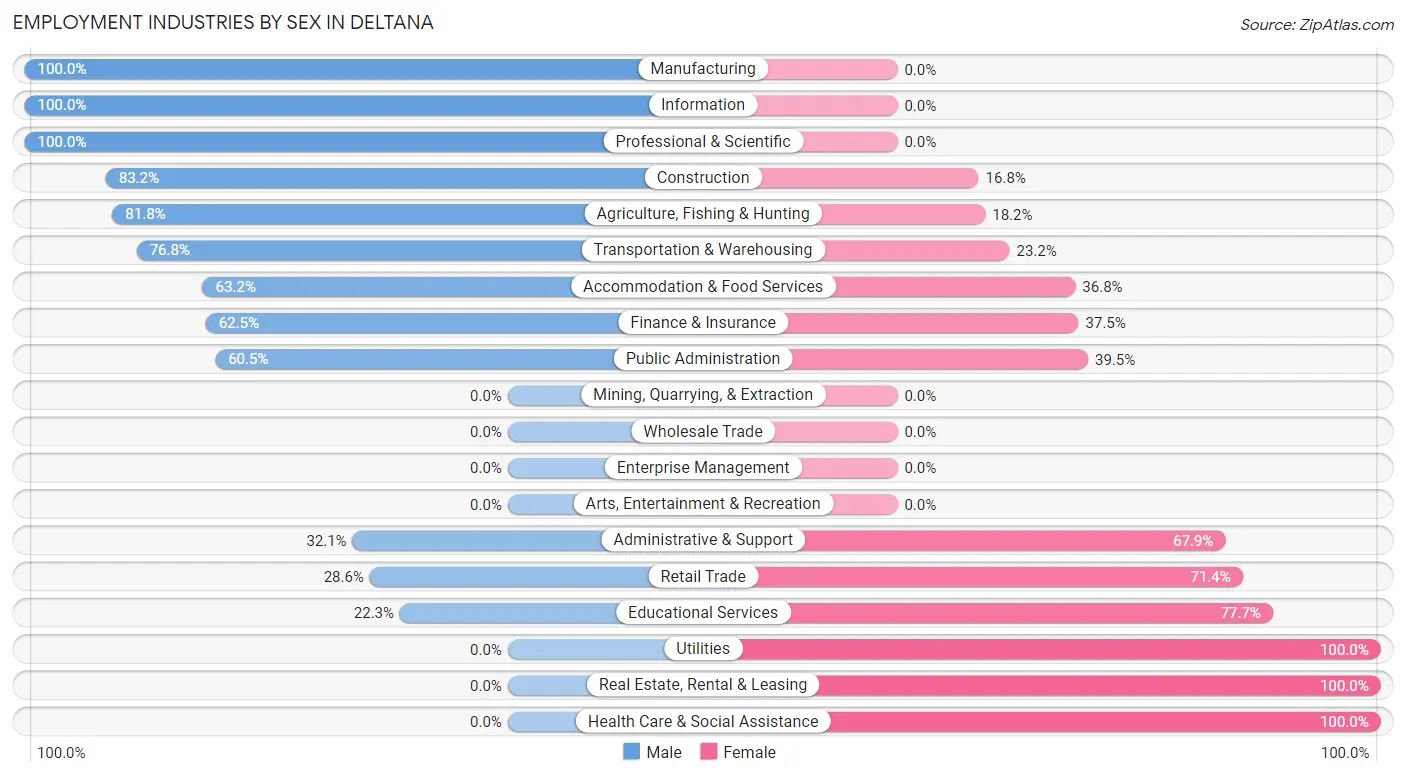
| Industry | Male | Female |
| Agriculture, Fishing & Hunting | 27 (81.8%) | 6 (18.2%) |
| Mining, Quarrying, & Extraction | 0 (0.0%) | 0 (0.0%) |
| Construction | 99 (83.2%) | 20 (16.8%) |
| Manufacturing | 36 (100.0%) | 0 (0.0%) |
| Wholesale Trade | 0 (0.0%) | 0 (0.0%) |
| Retail Trade | 12 (28.6%) | 30 (71.4%) |
| Transportation & Warehousing | 43 (76.8%) | 13 (23.2%) |
| Utilities | 0 (0.0%) | 9 (100.0%) |
| Information | 13 (100.0%) | 0 (0.0%) |
| Finance & Insurance | 10 (62.5%) | 6 (37.5%) |
| Real Estate, Rental & Leasing | 0 (0.0%) | 10 (100.0%) |
| Professional & Scientific | 14 (100.0%) | 0 (0.0%) |
| Enterprise Management | 0 (0.0%) | 0 (0.0%) |
| Administrative & Support | 18 (32.1%) | 38 (67.9%) |
| Educational Services | 23 (22.3%) | 80 (77.7%) |
| Health Care & Social Assistance | 0 (0.0%) | 40 (100.0%) |
| Arts, Entertainment & Recreation | 0 (0.0%) | 0 (0.0%) |
| Accommodation & Food Services | 24 (63.2%) | 14 (36.8%) |
| Public Administration | 135 (60.5%) | 88 (39.5%) |
| Total | 470 (55.9%) | 370 (44.1%) |
Education in Deltana
School Enrollment in Deltana
The most common levels of schooling among the 663 students in Deltana are elementary school (169 | 25.5%), high school (164 | 24.7%), and middle school (157 | 23.7%).
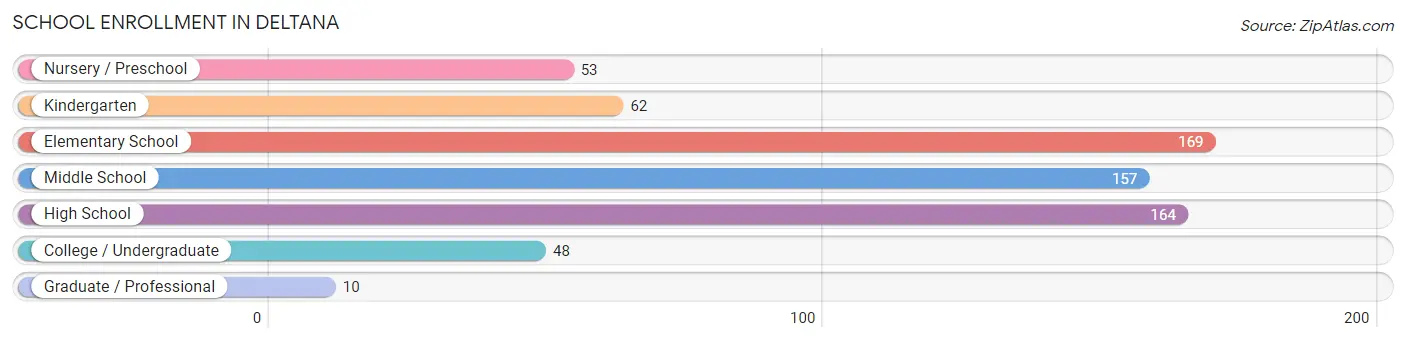
| School Level | # Students | % Students |
| Nursery / Preschool | 53 | 8.0% |
| Kindergarten | 62 | 9.3% |
| Elementary School | 169 | 25.5% |
| Middle School | 157 | 23.7% |
| High School | 164 | 24.7% |
| College / Undergraduate | 48 | 7.2% |
| Graduate / Professional | 10 | 1.5% |
| Total | 663 | 100.0% |
School Enrollment by Age by Funding Source in Deltana
Out of a total of 663 students who are enrolled in schools in Deltana, 167 (25.2%) attend a private institution, while the remaining 496 (74.8%) are enrolled in public schools. The age group of 3 to 4 year olds has the highest likelihood of being enrolled in private schools, with 27 (61.4% in the age bracket) enrolled. Conversely, the age group of 18 to 19 year olds has the lowest likelihood of being enrolled in a private school, with 16 (100.0% in the age bracket) attending a public institution.
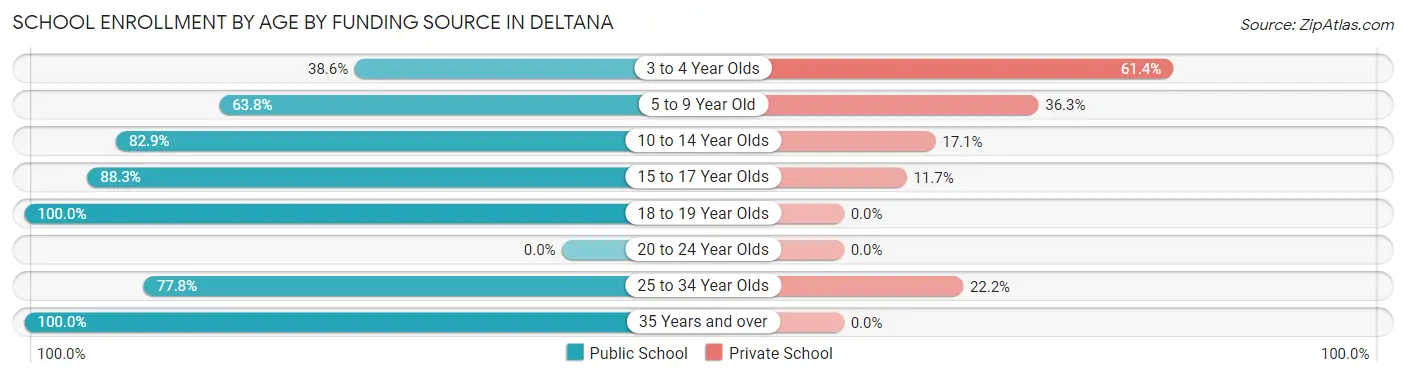
| Age Bracket | Public School | Private School |
| 3 to 4 Year Olds | 17 (38.6%) | 27 (61.4%) |
| 5 to 9 Year Old | 153 (63.7%) | 87 (36.2%) |
| 10 to 14 Year Olds | 175 (82.9%) | 36 (17.1%) |
| 15 to 17 Year Olds | 83 (88.3%) | 11 (11.7%) |
| 18 to 19 Year Olds | 16 (100.0%) | 0 (0.0%) |
| 20 to 24 Year Olds | 0 (0.0%) | 0 (0.0%) |
| 25 to 34 Year Olds | 21 (77.8%) | 6 (22.2%) |
| 35 Years and over | 31 (100.0%) | 0 (0.0%) |
| Total | 496 (74.8%) | 167 (25.2%) |
Educational Attainment by Field of Study in Deltana
Bio, nature & agricultural (95 | 27.3%), business (42 | 12.1%), arts & humanities (41 | 11.8%), engineering (32 | 9.2%), and physical & health sciences (30 | 8.6%) are the most common fields of study among 348 individuals in Deltana who have obtained a bachelor's degree or higher.
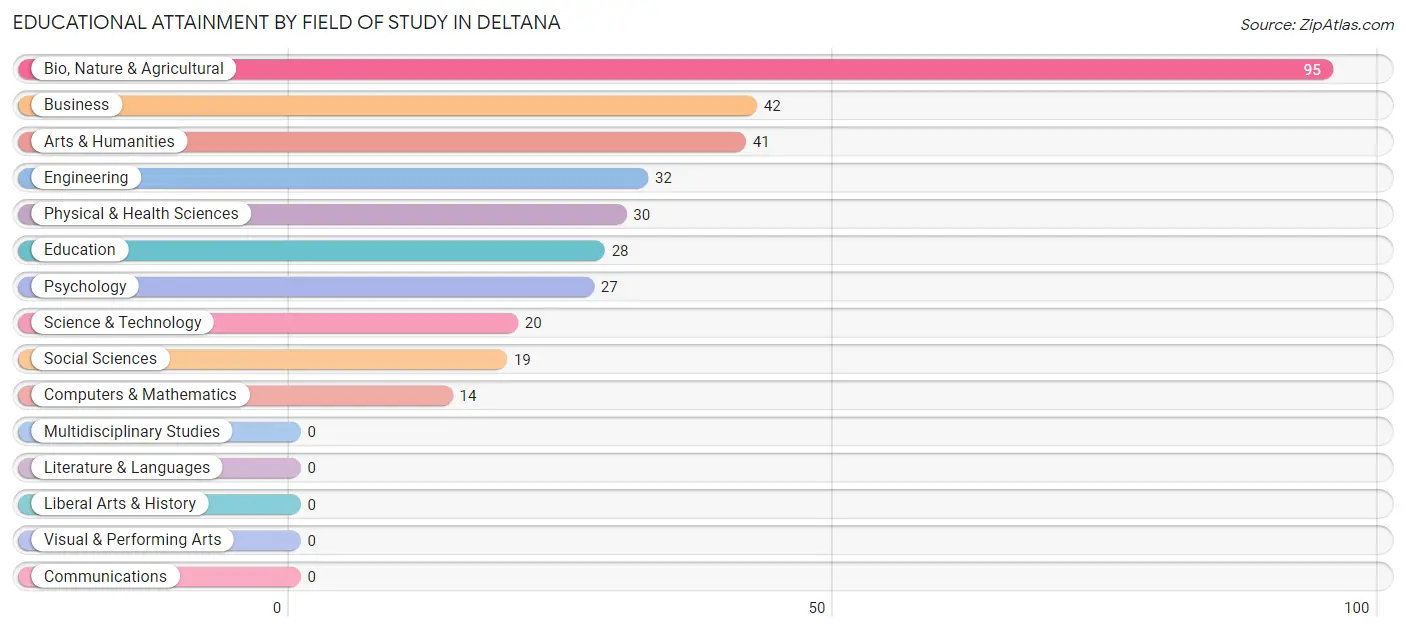
| Field of Study | # Graduates | % Graduates |
| Computers & Mathematics | 14 | 4.0% |
| Bio, Nature & Agricultural | 95 | 27.3% |
| Physical & Health Sciences | 30 | 8.6% |
| Psychology | 27 | 7.8% |
| Social Sciences | 19 | 5.5% |
| Engineering | 32 | 9.2% |
| Multidisciplinary Studies | 0 | 0.0% |
| Science & Technology | 20 | 5.8% |
| Business | 42 | 12.1% |
| Education | 28 | 8.1% |
| Literature & Languages | 0 | 0.0% |
| Liberal Arts & History | 0 | 0.0% |
| Visual & Performing Arts | 0 | 0.0% |
| Communications | 0 | 0.0% |
| Arts & Humanities | 41 | 11.8% |
| Total | 348 | 100.0% |
Transportation & Commute in Deltana
Vehicle Availability by Sex in Deltana
The most prevalent vehicle ownership categories in Deltana are males with 2 vehicles (159, accounting for 33.1%) and females with 2 vehicles (63, making up 47.9%).
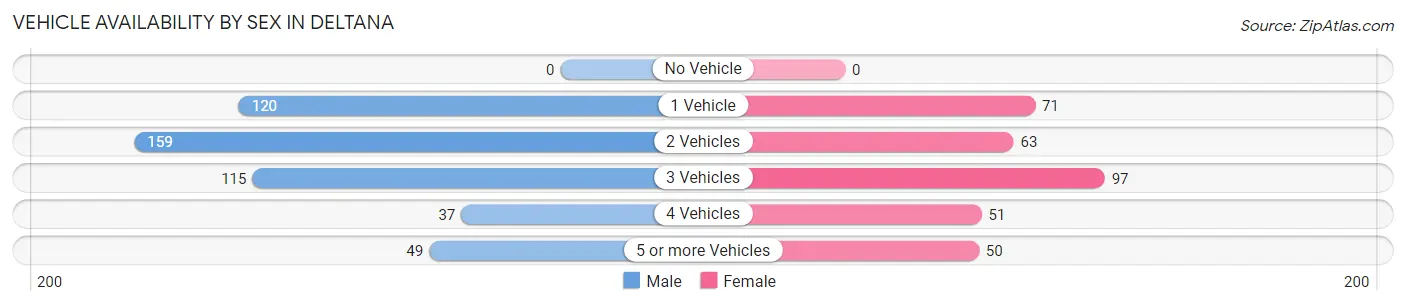
| Vehicles Available | Male | Female |
| No Vehicle | 0 (0.0%) | 0 (0.0%) |
| 1 Vehicle | 120 (25.0%) | 71 (21.4%) |
| 2 Vehicles | 159 (33.1%) | 63 (19.0%) |
| 3 Vehicles | 115 (24.0%) | 97 (29.2%) |
| 4 Vehicles | 37 (7.7%) | 51 (15.4%) |
| 5 or more Vehicles | 49 (10.2%) | 50 (15.1%) |
| Total | 480 (100.0%) | 332 (100.0%) |
Commute Time in Deltana
The most frequently occuring commute durations in Deltana are 20 to 24 minutes (181 commuters, 24.1%), 15 to 19 minutes (173 commuters, 23.0%), and 10 to 14 minutes (145 commuters, 19.3%).
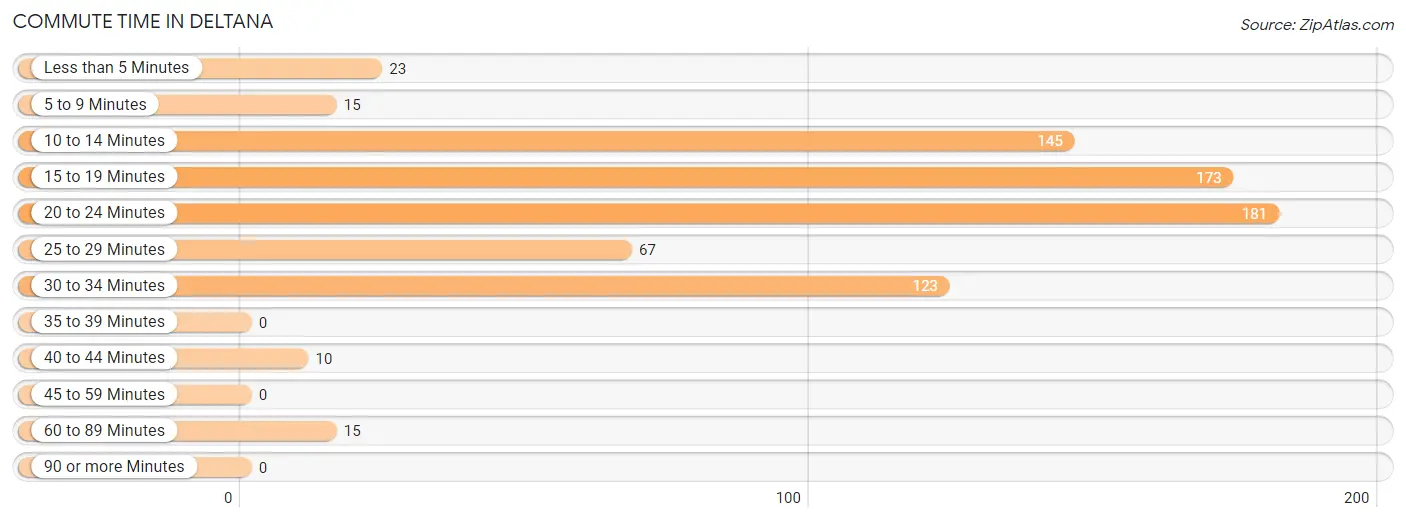
| Commute Time | # Commuters | % Commuters |
| Less than 5 Minutes | 23 | 3.1% |
| 5 to 9 Minutes | 15 | 2.0% |
| 10 to 14 Minutes | 145 | 19.3% |
| 15 to 19 Minutes | 173 | 23.0% |
| 20 to 24 Minutes | 181 | 24.1% |
| 25 to 29 Minutes | 67 | 8.9% |
| 30 to 34 Minutes | 123 | 16.4% |
| 35 to 39 Minutes | 0 | 0.0% |
| 40 to 44 Minutes | 10 | 1.3% |
| 45 to 59 Minutes | 0 | 0.0% |
| 60 to 89 Minutes | 15 | 2.0% |
| 90 or more Minutes | 0 | 0.0% |
Commute Time by Sex in Deltana
The most common commute times in Deltana are 20 to 24 minutes (105 commuters, 24.6%) for males and 15 to 19 minutes (92 commuters, 28.2%) for females.
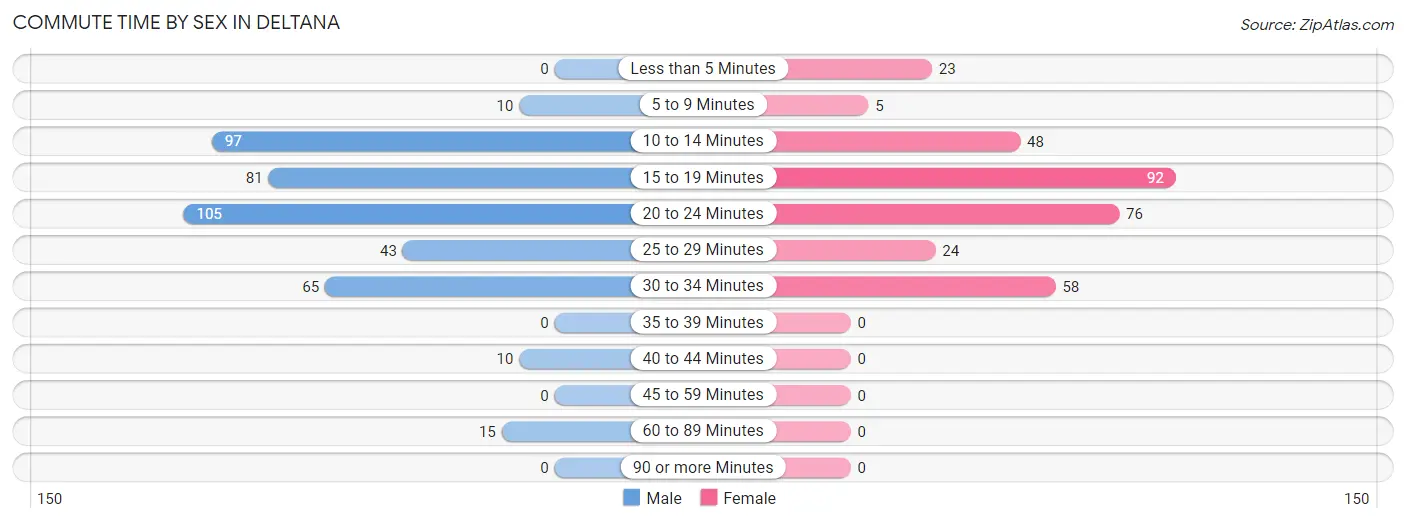
| Commute Time | Male | Female |
| Less than 5 Minutes | 0 (0.0%) | 23 (7.1%) |
| 5 to 9 Minutes | 10 (2.4%) | 5 (1.5%) |
| 10 to 14 Minutes | 97 (22.8%) | 48 (14.7%) |
| 15 to 19 Minutes | 81 (19.0%) | 92 (28.2%) |
| 20 to 24 Minutes | 105 (24.6%) | 76 (23.3%) |
| 25 to 29 Minutes | 43 (10.1%) | 24 (7.4%) |
| 30 to 34 Minutes | 65 (15.3%) | 58 (17.8%) |
| 35 to 39 Minutes | 0 (0.0%) | 0 (0.0%) |
| 40 to 44 Minutes | 10 (2.4%) | 0 (0.0%) |
| 45 to 59 Minutes | 0 (0.0%) | 0 (0.0%) |
| 60 to 89 Minutes | 15 (3.5%) | 0 (0.0%) |
| 90 or more Minutes | 0 (0.0%) | 0 (0.0%) |
Time of Departure to Work by Sex in Deltana
The most frequent times of departure to work in Deltana are 6:30 AM to 6:59 AM (104, 24.4%) for males and 8:00 AM to 8:29 AM (70, 21.5%) for females.
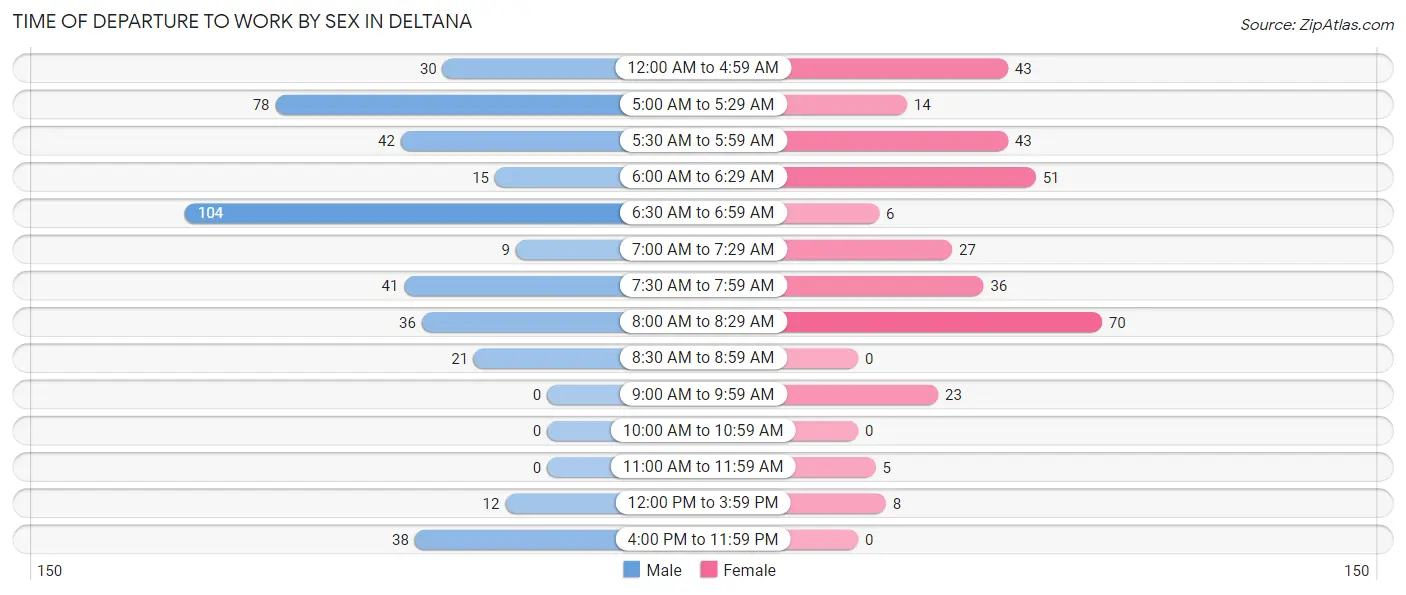
| Time of Departure | Male | Female |
| 12:00 AM to 4:59 AM | 30 (7.0%) | 43 (13.2%) |
| 5:00 AM to 5:29 AM | 78 (18.3%) | 14 (4.3%) |
| 5:30 AM to 5:59 AM | 42 (9.9%) | 43 (13.2%) |
| 6:00 AM to 6:29 AM | 15 (3.5%) | 51 (15.6%) |
| 6:30 AM to 6:59 AM | 104 (24.4%) | 6 (1.8%) |
| 7:00 AM to 7:29 AM | 9 (2.1%) | 27 (8.3%) |
| 7:30 AM to 7:59 AM | 41 (9.6%) | 36 (11.0%) |
| 8:00 AM to 8:29 AM | 36 (8.5%) | 70 (21.5%) |
| 8:30 AM to 8:59 AM | 21 (4.9%) | 0 (0.0%) |
| 9:00 AM to 9:59 AM | 0 (0.0%) | 23 (7.1%) |
| 10:00 AM to 10:59 AM | 0 (0.0%) | 0 (0.0%) |
| 11:00 AM to 11:59 AM | 0 (0.0%) | 5 (1.5%) |
| 12:00 PM to 3:59 PM | 12 (2.8%) | 8 (2.5%) |
| 4:00 PM to 11:59 PM | 38 (8.9%) | 0 (0.0%) |
| Total | 426 (100.0%) | 326 (100.0%) |
Housing Occupancy in Deltana
Occupancy by Ownership in Deltana
Of the total 647 dwellings in Deltana, owner-occupied units account for 545 (84.2%), while renter-occupied units make up 102 (15.8%).
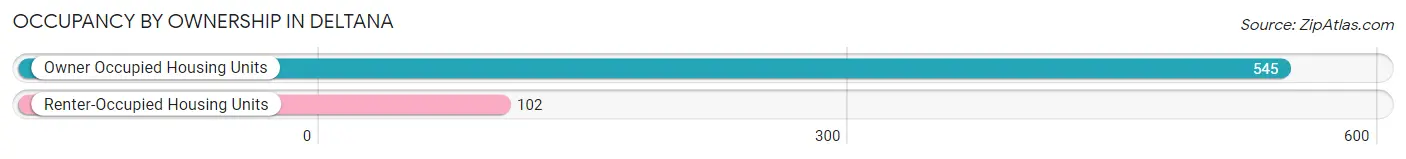
| Occupancy | # Housing Units | % Housing Units |
| Owner Occupied Housing Units | 545 | 84.2% |
| Renter-Occupied Housing Units | 102 | 15.8% |
| Total Occupied Housing Units | 647 | 100.0% |
Occupancy by Household Size in Deltana
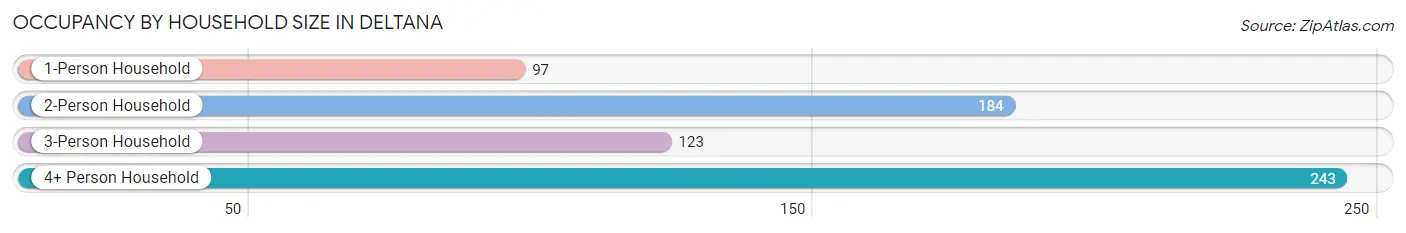
| Household Size | # Housing Units | % Housing Units |
| 1-Person Household | 97 | 15.0% |
| 2-Person Household | 184 | 28.4% |
| 3-Person Household | 123 | 19.0% |
| 4+ Person Household | 243 | 37.6% |
| Total Housing Units | 647 | 100.0% |
Occupancy by Ownership by Household Size in Deltana
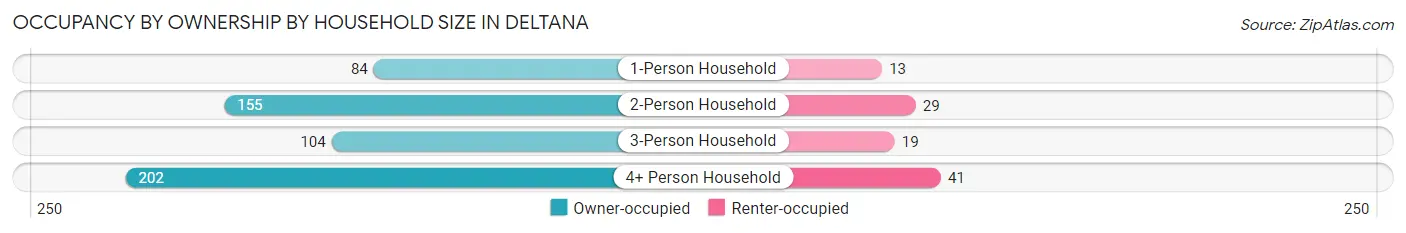
| Household Size | Owner-occupied | Renter-occupied |
| 1-Person Household | 84 (86.6%) | 13 (13.4%) |
| 2-Person Household | 155 (84.2%) | 29 (15.8%) |
| 3-Person Household | 104 (84.6%) | 19 (15.4%) |
| 4+ Person Household | 202 (83.1%) | 41 (16.9%) |
| Total Housing Units | 545 (84.2%) | 102 (15.8%) |
Occupancy by Educational Attainment in Deltana
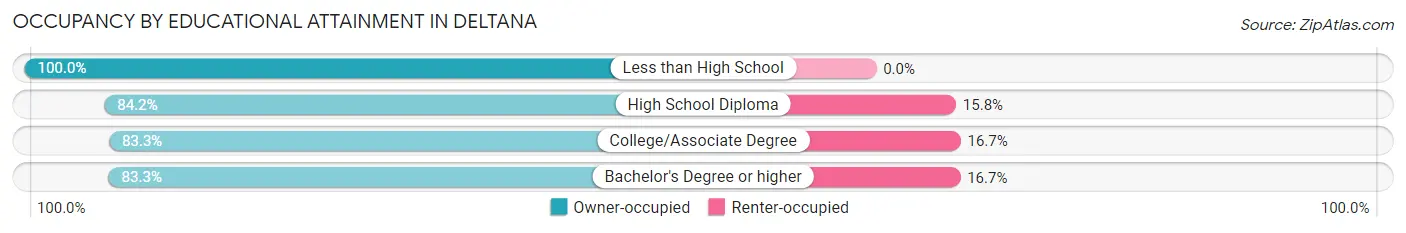
| Household Size | Owner-occupied | Renter-occupied |
| Less than High School | 24 (100.0%) | 0 (0.0%) |
| High School Diploma | 197 (84.2%) | 37 (15.8%) |
| College/Associate Degree | 204 (83.3%) | 41 (16.7%) |
| Bachelor's Degree or higher | 120 (83.3%) | 24 (16.7%) |
Occupancy by Age of Householder in Deltana
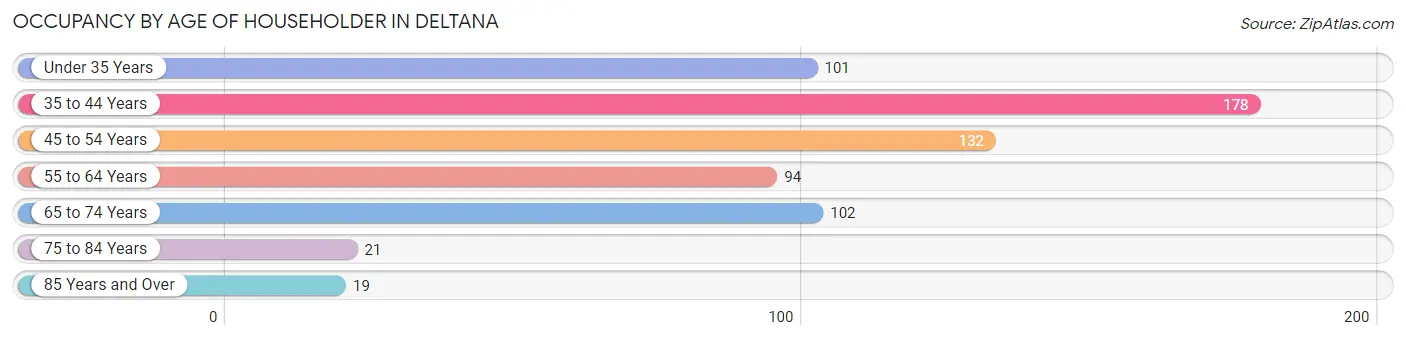
| Age Bracket | # Households | % Households |
| Under 35 Years | 101 | 15.6% |
| 35 to 44 Years | 178 | 27.5% |
| 45 to 54 Years | 132 | 20.4% |
| 55 to 64 Years | 94 | 14.5% |
| 65 to 74 Years | 102 | 15.8% |
| 75 to 84 Years | 21 | 3.3% |
| 85 Years and Over | 19 | 2.9% |
| Total | 647 | 100.0% |
Housing Finances in Deltana
Median Income by Occupancy in Deltana
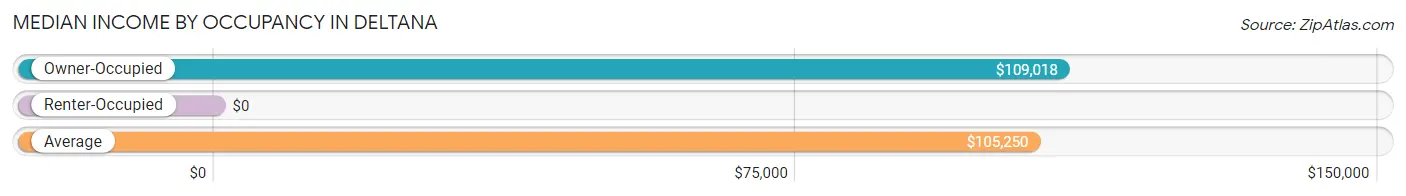
| Occupancy Type | # Households | Median Income |
| Owner-Occupied | 545 (84.2%) | $109,018 |
| Renter-Occupied | 102 (15.8%) | $0 |
| Average | 647 (100.0%) | $105,250 |
Occupancy by Householder Income Bracket in Deltana
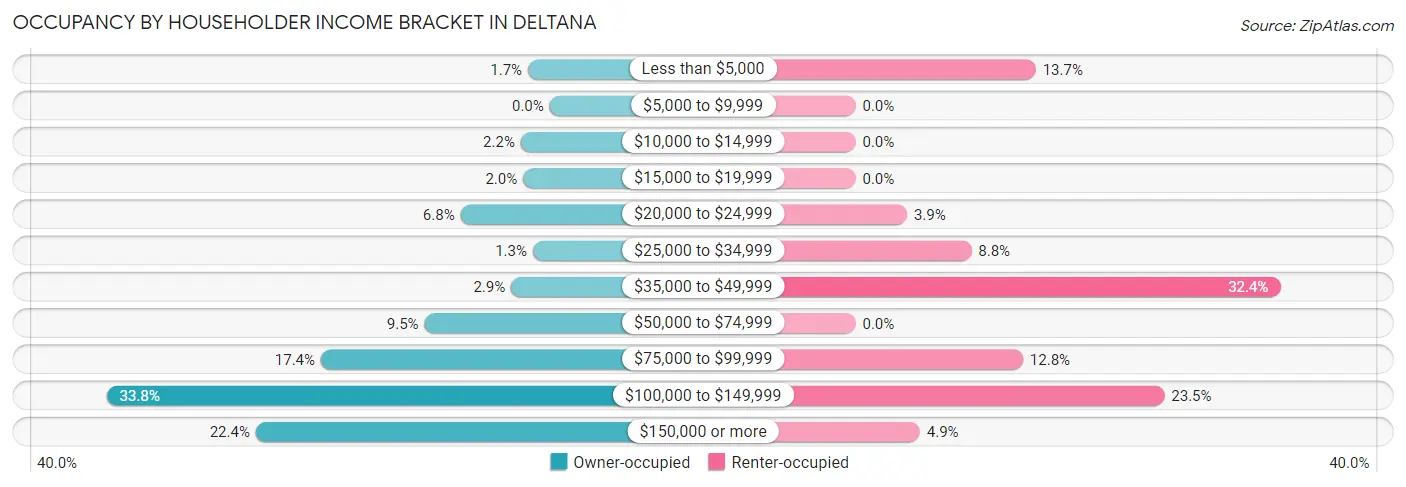
| Income Bracket | Owner-occupied | Renter-occupied |
| Less than $5,000 | 9 (1.7%) | 14 (13.7%) |
| $5,000 to $9,999 | 0 (0.0%) | 0 (0.0%) |
| $10,000 to $14,999 | 12 (2.2%) | 0 (0.0%) |
| $15,000 to $19,999 | 11 (2.0%) | 0 (0.0%) |
| $20,000 to $24,999 | 37 (6.8%) | 4 (3.9%) |
| $25,000 to $34,999 | 7 (1.3%) | 9 (8.8%) |
| $35,000 to $49,999 | 16 (2.9%) | 33 (32.4%) |
| $50,000 to $74,999 | 52 (9.5%) | 0 (0.0%) |
| $75,000 to $99,999 | 95 (17.4%) | 13 (12.8%) |
| $100,000 to $149,999 | 184 (33.8%) | 24 (23.5%) |
| $150,000 or more | 122 (22.4%) | 5 (4.9%) |
| Total | 545 (100.0%) | 102 (100.0%) |
Monthly Housing Cost Tiers in Deltana
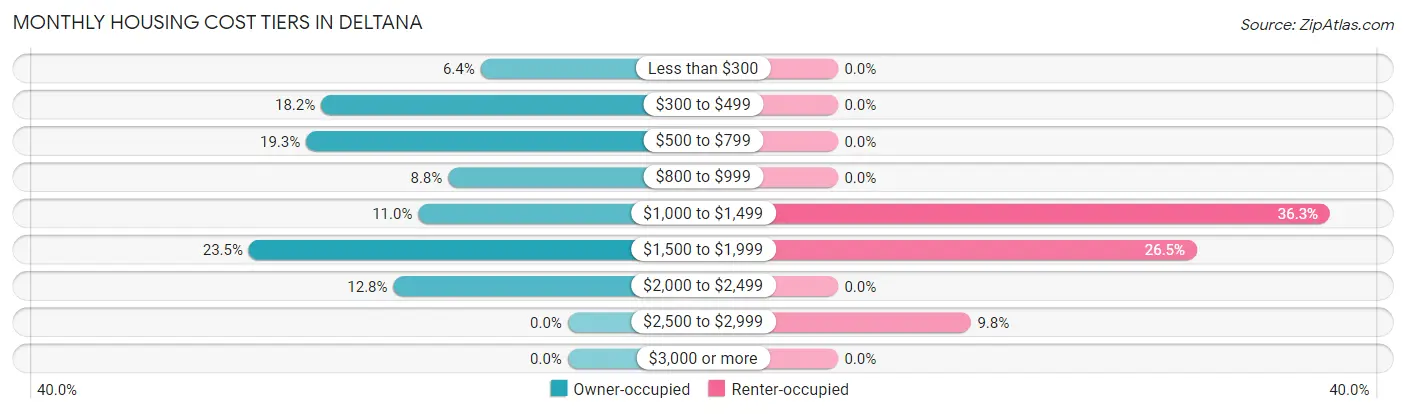
| Monthly Cost | Owner-occupied | Renter-occupied |
| Less than $300 | 35 (6.4%) | 0 (0.0%) |
| $300 to $499 | 99 (18.2%) | 0 (0.0%) |
| $500 to $799 | 105 (19.3%) | 0 (0.0%) |
| $800 to $999 | 48 (8.8%) | 0 (0.0%) |
| $1,000 to $1,499 | 60 (11.0%) | 37 (36.3%) |
| $1,500 to $1,999 | 128 (23.5%) | 27 (26.5%) |
| $2,000 to $2,499 | 70 (12.8%) | 0 (0.0%) |
| $2,500 to $2,999 | 0 (0.0%) | 10 (9.8%) |
| $3,000 or more | 0 (0.0%) | 0 (0.0%) |
| Total | 545 (100.0%) | 102 (100.0%) |
Physical Housing Characteristics in Deltana
Housing Structures in Deltana
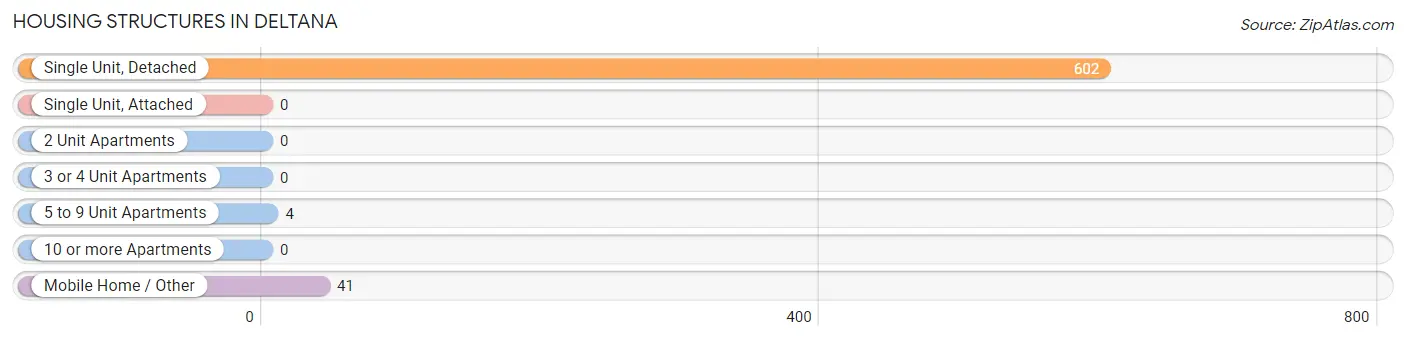
| Structure Type | # Housing Units | % Housing Units |
| Single Unit, Detached | 602 | 93.0% |
| Single Unit, Attached | 0 | 0.0% |
| 2 Unit Apartments | 0 | 0.0% |
| 3 or 4 Unit Apartments | 0 | 0.0% |
| 5 to 9 Unit Apartments | 4 | 0.6% |
| 10 or more Apartments | 0 | 0.0% |
| Mobile Home / Other | 41 | 6.3% |
| Total | 647 | 100.0% |
Housing Structures by Occupancy in Deltana
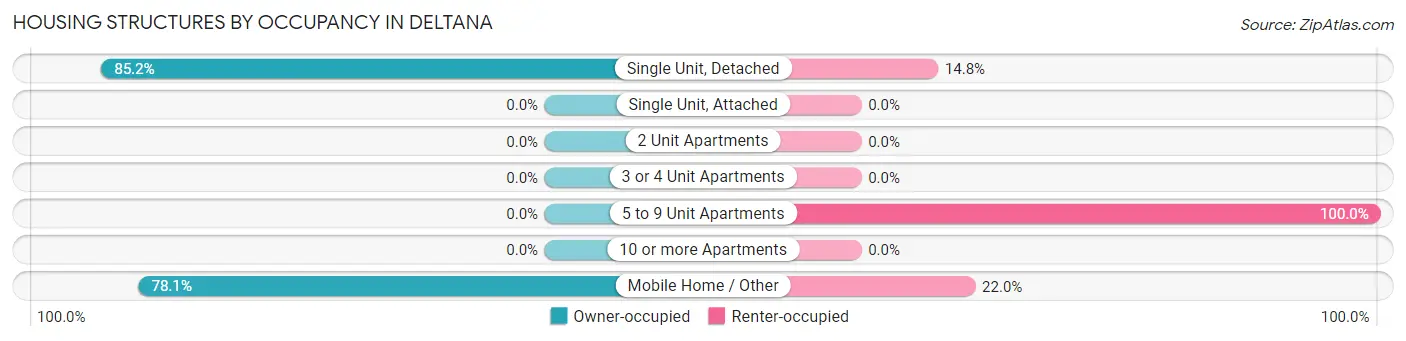
| Structure Type | Owner-occupied | Renter-occupied |
| Single Unit, Detached | 513 (85.2%) | 89 (14.8%) |
| Single Unit, Attached | 0 (0.0%) | 0 (0.0%) |
| 2 Unit Apartments | 0 (0.0%) | 0 (0.0%) |
| 3 or 4 Unit Apartments | 0 (0.0%) | 0 (0.0%) |
| 5 to 9 Unit Apartments | 0 (0.0%) | 4 (100.0%) |
| 10 or more Apartments | 0 (0.0%) | 0 (0.0%) |
| Mobile Home / Other | 32 (78.0%) | 9 (22.0%) |
| Total | 545 (84.2%) | 102 (15.8%) |
Housing Structures by Number of Rooms in Deltana
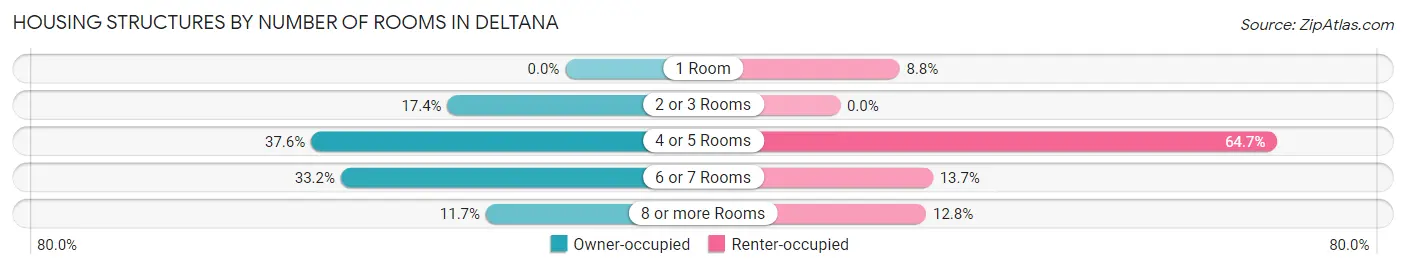
| Number of Rooms | Owner-occupied | Renter-occupied |
| 1 Room | 0 (0.0%) | 9 (8.8%) |
| 2 or 3 Rooms | 95 (17.4%) | 0 (0.0%) |
| 4 or 5 Rooms | 205 (37.6%) | 66 (64.7%) |
| 6 or 7 Rooms | 181 (33.2%) | 14 (13.7%) |
| 8 or more Rooms | 64 (11.7%) | 13 (12.8%) |
| Total | 545 (100.0%) | 102 (100.0%) |
Housing Structure by Heating Type in Deltana
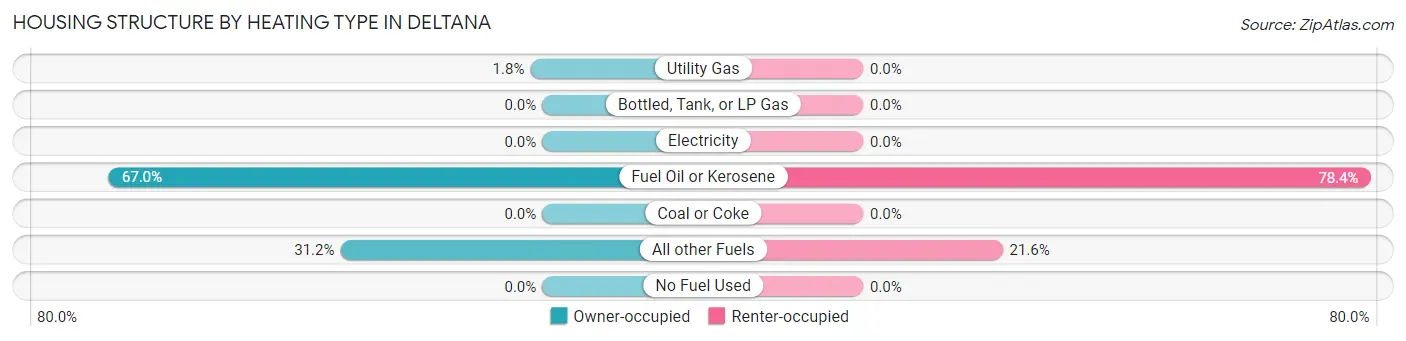
| Heating Type | Owner-occupied | Renter-occupied |
| Utility Gas | 10 (1.8%) | 0 (0.0%) |
| Bottled, Tank, or LP Gas | 0 (0.0%) | 0 (0.0%) |
| Electricity | 0 (0.0%) | 0 (0.0%) |
| Fuel Oil or Kerosene | 365 (67.0%) | 80 (78.4%) |
| Coal or Coke | 0 (0.0%) | 0 (0.0%) |
| All other Fuels | 170 (31.2%) | 22 (21.6%) |
| No Fuel Used | 0 (0.0%) | 0 (0.0%) |
| Total | 545 (100.0%) | 102 (100.0%) |
Household Vehicle Usage in Deltana
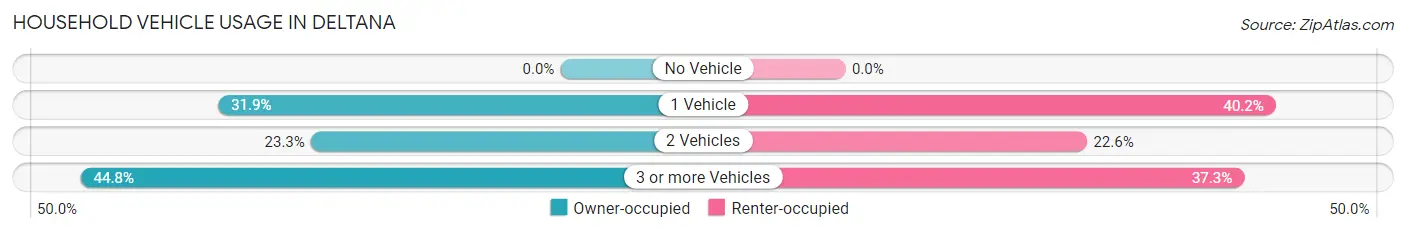
| Vehicles per Household | Owner-occupied | Renter-occupied |
| No Vehicle | 0 (0.0%) | 0 (0.0%) |
| 1 Vehicle | 174 (31.9%) | 41 (40.2%) |
| 2 Vehicles | 127 (23.3%) | 23 (22.6%) |
| 3 or more Vehicles | 244 (44.8%) | 38 (37.2%) |
| Total | 545 (100.0%) | 102 (100.0%) |
Real Estate & Mortgages in Deltana
Real Estate and Mortgage Overview in Deltana
| Characteristic | Without Mortgage | With Mortgage |
| Housing Units | 261 | 284 |
| Median Property Value | $237,500 | $272,200 |
| Median Household Income | $101,875 | $68 |
| Monthly Housing Costs | $527 | $0 |
| Real Estate Taxes | - | - |
Property Value by Mortgage Status in Deltana
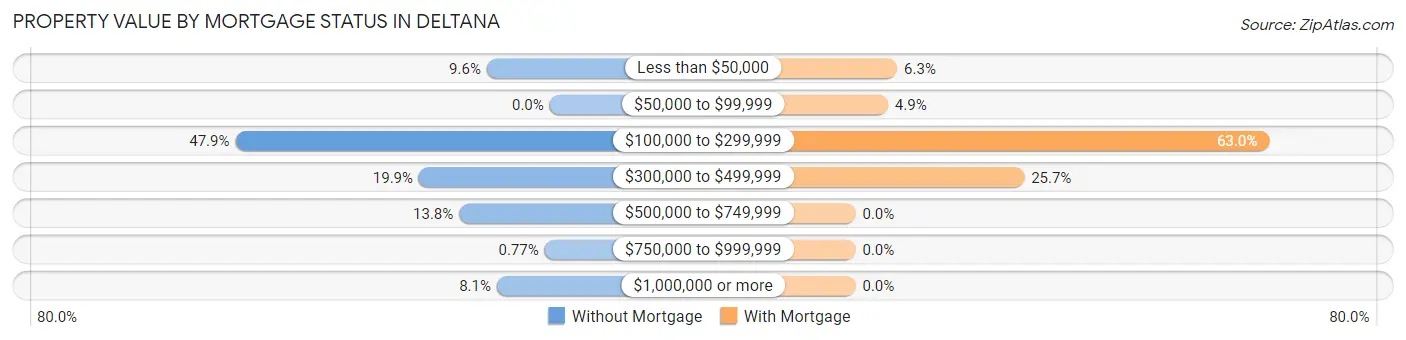
| Property Value | Without Mortgage | With Mortgage |
| Less than $50,000 | 25 (9.6%) | 18 (6.3%) |
| $50,000 to $99,999 | 0 (0.0%) | 14 (4.9%) |
| $100,000 to $299,999 | 125 (47.9%) | 179 (63.0%) |
| $300,000 to $499,999 | 52 (19.9%) | 73 (25.7%) |
| $500,000 to $749,999 | 36 (13.8%) | 0 (0.0%) |
| $750,000 to $999,999 | 2 (0.8%) | 0 (0.0%) |
| $1,000,000 or more | 21 (8.1%) | 0 (0.0%) |
| Total | 261 (100.0%) | 284 (100.0%) |
Household Income by Mortgage Status in Deltana
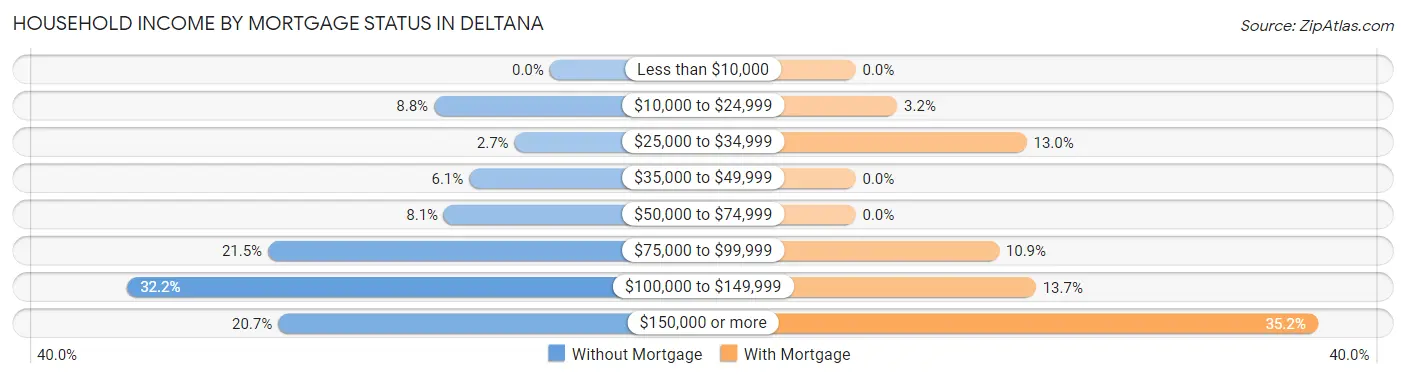
| Household Income | Without Mortgage | With Mortgage |
| Less than $10,000 | 0 (0.0%) | 0 (0.0%) |
| $10,000 to $24,999 | 23 (8.8%) | 9 (3.2%) |
| $25,000 to $34,999 | 7 (2.7%) | 37 (13.0%) |
| $35,000 to $49,999 | 16 (6.1%) | 0 (0.0%) |
| $50,000 to $74,999 | 21 (8.1%) | 0 (0.0%) |
| $75,000 to $99,999 | 56 (21.5%) | 31 (10.9%) |
| $100,000 to $149,999 | 84 (32.2%) | 39 (13.7%) |
| $150,000 or more | 54 (20.7%) | 100 (35.2%) |
| Total | 261 (100.0%) | 284 (100.0%) |
Property Value to Household Income Ratio in Deltana
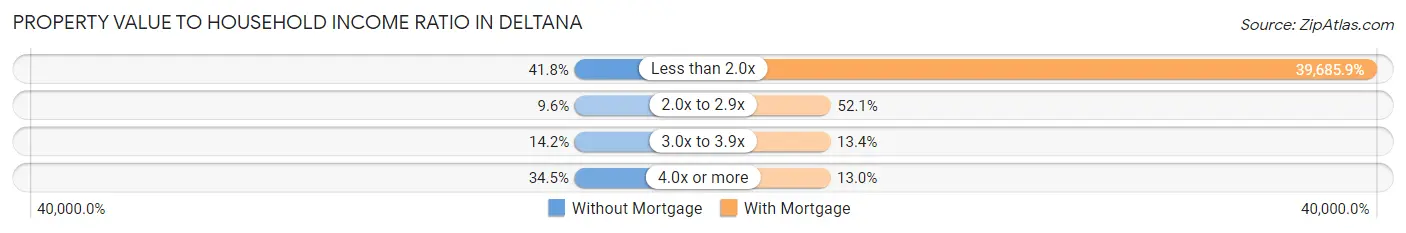
| Value-to-Income Ratio | Without Mortgage | With Mortgage |
| Less than 2.0x | 109 (41.8%) | 112,708 (39,685.9%) |
| 2.0x to 2.9x | 25 (9.6%) | 148 (52.1%) |
| 3.0x to 3.9x | 37 (14.2%) | 38 (13.4%) |
| 4.0x or more | 90 (34.5%) | 37 (13.0%) |
| Total | 261 (100.0%) | 284 (100.0%) |
Real Estate Taxes by Mortgage Status in Deltana
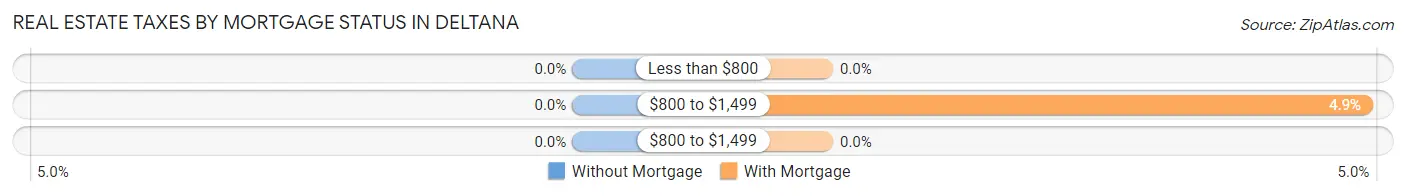
| Property Taxes | Without Mortgage | With Mortgage |
| Less than $800 | 0 (0.0%) | 0 (0.0%) |
| $800 to $1,499 | 0 (0.0%) | 14 (4.9%) |
| $800 to $1,499 | 0 (0.0%) | 0 (0.0%) |
| Total | 261 (100.0%) | 284 (100.0%) |
Health & Disability in Deltana
Health Insurance Coverage by Age in Deltana
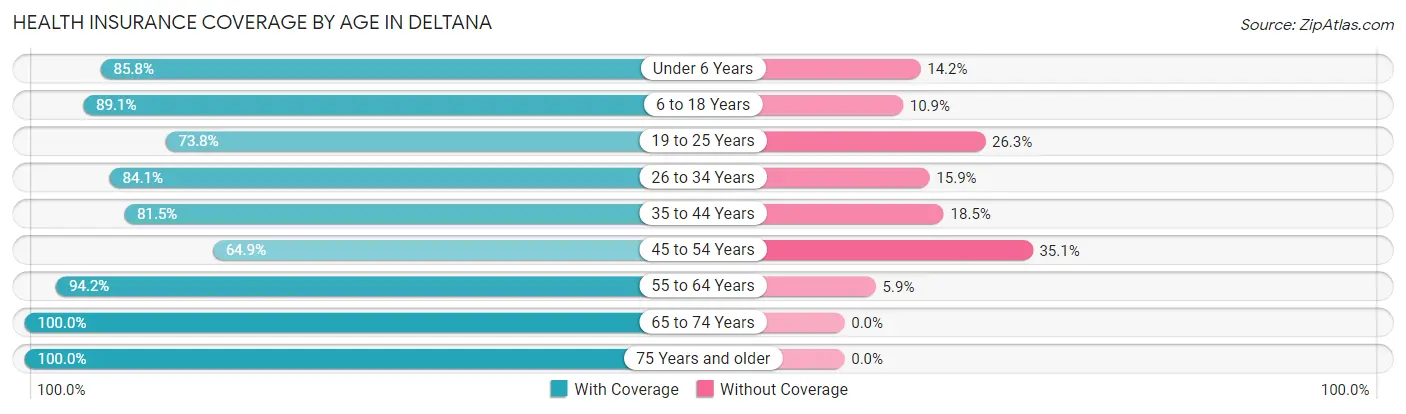
| Age Bracket | With Coverage | Without Coverage |
| Under 6 Years | 212 (85.8%) | 35 (14.2%) |
| 6 to 18 Years | 441 (89.1%) | 54 (10.9%) |
| 19 to 25 Years | 59 (73.8%) | 21 (26.3%) |
| 26 to 34 Years | 228 (84.1%) | 43 (15.9%) |
| 35 to 44 Years | 233 (81.5%) | 53 (18.5%) |
| 45 to 54 Years | 172 (64.9%) | 93 (35.1%) |
| 55 to 64 Years | 161 (94.2%) | 10 (5.9%) |
| 65 to 74 Years | 173 (100.0%) | 0 (0.0%) |
| 75 Years and older | 51 (100.0%) | 0 (0.0%) |
| Total | 1,730 (84.9%) | 309 (15.1%) |
Health Insurance Coverage by Citizenship Status in Deltana
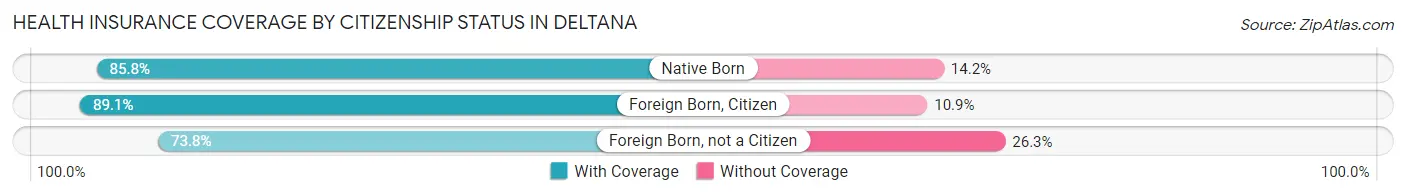
| Citizenship Status | With Coverage | Without Coverage |
| Native Born | 212 (85.8%) | 35 (14.2%) |
| Foreign Born, Citizen | 441 (89.1%) | 54 (10.9%) |
| Foreign Born, not a Citizen | 59 (73.8%) | 21 (26.3%) |
Health Insurance Coverage by Household Income in Deltana
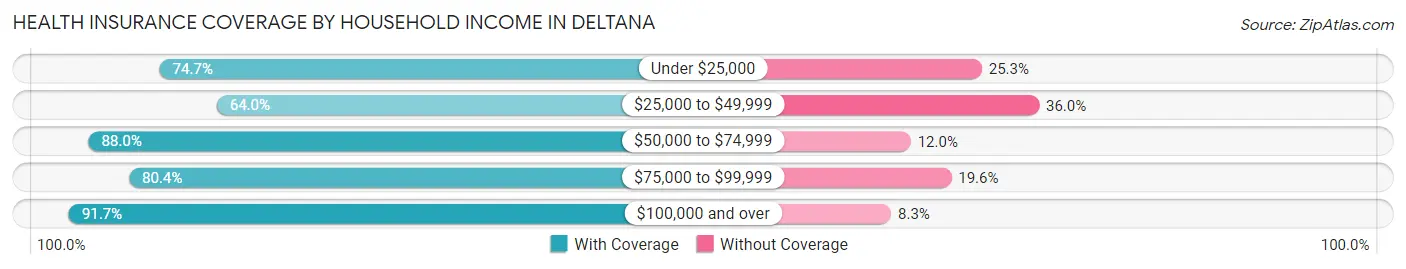
| Household Income | With Coverage | Without Coverage |
| Under $25,000 | 192 (74.7%) | 65 (25.3%) |
| $25,000 to $49,999 | 119 (64.0%) | 67 (36.0%) |
| $50,000 to $74,999 | 169 (88.0%) | 23 (12.0%) |
| $75,000 to $99,999 | 267 (80.4%) | 65 (19.6%) |
| $100,000 and over | 983 (91.7%) | 89 (8.3%) |
Public vs Private Health Insurance Coverage by Age in Deltana
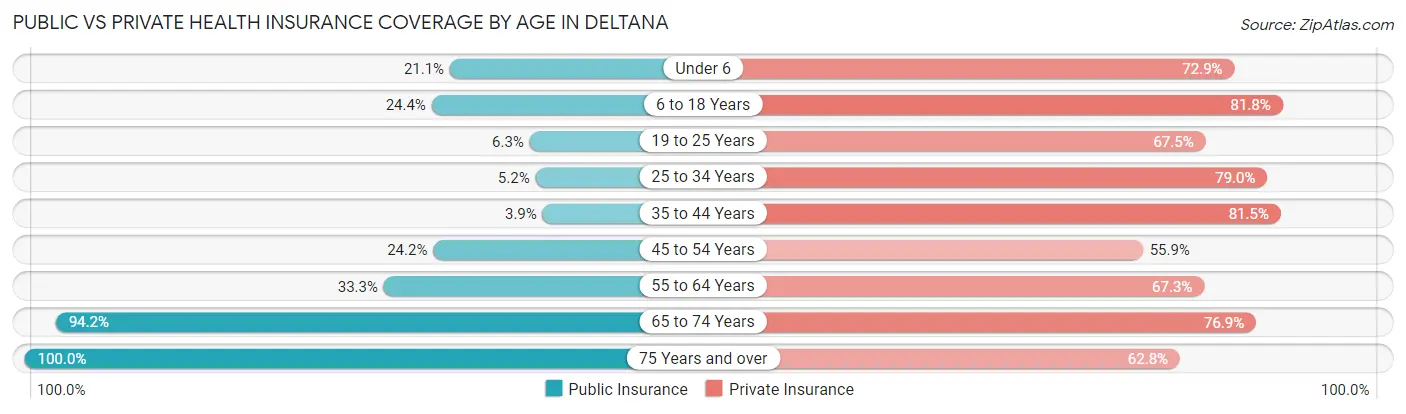
| Age Bracket | Public Insurance | Private Insurance |
| Under 6 | 52 (21.0%) | 180 (72.9%) |
| 6 to 18 Years | 121 (24.4%) | 405 (81.8%) |
| 19 to 25 Years | 5 (6.2%) | 54 (67.5%) |
| 25 to 34 Years | 14 (5.2%) | 214 (79.0%) |
| 35 to 44 Years | 11 (3.8%) | 233 (81.5%) |
| 45 to 54 Years | 64 (24.1%) | 148 (55.8%) |
| 55 to 64 Years | 57 (33.3%) | 115 (67.2%) |
| 65 to 74 Years | 163 (94.2%) | 133 (76.9%) |
| 75 Years and over | 51 (100.0%) | 32 (62.7%) |
| Total | 538 (26.4%) | 1,514 (74.3%) |
Disability Status by Sex by Age in Deltana
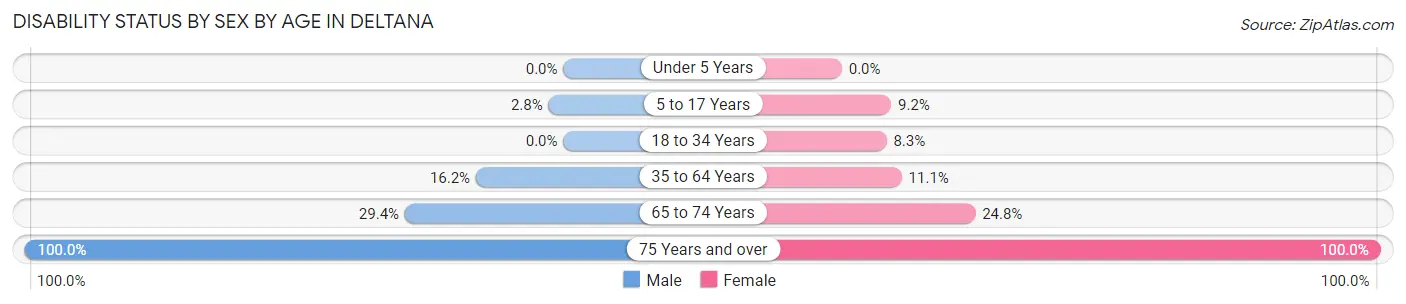
| Age Bracket | Male | Female |
| Under 5 Years | 0 (0.0%) | 0 (0.0%) |
| 5 to 17 Years | 7 (2.8%) | 28 (9.1%) |
| 18 to 34 Years | 0 (0.0%) | 17 (8.3%) |
| 35 to 64 Years | 66 (16.2%) | 35 (11.1%) |
| 65 to 74 Years | 20 (29.4%) | 26 (24.8%) |
| 75 Years and over | 40 (100.0%) | 11 (100.0%) |
Disability Class by Sex by Age in Deltana
Disability Class: Hearing Difficulty
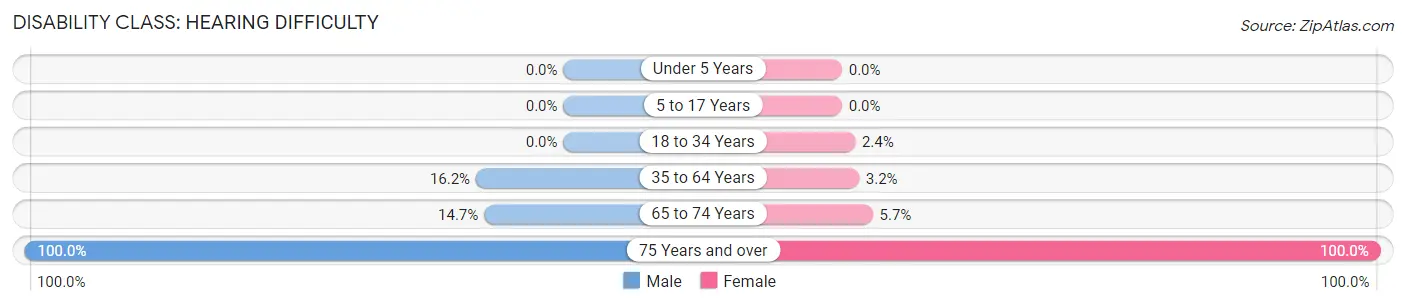
| Age Bracket | Male | Female |
| Under 5 Years | 0 (0.0%) | 0 (0.0%) |
| 5 to 17 Years | 0 (0.0%) | 0 (0.0%) |
| 18 to 34 Years | 0 (0.0%) | 5 (2.4%) |
| 35 to 64 Years | 66 (16.2%) | 10 (3.2%) |
| 65 to 74 Years | 10 (14.7%) | 6 (5.7%) |
| 75 Years and over | 40 (100.0%) | 11 (100.0%) |
Disability Class: Vision Difficulty
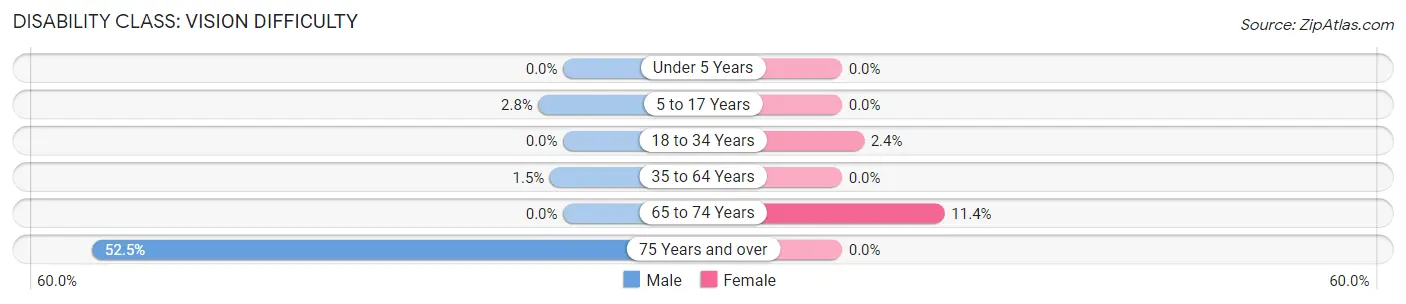
| Age Bracket | Male | Female |
| Under 5 Years | 0 (0.0%) | 0 (0.0%) |
| 5 to 17 Years | 7 (2.8%) | 0 (0.0%) |
| 18 to 34 Years | 0 (0.0%) | 5 (2.4%) |
| 35 to 64 Years | 6 (1.5%) | 0 (0.0%) |
| 65 to 74 Years | 0 (0.0%) | 12 (11.4%) |
| 75 Years and over | 21 (52.5%) | 0 (0.0%) |
Disability Class: Cognitive Difficulty
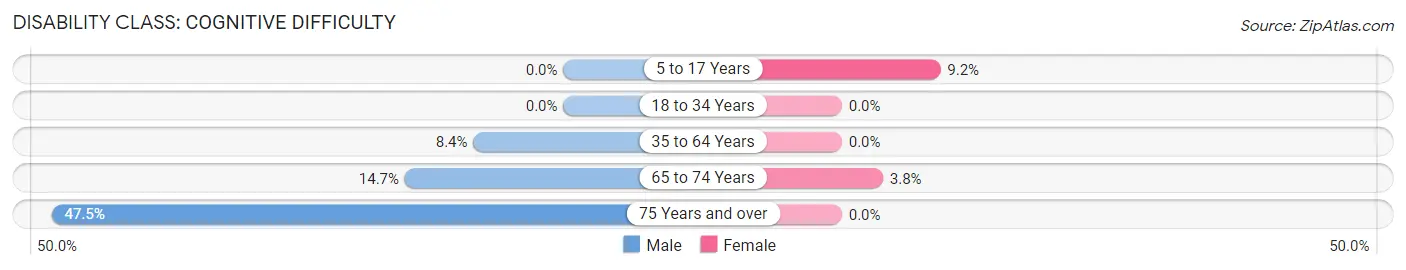
| Age Bracket | Male | Female |
| 5 to 17 Years | 0 (0.0%) | 28 (9.1%) |
| 18 to 34 Years | 0 (0.0%) | 0 (0.0%) |
| 35 to 64 Years | 34 (8.4%) | 0 (0.0%) |
| 65 to 74 Years | 10 (14.7%) | 4 (3.8%) |
| 75 Years and over | 19 (47.5%) | 0 (0.0%) |
Disability Class: Ambulatory Difficulty
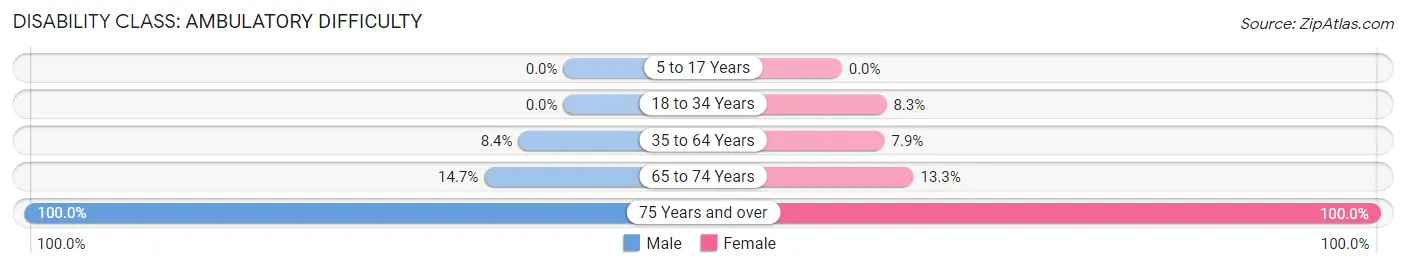
| Age Bracket | Male | Female |
| 5 to 17 Years | 0 (0.0%) | 0 (0.0%) |
| 18 to 34 Years | 0 (0.0%) | 17 (8.3%) |
| 35 to 64 Years | 34 (8.4%) | 25 (7.9%) |
| 65 to 74 Years | 10 (14.7%) | 14 (13.3%) |
| 75 Years and over | 40 (100.0%) | 11 (100.0%) |
Disability Class: Self-Care Difficulty
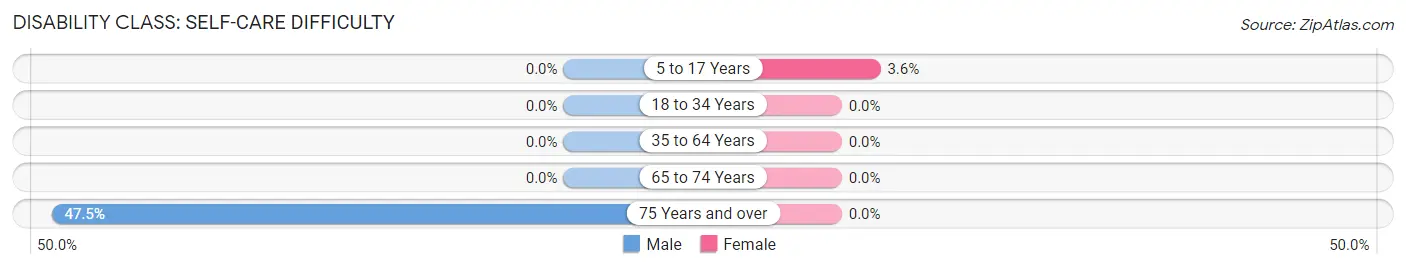
| Age Bracket | Male | Female |
| 5 to 17 Years | 0 (0.0%) | 11 (3.6%) |
| 18 to 34 Years | 0 (0.0%) | 0 (0.0%) |
| 35 to 64 Years | 0 (0.0%) | 0 (0.0%) |
| 65 to 74 Years | 0 (0.0%) | 0 (0.0%) |
| 75 Years and over | 19 (47.5%) | 0 (0.0%) |
Technology Access in Deltana
Computing Device Access in Deltana
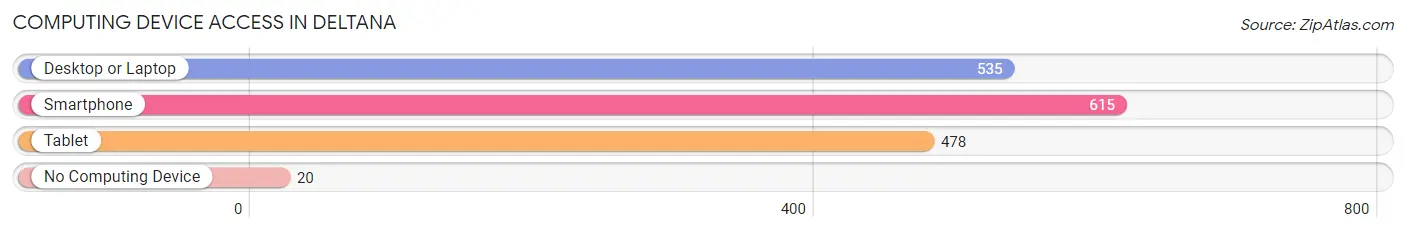
| Device Type | # Households | % Households |
| Desktop or Laptop | 535 | 82.7% |
| Smartphone | 615 | 95.1% |
| Tablet | 478 | 73.9% |
| No Computing Device | 20 | 3.1% |
| Total | 647 | 100.0% |
Internet Access in Deltana
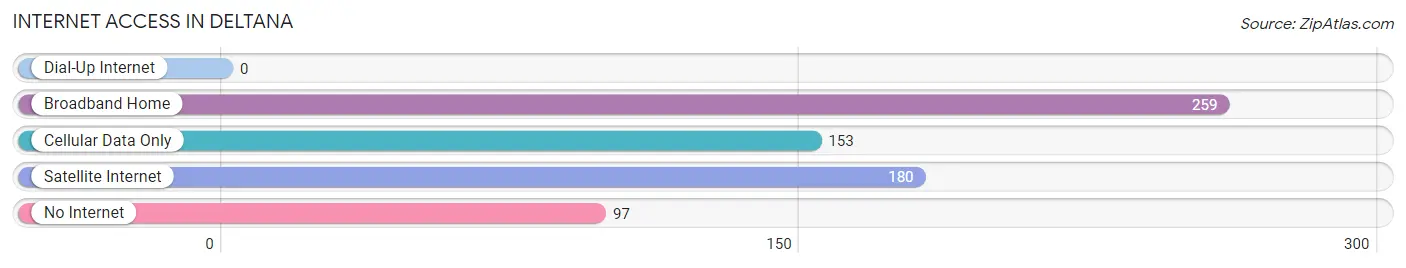
| Internet Type | # Households | % Households |
| Dial-Up Internet | 0 | 0.0% |
| Broadband Home | 259 | 40.0% |
| Cellular Data Only | 153 | 23.6% |
| Satellite Internet | 180 | 27.8% |
| No Internet | 97 | 15.0% |
| Total | 647 | 100.0% |
Deltana Summary
Deltana, Alaska is a small unincorporated community located in the Fairbanks North Star Borough of Alaska. It is situated on the south bank of the Tanana River, approximately 25 miles east of Fairbanks. The community is home to approximately 200 people, and is the only settlement in the area.
History
The area around Deltana was first inhabited by the Athabascan people, who lived in the area for thousands of years before the arrival of Europeans. The first Europeans to visit the area were Russian fur traders, who arrived in the late 18th century. The area was later explored by American prospectors in the late 19th century, and a trading post was established in the area in the early 20th century.
The community of Deltana was established in the early 1920s, when a group of homesteaders arrived in the area. The homesteaders were attracted to the area by the abundance of natural resources, including timber, fish, and game. The homesteaders built a school, a post office, and a general store, and the community quickly grew.
Geography
Deltana is located in the Fairbanks North Star Borough of Alaska, approximately 25 miles east of Fairbanks. The community is situated on the south bank of the Tanana River, and is surrounded by the White Mountains to the north and the Alaska Range to the south. The area is characterized by rolling hills, forests, and wetlands.
Economy
The economy of Deltana is largely based on subsistence activities, such as hunting, fishing, and trapping. The community is also home to a number of small businesses, including a general store, a gas station, and a restaurant. The area is also home to a number of small farms, which produce a variety of crops, including potatoes, carrots, and hay.
Demographics
As of the 2010 census, the population of Deltana was approximately 200 people. The racial makeup of the community was 95.5% White, 0.5% Native American, 0.5% Asian, and 3.5% from other races. The median household income was $45,000, and the median home value was $150,000.
Conclusion
Deltana, Alaska is a small unincorporated community located in the Fairbanks North Star Borough of Alaska. It is situated on the south bank of the Tanana River, approximately 25 miles east of Fairbanks. The community is home to approximately 200 people, and is the only settlement in the area. The economy of Deltana is largely based on subsistence activities, such as hunting, fishing, and trapping. The racial makeup of the community was 95.5% White, 0.5% Native American, 0.5% Asian, and 3.5% from other races. The median household income was $45,000, and the median home value was $150,000.
Common Questions
What is Per Capita Income in Deltana?
Per Capita income in Deltana is $34,958.
What is the Median Family Income in Deltana?
Median Family Income in Deltana is $108,125.
What is the Median Household income in Deltana?
Median Household Income in Deltana is $105,250.
What is Income or Wage Gap in Deltana?
Income or Wage Gap in Deltana is 47.0%.
Women in Deltana earn 53.0 cents for every dollar earned by a man.
What is Inequality or Gini Index in Deltana?
Inequality or Gini Index in Deltana is 0.35.
What is the Total Population of Deltana?
Total Population of Deltana is 2,059.
What is the Total Male Population of Deltana?
Total Male Population of Deltana is 1,001.
What is the Total Female Population of Deltana?
Total Female Population of Deltana is 1,058.
What is the Ratio of Males per 100 Females in Deltana?
There are 94.61 Males per 100 Females in Deltana.
What is the Ratio of Females per 100 Males in Deltana?
There are 105.69 Females per 100 Males in Deltana.
What is the Median Population Age in Deltana?
Median Population Age in Deltana is 33.2 Years.
What is the Average Family Size in Deltana
Average Family Size in Deltana is 3.6 People.
What is the Average Household Size in Deltana
Average Household Size in Deltana is 3.2 People.
How Large is the Labor Force in Deltana?
There are 888 People in the Labor Forcein in Deltana.
What is the Percentage of People in the Labor Force in Deltana?
62.4% of People are in the Labor Force in Deltana.
What is the Unemployment Rate in Deltana?
Unemployment Rate in Deltana is 3.2%.