Whittier, AK Map & Demographics
Whittier Map
Whittier Overview
$30,928
PER CAPITA INCOME
$49,231
AVG FAMILY INCOME
$48,828
AVG HOUSEHOLD INCOME
16.4%
WAGE / INCOME GAP [ % ]
83.6¢/ $1
WAGE / INCOME GAP [ $ ]
0.44
INEQUALITY / GINI INDEX
377
TOTAL POPULATION
176
MALE POPULATION
201
FEMALE POPULATION
87.56
MALES / 100 FEMALES
114.20
FEMALES / 100 MALES
36.5
MEDIAN AGE
3.0
AVG FAMILY SIZE
2.3
AVG HOUSEHOLD SIZE
192
LABOR FORCE [ PEOPLE ]
64.2%
PERCENT IN LABOR FORCE
13.0%
UNEMPLOYMENT RATE
Whittier Zip Codes
Whittier Area Codes
Income in Whittier
Income Overview in Whittier
Per Capita Income in Whittier is $30,928, while median incomes of families and households are $49,231 and $48,828 respectively.
| Characteristic | Number | Measure |
| Per Capita Income | 377 | $30,928 |
| Median Family Income | 90 | $49,231 |
| Mean Family Income | 90 | $78,521 |
| Median Household Income | 155 | $48,828 |
| Mean Household Income | 155 | $69,677 |
| Income Deficit | 90 | $0 |
| Wage / Income Gap (%) | 377 | 16.45% |
| Wage / Income Gap ($) | 377 | 83.55¢ per $1 |
| Gini / Inequality Index | 377 | 0.44 |
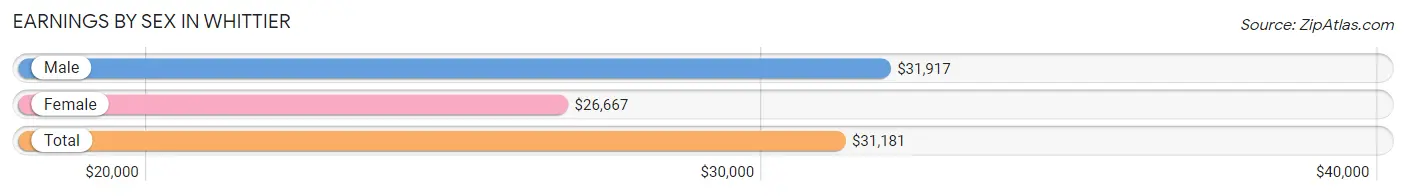
Earnings by Sex in Whittier
Average Earnings in Whittier are $31,181, $31,917 for men and $26,667 for women, a difference of 16.5%.
| Sex | Number | Average Earnings |
| Male | 119 (59.8%) | $31,917 |
| Female | 80 (40.2%) | $26,667 |
| Total | 199 (100.0%) | $31,181 |
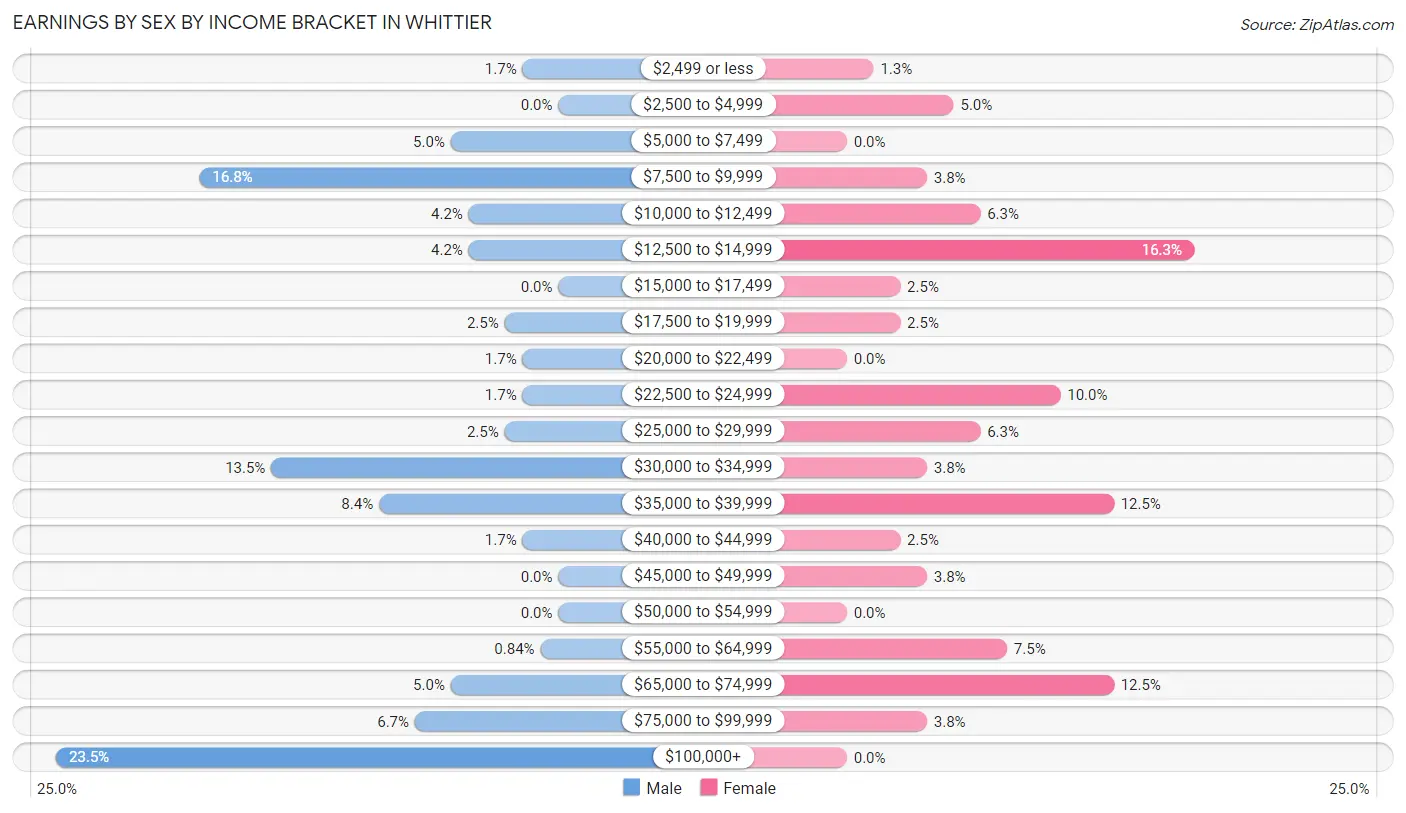
Earnings by Sex by Income Bracket in Whittier
The most common earnings brackets in Whittier are $100,000+ for men (28 | 23.5%) and $12,500 to $14,999 for women (13 | 16.3%).
| Income | Male | Female |
| $2,499 or less | 2 (1.7%) | 1 (1.3%) |
| $2,500 to $4,999 | 0 (0.0%) | 4 (5.0%) |
| $5,000 to $7,499 | 6 (5.0%) | 0 (0.0%) |
| $7,500 to $9,999 | 20 (16.8%) | 3 (3.7%) |
| $10,000 to $12,499 | 5 (4.2%) | 5 (6.2%) |
| $12,500 to $14,999 | 5 (4.2%) | 13 (16.3%) |
| $15,000 to $17,499 | 0 (0.0%) | 2 (2.5%) |
| $17,500 to $19,999 | 3 (2.5%) | 2 (2.5%) |
| $20,000 to $22,499 | 2 (1.7%) | 0 (0.0%) |
| $22,500 to $24,999 | 2 (1.7%) | 8 (10.0%) |
| $25,000 to $29,999 | 3 (2.5%) | 5 (6.2%) |
| $30,000 to $34,999 | 16 (13.5%) | 3 (3.7%) |
| $35,000 to $39,999 | 10 (8.4%) | 10 (12.5%) |
| $40,000 to $44,999 | 2 (1.7%) | 2 (2.5%) |
| $45,000 to $49,999 | 0 (0.0%) | 3 (3.7%) |
| $50,000 to $54,999 | 0 (0.0%) | 0 (0.0%) |
| $55,000 to $64,999 | 1 (0.8%) | 6 (7.5%) |
| $65,000 to $74,999 | 6 (5.0%) | 10 (12.5%) |
| $75,000 to $99,999 | 8 (6.7%) | 3 (3.7%) |
| $100,000+ | 28 (23.5%) | 0 (0.0%) |
| Total | 119 (100.0%) | 80 (100.0%) |
Earnings by Sex by Educational Attainment in Whittier
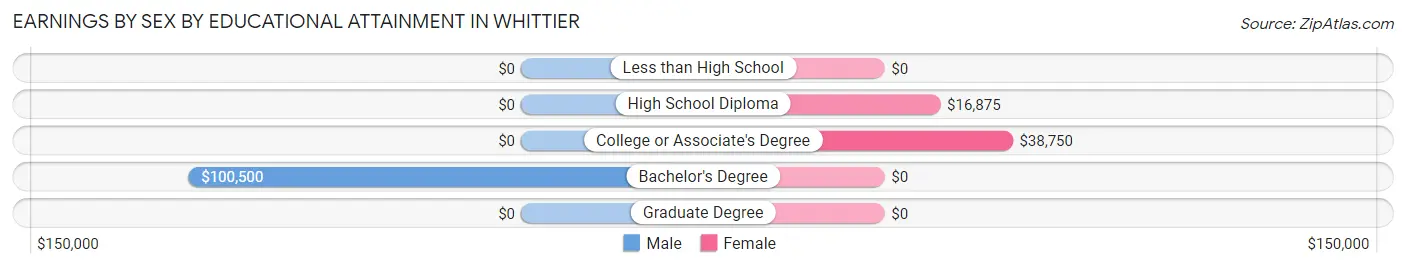
| Educational Attainment | Male Income | Female Income |
| Less than High School | - | - |
| High School Diploma | - | - |
| College or Associate's Degree | - | - |
| Bachelor's Degree | $100,500 | $0 |
| Graduate Degree | - | - |
| Total | - | - |
Family Income in Whittier
Family Income Brackets in Whittier
According to the Whittier family income data, there are 19 families falling into the $35,000 to $49,999 income range, which is the most common income bracket and makes up 21.1% of all families. Conversely, the $10,000 to $14,999 income bracket is the least frequent group with only 5 families (5.6%) belonging to this category.
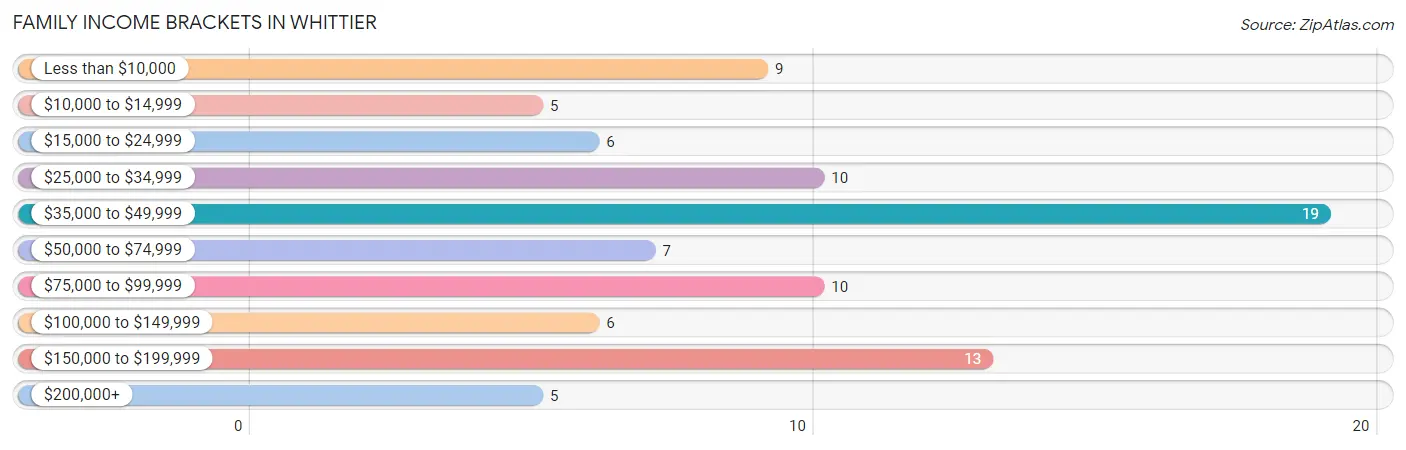
| Income Bracket | # Families | % Families |
| Less than $10,000 | 9 | 10.0% |
| $10,000 to $14,999 | 5 | 5.6% |
| $15,000 to $24,999 | 6 | 6.7% |
| $25,000 to $34,999 | 10 | 11.1% |
| $35,000 to $49,999 | 19 | 21.1% |
| $50,000 to $74,999 | 7 | 7.8% |
| $75,000 to $99,999 | 10 | 11.1% |
| $100,000 to $149,999 | 6 | 6.7% |
| $150,000 to $199,999 | 13 | 14.4% |
| $200,000+ | 5 | 5.6% |
Family Income by Famaliy Size in Whittier
4-person families (26 | 28.9%) account for the highest median family income in Whittier with $56,250 per family, while 4-person families (26 | 28.9%) have the highest median income of $14,062 per family member.
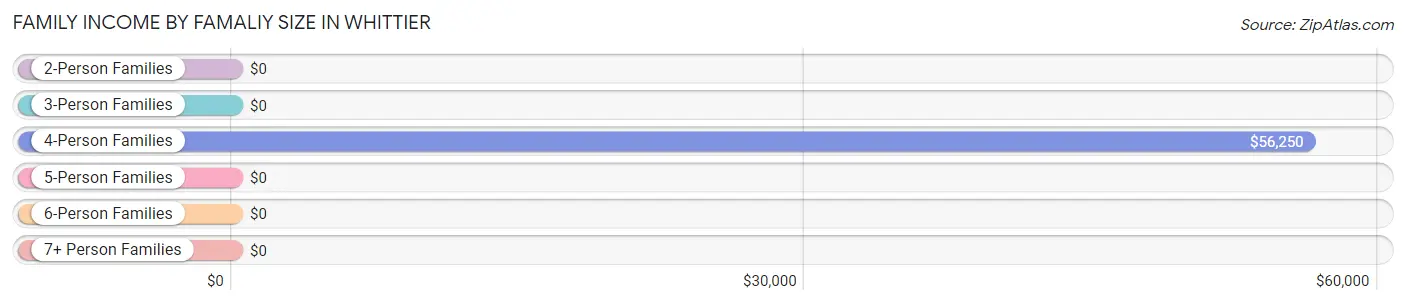
| Income Bracket | # Families | Median Income |
| 2-Person Families | 39 (43.3%) | $0 |
| 3-Person Families | 8 (8.9%) | $0 |
| 4-Person Families | 26 (28.9%) | $56,250 |
| 5-Person Families | 15 (16.7%) | $0 |
| 6-Person Families | 0 (0.0%) | $0 |
| 7+ Person Families | 2 (2.2%) | $0 |
| Total | 90 (100.0%) | $49,231 |
Family Income by Number of Earners in Whittier
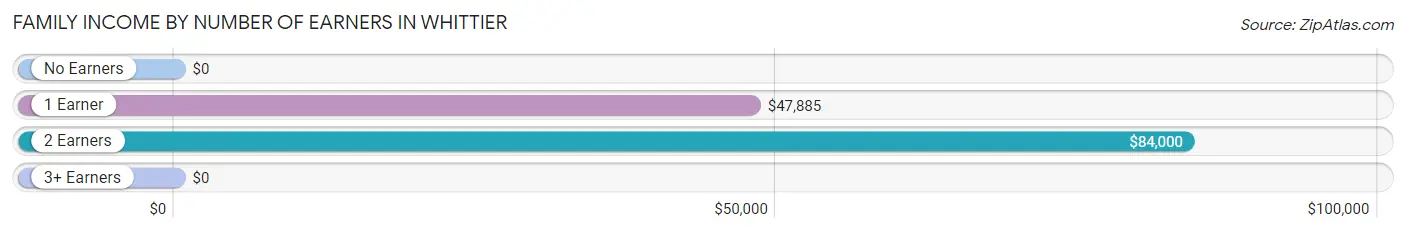
| Number of Earners | # Families | Median Income |
| No Earners | 20 (22.2%) | $0 |
| 1 Earner | 34 (37.8%) | $47,885 |
| 2 Earners | 30 (33.3%) | $84,000 |
| 3+ Earners | 6 (6.7%) | $0 |
| Total | 90 (100.0%) | $49,231 |
Household Income in Whittier
Household Income Brackets in Whittier
With 39 households falling in the category, the $35,000 to $49,999 income range is the most frequent in Whittier, accounting for 25.2% of all households. In contrast, only 5 households (3.2%) fall into the $200,000+ income bracket, making it the least populous group.
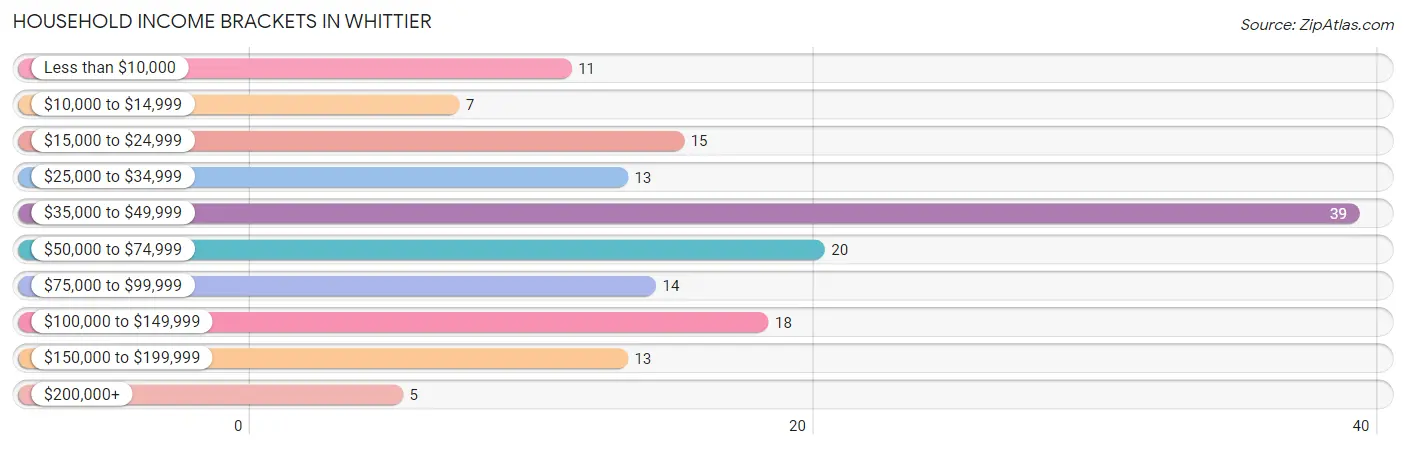
| Income Bracket | # Households | % Households |
| Less than $10,000 | 11 | 7.1% |
| $10,000 to $14,999 | 7 | 4.5% |
| $15,000 to $24,999 | 15 | 9.7% |
| $25,000 to $34,999 | 13 | 8.4% |
| $35,000 to $49,999 | 39 | 25.2% |
| $50,000 to $74,999 | 20 | 12.9% |
| $75,000 to $99,999 | 14 | 9.0% |
| $100,000 to $149,999 | 18 | 11.6% |
| $150,000 to $199,999 | 13 | 8.4% |
| $200,000+ | 5 | 3.2% |
Household Income by Householder Age in Whittier
The median household income in Whittier is $48,828, with the highest median household income of $74,028 found in the 45 to 64 years age bracket for the primary householder. A total of 59 households (38.1%) fall into this category. Meanwhile, the 15 to 24 years age bracket for the primary householder has the lowest median household income of $0, with 2 households (1.3%) in this group.
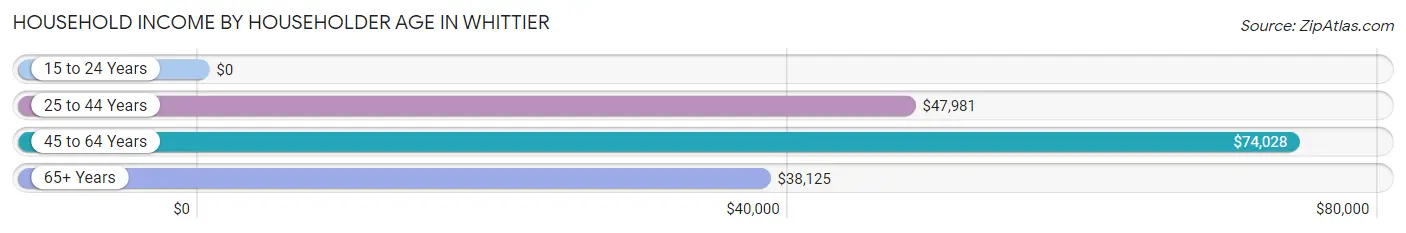
| Income Bracket | # Households | Median Income |
| 15 to 24 Years | 2 (1.3%) | $0 |
| 25 to 44 Years | 55 (35.5%) | $47,981 |
| 45 to 64 Years | 59 (38.1%) | $74,028 |
| 65+ Years | 39 (25.2%) | $38,125 |
| Total | 155 (100.0%) | $48,828 |
Poverty in Whittier
Income Below Poverty by Sex and Age in Whittier
With 26.1% poverty level for males and 18.9% for females among the residents of Whittier, 5 year old males and 65 to 74 year old females are the most vulnerable to poverty, with 2 males (100.0%) and 12 females (60.0%) in their respective age groups living below the poverty level.
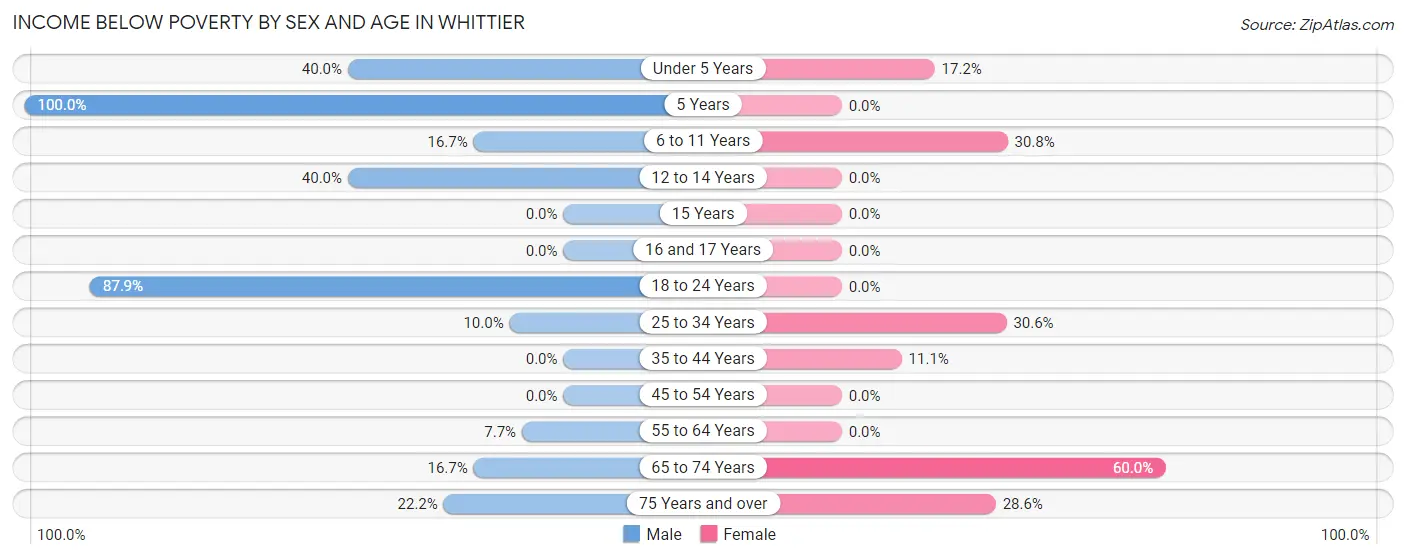
| Age Bracket | Male | Female |
| Under 5 Years | 2 (40.0%) | 5 (17.2%) |
| 5 Years | 2 (100.0%) | 0 (0.0%) |
| 6 to 11 Years | 1 (16.7%) | 4 (30.8%) |
| 12 to 14 Years | 2 (40.0%) | 0 (0.0%) |
| 15 Years | 0 (0.0%) | 0 (0.0%) |
| 16 and 17 Years | 0 (0.0%) | 0 (0.0%) |
| 18 to 24 Years | 29 (87.9%) | 0 (0.0%) |
| 25 to 34 Years | 2 (10.0%) | 11 (30.6%) |
| 35 to 44 Years | 0 (0.0%) | 4 (11.1%) |
| 45 to 54 Years | 0 (0.0%) | 0 (0.0%) |
| 55 to 64 Years | 3 (7.7%) | 0 (0.0%) |
| 65 to 74 Years | 3 (16.7%) | 12 (60.0%) |
| 75 Years and over | 2 (22.2%) | 2 (28.6%) |
| Total | 46 (26.1%) | 38 (18.9%) |
Income Above Poverty by Sex and Age in Whittier
According to the poverty statistics in Whittier, males aged 16 and 17 years and females aged 12 to 14 years are the age groups that are most secure financially, with 100.0% of males and 100.0% of females in these age groups living above the poverty line.
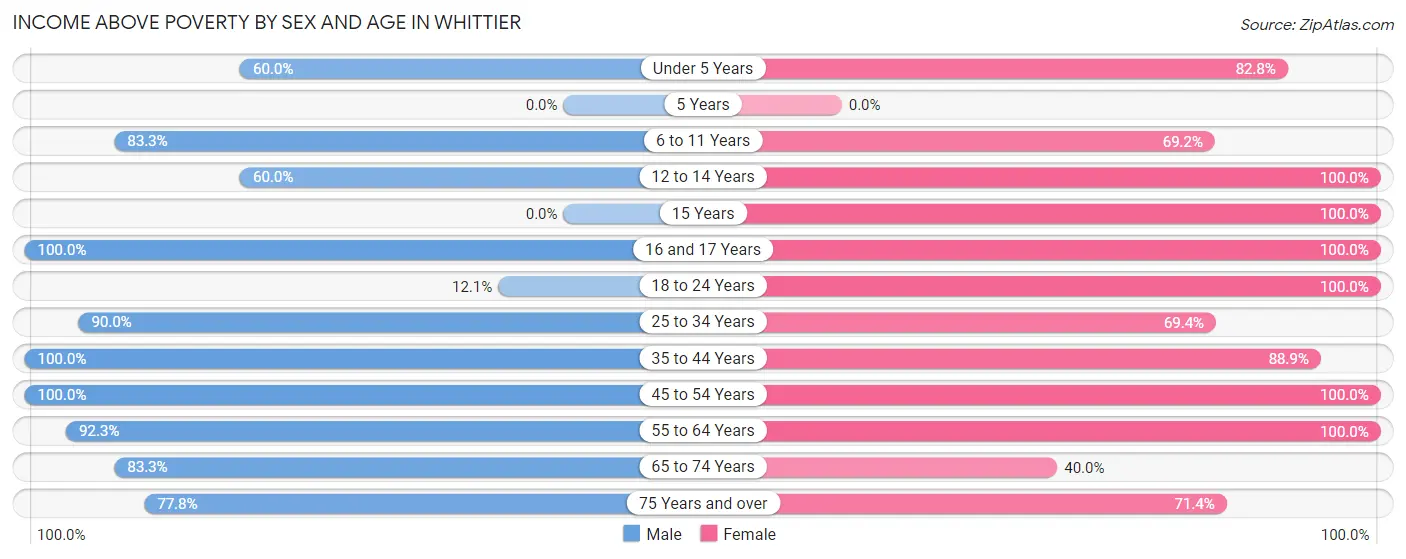
| Age Bracket | Male | Female |
| Under 5 Years | 3 (60.0%) | 24 (82.8%) |
| 5 Years | 0 (0.0%) | 0 (0.0%) |
| 6 to 11 Years | 5 (83.3%) | 9 (69.2%) |
| 12 to 14 Years | 3 (60.0%) | 16 (100.0%) |
| 15 Years | 0 (0.0%) | 2 (100.0%) |
| 16 and 17 Years | 6 (100.0%) | 7 (100.0%) |
| 18 to 24 Years | 4 (12.1%) | 4 (100.0%) |
| 25 to 34 Years | 18 (90.0%) | 25 (69.4%) |
| 35 to 44 Years | 6 (100.0%) | 32 (88.9%) |
| 45 to 54 Years | 27 (100.0%) | 7 (100.0%) |
| 55 to 64 Years | 36 (92.3%) | 24 (100.0%) |
| 65 to 74 Years | 15 (83.3%) | 8 (40.0%) |
| 75 Years and over | 7 (77.8%) | 5 (71.4%) |
| Total | 130 (73.9%) | 163 (81.1%) |
Income Below Poverty Among Married-Couple Families in Whittier
The poverty statistics for married-couple families in Whittier show that 6.5% or 4 of the total 62 families live below the poverty line. Families with 5 or more children have the highest poverty rate of 100.0%, comprising of 2 families. On the other hand, families with 1 or 2 children have the lowest poverty rate of 0.0%, which includes 0 families.
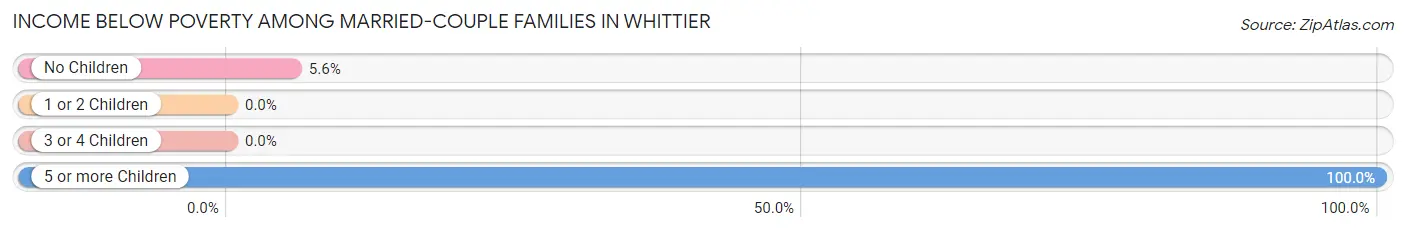
| Children | Above Poverty | Below Poverty |
| No Children | 34 (94.4%) | 2 (5.6%) |
| 1 or 2 Children | 11 (100.0%) | 0 (0.0%) |
| 3 or 4 Children | 13 (100.0%) | 0 (0.0%) |
| 5 or more Children | 0 (0.0%) | 2 (100.0%) |
| Total | 58 (93.5%) | 4 (6.5%) |
Income Below Poverty Among Single-Parent Households in Whittier
According to the poverty data in Whittier, 42.9% or 3 single-father households and 57.1% or 12 single-mother households are living below the poverty line. Among single-father households, those with 1 or 2 children have the highest poverty rate, with 3 households (42.9%) experiencing poverty. Likewise, among single-mother households, those with 3 or 4 children have the highest poverty rate, with 6 households (100.0%) falling below the poverty line.
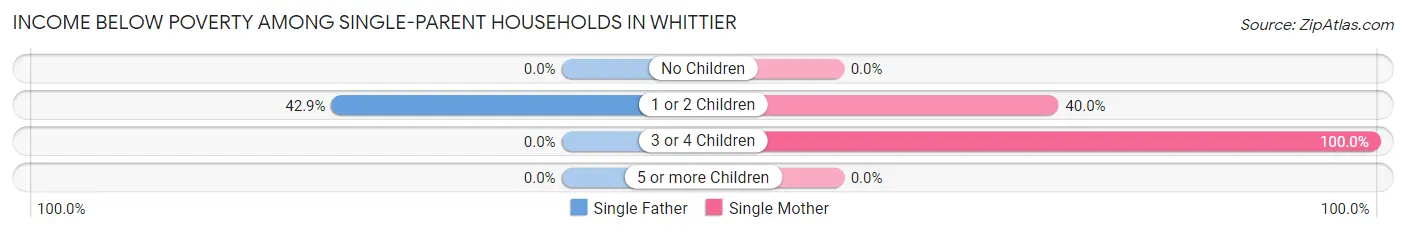
| Children | Single Father | Single Mother |
| No Children | 0 (0.0%) | 0 (0.0%) |
| 1 or 2 Children | 3 (42.9%) | 6 (40.0%) |
| 3 or 4 Children | 0 (0.0%) | 6 (100.0%) |
| 5 or more Children | 0 (0.0%) | 0 (0.0%) |
| Total | 3 (42.9%) | 12 (57.1%) |
Income Below Poverty Among Married-Couple vs Single-Parent Households in Whittier
The poverty data for Whittier shows that 4 of the married-couple family households (6.5%) and 15 of the single-parent households (53.6%) are living below the poverty level. Within the married-couple family households, those with 5 or more children have the highest poverty rate, with 2 households (100.0%) falling below the poverty line. Among the single-parent households, those with 3 or 4 children have the highest poverty rate, with 6 household (100.0%) living below poverty.
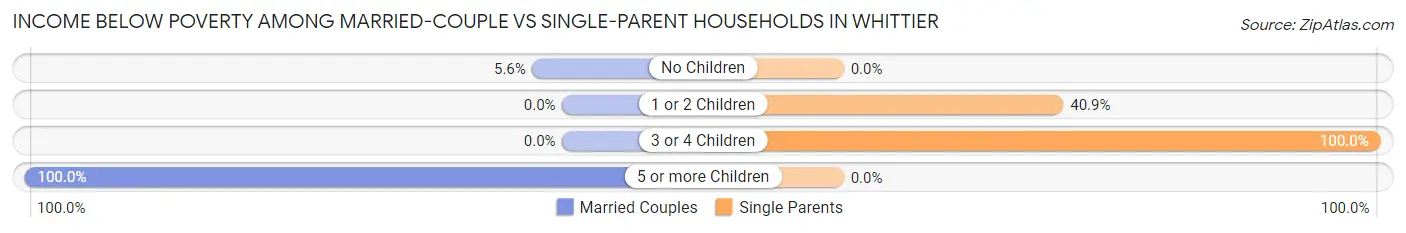
| Children | Married-Couple Families | Single-Parent Households |
| No Children | 2 (5.6%) | 0 (0.0%) |
| 1 or 2 Children | 0 (0.0%) | 9 (40.9%) |
| 3 or 4 Children | 0 (0.0%) | 6 (100.0%) |
| 5 or more Children | 2 (100.0%) | 0 (0.0%) |
| Total | 4 (6.5%) | 15 (53.6%) |
Race in Whittier
The most populous races in Whittier are White / Caucasian (180 | 47.7%), Asian (92 | 24.4%), and Hawaiian / Pacific (51 | 13.5%).
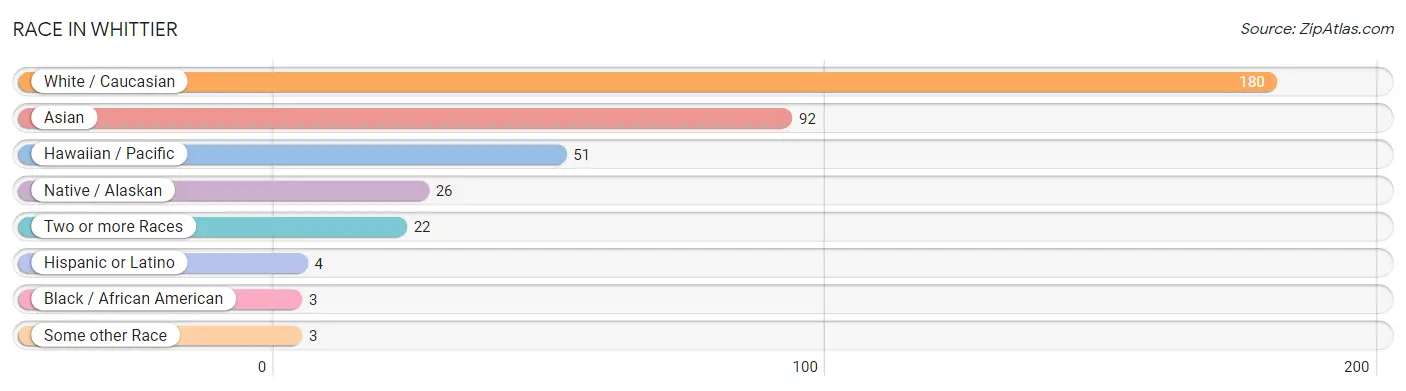
| Race | # Population | % Population |
| Asian | 92 | 24.4% |
| Black / African American | 3 | 0.8% |
| Hawaiian / Pacific | 51 | 13.5% |
| Hispanic or Latino | 4 | 1.1% |
| Native / Alaskan | 26 | 6.9% |
| White / Caucasian | 180 | 47.7% |
| Two or more Races | 22 | 5.8% |
| Some other Race | 3 | 0.8% |
| Total | 377 | 100.0% |
Ancestry in Whittier
The most populous ancestries reported in Whittier are English (65 | 17.2%), Korean (58 | 15.4%), Samoan (41 | 10.9%), German (38 | 10.1%), and Irish (22 | 5.8%), together accounting for 59.4% of all Whittier residents.
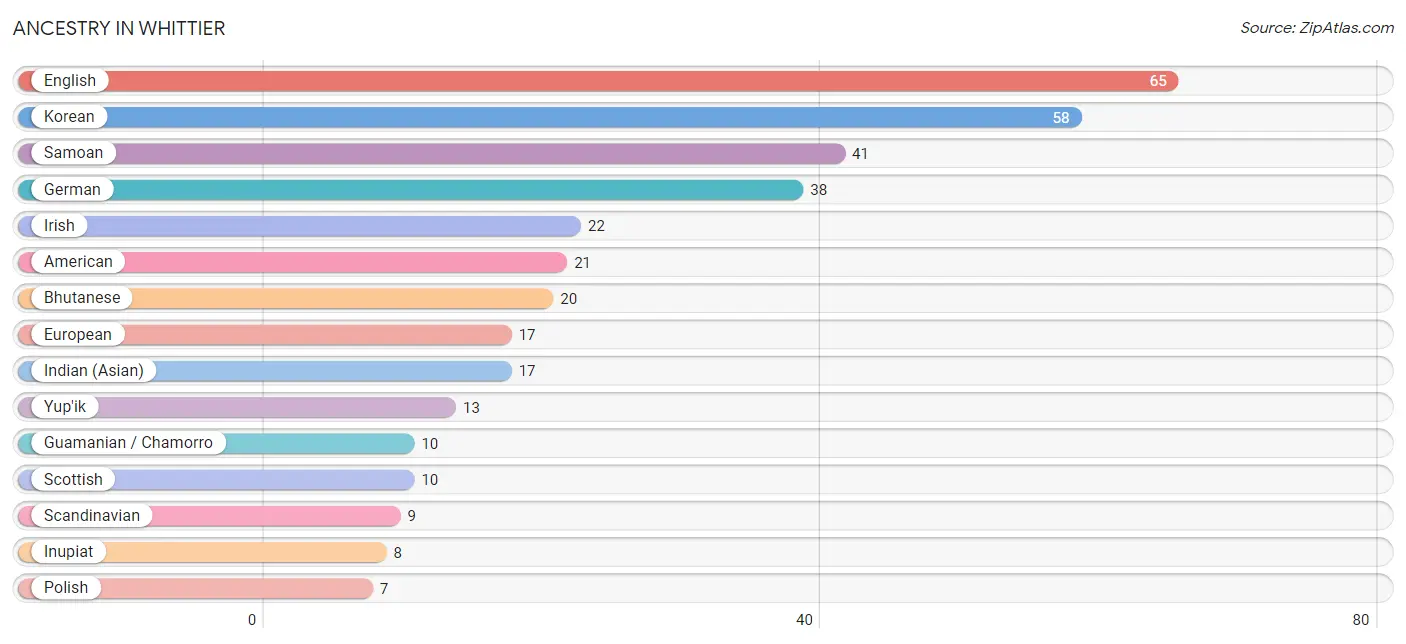
| Ancestry | # Population | % Population |
| Alaska Native | 5 | 1.3% |
| Alaskan Athabascan | 5 | 1.3% |
| Aleut | 3 | 0.8% |
| American | 21 | 5.6% |
| Apache | 3 | 0.8% |
| Belgian | 2 | 0.5% |
| Bhutanese | 20 | 5.3% |
| Canadian | 2 | 0.5% |
| Czech | 1 | 0.3% |
| Czechoslovakian | 5 | 1.3% |
| Danish | 3 | 0.8% |
| Dutch | 4 | 1.1% |
| English | 65 | 17.2% |
| European | 17 | 4.5% |
| French | 4 | 1.1% |
| French Canadian | 4 | 1.1% |
| German | 38 | 10.1% |
| Guamanian / Chamorro | 10 | 2.6% |
| Indian (Asian) | 17 | 4.5% |
| Inupiat | 8 | 2.1% |
| Irish | 22 | 5.8% |
| Italian | 3 | 0.8% |
| Korean | 58 | 15.4% |
| Mexican | 4 | 1.1% |
| Navajo | 5 | 1.3% |
| Norwegian | 5 | 1.3% |
| Polish | 7 | 1.9% |
| Russian | 1 | 0.3% |
| Samoan | 41 | 10.9% |
| Scandinavian | 9 | 2.4% |
| Scottish | 10 | 2.6% |
| Swedish | 6 | 1.6% |
| Swiss | 2 | 0.5% |
| Ukrainian | 4 | 1.1% |
| Yup'ik | 13 | 3.5% | View All 35 Rows |
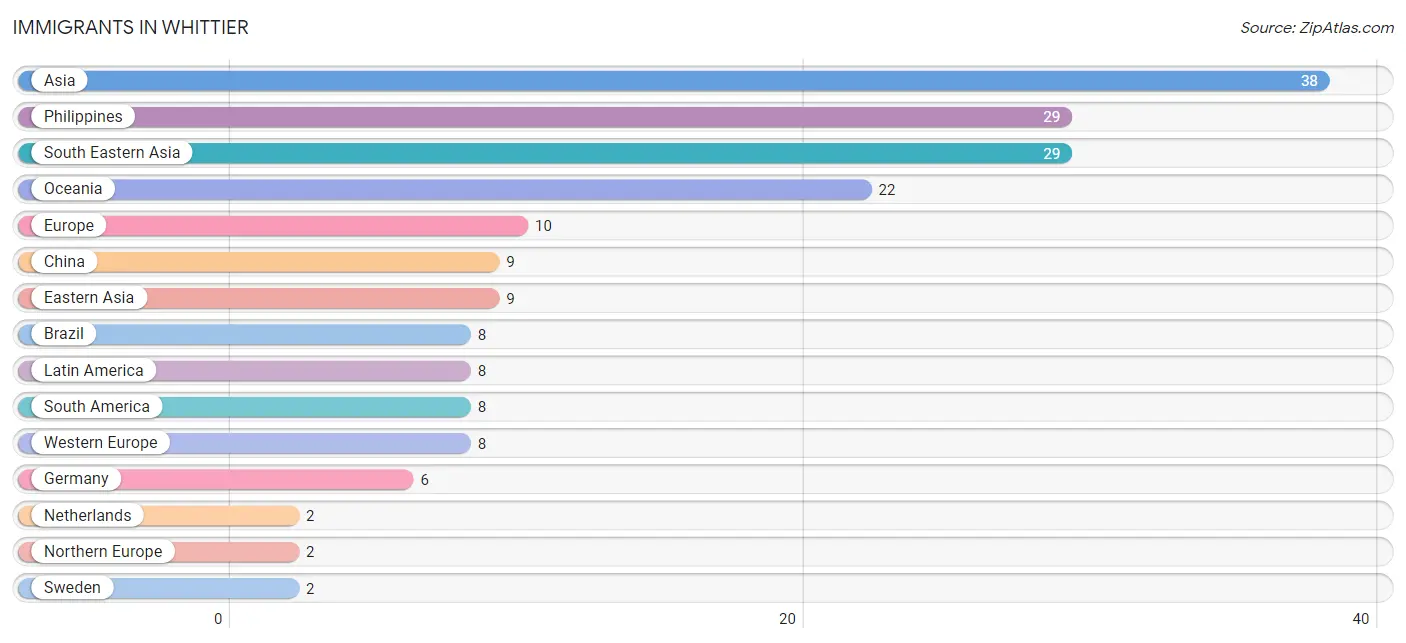
Immigrants in Whittier
The most numerous immigrant groups reported in Whittier came from Asia (38 | 10.1%), Philippines (29 | 7.7%), South Eastern Asia (29 | 7.7%), Oceania (22 | 5.8%), and Europe (10 | 2.6%), together accounting for 34.0% of all Whittier residents.
| Immigration Origin | # Population | % Population |
| Asia | 38 | 10.1% |
| Brazil | 8 | 2.1% |
| China | 9 | 2.4% |
| Eastern Asia | 9 | 2.4% |
| Europe | 10 | 2.6% |
| Germany | 6 | 1.6% |
| Latin America | 8 | 2.1% |
| Netherlands | 2 | 0.5% |
| Northern Europe | 2 | 0.5% |
| Oceania | 22 | 5.8% |
| Philippines | 29 | 7.7% |
| South America | 8 | 2.1% |
| South Eastern Asia | 29 | 7.7% |
| Sweden | 2 | 0.5% |
| Western Europe | 8 | 2.1% | View All 15 Rows |
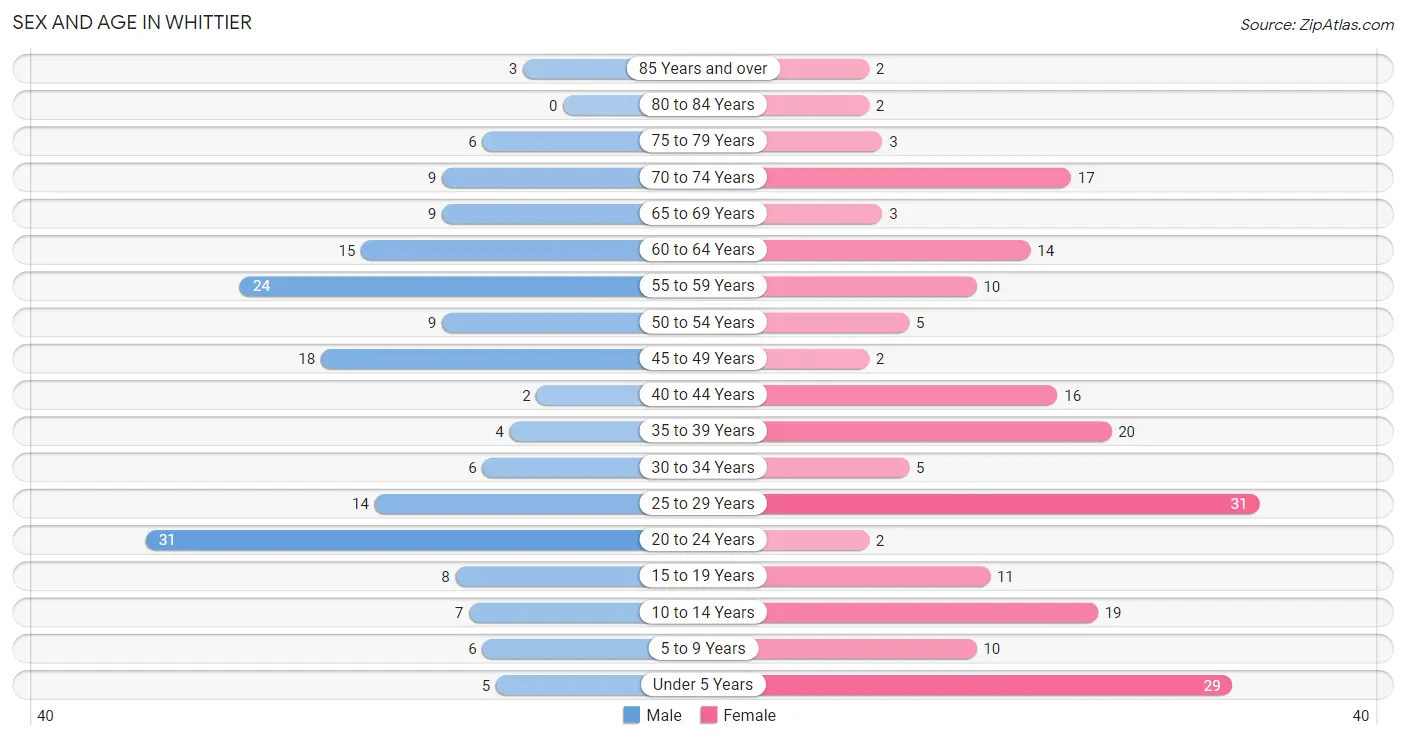
Sex and Age in Whittier
Sex and Age in Whittier
The most populous age groups in Whittier are 20 to 24 Years (31 | 17.6%) for men and 25 to 29 Years (31 | 15.4%) for women.
| Age Bracket | Male | Female |
| Under 5 Years | 5 (2.8%) | 29 (14.4%) |
| 5 to 9 Years | 6 (3.4%) | 10 (5.0%) |
| 10 to 14 Years | 7 (4.0%) | 19 (9.5%) |
| 15 to 19 Years | 8 (4.5%) | 11 (5.5%) |
| 20 to 24 Years | 31 (17.6%) | 2 (1.0%) |
| 25 to 29 Years | 14 (8.0%) | 31 (15.4%) |
| 30 to 34 Years | 6 (3.4%) | 5 (2.5%) |
| 35 to 39 Years | 4 (2.3%) | 20 (10.0%) |
| 40 to 44 Years | 2 (1.1%) | 16 (8.0%) |
| 45 to 49 Years | 18 (10.2%) | 2 (1.0%) |
| 50 to 54 Years | 9 (5.1%) | 5 (2.5%) |
| 55 to 59 Years | 24 (13.6%) | 10 (5.0%) |
| 60 to 64 Years | 15 (8.5%) | 14 (7.0%) |
| 65 to 69 Years | 9 (5.1%) | 3 (1.5%) |
| 70 to 74 Years | 9 (5.1%) | 17 (8.5%) |
| 75 to 79 Years | 6 (3.4%) | 3 (1.5%) |
| 80 to 84 Years | 0 (0.0%) | 2 (1.0%) |
| 85 Years and over | 3 (1.7%) | 2 (1.0%) |
| Total | 176 (100.0%) | 201 (100.0%) |
Families and Households in Whittier
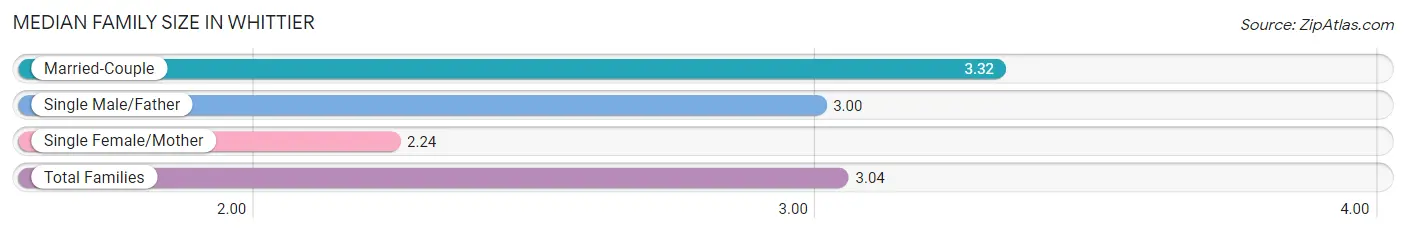
Median Family Size in Whittier
The median family size in Whittier is 3.04 persons per family, with married-couple families (62 | 68.9%) accounting for the largest median family size of 3.32 persons per family. On the other hand, single female/mother families (21 | 23.3%) represent the smallest median family size with 2.24 persons per family.
| Family Type | # Families | Family Size |
| Married-Couple | 62 (68.9%) | 3.32 |
| Single Male/Father | 7 (7.8%) | 3.00 |
| Single Female/Mother | 21 (23.3%) | 2.24 |
| Total Families | 90 (100.0%) | 3.04 |
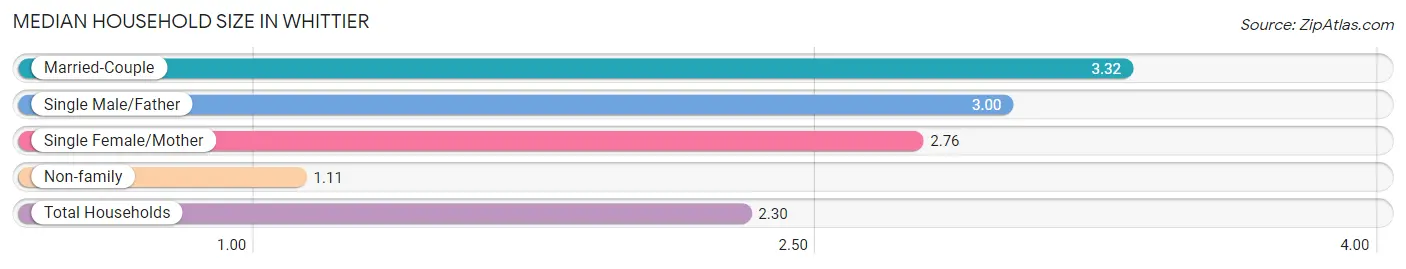
Median Household Size in Whittier
The median household size in Whittier is 2.30 persons per household, with married-couple households (62 | 40.0%) accounting for the largest median household size of 3.32 persons per household. non-family households (65 | 41.9%) represent the smallest median household size with 1.11 persons per household.
| Household Type | # Households | Household Size |
| Married-Couple | 62 (40.0%) | 3.32 |
| Single Male/Father | 7 (4.5%) | 3.00 |
| Single Female/Mother | 21 (13.6%) | 2.76 |
| Non-family | 65 (41.9%) | 1.11 |
| Total Households | 155 (100.0%) | 2.30 |
Household Size by Marriage Status in Whittier
Out of a total of 155 households in Whittier, 90 (58.1%) are family households, while 65 (41.9%) are nonfamily households. The most numerous type of family households are 2-person households, comprising 36, and the most common type of nonfamily households are 1-person households, comprising 51.
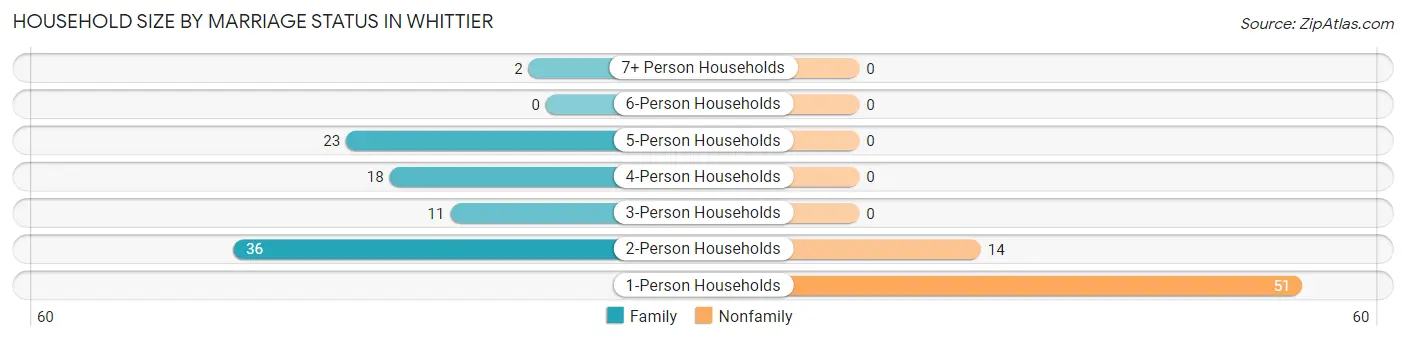
| Household Size | Family Households | Nonfamily Households |
| 1-Person Households | - | 51 (32.9%) |
| 2-Person Households | 36 (23.2%) | 14 (9.0%) |
| 3-Person Households | 11 (7.1%) | 0 (0.0%) |
| 4-Person Households | 18 (11.6%) | 0 (0.0%) |
| 5-Person Households | 23 (14.8%) | 0 (0.0%) |
| 6-Person Households | 0 (0.0%) | 0 (0.0%) |
| 7+ Person Households | 2 (1.3%) | 0 (0.0%) |
| Total | 90 (58.1%) | 65 (41.9%) |
Female Fertility in Whittier
Fertility by Age in Whittier
Average fertility rate in Whittier is 34.0 births per 1,000 women. Women in the age bracket of 20 to 34 years have the highest fertility rate with 79.0 births per 1,000 women. Women in the age bracket of 20 to 34 years acount for 100.0% of all women with births.
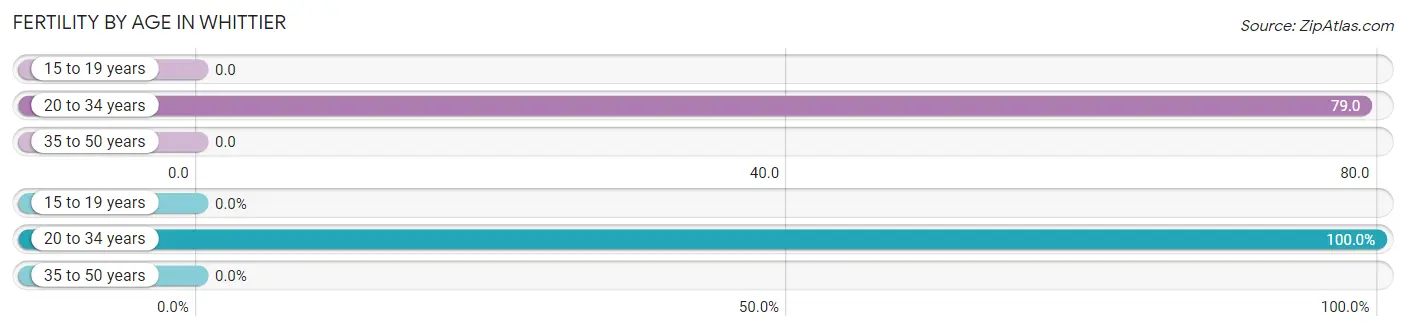
| Age Bracket | Women with Births | Births / 1,000 Women |
| 15 to 19 years | 0 (0.0%) | 0.0 |
| 20 to 34 years | 3 (100.0%) | 79.0 |
| 35 to 50 years | 0 (0.0%) | 0.0 |
| Total | 3 (100.0%) | 34.0 |
Fertility by Age by Marriage Status in Whittier
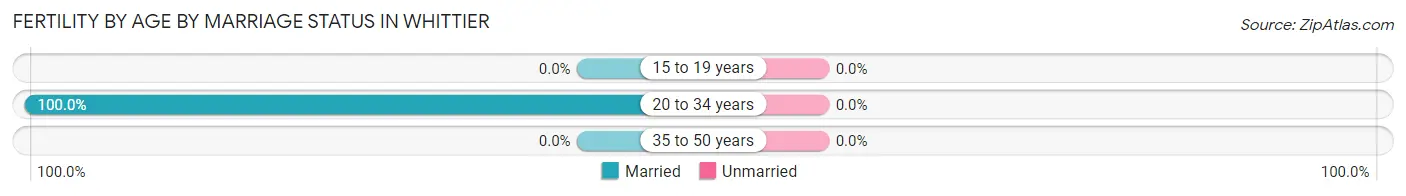
| Age Bracket | Married | Unmarried |
| 15 to 19 years | 0 (0.0%) | 0 (0.0%) |
| 20 to 34 years | 3 (100.0%) | 0 (0.0%) |
| 35 to 50 years | 0 (0.0%) | 0 (0.0%) |
| Total | 3 (100.0%) | 0 (0.0%) |
Fertility by Education in Whittier
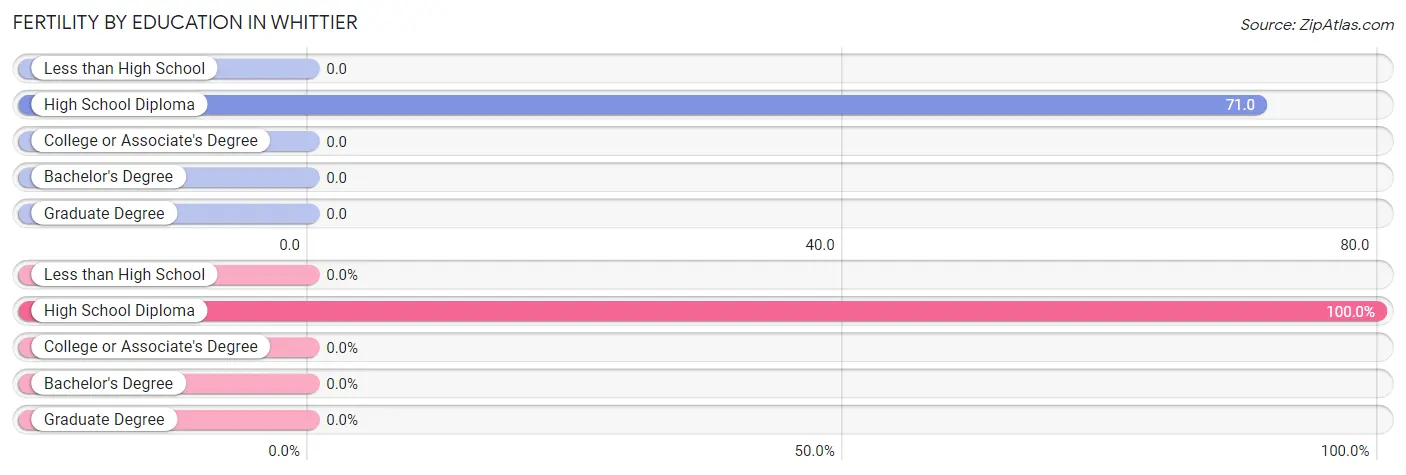
| Educational Attainment | Women with Births | Births / 1,000 Women |
| Less than High School | 0 (0.0%) | 0.0 |
| High School Diploma | 3 (100.0%) | 71.0 |
| College or Associate's Degree | 0 (0.0%) | 0.0 |
| Bachelor's Degree | 0 (0.0%) | 0.0 |
| Graduate Degree | 0 (0.0%) | 0.0 |
| Total | 3 (100.0%) | 34.0 |
Fertility by Education by Marriage Status in Whittier
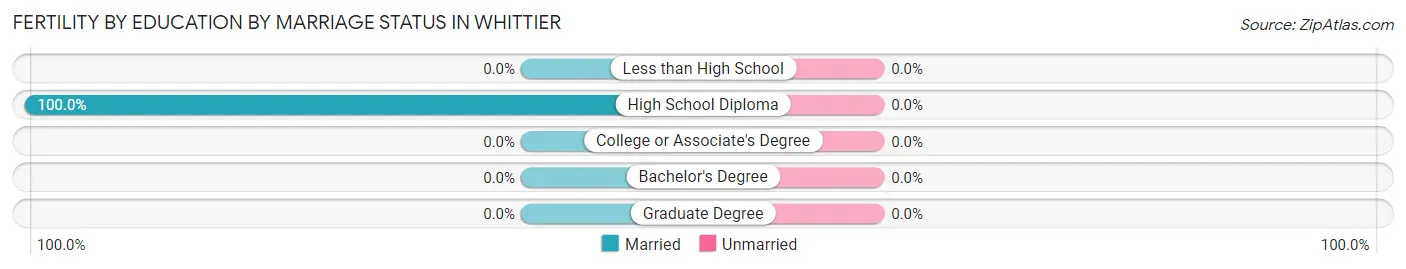
| Educational Attainment | Married | Unmarried |
| Less than High School | 0 (0.0%) | 0 (0.0%) |
| High School Diploma | 3 (100.0%) | 0 (0.0%) |
| College or Associate's Degree | 0 (0.0%) | 0 (0.0%) |
| Bachelor's Degree | 0 (0.0%) | 0 (0.0%) |
| Graduate Degree | 0 (0.0%) | 0 (0.0%) |
| Total | 3 (100.0%) | 0 (0.0%) |
Employment Characteristics in Whittier
Employment by Class of Employer in Whittier
Among the 164 employed individuals in Whittier, private company employees (70 | 42.7%), local government employees (44 | 26.8%), and not-for-profit organizations (24 | 14.6%) make up the most common classes of employment.
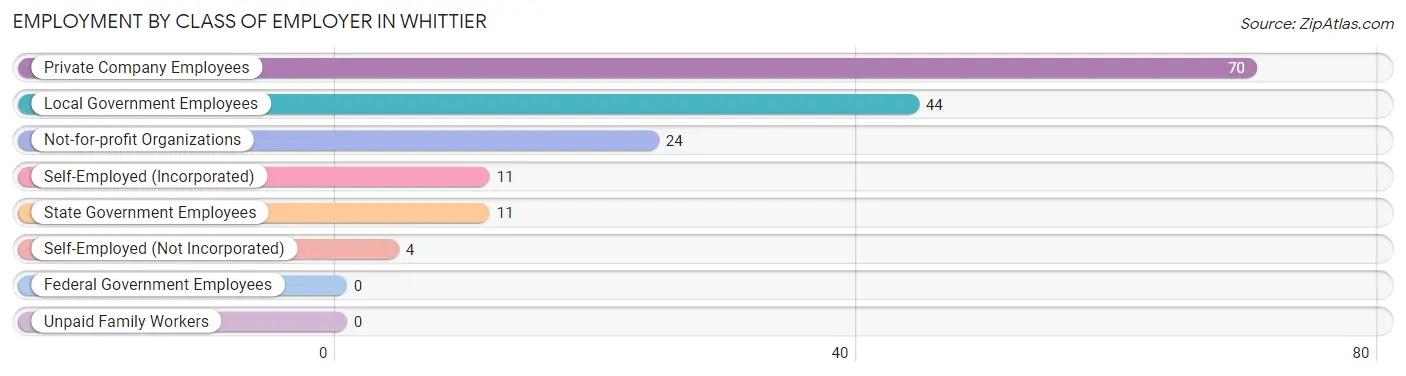
| Employer Class | # Employees | % Employees |
| Private Company Employees | 70 | 42.7% |
| Self-Employed (Incorporated) | 11 | 6.7% |
| Self-Employed (Not Incorporated) | 4 | 2.4% |
| Not-for-profit Organizations | 24 | 14.6% |
| Local Government Employees | 44 | 26.8% |
| State Government Employees | 11 | 6.7% |
| Federal Government Employees | 0 | 0.0% |
| Unpaid Family Workers | 0 | 0.0% |
| Total | 164 | 100.0% |
Employment Status by Age in Whittier
According to the labor force statistics for Whittier, out of the total population over 16 years of age (299), 64.2% or 192 individuals are in the labor force, with 13.0% or 25 of them unemployed. The age group with the highest labor force participation rate is 30 to 34 years, with 100.0% or 11 individuals in the labor force. Within the labor force, the 30 to 34 years age range has the highest percentage of unemployed individuals, with 45.5% or 5 of them being unemployed.
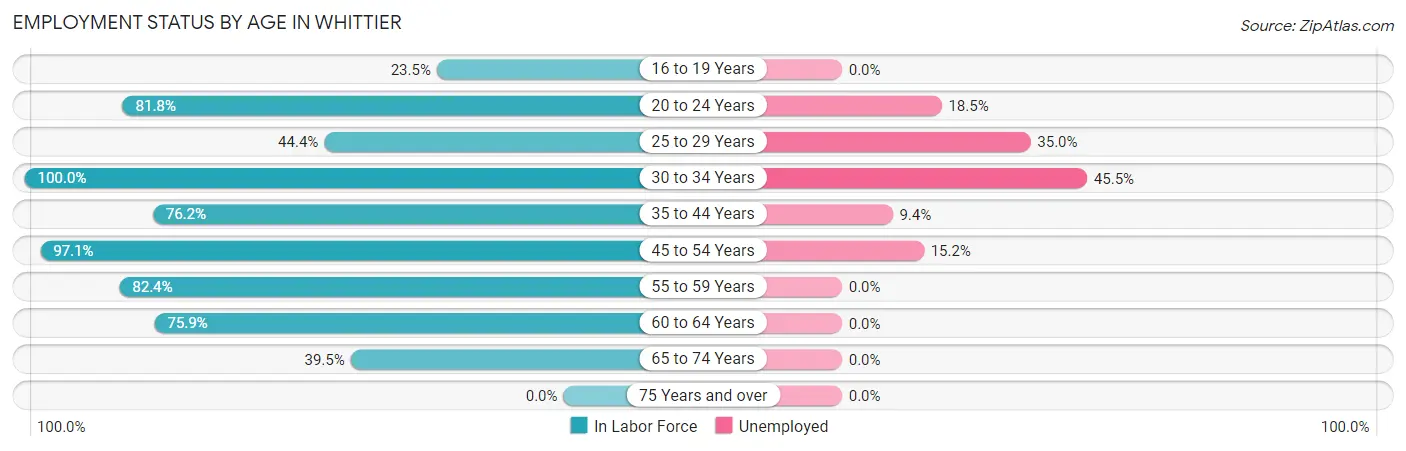
| Age Bracket | In Labor Force | Unemployed |
| 16 to 19 Years | 4 (23.5%) | 0 (0.0%) |
| 20 to 24 Years | 27 (81.8%) | 5 (18.5%) |
| 25 to 29 Years | 20 (44.4%) | 7 (35.0%) |
| 30 to 34 Years | 11 (100.0%) | 5 (45.5%) |
| 35 to 44 Years | 32 (76.2%) | 3 (9.4%) |
| 45 to 54 Years | 33 (97.1%) | 5 (15.2%) |
| 55 to 59 Years | 28 (82.4%) | 0 (0.0%) |
| 60 to 64 Years | 22 (75.9%) | 0 (0.0%) |
| 65 to 74 Years | 15 (39.5%) | 0 (0.0%) |
| 75 Years and over | 0 (0.0%) | 0 (0.0%) |
| Total | 192 (64.2%) | 25 (13.0%) |
Employment Status by Educational Attainment in Whittier
According to labor force statistics for Whittier, 74.9% of individuals (146) out of the total population between 25 and 64 years of age (195) are in the labor force, with 13.7% or 20 of them being unemployed. The group with the highest labor force participation rate are those with the educational attainment of bachelor's degree or higher, with 89.5% or 34 individuals in the labor force. Within the labor force, individuals with high school diploma education have the highest percentage of unemployment, with 22.8% or 13 of them being unemployed.
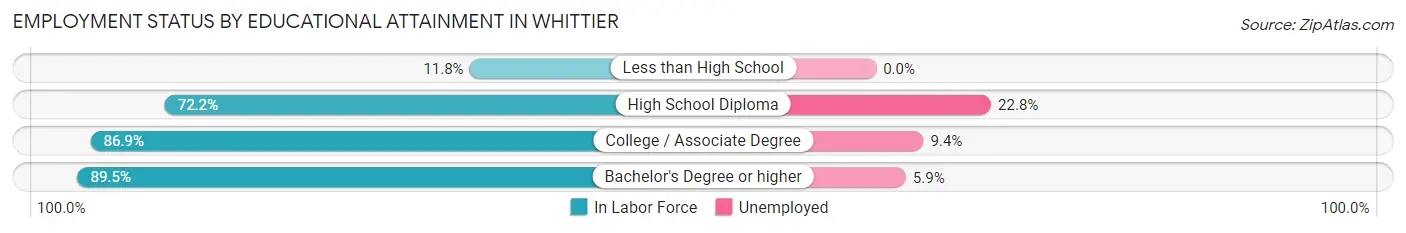
| Educational Attainment | In Labor Force | Unemployed |
| Less than High School | 2 (11.8%) | 0 (0.0%) |
| High School Diploma | 57 (72.2%) | 18 (22.8%) |
| College / Associate Degree | 53 (86.9%) | 6 (9.4%) |
| Bachelor's Degree or higher | 34 (89.5%) | 2 (5.9%) |
| Total | 146 (74.9%) | 27 (13.7%) |
Employment Occupations by Sex in Whittier
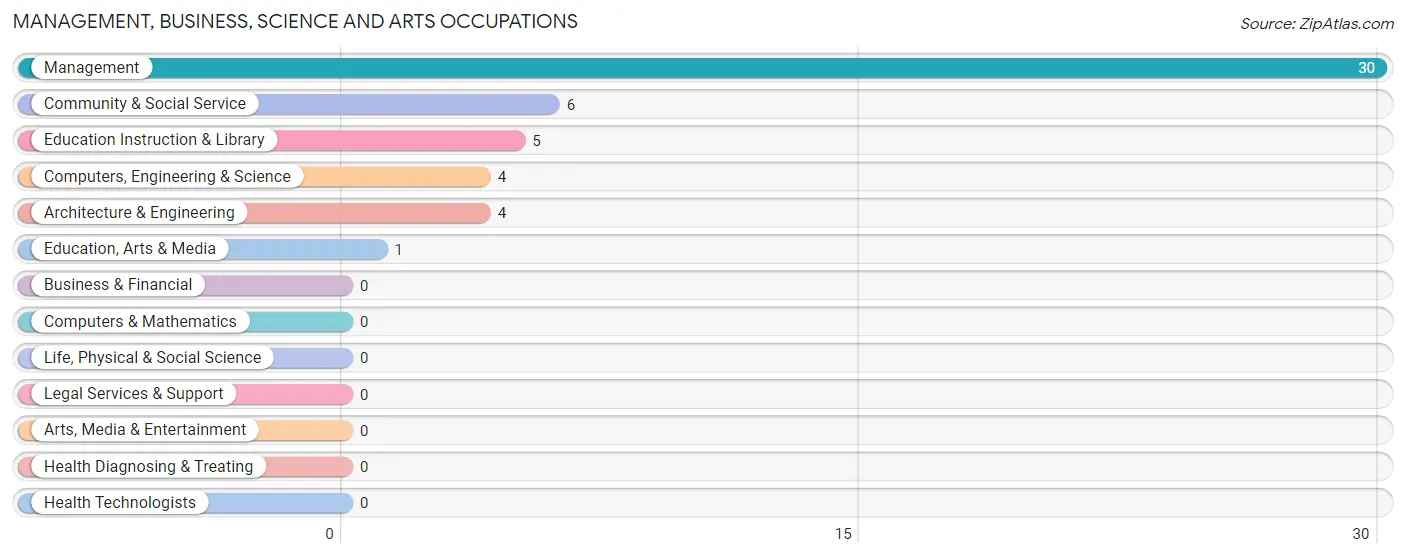
Management, Business, Science and Arts Occupations
The most common Management, Business, Science and Arts occupations in Whittier are Management (30 | 18.0%), Community & Social Service (6 | 3.6%), Education Instruction & Library (5 | 3.0%), Computers, Engineering & Science (4 | 2.4%), and Architecture & Engineering (4 | 2.4%).
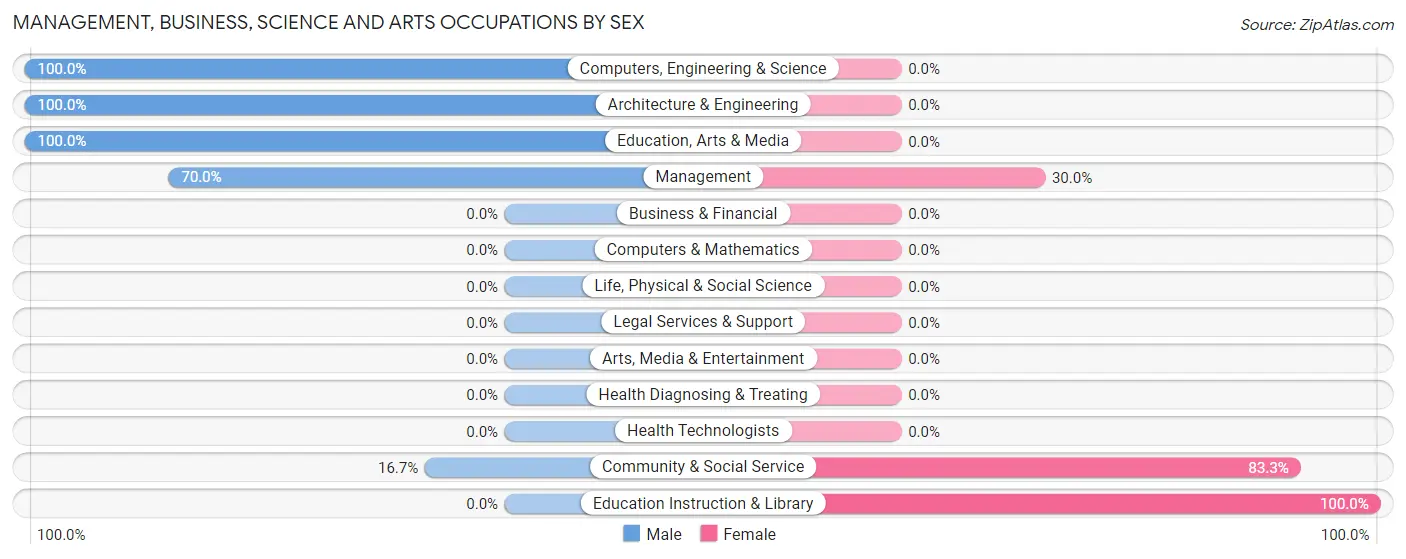
Management, Business, Science and Arts Occupations by Sex
Within the Management, Business, Science and Arts occupations in Whittier, the most male-oriented occupations are Computers, Engineering & Science (100.0%), Architecture & Engineering (100.0%), and Education, Arts & Media (100.0%), while the most female-oriented occupations are Education Instruction & Library (100.0%), Community & Social Service (83.3%), and Management (30.0%).
| Occupation | Male | Female |
| Management | 21 (70.0%) | 9 (30.0%) |
| Business & Financial | 0 (0.0%) | 0 (0.0%) |
| Computers, Engineering & Science | 4 (100.0%) | 0 (0.0%) |
| Computers & Mathematics | 0 (0.0%) | 0 (0.0%) |
| Architecture & Engineering | 4 (100.0%) | 0 (0.0%) |
| Life, Physical & Social Science | 0 (0.0%) | 0 (0.0%) |
| Community & Social Service | 1 (16.7%) | 5 (83.3%) |
| Education, Arts & Media | 1 (100.0%) | 0 (0.0%) |
| Legal Services & Support | 0 (0.0%) | 0 (0.0%) |
| Education Instruction & Library | 0 (0.0%) | 5 (100.0%) |
| Arts, Media & Entertainment | 0 (0.0%) | 0 (0.0%) |
| Health Diagnosing & Treating | 0 (0.0%) | 0 (0.0%) |
| Health Technologists | 0 (0.0%) | 0 (0.0%) |
| Total (Category) | 26 (65.0%) | 14 (35.0%) |
| Total (Overall) | 104 (62.3%) | 63 (37.7%) |
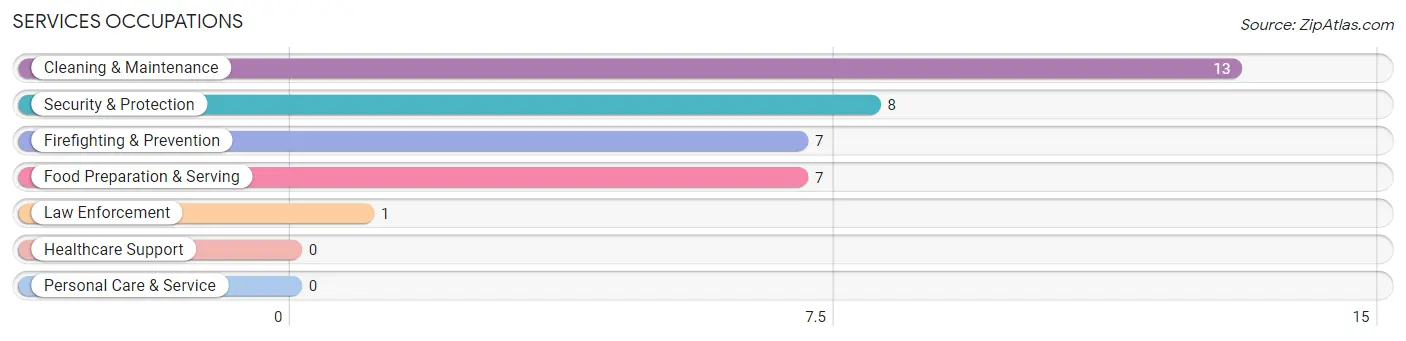
Services Occupations
The most common Services occupations in Whittier are Cleaning & Maintenance (13 | 7.8%), Security & Protection (8 | 4.8%), Firefighting & Prevention (7 | 4.2%), Food Preparation & Serving (7 | 4.2%), and Law Enforcement (1 | 0.6%).
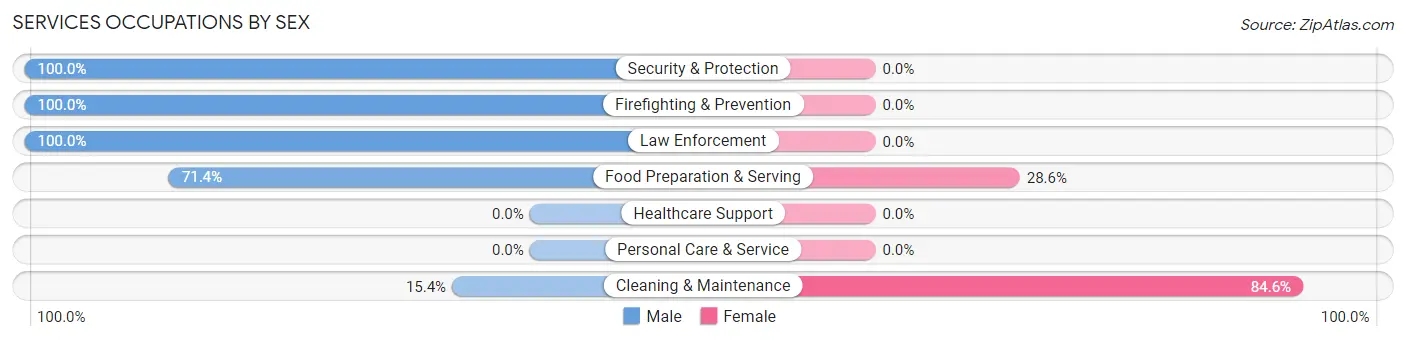
Services Occupations by Sex
Within the Services occupations in Whittier, the most male-oriented occupations are Security & Protection (100.0%), Firefighting & Prevention (100.0%), and Law Enforcement (100.0%), while the most female-oriented occupations are Cleaning & Maintenance (84.6%), and Food Preparation & Serving (28.6%).
| Occupation | Male | Female |
| Healthcare Support | 0 (0.0%) | 0 (0.0%) |
| Security & Protection | 8 (100.0%) | 0 (0.0%) |
| Firefighting & Prevention | 7 (100.0%) | 0 (0.0%) |
| Law Enforcement | 1 (100.0%) | 0 (0.0%) |
| Food Preparation & Serving | 5 (71.4%) | 2 (28.6%) |
| Cleaning & Maintenance | 2 (15.4%) | 11 (84.6%) |
| Personal Care & Service | 0 (0.0%) | 0 (0.0%) |
| Total (Category) | 15 (53.6%) | 13 (46.4%) |
| Total (Overall) | 104 (62.3%) | 63 (37.7%) |
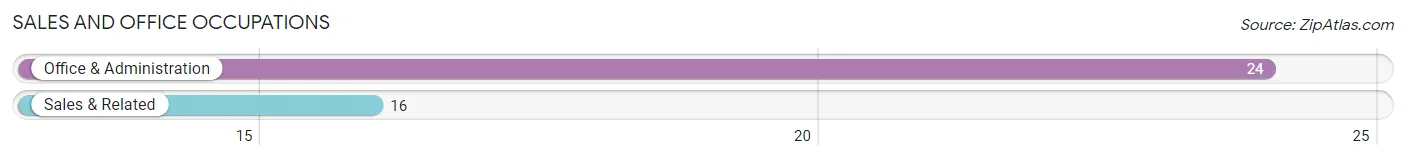
Sales and Office Occupations
The most common Sales and Office occupations in Whittier are Office & Administration (24 | 14.4%), and Sales & Related (16 | 9.6%).
Sales and Office Occupations by Sex
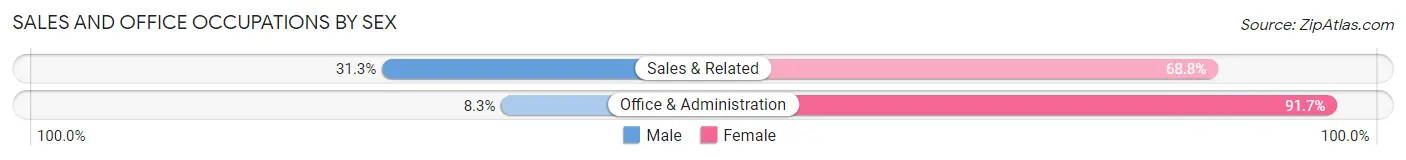
| Occupation | Male | Female |
| Sales & Related | 5 (31.2%) | 11 (68.8%) |
| Office & Administration | 2 (8.3%) | 22 (91.7%) |
| Total (Category) | 7 (17.5%) | 33 (82.5%) |
| Total (Overall) | 104 (62.3%) | 63 (37.7%) |
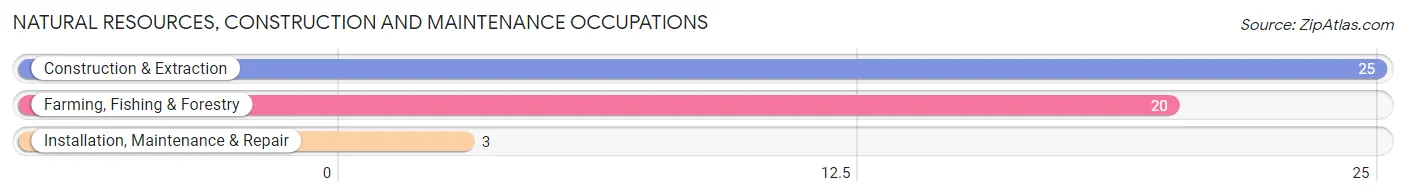
Natural Resources, Construction and Maintenance Occupations
The most common Natural Resources, Construction and Maintenance occupations in Whittier are Construction & Extraction (25 | 15.0%), Farming, Fishing & Forestry (20 | 12.0%), and Installation, Maintenance & Repair (3 | 1.8%).
Natural Resources, Construction and Maintenance Occupations by Sex
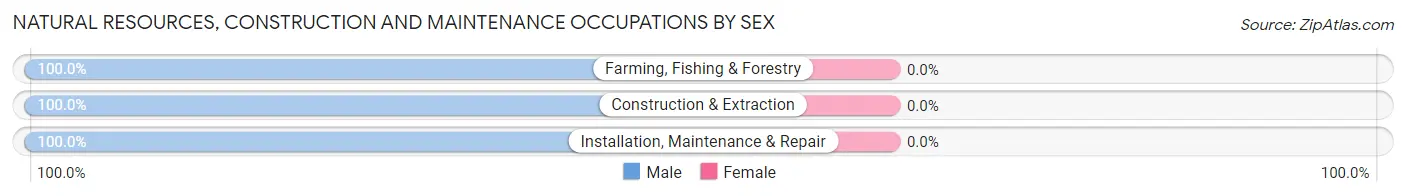
| Occupation | Male | Female |
| Farming, Fishing & Forestry | 20 (100.0%) | 0 (0.0%) |
| Construction & Extraction | 25 (100.0%) | 0 (0.0%) |
| Installation, Maintenance & Repair | 3 (100.0%) | 0 (0.0%) |
| Total (Category) | 48 (100.0%) | 0 (0.0%) |
| Total (Overall) | 104 (62.3%) | 63 (37.7%) |
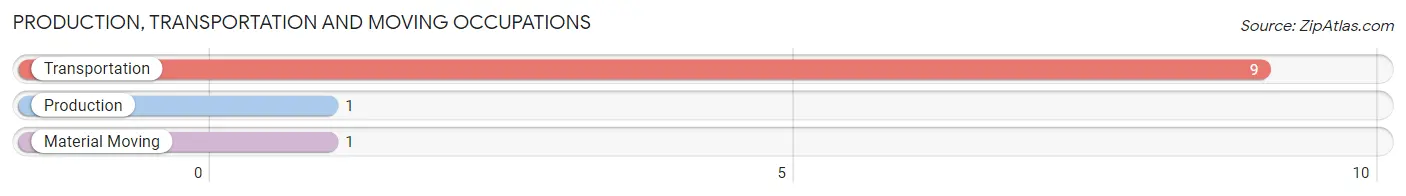
Production, Transportation and Moving Occupations
The most common Production, Transportation and Moving occupations in Whittier are Transportation (9 | 5.4%), Production (1 | 0.6%), and Material Moving (1 | 0.6%).
Production, Transportation and Moving Occupations by Sex
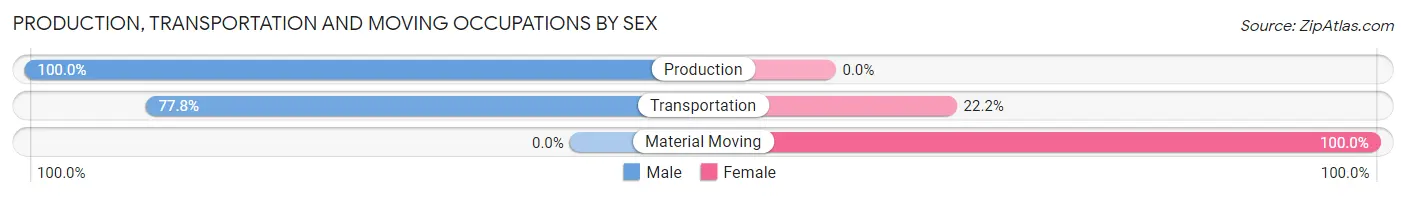
| Occupation | Male | Female |
| Production | 1 (100.0%) | 0 (0.0%) |
| Transportation | 7 (77.8%) | 2 (22.2%) |
| Material Moving | 0 (0.0%) | 1 (100.0%) |
| Total (Category) | 8 (72.7%) | 3 (27.3%) |
| Total (Overall) | 104 (62.3%) | 63 (37.7%) |
Employment Industries by Sex in Whittier
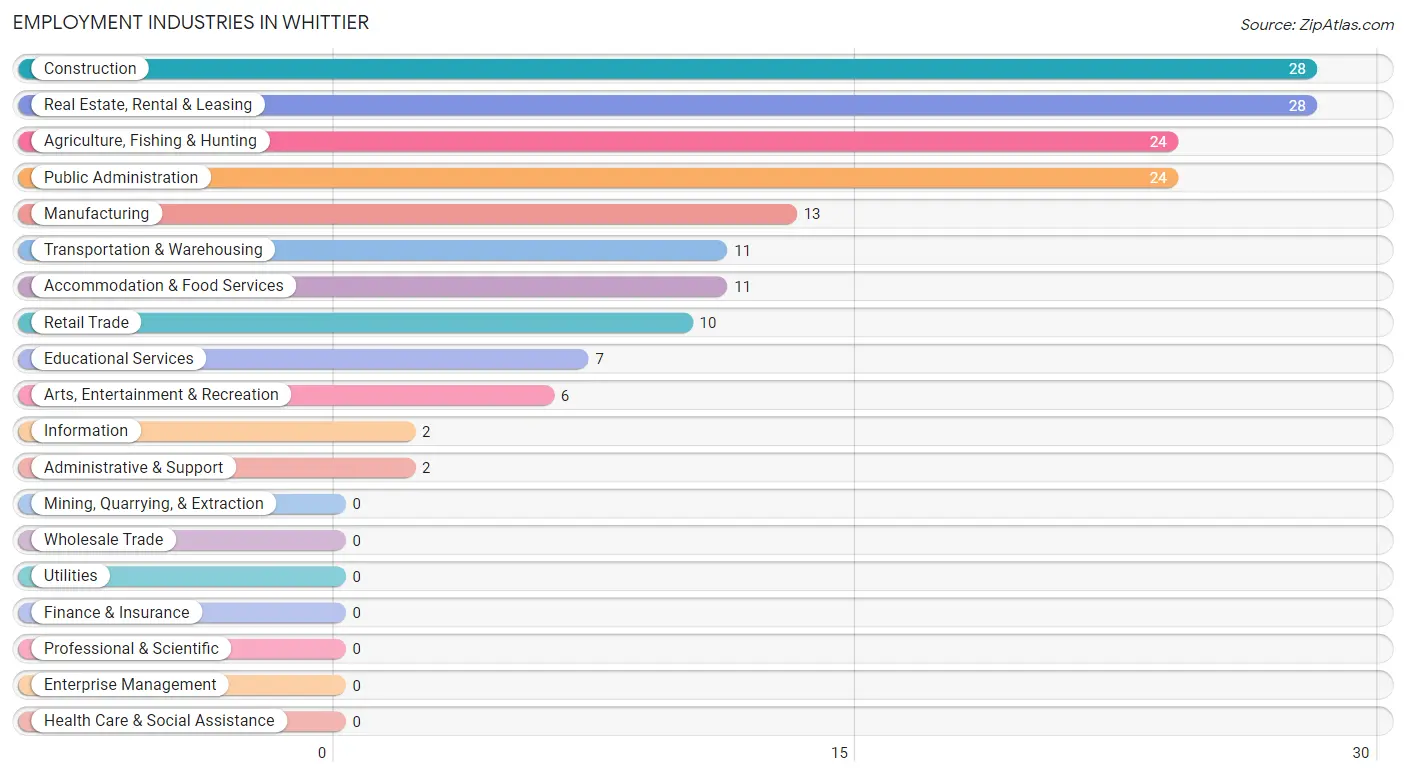
Employment Industries in Whittier
The major employment industries in Whittier include Construction (28 | 16.8%), Real Estate, Rental & Leasing (28 | 16.8%), Agriculture, Fishing & Hunting (24 | 14.4%), Public Administration (24 | 14.4%), and Manufacturing (13 | 7.8%).
Employment Industries by Sex in Whittier
The Whittier industries that see more men than women are Construction (100.0%), Information (100.0%), and Administrative & Support (100.0%), whereas the industries that tend to have a higher number of women are Educational Services (100.0%), Retail Trade (80.0%), and Manufacturing (61.5%).
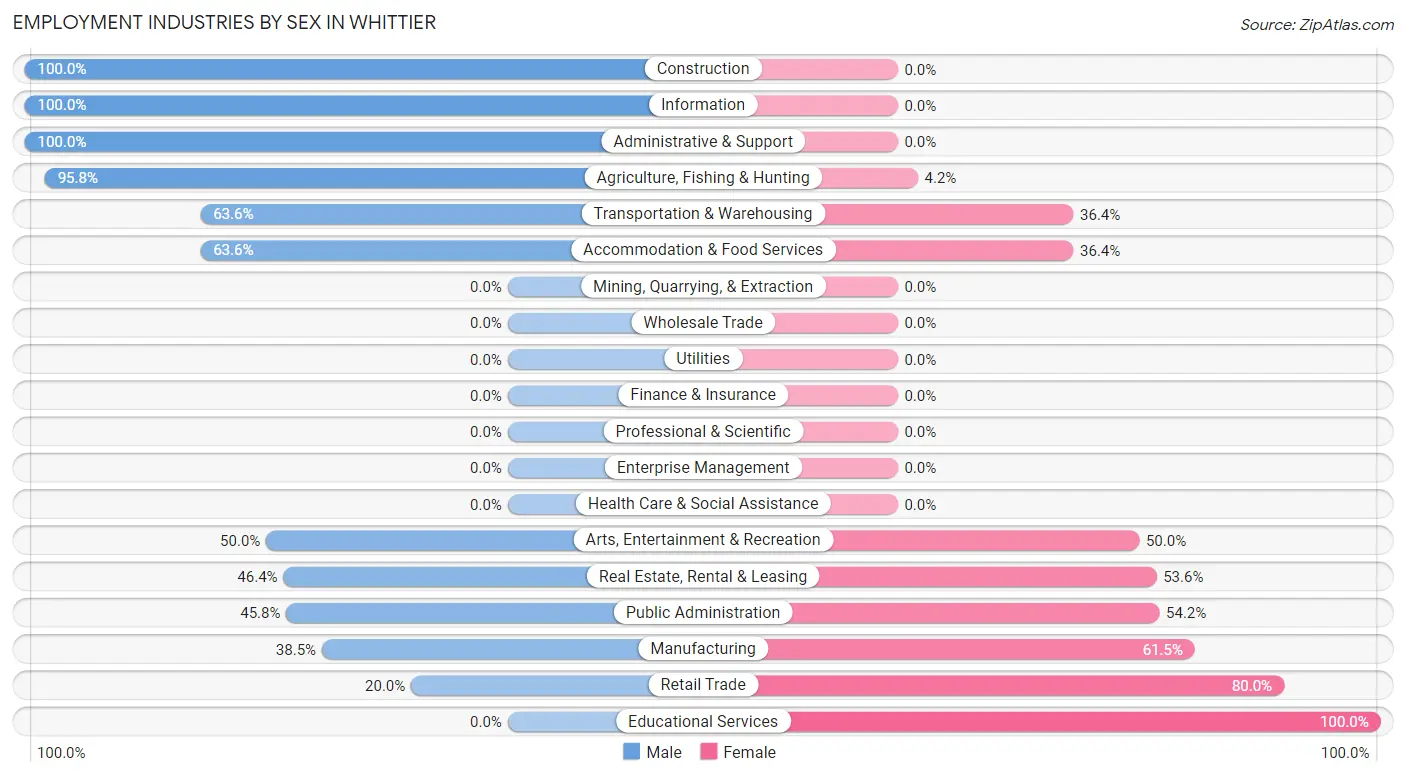
| Industry | Male | Female |
| Agriculture, Fishing & Hunting | 23 (95.8%) | 1 (4.2%) |
| Mining, Quarrying, & Extraction | 0 (0.0%) | 0 (0.0%) |
| Construction | 28 (100.0%) | 0 (0.0%) |
| Manufacturing | 5 (38.5%) | 8 (61.5%) |
| Wholesale Trade | 0 (0.0%) | 0 (0.0%) |
| Retail Trade | 2 (20.0%) | 8 (80.0%) |
| Transportation & Warehousing | 7 (63.6%) | 4 (36.4%) |
| Utilities | 0 (0.0%) | 0 (0.0%) |
| Information | 2 (100.0%) | 0 (0.0%) |
| Finance & Insurance | 0 (0.0%) | 0 (0.0%) |
| Real Estate, Rental & Leasing | 13 (46.4%) | 15 (53.6%) |
| Professional & Scientific | 0 (0.0%) | 0 (0.0%) |
| Enterprise Management | 0 (0.0%) | 0 (0.0%) |
| Administrative & Support | 2 (100.0%) | 0 (0.0%) |
| Educational Services | 0 (0.0%) | 7 (100.0%) |
| Health Care & Social Assistance | 0 (0.0%) | 0 (0.0%) |
| Arts, Entertainment & Recreation | 3 (50.0%) | 3 (50.0%) |
| Accommodation & Food Services | 7 (63.6%) | 4 (36.4%) |
| Public Administration | 11 (45.8%) | 13 (54.2%) |
| Total | 104 (62.3%) | 63 (37.7%) |
Education in Whittier
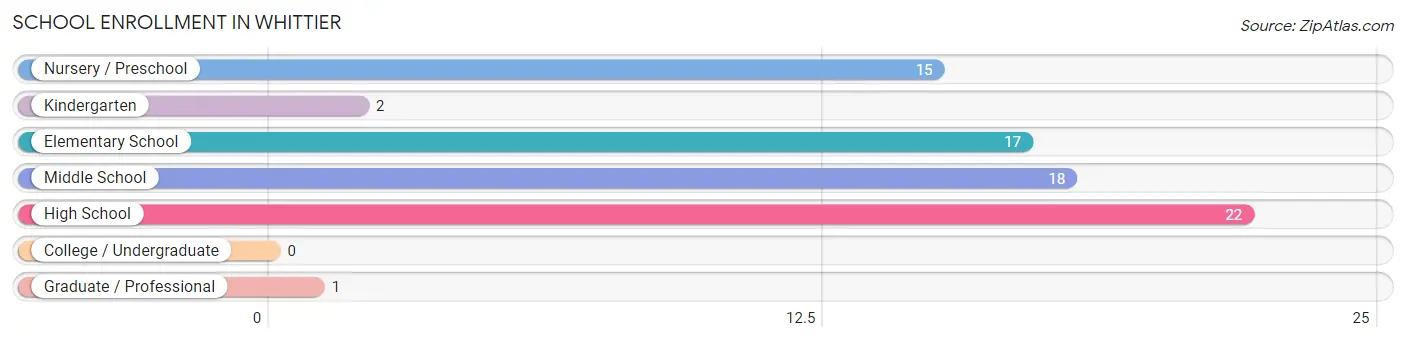
School Enrollment in Whittier
The most common levels of schooling among the 75 students in Whittier are high school (22 | 29.3%), middle school (18 | 24.0%), and elementary school (17 | 22.7%).
| School Level | # Students | % Students |
| Nursery / Preschool | 15 | 20.0% |
| Kindergarten | 2 | 2.7% |
| Elementary School | 17 | 22.7% |
| Middle School | 18 | 24.0% |
| High School | 22 | 29.3% |
| College / Undergraduate | 0 | 0.0% |
| Graduate / Professional | 1 | 1.3% |
| Total | 75 | 100.0% |
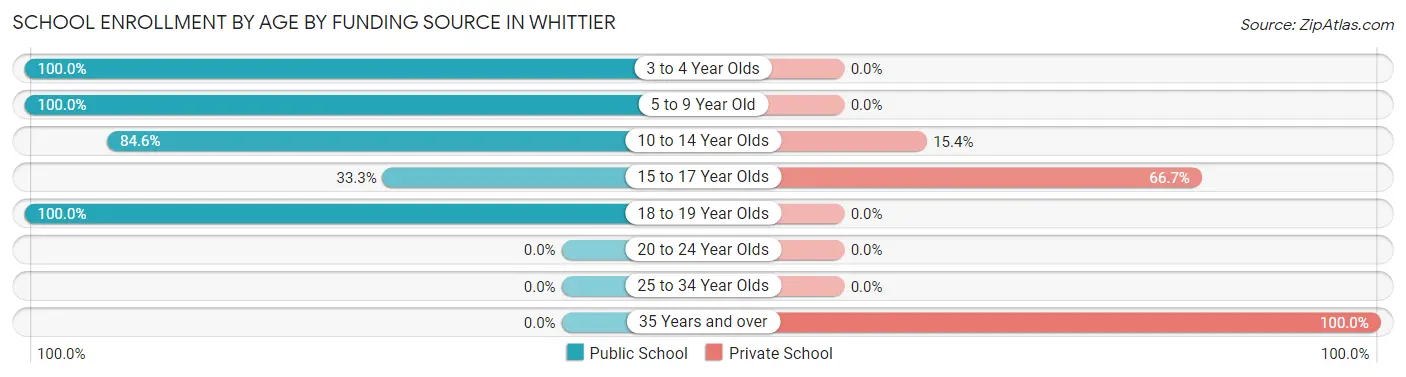
School Enrollment by Age by Funding Source in Whittier
Out of a total of 75 students who are enrolled in schools in Whittier, 15 (20.0%) attend a private institution, while the remaining 60 (80.0%) are enrolled in public schools. The age group of 35 years and over has the highest likelihood of being enrolled in private schools, with 1 (100.0% in the age bracket) enrolled. Conversely, the age group of 3 to 4 year olds has the lowest likelihood of being enrolled in a private school, with 16 (100.0% in the age bracket) attending a public institution.
| Age Bracket | Public School | Private School |
| 3 to 4 Year Olds | 16 (100.0%) | 0 (0.0%) |
| 5 to 9 Year Old | 15 (100.0%) | 0 (0.0%) |
| 10 to 14 Year Olds | 22 (84.6%) | 4 (15.4%) |
| 15 to 17 Year Olds | 5 (33.3%) | 10 (66.7%) |
| 18 to 19 Year Olds | 2 (100.0%) | 0 (0.0%) |
| 20 to 24 Year Olds | 0 (0.0%) | 0 (0.0%) |
| 25 to 34 Year Olds | 0 (0.0%) | 0 (0.0%) |
| 35 Years and over | 0 (0.0%) | 1 (100.0%) |
| Total | 60 (80.0%) | 15 (20.0%) |
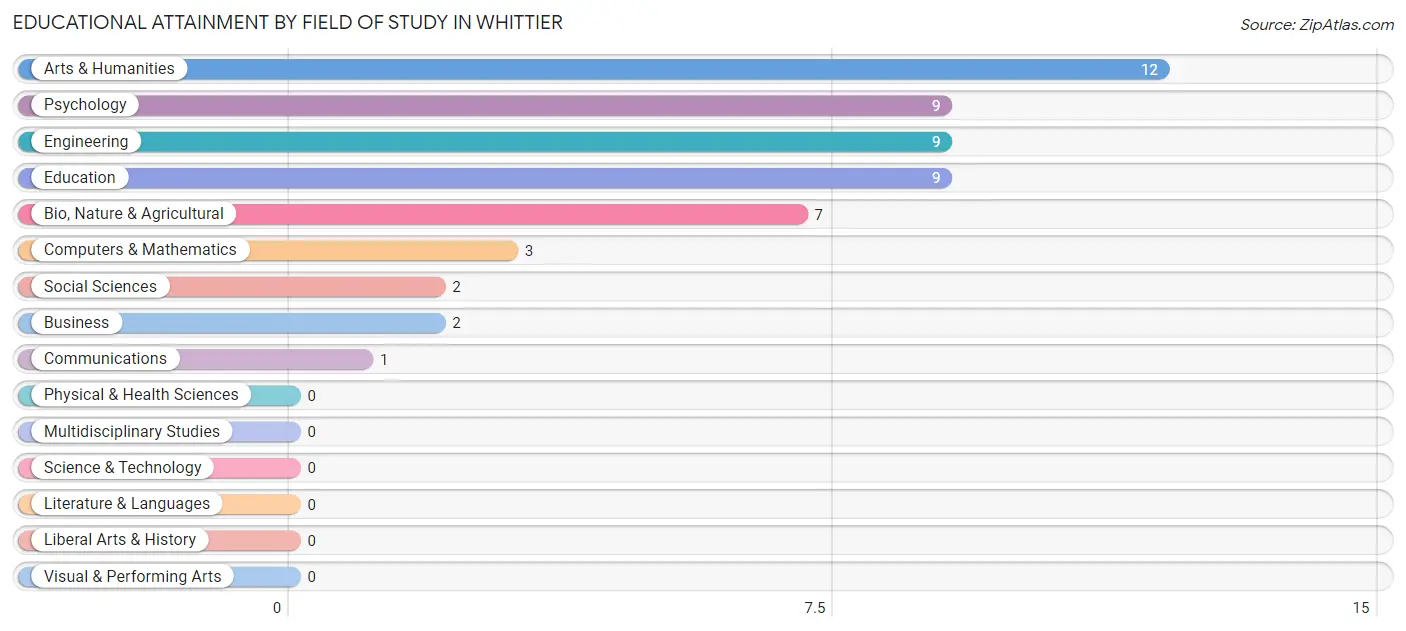
Educational Attainment by Field of Study in Whittier
Arts & humanities (12 | 22.2%), psychology (9 | 16.7%), engineering (9 | 16.7%), education (9 | 16.7%), and bio, nature & agricultural (7 | 13.0%) are the most common fields of study among 54 individuals in Whittier who have obtained a bachelor's degree or higher.
| Field of Study | # Graduates | % Graduates |
| Computers & Mathematics | 3 | 5.6% |
| Bio, Nature & Agricultural | 7 | 13.0% |
| Physical & Health Sciences | 0 | 0.0% |
| Psychology | 9 | 16.7% |
| Social Sciences | 2 | 3.7% |
| Engineering | 9 | 16.7% |
| Multidisciplinary Studies | 0 | 0.0% |
| Science & Technology | 0 | 0.0% |
| Business | 2 | 3.7% |
| Education | 9 | 16.7% |
| Literature & Languages | 0 | 0.0% |
| Liberal Arts & History | 0 | 0.0% |
| Visual & Performing Arts | 0 | 0.0% |
| Communications | 1 | 1.8% |
| Arts & Humanities | 12 | 22.2% |
| Total | 54 | 100.0% |
Transportation & Commute in Whittier
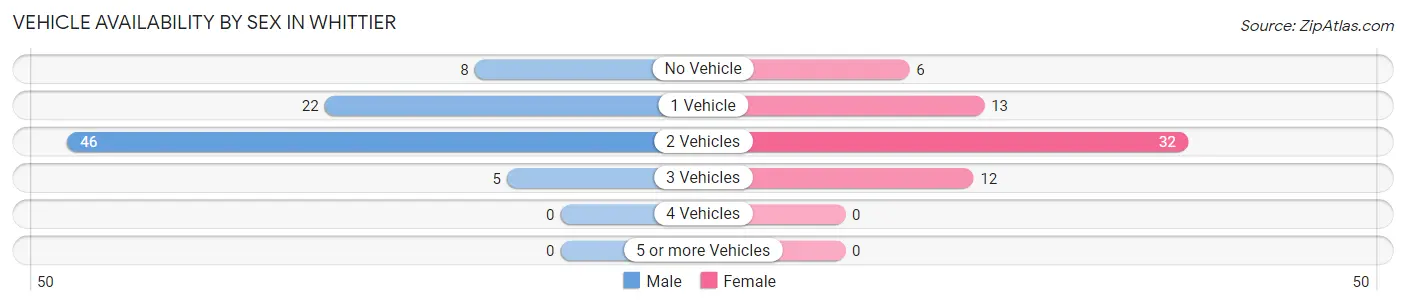
Vehicle Availability by Sex in Whittier
The most prevalent vehicle ownership categories in Whittier are males with 2 vehicles (46, accounting for 56.8%) and females with 2 vehicles (32, making up 73.0%).
| Vehicles Available | Male | Female |
| No Vehicle | 8 (9.9%) | 6 (9.5%) |
| 1 Vehicle | 22 (27.2%) | 13 (20.6%) |
| 2 Vehicles | 46 (56.8%) | 32 (50.8%) |
| 3 Vehicles | 5 (6.2%) | 12 (19.1%) |
| 4 Vehicles | 0 (0.0%) | 0 (0.0%) |
| 5 or more Vehicles | 0 (0.0%) | 0 (0.0%) |
| Total | 81 (100.0%) | 63 (100.0%) |
Commute Time in Whittier
The most frequently occuring commute durations in Whittier are less than 5 minutes (82 commuters, 57.8%), 5 to 9 minutes (37 commuters, 26.1%), and 15 to 19 minutes (10 commuters, 7.0%).
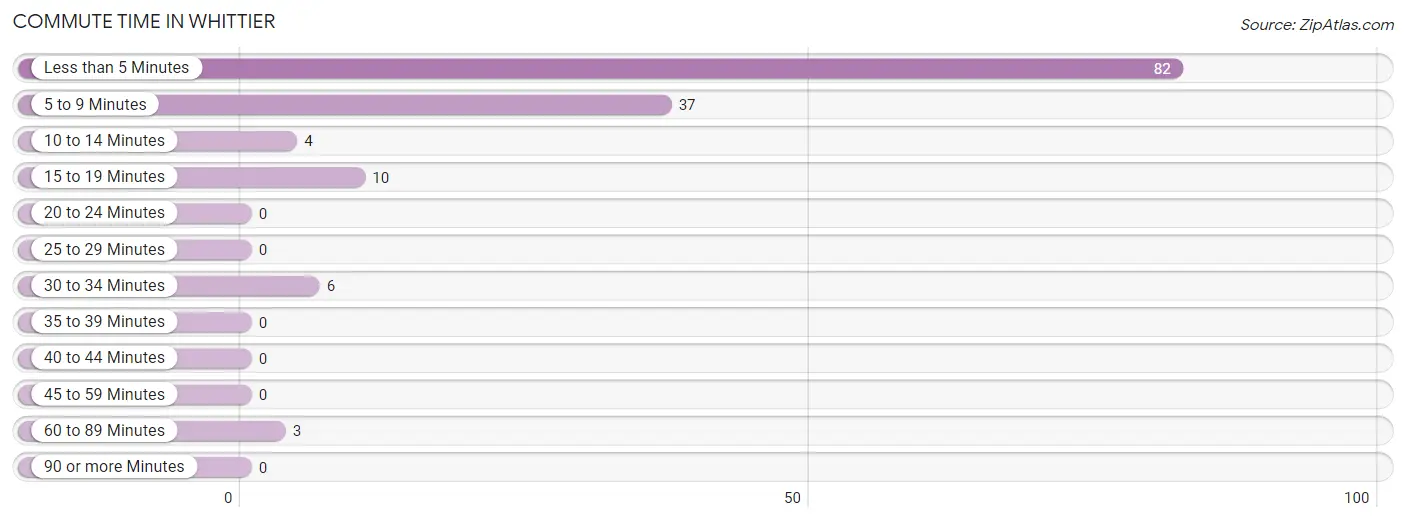
| Commute Time | # Commuters | % Commuters |
| Less than 5 Minutes | 82 | 57.8% |
| 5 to 9 Minutes | 37 | 26.1% |
| 10 to 14 Minutes | 4 | 2.8% |
| 15 to 19 Minutes | 10 | 7.0% |
| 20 to 24 Minutes | 0 | 0.0% |
| 25 to 29 Minutes | 0 | 0.0% |
| 30 to 34 Minutes | 6 | 4.2% |
| 35 to 39 Minutes | 0 | 0.0% |
| 40 to 44 Minutes | 0 | 0.0% |
| 45 to 59 Minutes | 0 | 0.0% |
| 60 to 89 Minutes | 3 | 2.1% |
| 90 or more Minutes | 0 | 0.0% |
Commute Time by Sex in Whittier
The most common commute times in Whittier are less than 5 minutes (48 commuters, 59.3%) for males and less than 5 minutes (34 commuters, 55.7%) for females.
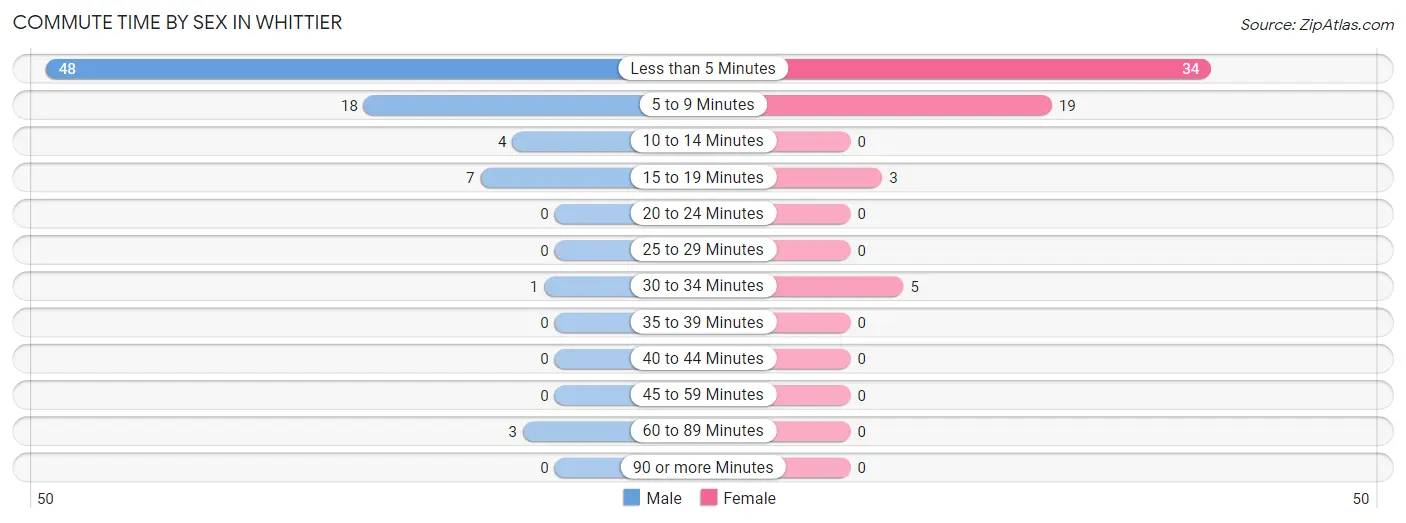
| Commute Time | Male | Female |
| Less than 5 Minutes | 48 (59.3%) | 34 (55.7%) |
| 5 to 9 Minutes | 18 (22.2%) | 19 (31.1%) |
| 10 to 14 Minutes | 4 (4.9%) | 0 (0.0%) |
| 15 to 19 Minutes | 7 (8.6%) | 3 (4.9%) |
| 20 to 24 Minutes | 0 (0.0%) | 0 (0.0%) |
| 25 to 29 Minutes | 0 (0.0%) | 0 (0.0%) |
| 30 to 34 Minutes | 1 (1.2%) | 5 (8.2%) |
| 35 to 39 Minutes | 0 (0.0%) | 0 (0.0%) |
| 40 to 44 Minutes | 0 (0.0%) | 0 (0.0%) |
| 45 to 59 Minutes | 0 (0.0%) | 0 (0.0%) |
| 60 to 89 Minutes | 3 (3.7%) | 0 (0.0%) |
| 90 or more Minutes | 0 (0.0%) | 0 (0.0%) |
Time of Departure to Work by Sex in Whittier
The most frequent times of departure to work in Whittier are 8:00 AM to 8:29 AM (37, 45.7%) for males and 8:00 AM to 8:29 AM (38, 62.3%) for females.
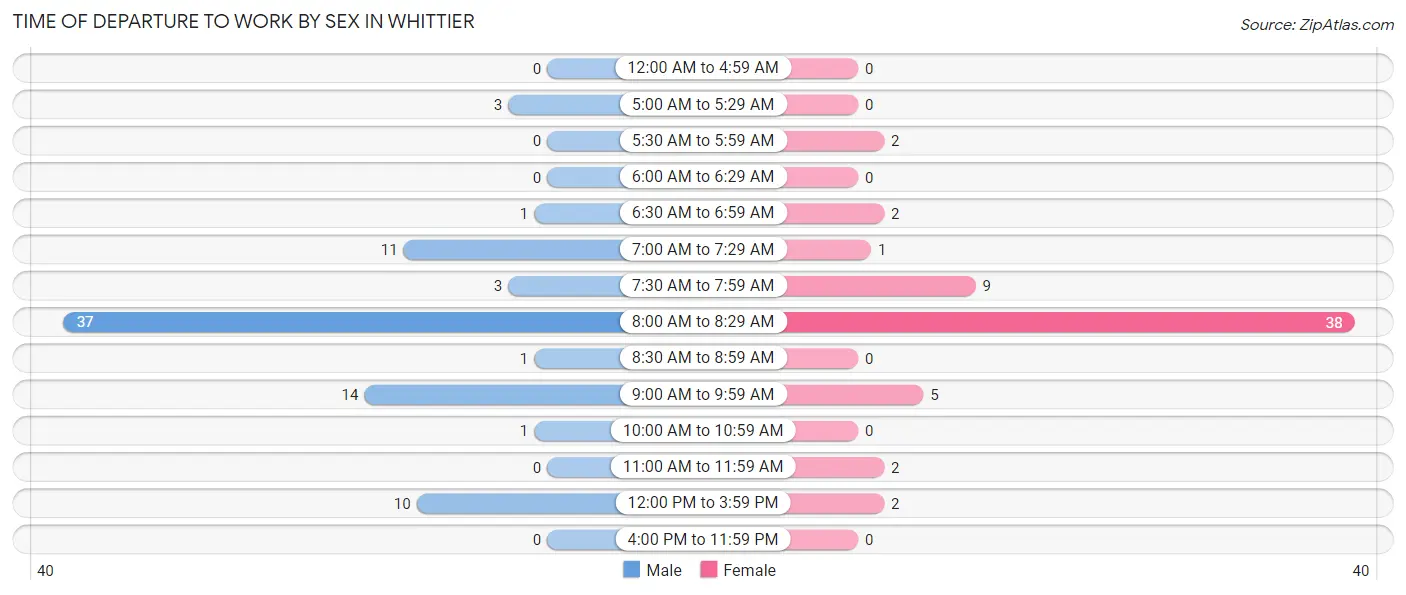
| Time of Departure | Male | Female |
| 12:00 AM to 4:59 AM | 0 (0.0%) | 0 (0.0%) |
| 5:00 AM to 5:29 AM | 3 (3.7%) | 0 (0.0%) |
| 5:30 AM to 5:59 AM | 0 (0.0%) | 2 (3.3%) |
| 6:00 AM to 6:29 AM | 0 (0.0%) | 0 (0.0%) |
| 6:30 AM to 6:59 AM | 1 (1.2%) | 2 (3.3%) |
| 7:00 AM to 7:29 AM | 11 (13.6%) | 1 (1.6%) |
| 7:30 AM to 7:59 AM | 3 (3.7%) | 9 (14.7%) |
| 8:00 AM to 8:29 AM | 37 (45.7%) | 38 (62.3%) |
| 8:30 AM to 8:59 AM | 1 (1.2%) | 0 (0.0%) |
| 9:00 AM to 9:59 AM | 14 (17.3%) | 5 (8.2%) |
| 10:00 AM to 10:59 AM | 1 (1.2%) | 0 (0.0%) |
| 11:00 AM to 11:59 AM | 0 (0.0%) | 2 (3.3%) |
| 12:00 PM to 3:59 PM | 10 (12.3%) | 2 (3.3%) |
| 4:00 PM to 11:59 PM | 0 (0.0%) | 0 (0.0%) |
| Total | 81 (100.0%) | 61 (100.0%) |
Housing Occupancy in Whittier
Occupancy by Ownership in Whittier
Of the total 155 dwellings in Whittier, owner-occupied units account for 43 (27.7%), while renter-occupied units make up 112 (72.3%).
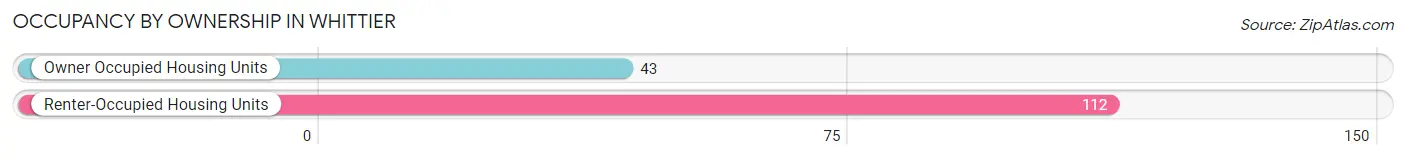
| Occupancy | # Housing Units | % Housing Units |
| Owner Occupied Housing Units | 43 | 27.7% |
| Renter-Occupied Housing Units | 112 | 72.3% |
| Total Occupied Housing Units | 155 | 100.0% |
Occupancy by Household Size in Whittier
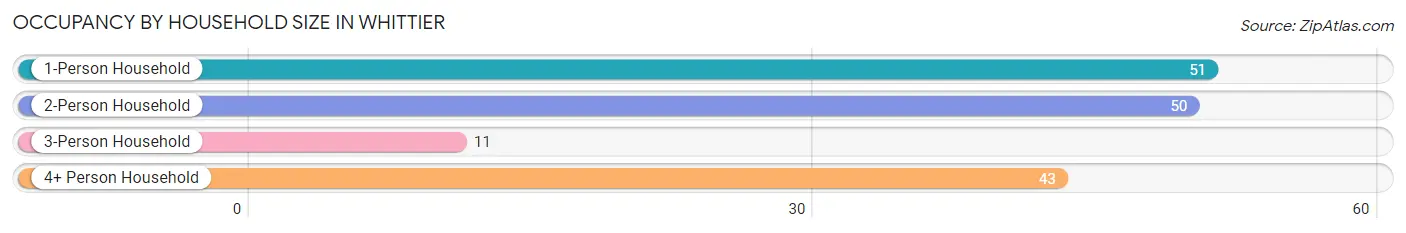
| Household Size | # Housing Units | % Housing Units |
| 1-Person Household | 51 | 32.9% |
| 2-Person Household | 50 | 32.3% |
| 3-Person Household | 11 | 7.1% |
| 4+ Person Household | 43 | 27.7% |
| Total Housing Units | 155 | 100.0% |
Occupancy by Ownership by Household Size in Whittier
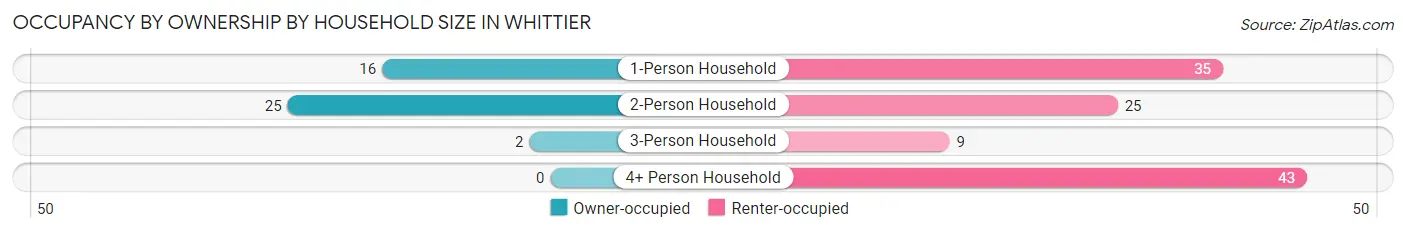
| Household Size | Owner-occupied | Renter-occupied |
| 1-Person Household | 16 (31.4%) | 35 (68.6%) |
| 2-Person Household | 25 (50.0%) | 25 (50.0%) |
| 3-Person Household | 2 (18.2%) | 9 (81.8%) |
| 4+ Person Household | 0 (0.0%) | 43 (100.0%) |
| Total Housing Units | 43 (27.7%) | 112 (72.3%) |
Occupancy by Educational Attainment in Whittier
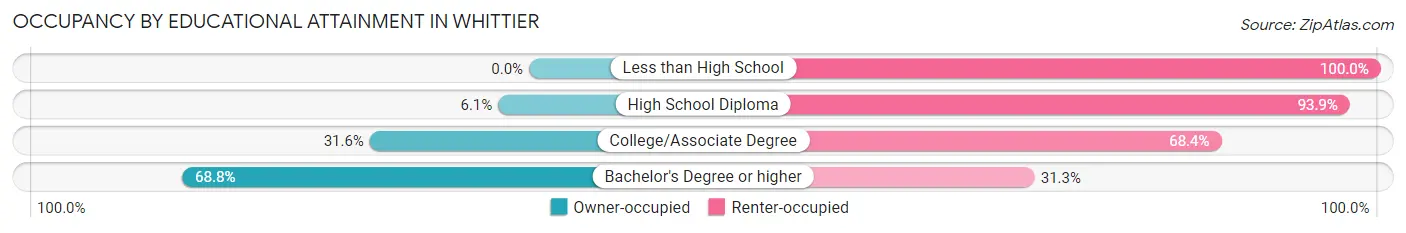
| Household Size | Owner-occupied | Renter-occupied |
| Less than High School | 0 (0.0%) | 17 (100.0%) |
| High School Diploma | 3 (6.1%) | 46 (93.9%) |
| College/Associate Degree | 18 (31.6%) | 39 (68.4%) |
| Bachelor's Degree or higher | 22 (68.8%) | 10 (31.2%) |
Occupancy by Age of Householder in Whittier
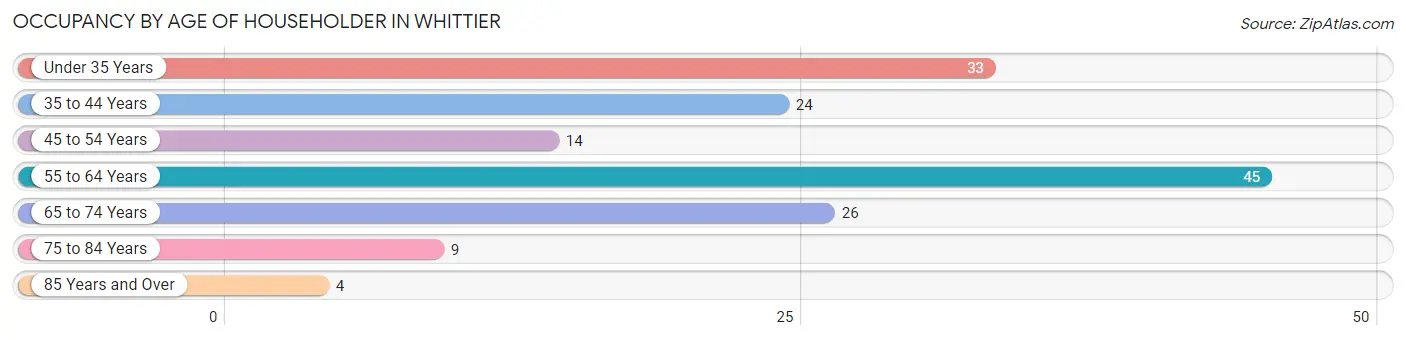
| Age Bracket | # Households | % Households |
| Under 35 Years | 33 | 21.3% |
| 35 to 44 Years | 24 | 15.5% |
| 45 to 54 Years | 14 | 9.0% |
| 55 to 64 Years | 45 | 29.0% |
| 65 to 74 Years | 26 | 16.8% |
| 75 to 84 Years | 9 | 5.8% |
| 85 Years and Over | 4 | 2.6% |
| Total | 155 | 100.0% |
Housing Finances in Whittier
Median Income by Occupancy in Whittier
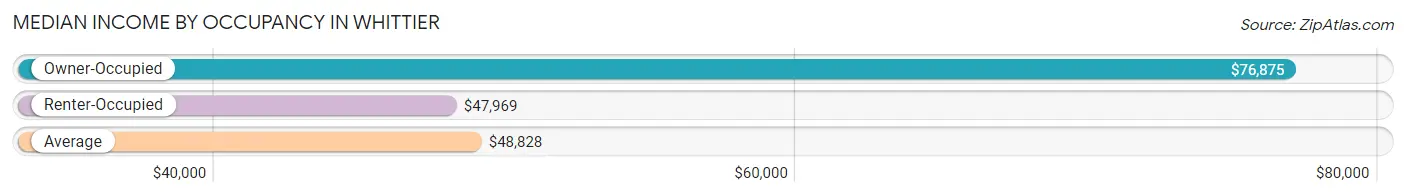
| Occupancy Type | # Households | Median Income |
| Owner-Occupied | 43 (27.7%) | $76,875 |
| Renter-Occupied | 112 (72.3%) | $47,969 |
| Average | 155 (100.0%) | $48,828 |
Occupancy by Householder Income Bracket in Whittier
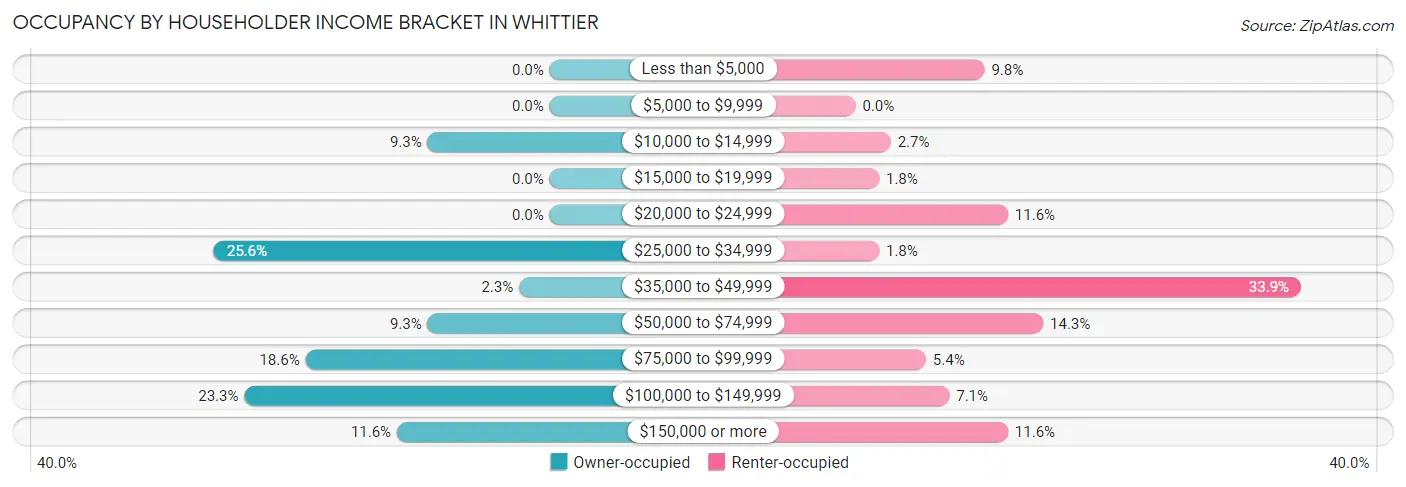
| Income Bracket | Owner-occupied | Renter-occupied |
| Less than $5,000 | 0 (0.0%) | 11 (9.8%) |
| $5,000 to $9,999 | 0 (0.0%) | 0 (0.0%) |
| $10,000 to $14,999 | 4 (9.3%) | 3 (2.7%) |
| $15,000 to $19,999 | 0 (0.0%) | 2 (1.8%) |
| $20,000 to $24,999 | 0 (0.0%) | 13 (11.6%) |
| $25,000 to $34,999 | 11 (25.6%) | 2 (1.8%) |
| $35,000 to $49,999 | 1 (2.3%) | 38 (33.9%) |
| $50,000 to $74,999 | 4 (9.3%) | 16 (14.3%) |
| $75,000 to $99,999 | 8 (18.6%) | 6 (5.4%) |
| $100,000 to $149,999 | 10 (23.3%) | 8 (7.1%) |
| $150,000 or more | 5 (11.6%) | 13 (11.6%) |
| Total | 43 (100.0%) | 112 (100.0%) |
Monthly Housing Cost Tiers in Whittier
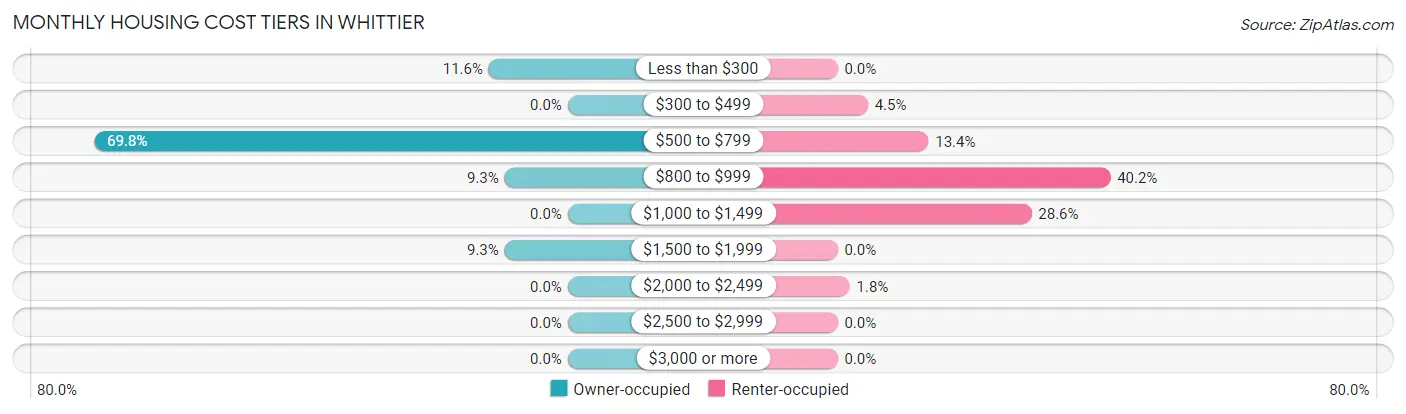
| Monthly Cost | Owner-occupied | Renter-occupied |
| Less than $300 | 5 (11.6%) | 0 (0.0%) |
| $300 to $499 | 0 (0.0%) | 5 (4.5%) |
| $500 to $799 | 30 (69.8%) | 15 (13.4%) |
| $800 to $999 | 4 (9.3%) | 45 (40.2%) |
| $1,000 to $1,499 | 0 (0.0%) | 32 (28.6%) |
| $1,500 to $1,999 | 4 (9.3%) | 0 (0.0%) |
| $2,000 to $2,499 | 0 (0.0%) | 2 (1.8%) |
| $2,500 to $2,999 | 0 (0.0%) | 0 (0.0%) |
| $3,000 or more | 0 (0.0%) | 0 (0.0%) |
| Total | 43 (100.0%) | 112 (100.0%) |
Physical Housing Characteristics in Whittier
Housing Structures in Whittier
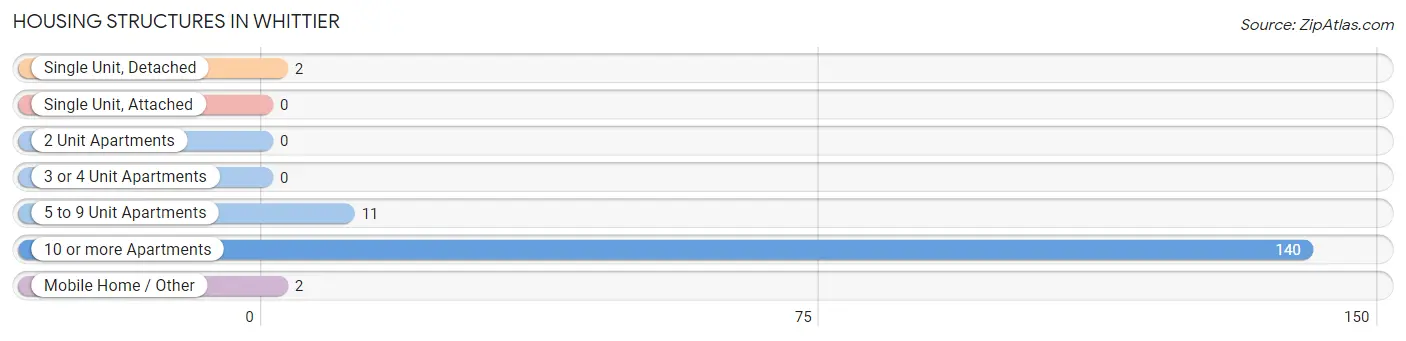
| Structure Type | # Housing Units | % Housing Units |
| Single Unit, Detached | 2 | 1.3% |
| Single Unit, Attached | 0 | 0.0% |
| 2 Unit Apartments | 0 | 0.0% |
| 3 or 4 Unit Apartments | 0 | 0.0% |
| 5 to 9 Unit Apartments | 11 | 7.1% |
| 10 or more Apartments | 140 | 90.3% |
| Mobile Home / Other | 2 | 1.3% |
| Total | 155 | 100.0% |
Housing Structures by Occupancy in Whittier
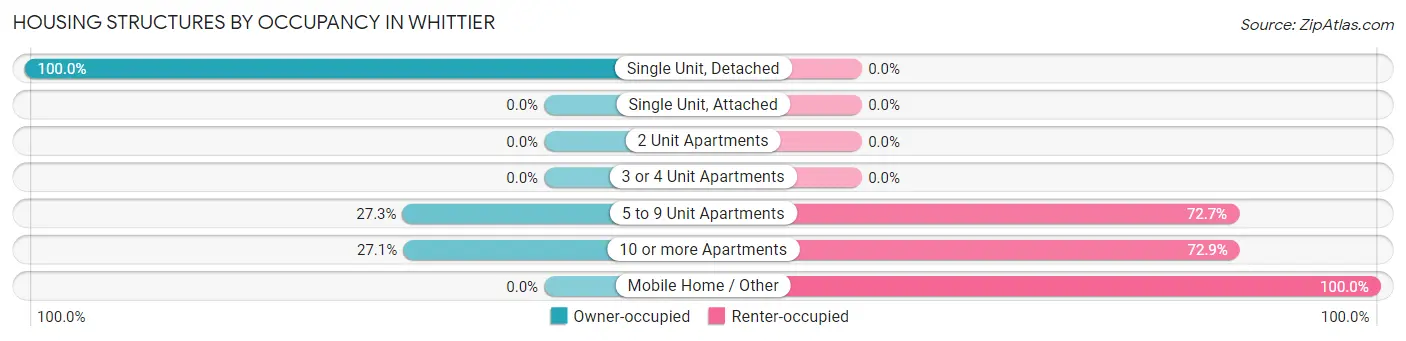
| Structure Type | Owner-occupied | Renter-occupied |
| Single Unit, Detached | 2 (100.0%) | 0 (0.0%) |
| Single Unit, Attached | 0 (0.0%) | 0 (0.0%) |
| 2 Unit Apartments | 0 (0.0%) | 0 (0.0%) |
| 3 or 4 Unit Apartments | 0 (0.0%) | 0 (0.0%) |
| 5 to 9 Unit Apartments | 3 (27.3%) | 8 (72.7%) |
| 10 or more Apartments | 38 (27.1%) | 102 (72.9%) |
| Mobile Home / Other | 0 (0.0%) | 2 (100.0%) |
| Total | 43 (27.7%) | 112 (72.3%) |
Housing Structures by Number of Rooms in Whittier
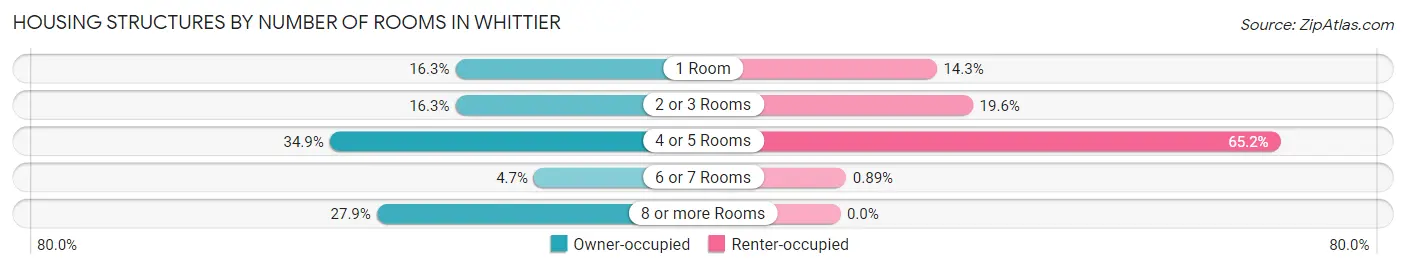
| Number of Rooms | Owner-occupied | Renter-occupied |
| 1 Room | 7 (16.3%) | 16 (14.3%) |
| 2 or 3 Rooms | 7 (16.3%) | 22 (19.6%) |
| 4 or 5 Rooms | 15 (34.9%) | 73 (65.2%) |
| 6 or 7 Rooms | 2 (4.6%) | 1 (0.9%) |
| 8 or more Rooms | 12 (27.9%) | 0 (0.0%) |
| Total | 43 (100.0%) | 112 (100.0%) |
Housing Structure by Heating Type in Whittier
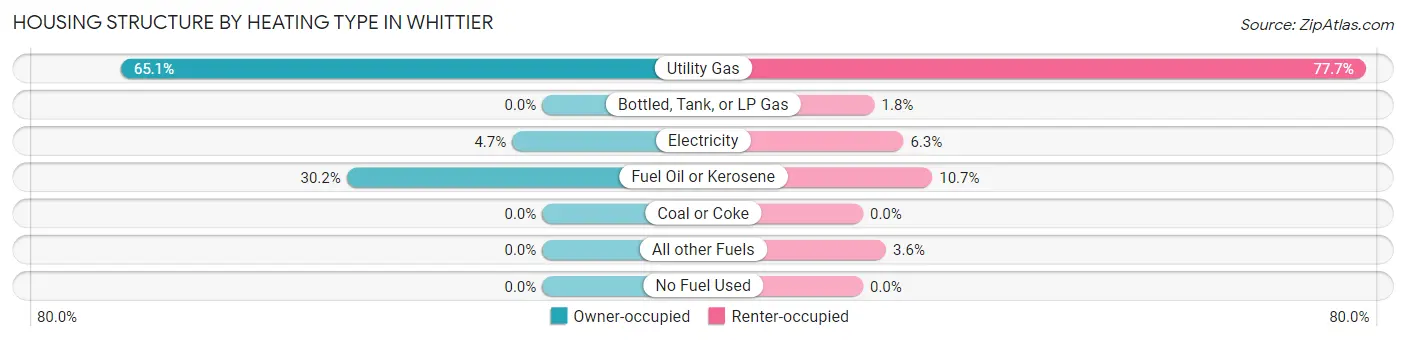
| Heating Type | Owner-occupied | Renter-occupied |
| Utility Gas | 28 (65.1%) | 87 (77.7%) |
| Bottled, Tank, or LP Gas | 0 (0.0%) | 2 (1.8%) |
| Electricity | 2 (4.6%) | 7 (6.2%) |
| Fuel Oil or Kerosene | 13 (30.2%) | 12 (10.7%) |
| Coal or Coke | 0 (0.0%) | 0 (0.0%) |
| All other Fuels | 0 (0.0%) | 4 (3.6%) |
| No Fuel Used | 0 (0.0%) | 0 (0.0%) |
| Total | 43 (100.0%) | 112 (100.0%) |
Household Vehicle Usage in Whittier
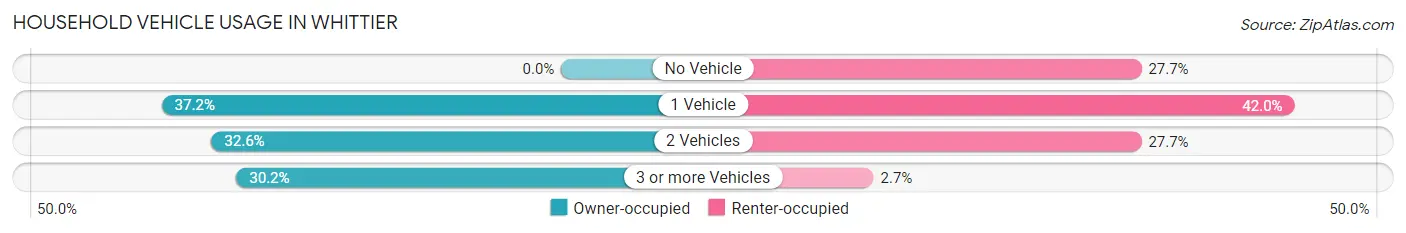
| Vehicles per Household | Owner-occupied | Renter-occupied |
| No Vehicle | 0 (0.0%) | 31 (27.7%) |
| 1 Vehicle | 16 (37.2%) | 47 (42.0%) |
| 2 Vehicles | 14 (32.6%) | 31 (27.7%) |
| 3 or more Vehicles | 13 (30.2%) | 3 (2.7%) |
| Total | 43 (100.0%) | 112 (100.0%) |
Real Estate & Mortgages in Whittier
Real Estate and Mortgage Overview in Whittier
| Characteristic | Without Mortgage | With Mortgage |
| Housing Units | 38 | 5 |
| Median Property Value | $78,000 | $0 |
| Median Household Income | $68,750 | $0 |
| Monthly Housing Costs | $643 | $0 |
| Real Estate Taxes | $457 | $0 |
Property Value by Mortgage Status in Whittier
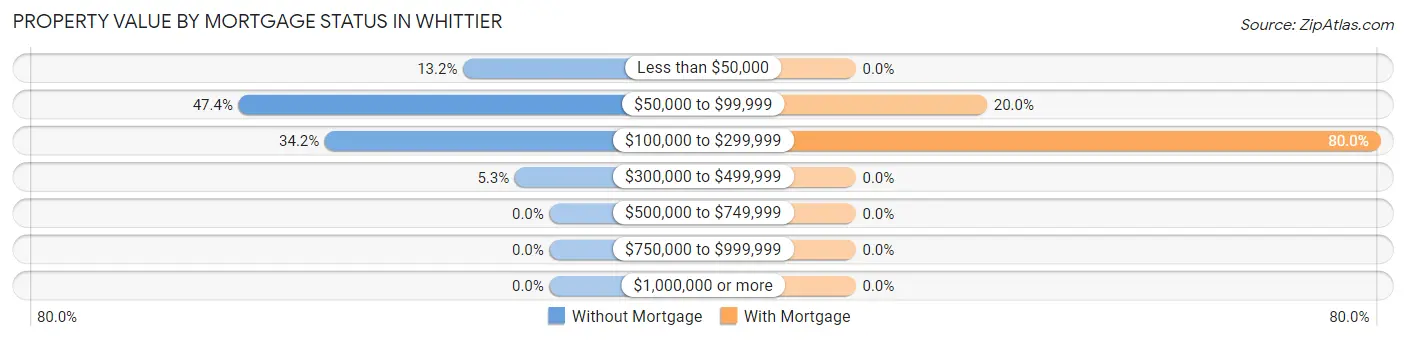
| Property Value | Without Mortgage | With Mortgage |
| Less than $50,000 | 5 (13.2%) | 0 (0.0%) |
| $50,000 to $99,999 | 18 (47.4%) | 1 (20.0%) |
| $100,000 to $299,999 | 13 (34.2%) | 4 (80.0%) |
| $300,000 to $499,999 | 2 (5.3%) | 0 (0.0%) |
| $500,000 to $749,999 | 0 (0.0%) | 0 (0.0%) |
| $750,000 to $999,999 | 0 (0.0%) | 0 (0.0%) |
| $1,000,000 or more | 0 (0.0%) | 0 (0.0%) |
| Total | 38 (100.0%) | 5 (100.0%) |
Household Income by Mortgage Status in Whittier
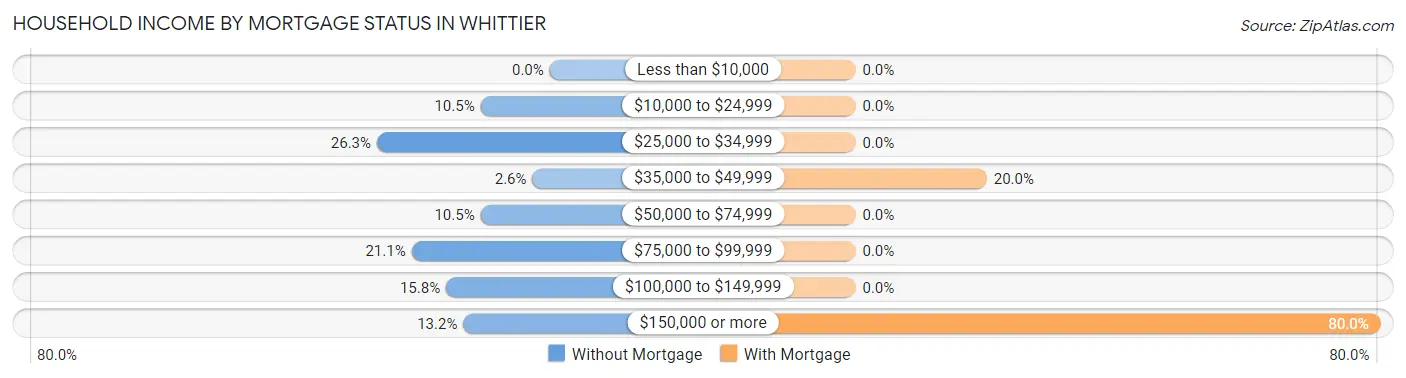
| Household Income | Without Mortgage | With Mortgage |
| Less than $10,000 | 0 (0.0%) | 0 (0.0%) |
| $10,000 to $24,999 | 4 (10.5%) | 0 (0.0%) |
| $25,000 to $34,999 | 10 (26.3%) | 0 (0.0%) |
| $35,000 to $49,999 | 1 (2.6%) | 1 (20.0%) |
| $50,000 to $74,999 | 4 (10.5%) | 0 (0.0%) |
| $75,000 to $99,999 | 8 (21.0%) | 0 (0.0%) |
| $100,000 to $149,999 | 6 (15.8%) | 0 (0.0%) |
| $150,000 or more | 5 (13.2%) | 4 (80.0%) |
| Total | 38 (100.0%) | 5 (100.0%) |
Property Value to Household Income Ratio in Whittier
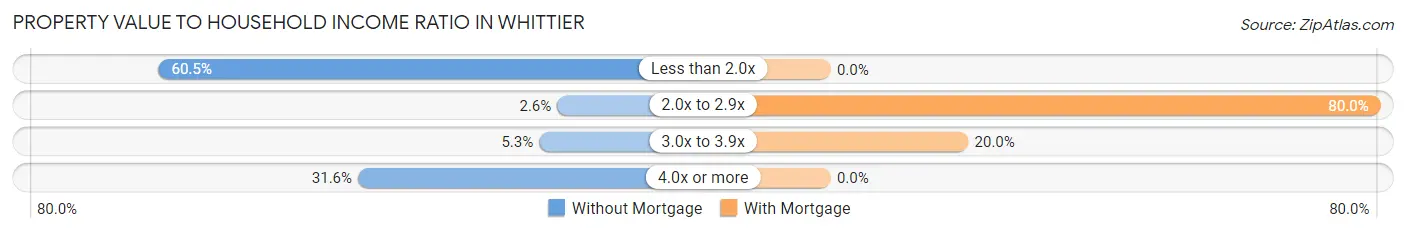
| Value-to-Income Ratio | Without Mortgage | With Mortgage |
| Less than 2.0x | 23 (60.5%) | 0 (0.0%) |
| 2.0x to 2.9x | 1 (2.6%) | 4 (80.0%) |
| 3.0x to 3.9x | 2 (5.3%) | 1 (20.0%) |
| 4.0x or more | 12 (31.6%) | 0 (0.0%) |
| Total | 38 (100.0%) | 5 (100.0%) |
Real Estate Taxes by Mortgage Status in Whittier
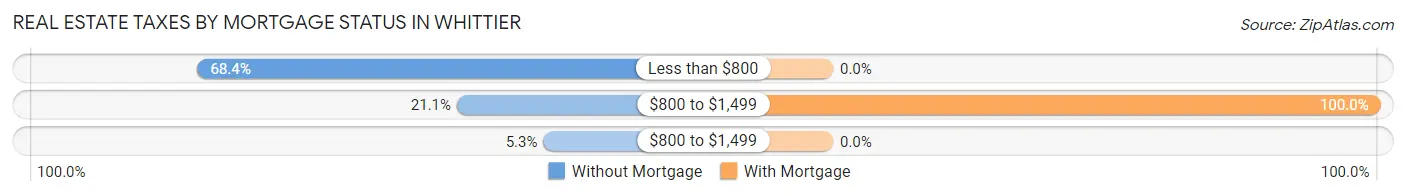
| Property Taxes | Without Mortgage | With Mortgage |
| Less than $800 | 26 (68.4%) | 0 (0.0%) |
| $800 to $1,499 | 8 (21.0%) | 5 (100.0%) |
| $800 to $1,499 | 2 (5.3%) | 0 (0.0%) |
| Total | 38 (100.0%) | 5 (100.0%) |
Health & Disability in Whittier
Health Insurance Coverage by Age in Whittier
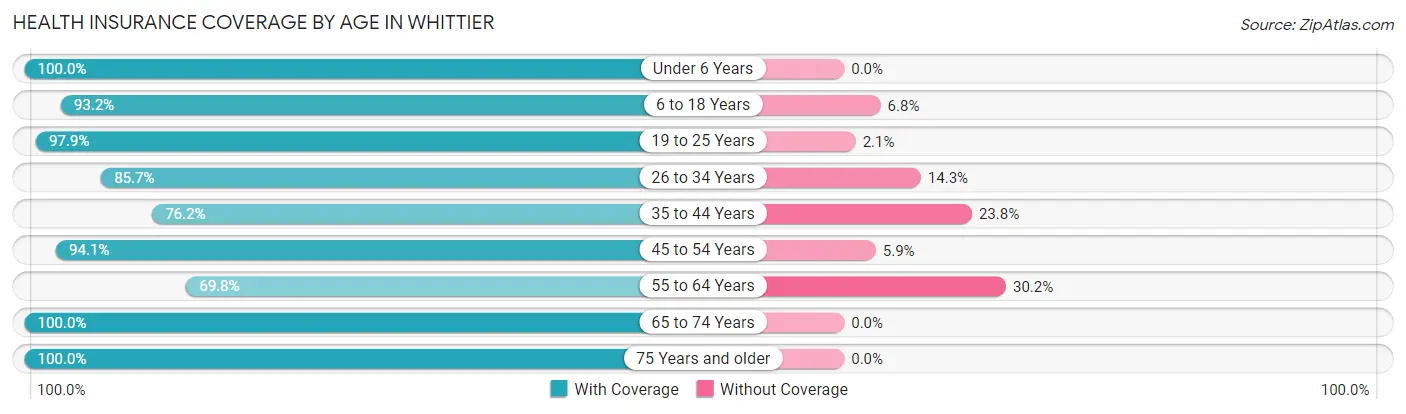
| Age Bracket | With Coverage | Without Coverage |
| Under 6 Years | 36 (100.0%) | 0 (0.0%) |
| 6 to 18 Years | 55 (93.2%) | 4 (6.8%) |
| 19 to 25 Years | 46 (97.9%) | 1 (2.1%) |
| 26 to 34 Years | 36 (85.7%) | 6 (14.3%) |
| 35 to 44 Years | 32 (76.2%) | 10 (23.8%) |
| 45 to 54 Years | 32 (94.1%) | 2 (5.9%) |
| 55 to 64 Years | 44 (69.8%) | 19 (30.2%) |
| 65 to 74 Years | 38 (100.0%) | 0 (0.0%) |
| 75 Years and older | 16 (100.0%) | 0 (0.0%) |
| Total | 335 (88.9%) | 42 (11.1%) |
Health Insurance Coverage by Citizenship Status in Whittier
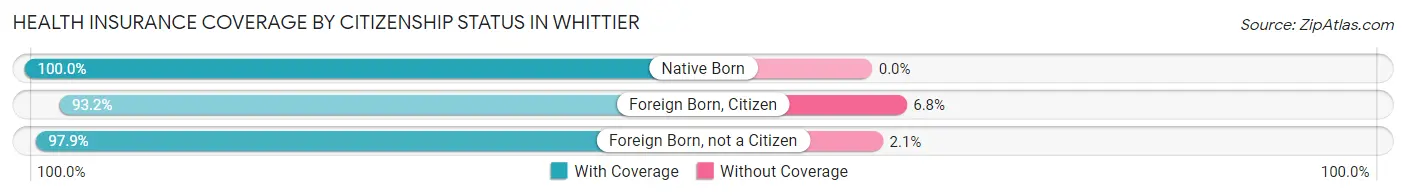
| Citizenship Status | With Coverage | Without Coverage |
| Native Born | 36 (100.0%) | 0 (0.0%) |
| Foreign Born, Citizen | 55 (93.2%) | 4 (6.8%) |
| Foreign Born, not a Citizen | 46 (97.9%) | 1 (2.1%) |
Health Insurance Coverage by Household Income in Whittier
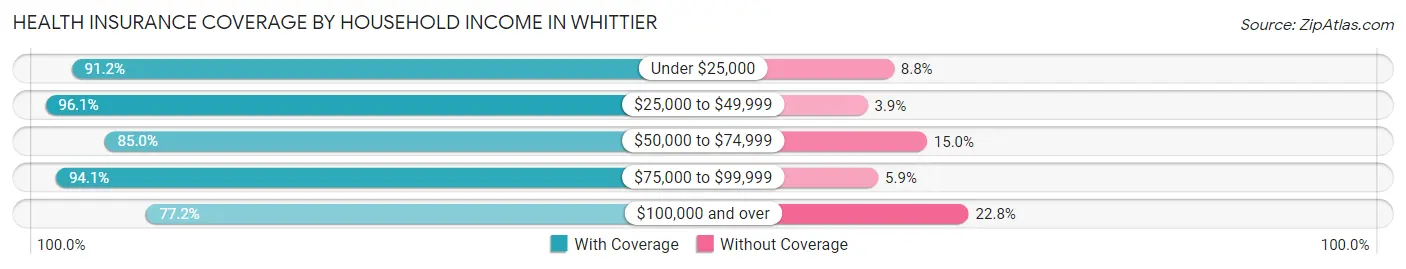
| Household Income | With Coverage | Without Coverage |
| Under $25,000 | 62 (91.2%) | 6 (8.8%) |
| $25,000 to $49,999 | 99 (96.1%) | 4 (3.9%) |
| $50,000 to $74,999 | 51 (85.0%) | 9 (15.0%) |
| $75,000 to $99,999 | 32 (94.1%) | 2 (5.9%) |
| $100,000 and over | 71 (77.2%) | 21 (22.8%) |
Public vs Private Health Insurance Coverage by Age in Whittier
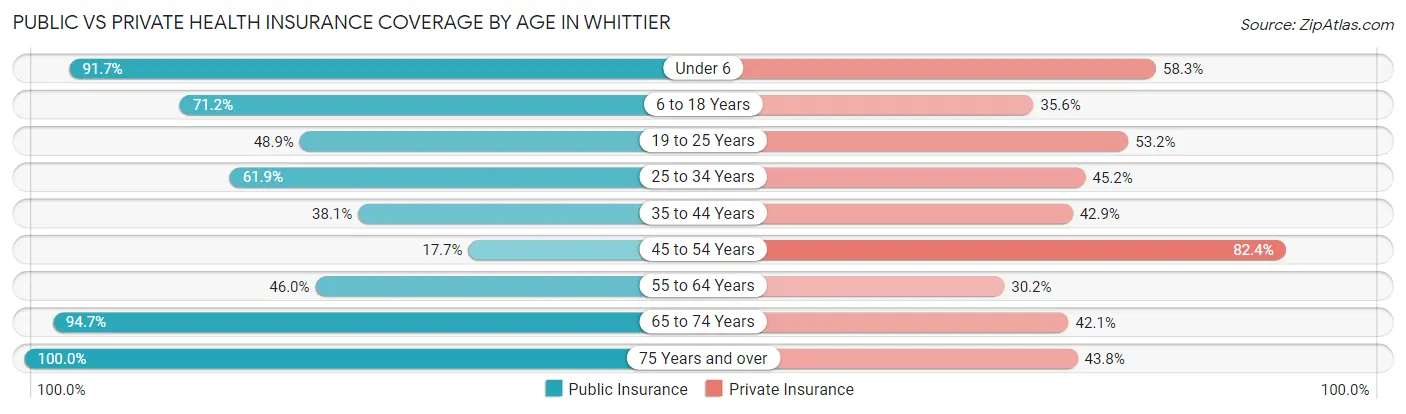
| Age Bracket | Public Insurance | Private Insurance |
| Under 6 | 33 (91.7%) | 21 (58.3%) |
| 6 to 18 Years | 42 (71.2%) | 21 (35.6%) |
| 19 to 25 Years | 23 (48.9%) | 25 (53.2%) |
| 25 to 34 Years | 26 (61.9%) | 19 (45.2%) |
| 35 to 44 Years | 16 (38.1%) | 18 (42.9%) |
| 45 to 54 Years | 6 (17.6%) | 28 (82.4%) |
| 55 to 64 Years | 29 (46.0%) | 19 (30.2%) |
| 65 to 74 Years | 36 (94.7%) | 16 (42.1%) |
| 75 Years and over | 16 (100.0%) | 7 (43.8%) |
| Total | 227 (60.2%) | 174 (46.2%) |
Disability Status by Sex by Age in Whittier
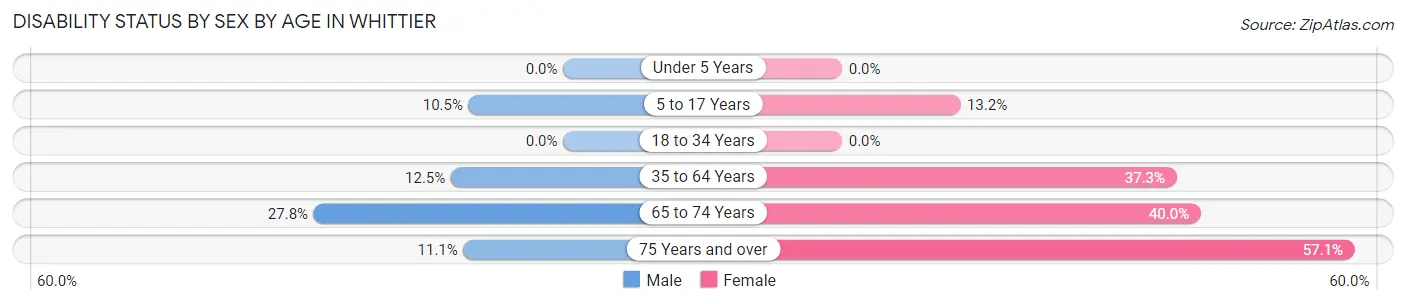
| Age Bracket | Male | Female |
| Under 5 Years | 0 (0.0%) | 0 (0.0%) |
| 5 to 17 Years | 2 (10.5%) | 5 (13.2%) |
| 18 to 34 Years | 0 (0.0%) | 0 (0.0%) |
| 35 to 64 Years | 9 (12.5%) | 25 (37.3%) |
| 65 to 74 Years | 5 (27.8%) | 8 (40.0%) |
| 75 Years and over | 1 (11.1%) | 4 (57.1%) |
Disability Class by Sex by Age in Whittier
Disability Class: Hearing Difficulty
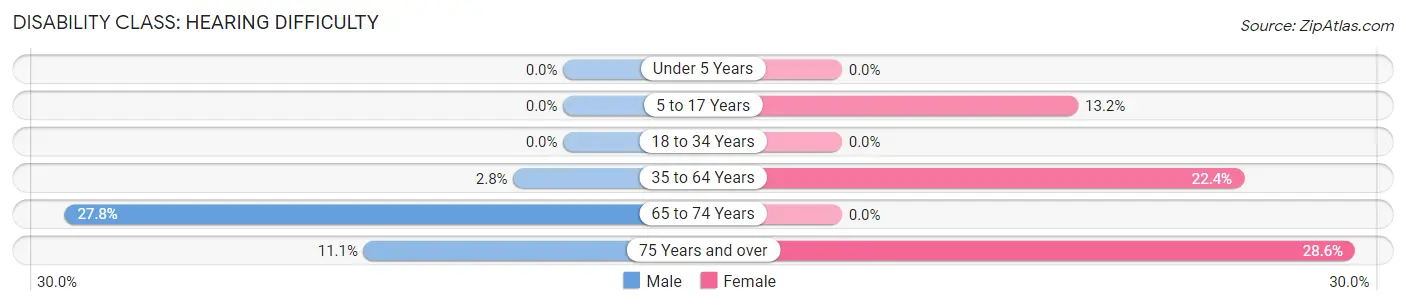
| Age Bracket | Male | Female |
| Under 5 Years | 0 (0.0%) | 0 (0.0%) |
| 5 to 17 Years | 0 (0.0%) | 5 (13.2%) |
| 18 to 34 Years | 0 (0.0%) | 0 (0.0%) |
| 35 to 64 Years | 2 (2.8%) | 15 (22.4%) |
| 65 to 74 Years | 5 (27.8%) | 0 (0.0%) |
| 75 Years and over | 1 (11.1%) | 2 (28.6%) |
Disability Class: Vision Difficulty
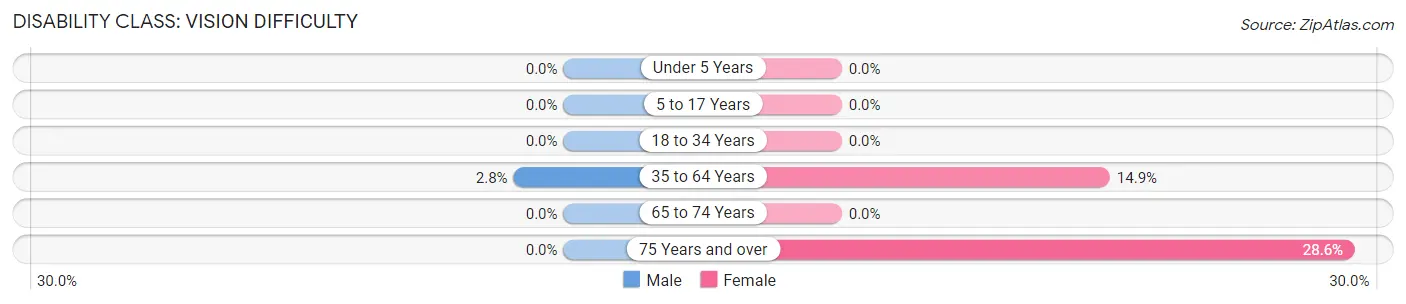
| Age Bracket | Male | Female |
| Under 5 Years | 0 (0.0%) | 0 (0.0%) |
| 5 to 17 Years | 0 (0.0%) | 0 (0.0%) |
| 18 to 34 Years | 0 (0.0%) | 0 (0.0%) |
| 35 to 64 Years | 2 (2.8%) | 10 (14.9%) |
| 65 to 74 Years | 0 (0.0%) | 0 (0.0%) |
| 75 Years and over | 0 (0.0%) | 2 (28.6%) |
Disability Class: Cognitive Difficulty
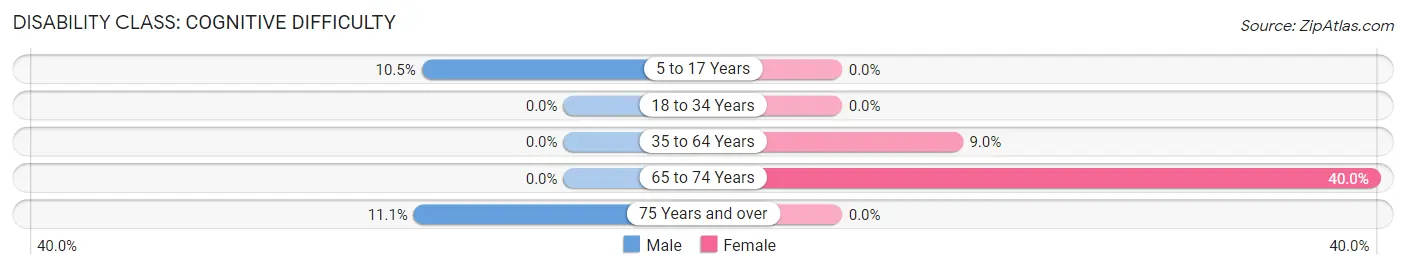
| Age Bracket | Male | Female |
| 5 to 17 Years | 2 (10.5%) | 0 (0.0%) |
| 18 to 34 Years | 0 (0.0%) | 0 (0.0%) |
| 35 to 64 Years | 0 (0.0%) | 6 (9.0%) |
| 65 to 74 Years | 0 (0.0%) | 8 (40.0%) |
| 75 Years and over | 1 (11.1%) | 0 (0.0%) |
Disability Class: Ambulatory Difficulty
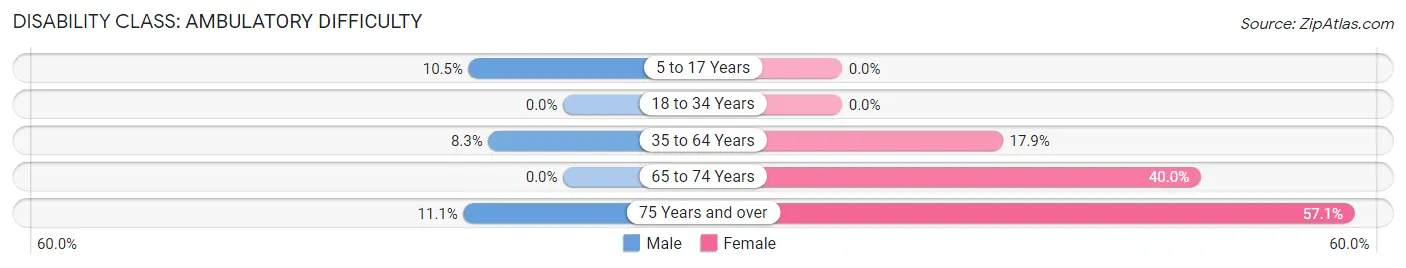
| Age Bracket | Male | Female |
| 5 to 17 Years | 2 (10.5%) | 0 (0.0%) |
| 18 to 34 Years | 0 (0.0%) | 0 (0.0%) |
| 35 to 64 Years | 6 (8.3%) | 12 (17.9%) |
| 65 to 74 Years | 0 (0.0%) | 8 (40.0%) |
| 75 Years and over | 1 (11.1%) | 4 (57.1%) |
Disability Class: Self-Care Difficulty
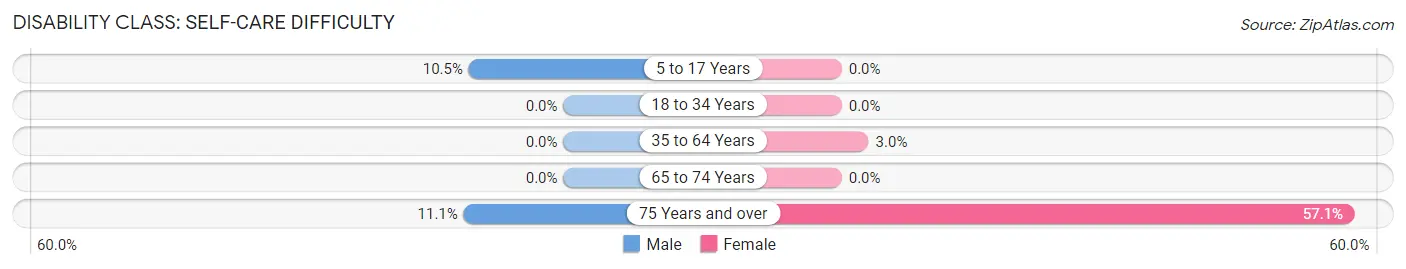
| Age Bracket | Male | Female |
| 5 to 17 Years | 2 (10.5%) | 0 (0.0%) |
| 18 to 34 Years | 0 (0.0%) | 0 (0.0%) |
| 35 to 64 Years | 0 (0.0%) | 2 (3.0%) |
| 65 to 74 Years | 0 (0.0%) | 0 (0.0%) |
| 75 Years and over | 1 (11.1%) | 4 (57.1%) |
Technology Access in Whittier
Computing Device Access in Whittier
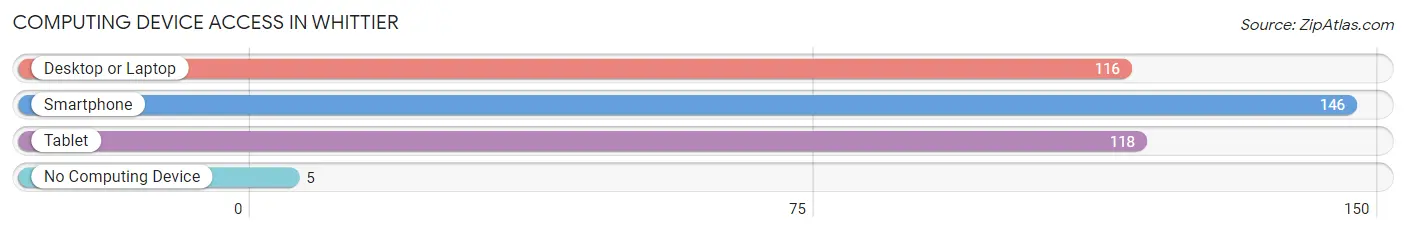
| Device Type | # Households | % Households |
| Desktop or Laptop | 116 | 74.8% |
| Smartphone | 146 | 94.2% |
| Tablet | 118 | 76.1% |
| No Computing Device | 5 | 3.2% |
| Total | 155 | 100.0% |
Internet Access in Whittier
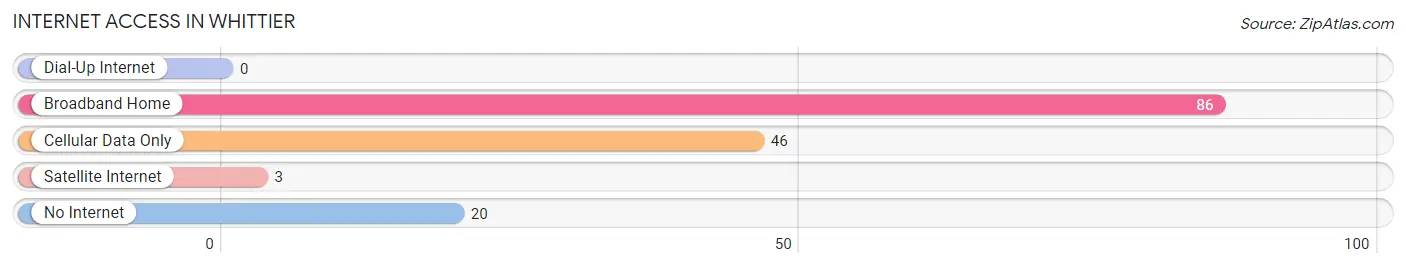
| Internet Type | # Households | % Households |
| Dial-Up Internet | 0 | 0.0% |
| Broadband Home | 86 | 55.5% |
| Cellular Data Only | 46 | 29.7% |
| Satellite Internet | 3 | 1.9% |
| No Internet | 20 | 12.9% |
| Total | 155 | 100.0% |
Whittier Summary
Whittier, Alaska is a small city located in the Prince William Sound region of the state. It is located at the head of Passage Canal, approximately 58 miles southeast of Anchorage. The city is home to a population of approximately 220 people, making it one of the smallest cities in Alaska.
History
Whittier was founded in the early 1940s as a military port for the U.S. Army. The city was named after John Greenleaf Whittier, a 19th century American poet. The city was initially used as a port for the Alaska Railroad, but it was later developed into a fishing and logging port. In the 1950s, the city was connected to the Alaska Highway, allowing for increased access to the city.
In the 1960s, the city was connected to the Alaska Marine Highway System, allowing for increased access to the city by sea. In the 1970s, the city was connected to the Alaska Pipeline, allowing for increased access to the city by land.
Geography
Whittier is located in the Prince William Sound region of Alaska. It is located at the head of Passage Canal, approximately 58 miles southeast of Anchorage. The city is surrounded by mountains and glaciers, and is located on the shore of the Prince William Sound. The city has a total area of 1.3 square miles, all of which is land.
Economy
The economy of Whittier is largely based on fishing and tourism. The city is home to a number of fishing charters, which offer guided fishing trips in the area. The city is also home to a number of tourist attractions, including the Alaska Wildlife Conservation Center, the Alaska SeaLife Center, and the Alaska Maritime National Wildlife Refuge.
Demographics
As of the 2010 census, the population of Whittier was 220 people, with a population density of 169.3 people per square mile. The racial makeup of the city was 95.5% White, 0.5% Native American, 0.5% Asian, 0.5% from other races, and 3.0% from two or more races. The median age of the population was 44.7 years. The median household income was $50,000, and the median family income was $54,375.
Conclusion
Whittier, Alaska is a small city located in the Prince William Sound region of the state. It is home to a population of approximately 220 people, making it one of the smallest cities in Alaska. The economy of Whittier is largely based on fishing and tourism, and the city is home to a number of tourist attractions. The population of Whittier is predominantly White, with a median age of 44.7 years and a median household income of $50,000.
Common Questions
What is Per Capita Income in Whittier?
Per Capita income in Whittier is $30,928.
What is the Median Family Income in Whittier?
Median Family Income in Whittier is $49,231.
What is the Median Household income in Whittier?
Median Household Income in Whittier is $48,828.
What is Income or Wage Gap in Whittier?
Income or Wage Gap in Whittier is 16.4%.
Women in Whittier earn 83.6 cents for every dollar earned by a man.
What is Inequality or Gini Index in Whittier?
Inequality or Gini Index in Whittier is 0.44.
What is the Total Population of Whittier?
Total Population of Whittier is 377.
What is the Total Male Population of Whittier?
Total Male Population of Whittier is 176.
What is the Total Female Population of Whittier?
Total Female Population of Whittier is 201.
What is the Ratio of Males per 100 Females in Whittier?
There are 87.56 Males per 100 Females in Whittier.
What is the Ratio of Females per 100 Males in Whittier?
There are 114.20 Females per 100 Males in Whittier.
What is the Median Population Age in Whittier?
Median Population Age in Whittier is 36.5 Years.
What is the Average Family Size in Whittier
Average Family Size in Whittier is 3.0 People.
What is the Average Household Size in Whittier
Average Household Size in Whittier is 2.3 People.
How Large is the Labor Force in Whittier?
There are 192 People in the Labor Forcein in Whittier.
What is the Percentage of People in the Labor Force in Whittier?
64.2% of People are in the Labor Force in Whittier.
What is the Unemployment Rate in Whittier?
Unemployment Rate in Whittier is 13.0%.