Point Hope, AK Map & Demographics
Point Hope Map
Point Hope Overview
$20,284
PER CAPITA INCOME
$63,750
AVG FAMILY INCOME
$56,250
AVG HOUSEHOLD INCOME
$15,228
FAMILY INCOME DEFICIT
0.48
INEQUALITY / GINI INDEX
649
TOTAL POPULATION
359
MALE POPULATION
290
FEMALE POPULATION
123.79
MALES / 100 FEMALES
80.78
FEMALES / 100 MALES
24.7
MEDIAN AGE
4.9
AVG FAMILY SIZE
4.4
AVG HOUSEHOLD SIZE
197
LABOR FORCE [ PEOPLE ]
50.4%
PERCENT IN LABOR FORCE
27.4%
UNEMPLOYMENT RATE
Point Hope Zip Codes
Point Hope Area Codes
Income in Point Hope
Income Overview in Point Hope
Per Capita Income in Point Hope is $20,284, while median incomes of families and households are $63,750 and $56,250 respectively.
| Characteristic | Number | Measure |
| Per Capita Income | 649 | $20,284 |
| Median Family Income | 118 | $63,750 |
| Mean Family Income | 118 | $94,621 |
| Median Household Income | 149 | $56,250 |
| Mean Household Income | 149 | $88,975 |
| Income Deficit | 118 | $15,228 |
| Wage / Income Gap (%) | 649 | 0.00% |
| Wage / Income Gap ($) | 649 | 100.00¢ per $1 |
| Gini / Inequality Index | 649 | 0.48 |
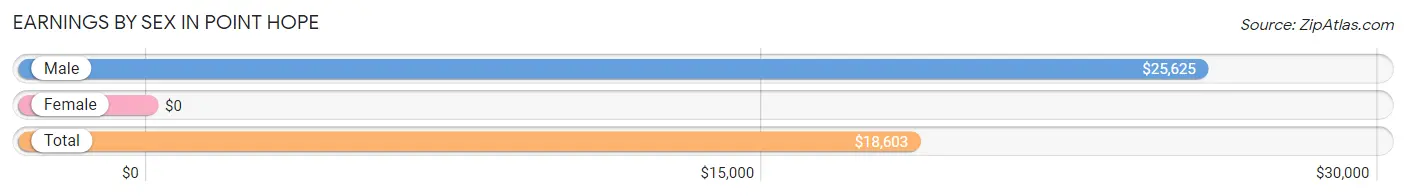
Earnings by Sex in Point Hope
| Sex | Number | Average Earnings |
| Male | 143 (64.1%) | $25,625 |
| Female | 80 (35.9%) | $0 |
| Total | 223 (100.0%) | $18,603 |
Earnings by Sex by Income Bracket in Point Hope
The most common earnings brackets in Point Hope are $10,000 to $12,499 for men (15 | 10.5%) and $2,499 or less for women (22 | 27.5%).
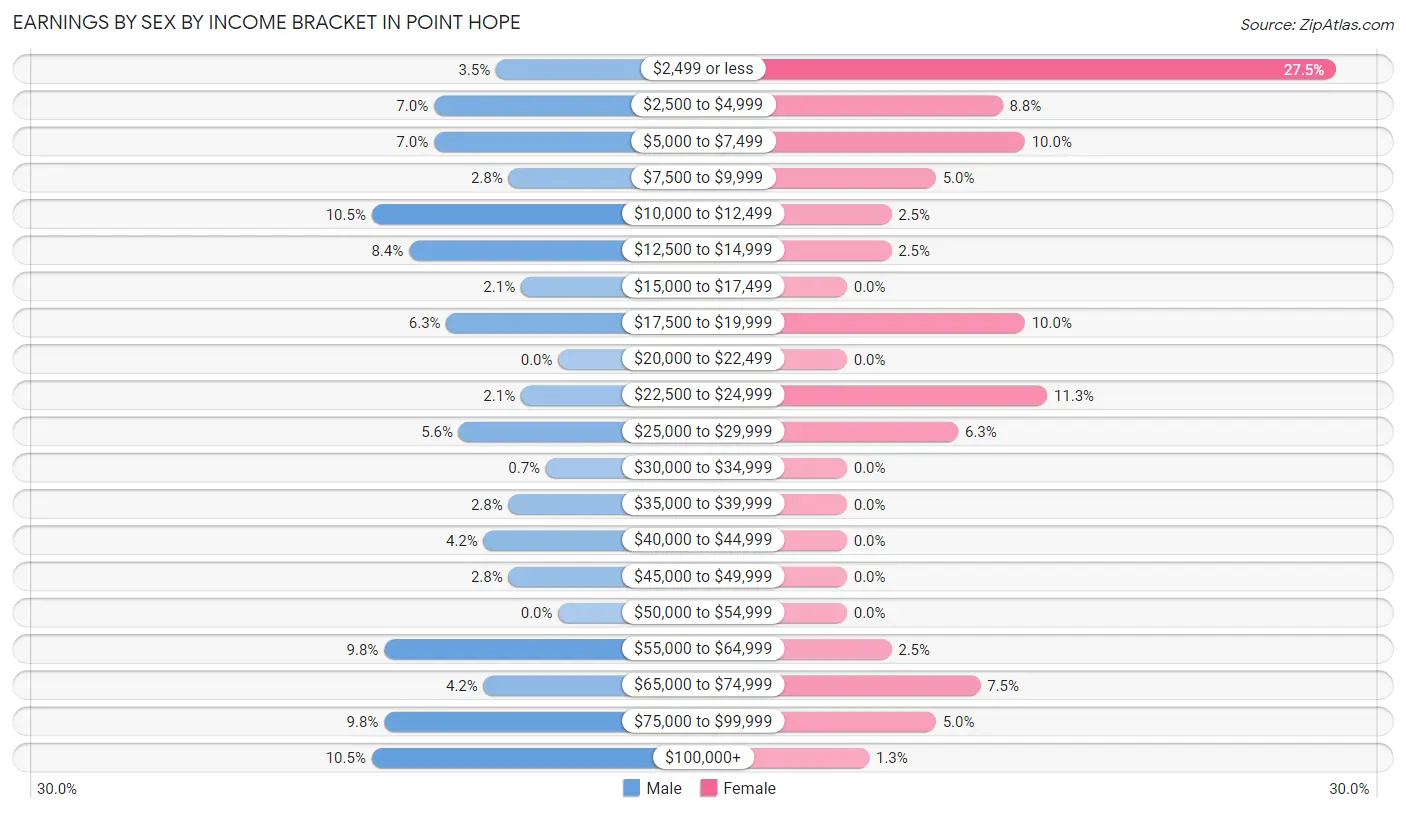
| Income | Male | Female |
| $2,499 or less | 5 (3.5%) | 22 (27.5%) |
| $2,500 to $4,999 | 10 (7.0%) | 7 (8.7%) |
| $5,000 to $7,499 | 10 (7.0%) | 8 (10.0%) |
| $7,500 to $9,999 | 4 (2.8%) | 4 (5.0%) |
| $10,000 to $12,499 | 15 (10.5%) | 2 (2.5%) |
| $12,500 to $14,999 | 12 (8.4%) | 2 (2.5%) |
| $15,000 to $17,499 | 3 (2.1%) | 0 (0.0%) |
| $17,500 to $19,999 | 9 (6.3%) | 8 (10.0%) |
| $20,000 to $22,499 | 0 (0.0%) | 0 (0.0%) |
| $22,500 to $24,999 | 3 (2.1%) | 9 (11.3%) |
| $25,000 to $29,999 | 8 (5.6%) | 5 (6.2%) |
| $30,000 to $34,999 | 1 (0.7%) | 0 (0.0%) |
| $35,000 to $39,999 | 4 (2.8%) | 0 (0.0%) |
| $40,000 to $44,999 | 6 (4.2%) | 0 (0.0%) |
| $45,000 to $49,999 | 4 (2.8%) | 0 (0.0%) |
| $50,000 to $54,999 | 0 (0.0%) | 0 (0.0%) |
| $55,000 to $64,999 | 14 (9.8%) | 2 (2.5%) |
| $65,000 to $74,999 | 6 (4.2%) | 6 (7.5%) |
| $75,000 to $99,999 | 14 (9.8%) | 4 (5.0%) |
| $100,000+ | 15 (10.5%) | 1 (1.3%) |
| Total | 143 (100.0%) | 80 (100.0%) |
Earnings by Sex by Educational Attainment in Point Hope
Average earnings in Point Hope are $36,875 for men and $19,844 for women, a difference of 46.2%. Men with an educational attainment of high school diploma enjoy the highest average annual earnings of $59,250, while those with less than high school education earn the least with $23,750. Women with an educational attainment of college or associate's degree earn the most with the average annual earnings of $66,250, while those with high school diploma education have the smallest earnings of $18,906.
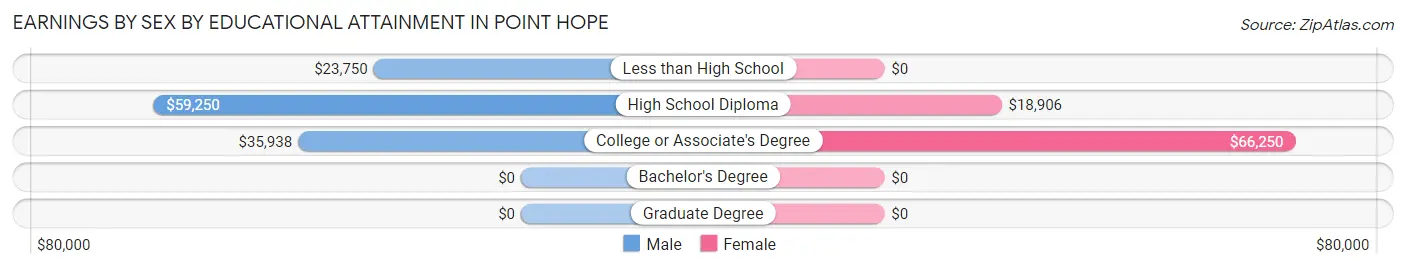
| Educational Attainment | Male Income | Female Income |
| Less than High School | $23,750 | $0 |
| High School Diploma | $59,250 | $18,906 |
| College or Associate's Degree | $35,938 | $66,250 |
| Bachelor's Degree | - | - |
| Graduate Degree | - | - |
| Total | $36,875 | $19,844 |
Family Income in Point Hope
Family Income Brackets in Point Hope
According to the Point Hope family income data, there are 22 families falling into the $50,000 to $74,999 income range, which is the most common income bracket and makes up 18.6% of all families. Conversely, the $15,000 to $24,999 income bracket is the least frequent group with only 5 families (4.2%) belonging to this category.
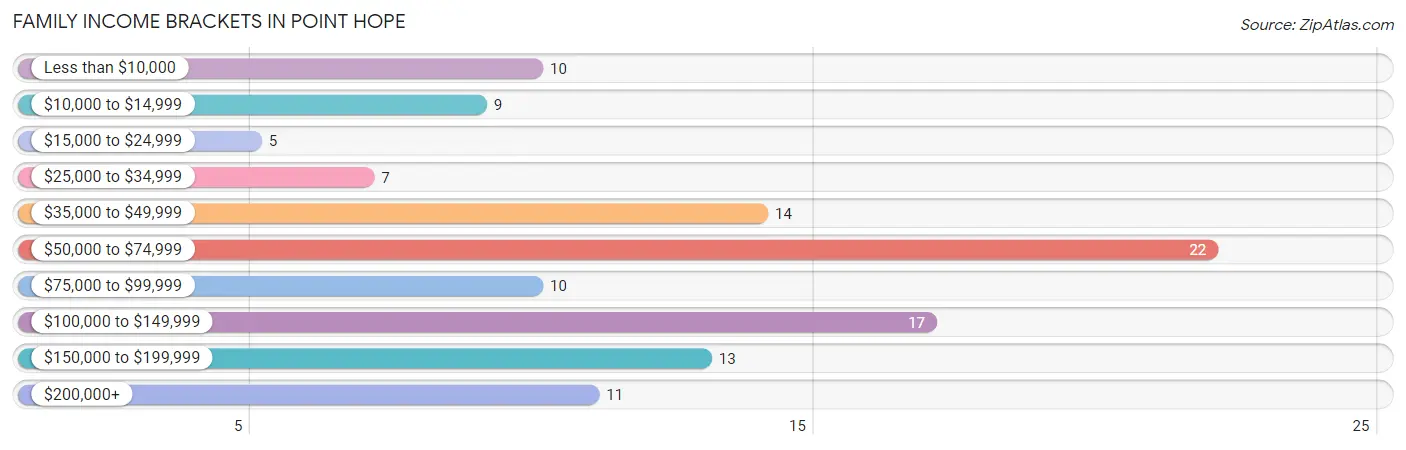
| Income Bracket | # Families | % Families |
| Less than $10,000 | 10 | 8.5% |
| $10,000 to $14,999 | 9 | 7.6% |
| $15,000 to $24,999 | 5 | 4.2% |
| $25,000 to $34,999 | 7 | 5.9% |
| $35,000 to $49,999 | 14 | 11.9% |
| $50,000 to $74,999 | 22 | 18.6% |
| $75,000 to $99,999 | 10 | 8.5% |
| $100,000 to $149,999 | 17 | 14.4% |
| $150,000 to $199,999 | 13 | 11.0% |
| $200,000+ | 11 | 9.3% |
Family Income by Famaliy Size in Point Hope
7+ person families (25 | 21.2%) account for the highest median family income in Point Hope with $162,813 per family, while 7+ person families (25 | 21.2%) have the highest median income of $23,259 per family member.
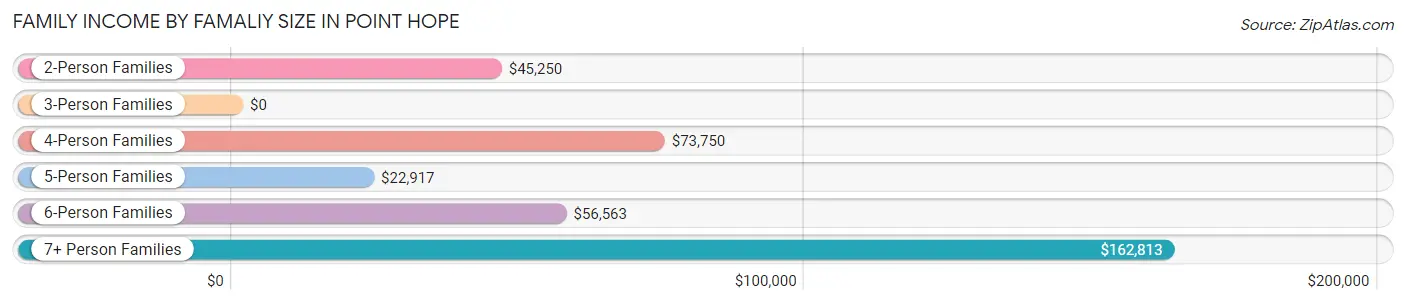
| Income Bracket | # Families | Median Income |
| 2-Person Families | 19 (16.1%) | $45,250 |
| 3-Person Families | 12 (10.2%) | $0 |
| 4-Person Families | 18 (15.2%) | $73,750 |
| 5-Person Families | 25 (21.2%) | $22,917 |
| 6-Person Families | 19 (16.1%) | $56,563 |
| 7+ Person Families | 25 (21.2%) | $162,813 |
| Total | 118 (100.0%) | $63,750 |
Family Income by Number of Earners in Point Hope
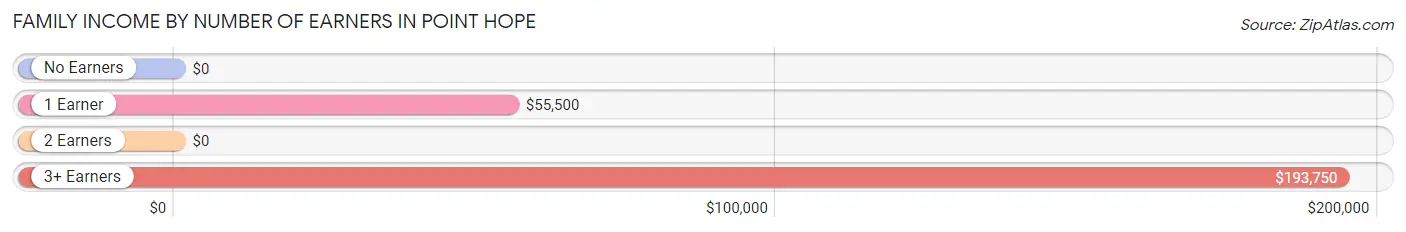
| Number of Earners | # Families | Median Income |
| No Earners | 27 (22.9%) | $0 |
| 1 Earner | 46 (39.0%) | $55,500 |
| 2 Earners | 27 (22.9%) | $0 |
| 3+ Earners | 18 (15.2%) | $193,750 |
| Total | 118 (100.0%) | $63,750 |
Household Income in Point Hope
Household Income Brackets in Point Hope
With 24 households falling in the category, the $15,000 to $24,999 income range is the most frequent in Point Hope, accounting for 16.1% of all households. In contrast, only 1 households (0.7%) fall into the less than $10,000 income bracket, making it the least populous group.
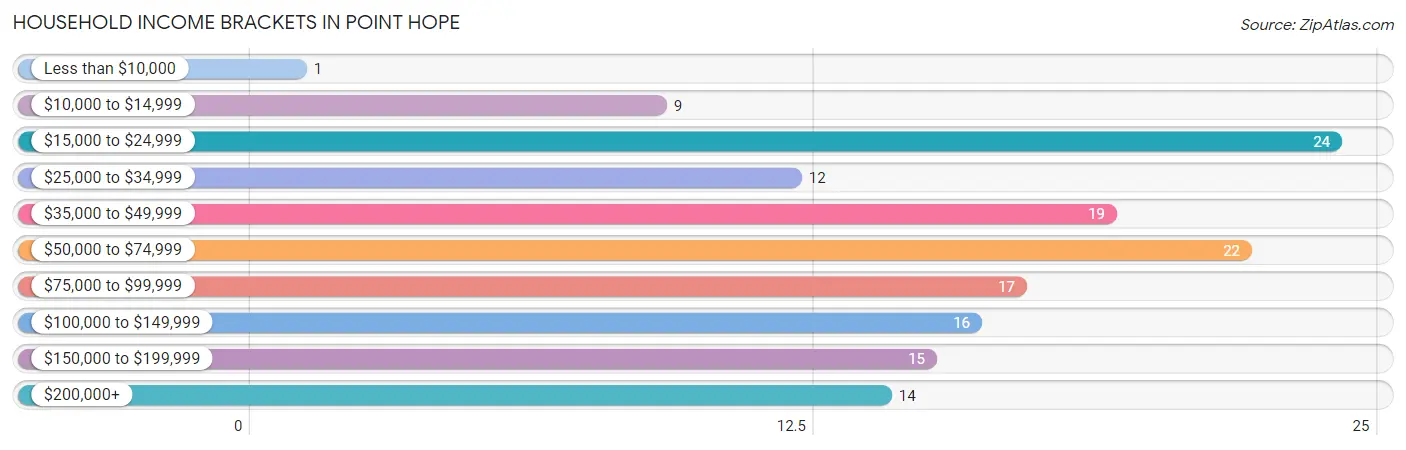
| Income Bracket | # Households | % Households |
| Less than $10,000 | 1 | 0.7% |
| $10,000 to $14,999 | 9 | 6.0% |
| $15,000 to $24,999 | 24 | 16.1% |
| $25,000 to $34,999 | 12 | 8.1% |
| $35,000 to $49,999 | 19 | 12.8% |
| $50,000 to $74,999 | 22 | 14.8% |
| $75,000 to $99,999 | 17 | 11.4% |
| $100,000 to $149,999 | 16 | 10.7% |
| $150,000 to $199,999 | 15 | 10.1% |
| $200,000+ | 14 | 9.4% |
Household Income by Householder Age in Point Hope
The median household income in Point Hope is $56,250, with the highest median household income of $78,125 found in the 45 to 64 years age bracket for the primary householder. A total of 41 households (27.5%) fall into this category.
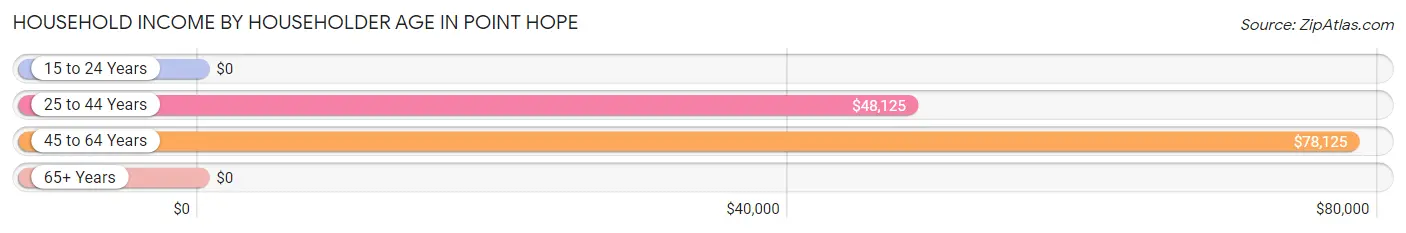
| Income Bracket | # Households | Median Income |
| 15 to 24 Years | 0 (0.0%) | $0 |
| 25 to 44 Years | 71 (47.6%) | $48,125 |
| 45 to 64 Years | 41 (27.5%) | $78,125 |
| 65+ Years | 37 (24.8%) | $0 |
| Total | 149 (100.0%) | $56,250 |
Poverty in Point Hope
Income Below Poverty by Sex and Age in Point Hope
With 17.0% poverty level for males and 23.5% for females among the residents of Point Hope, 12 to 14 year old males and 5 year old females are the most vulnerable to poverty, with 6 males (37.5%) and 4 females (44.4%) in their respective age groups living below the poverty level.
| Age Bracket | Male | Female |
| Under 5 Years | 12 (21.8%) | 5 (13.2%) |
| 5 Years | 0 (0.0%) | 4 (44.4%) |
| 6 to 11 Years | 12 (36.4%) | 25 (39.1%) |
| 12 to 14 Years | 6 (37.5%) | 3 (20.0%) |
| 15 Years | 0 (0.0%) | 0 (0.0%) |
| 16 and 17 Years | 0 (0.0%) | 0 (0.0%) |
| 18 to 24 Years | 2 (11.1%) | 3 (8.3%) |
| 25 to 34 Years | 13 (16.1%) | 14 (43.8%) |
| 35 to 44 Years | 12 (25.0%) | 10 (40.0%) |
| 45 to 54 Years | 1 (4.0%) | 1 (7.7%) |
| 55 to 64 Years | 3 (15.8%) | 2 (8.7%) |
| 65 to 74 Years | 0 (0.0%) | 0 (0.0%) |
| 75 Years and over | 0 (0.0%) | 0 (0.0%) |
| Total | 61 (17.0%) | 67 (23.5%) |
Income Above Poverty by Sex and Age in Point Hope
According to the poverty statistics in Point Hope, males aged 5 years and females aged 15 years are the age groups that are most secure financially, with 100.0% of males and 100.0% of females in these age groups living above the poverty line.
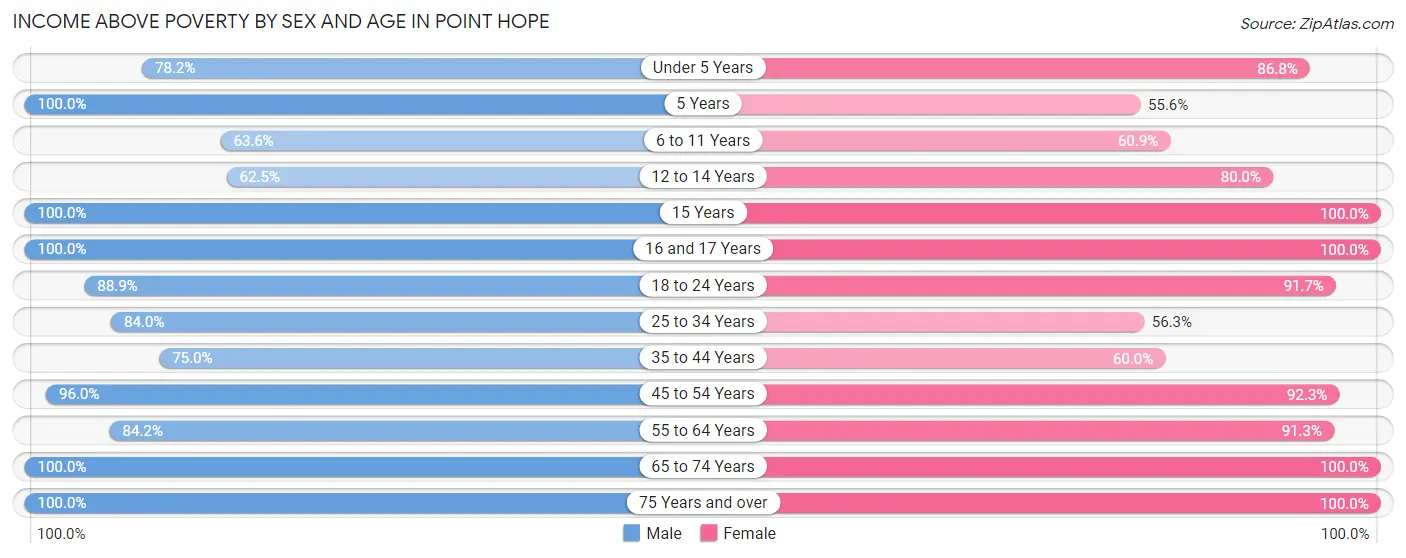
| Age Bracket | Male | Female |
| Under 5 Years | 43 (78.2%) | 33 (86.8%) |
| 5 Years | 3 (100.0%) | 5 (55.6%) |
| 6 to 11 Years | 21 (63.6%) | 39 (60.9%) |
| 12 to 14 Years | 10 (62.5%) | 12 (80.0%) |
| 15 Years | 18 (100.0%) | 2 (100.0%) |
| 16 and 17 Years | 11 (100.0%) | 4 (100.0%) |
| 18 to 24 Years | 16 (88.9%) | 33 (91.7%) |
| 25 to 34 Years | 68 (84.0%) | 18 (56.2%) |
| 35 to 44 Years | 36 (75.0%) | 15 (60.0%) |
| 45 to 54 Years | 24 (96.0%) | 12 (92.3%) |
| 55 to 64 Years | 16 (84.2%) | 21 (91.3%) |
| 65 to 74 Years | 19 (100.0%) | 8 (100.0%) |
| 75 Years and over | 13 (100.0%) | 16 (100.0%) |
| Total | 298 (83.0%) | 218 (76.5%) |
Income Below Poverty Among Married-Couple Families in Point Hope
The poverty statistics for married-couple families in Point Hope show that 20.0% or 12 of the total 60 families live below the poverty line. Families with 3 or 4 children have the highest poverty rate of 44.4%, comprising of 12 families. On the other hand, families with no children have the lowest poverty rate of 0.0%, which includes 0 families.
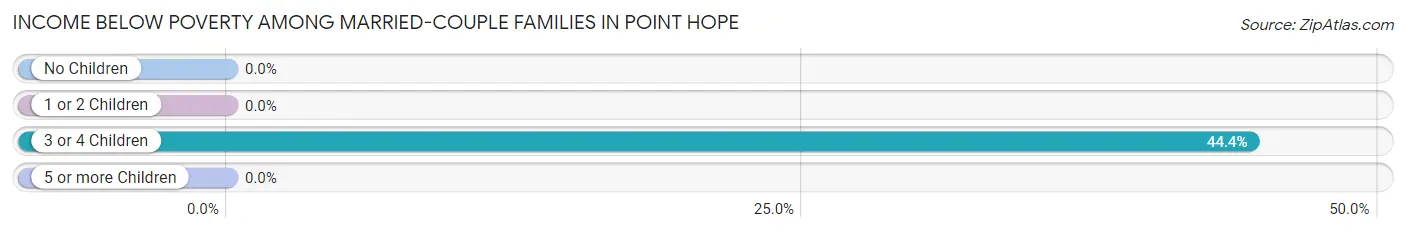
| Children | Above Poverty | Below Poverty |
| No Children | 8 (100.0%) | 0 (0.0%) |
| 1 or 2 Children | 17 (100.0%) | 0 (0.0%) |
| 3 or 4 Children | 15 (55.6%) | 12 (44.4%) |
| 5 or more Children | 8 (100.0%) | 0 (0.0%) |
| Total | 48 (80.0%) | 12 (20.0%) |
Income Below Poverty Among Single-Parent Households in Point Hope
According to the poverty data in Point Hope, 35.7% or 10 single-father households and 23.3% or 7 single-mother households are living below the poverty line. Among single-father households, those with 3 or 4 children have the highest poverty rate, with 8 households (100.0%) experiencing poverty. Likewise, among single-mother households, those with 1 or 2 children have the highest poverty rate, with 4 households (33.3%) falling below the poverty line.
| Children | Single Father | Single Mother |
| No Children | 0 (0.0%) | 0 (0.0%) |
| 1 or 2 Children | 2 (33.3%) | 4 (33.3%) |
| 3 or 4 Children | 8 (100.0%) | 3 (30.0%) |
| 5 or more Children | 0 (0.0%) | 0 (0.0%) |
| Total | 10 (35.7%) | 7 (23.3%) |
Income Below Poverty Among Married-Couple vs Single-Parent Households in Point Hope
The poverty data for Point Hope shows that 12 of the married-couple family households (20.0%) and 17 of the single-parent households (29.3%) are living below the poverty level. Within the married-couple family households, those with 3 or 4 children have the highest poverty rate, with 12 households (44.4%) falling below the poverty line. Among the single-parent households, those with 3 or 4 children have the highest poverty rate, with 11 household (61.1%) living below poverty.
| Children | Married-Couple Families | Single-Parent Households |
| No Children | 0 (0.0%) | 0 (0.0%) |
| 1 or 2 Children | 0 (0.0%) | 6 (33.3%) |
| 3 or 4 Children | 12 (44.4%) | 11 (61.1%) |
| 5 or more Children | 0 (0.0%) | 0 (0.0%) |
| Total | 12 (20.0%) | 17 (29.3%) |
Race in Point Hope
The most populous races in Point Hope are Native / Alaskan (551 | 84.9%), Two or more Races (79 | 12.2%), and Hispanic or Latino (19 | 2.9%).
| Race | # Population | % Population |
| Asian | 0 | 0.0% |
| Black / African American | 4 | 0.6% |
| Hawaiian / Pacific | 0 | 0.0% |
| Hispanic or Latino | 19 | 2.9% |
| Native / Alaskan | 551 | 84.9% |
| White / Caucasian | 15 | 2.3% |
| Two or more Races | 79 | 12.2% |
| Some other Race | 0 | 0.0% |
| Total | 649 | 100.0% |
Ancestry in Point Hope
The most populous ancestries reported in Point Hope are Inupiat (591 | 91.1%), Alaska Native (31 | 4.8%), Portuguese (17 | 2.6%), Mexican (13 | 2.0%), and German (9 | 1.4%), together accounting for 101.8% of all Point Hope residents.
| Ancestry | # Population | % Population |
| Alaska Native | 31 | 4.8% |
| Alaskan Athabascan | 1 | 0.2% |
| Austrian | 1 | 0.2% |
| Canadian | 1 | 0.2% |
| Dutch | 1 | 0.2% |
| English | 3 | 0.5% |
| French | 1 | 0.2% |
| German | 9 | 1.4% |
| Hopi | 3 | 0.5% |
| Inupiat | 591 | 91.1% |
| Irish | 7 | 1.1% |
| Italian | 1 | 0.2% |
| Mexican | 13 | 2.0% |
| Pennsylvania German | 1 | 0.2% |
| Portuguese | 17 | 2.6% |
| Spanish | 6 | 0.9% |
| Yup'ik | 4 | 0.6% | View All 17 Rows |
Immigrants in Point Hope

| Immigration Origin | # Population | % Population | View All 0 Rows |
Sex and Age in Point Hope
Sex and Age in Point Hope
The most populous age groups in Point Hope are Under 5 Years (55 | 15.3%) for men and 5 to 9 Years (55 | 19.0%) for women.
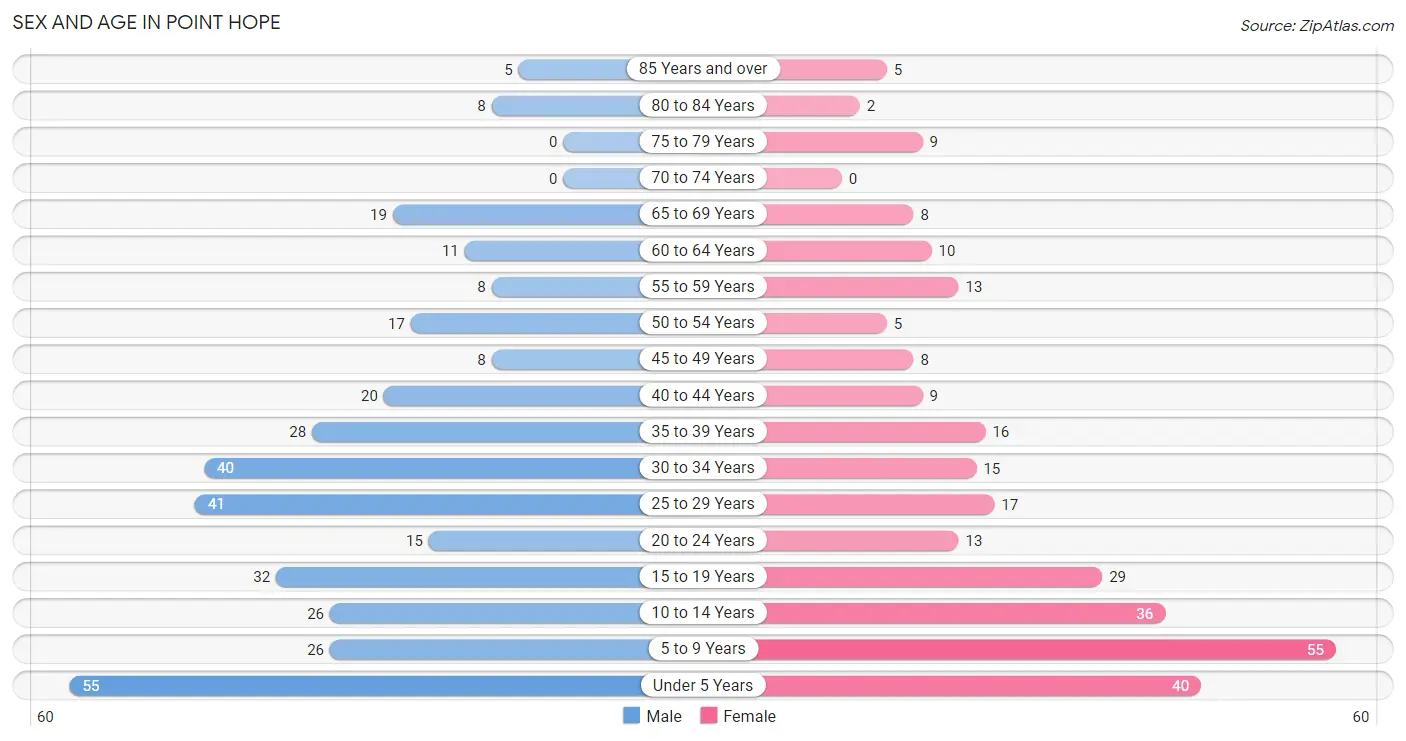
| Age Bracket | Male | Female |
| Under 5 Years | 55 (15.3%) | 40 (13.8%) |
| 5 to 9 Years | 26 (7.2%) | 55 (19.0%) |
| 10 to 14 Years | 26 (7.2%) | 36 (12.4%) |
| 15 to 19 Years | 32 (8.9%) | 29 (10.0%) |
| 20 to 24 Years | 15 (4.2%) | 13 (4.5%) |
| 25 to 29 Years | 41 (11.4%) | 17 (5.9%) |
| 30 to 34 Years | 40 (11.1%) | 15 (5.2%) |
| 35 to 39 Years | 28 (7.8%) | 16 (5.5%) |
| 40 to 44 Years | 20 (5.6%) | 9 (3.1%) |
| 45 to 49 Years | 8 (2.2%) | 8 (2.8%) |
| 50 to 54 Years | 17 (4.7%) | 5 (1.7%) |
| 55 to 59 Years | 8 (2.2%) | 13 (4.5%) |
| 60 to 64 Years | 11 (3.1%) | 10 (3.5%) |
| 65 to 69 Years | 19 (5.3%) | 8 (2.8%) |
| 70 to 74 Years | 0 (0.0%) | 0 (0.0%) |
| 75 to 79 Years | 0 (0.0%) | 9 (3.1%) |
| 80 to 84 Years | 8 (2.2%) | 2 (0.7%) |
| 85 Years and over | 5 (1.4%) | 5 (1.7%) |
| Total | 359 (100.0%) | 290 (100.0%) |
Families and Households in Point Hope
Median Family Size in Point Hope
The median family size in Point Hope is 4.91 persons per family, with single female/mother families (30 | 25.4%) accounting for the largest median family size of 5.8 persons per family. On the other hand, single male/father families (28 | 23.7%) represent the smallest median family size with 2.64 persons per family.
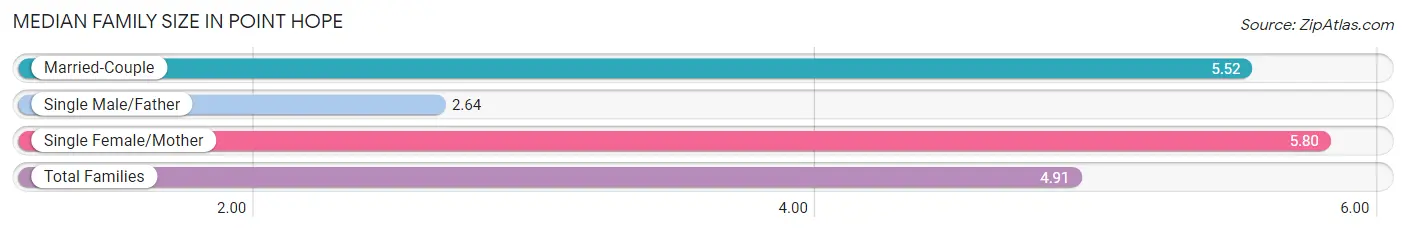
| Family Type | # Families | Family Size |
| Married-Couple | 60 (50.8%) | 5.52 |
| Single Male/Father | 28 (23.7%) | 2.64 |
| Single Female/Mother | 30 (25.4%) | 5.80 |
| Total Families | 118 (100.0%) | 4.91 |
Median Household Size in Point Hope
The median household size in Point Hope is 4.36 persons per household, with single female/mother households (30 | 20.1%) accounting for the largest median household size of 6.3 persons per household. non-family households (31 | 20.8%) represent the smallest median household size with 1.29 persons per household.
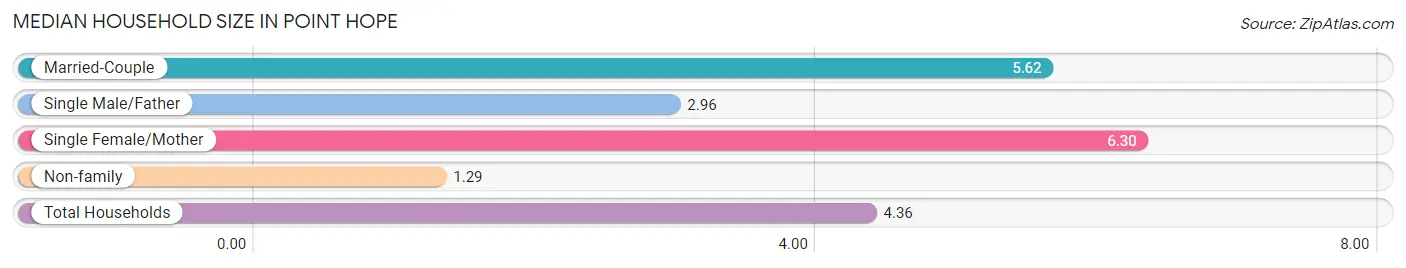
| Household Type | # Households | Household Size |
| Married-Couple | 60 (40.3%) | 5.62 |
| Single Male/Father | 28 (18.8%) | 2.96 |
| Single Female/Mother | 30 (20.1%) | 6.30 |
| Non-family | 31 (20.8%) | 1.29 |
| Total Households | 149 (100.0%) | 4.36 |
Household Size by Marriage Status in Point Hope
Out of a total of 149 households in Point Hope, 118 (79.2%) are family households, while 31 (20.8%) are nonfamily households. The most numerous type of family households are 6-person households, comprising 30, and the most common type of nonfamily households are 1-person households, comprising 23.
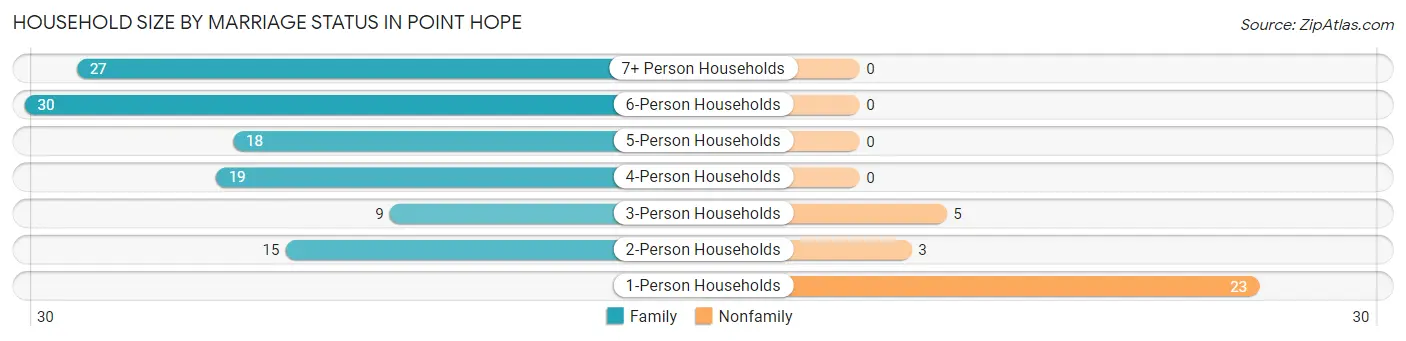
| Household Size | Family Households | Nonfamily Households |
| 1-Person Households | - | 23 (15.4%) |
| 2-Person Households | 15 (10.1%) | 3 (2.0%) |
| 3-Person Households | 9 (6.0%) | 5 (3.4%) |
| 4-Person Households | 19 (12.8%) | 0 (0.0%) |
| 5-Person Households | 18 (12.1%) | 0 (0.0%) |
| 6-Person Households | 30 (20.1%) | 0 (0.0%) |
| 7+ Person Households | 27 (18.1%) | 0 (0.0%) |
| Total | 118 (79.2%) | 31 (20.8%) |
Female Fertility in Point Hope
Fertility by Age in Point Hope
Average fertility rate in Point Hope is 56.0 births per 1,000 women. Women in the age bracket of 20 to 34 years have the highest fertility rate with 133.0 births per 1,000 women. Women in the age bracket of 20 to 34 years acount for 100.0% of all women with births.
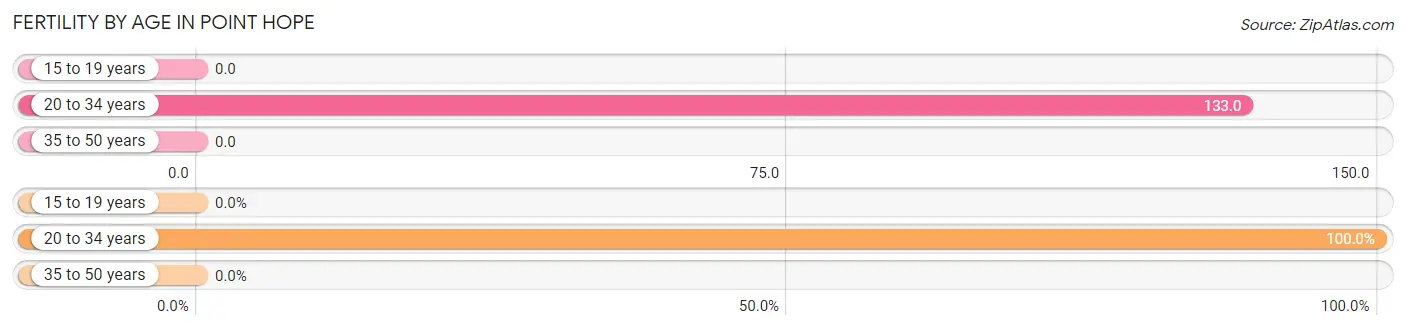
| Age Bracket | Women with Births | Births / 1,000 Women |
| 15 to 19 years | 0 (0.0%) | 0.0 |
| 20 to 34 years | 6 (100.0%) | 133.0 |
| 35 to 50 years | 0 (0.0%) | 0.0 |
| Total | 6 (100.0%) | 56.0 |
Fertility by Age by Marriage Status in Point Hope
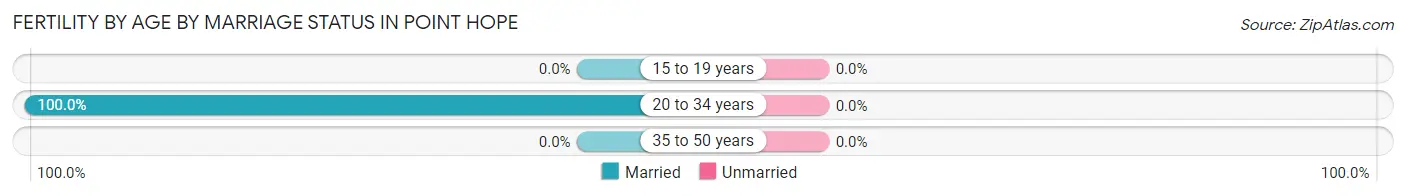
| Age Bracket | Married | Unmarried |
| 15 to 19 years | 0 (0.0%) | 0 (0.0%) |
| 20 to 34 years | 6 (100.0%) | 0 (0.0%) |
| 35 to 50 years | 0 (0.0%) | 0 (0.0%) |
| Total | 6 (100.0%) | 0 (0.0%) |
Fertility by Education in Point Hope
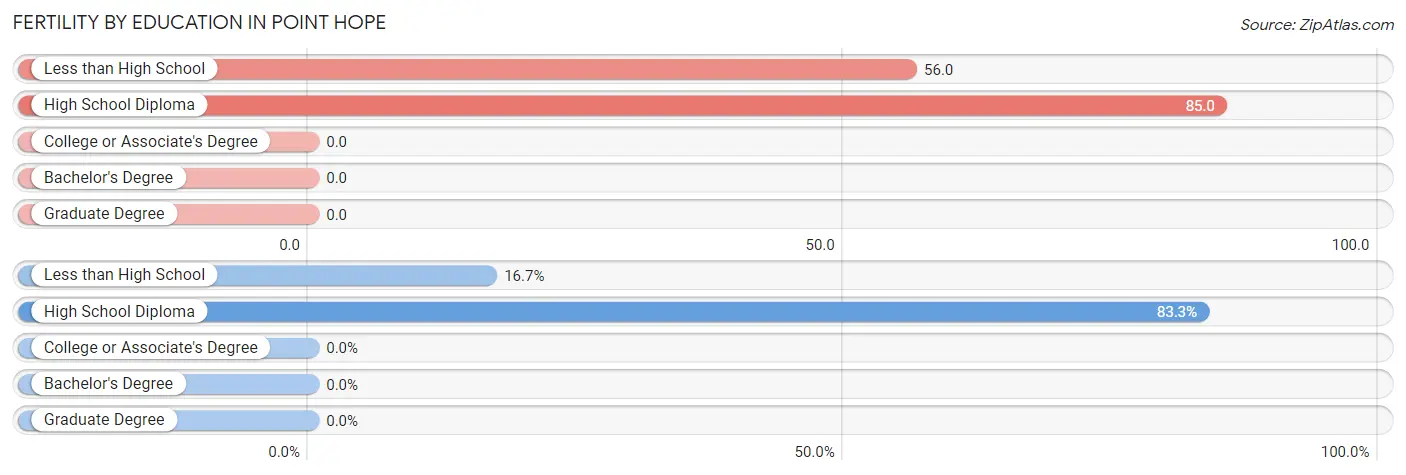
| Educational Attainment | Women with Births | Births / 1,000 Women |
| Less than High School | 1 (16.7%) | 56.0 |
| High School Diploma | 5 (83.3%) | 85.0 |
| College or Associate's Degree | 0 (0.0%) | 0.0 |
| Bachelor's Degree | 0 (0.0%) | 0.0 |
| Graduate Degree | 0 (0.0%) | 0.0 |
| Total | 6 (100.0%) | 56.0 |
Fertility by Education by Marriage Status in Point Hope
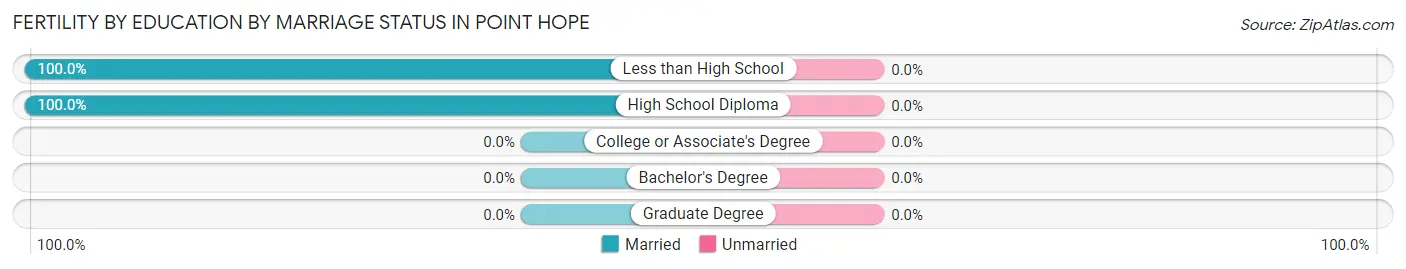
| Educational Attainment | Married | Unmarried |
| Less than High School | 1 (100.0%) | 0 (0.0%) |
| High School Diploma | 5 (100.0%) | 0 (0.0%) |
| College or Associate's Degree | 0 (0.0%) | 0 (0.0%) |
| Bachelor's Degree | 0 (0.0%) | 0 (0.0%) |
| Graduate Degree | 0 (0.0%) | 0 (0.0%) |
| Total | 6 (100.0%) | 0 (0.0%) |
Employment Characteristics in Point Hope
Employment by Class of Employer in Point Hope
Among the 143 employed individuals in Point Hope, local government employees (65 | 45.5%), private company employees (56 | 39.2%), and not-for-profit organizations (9 | 6.3%) make up the most common classes of employment.
| Employer Class | # Employees | % Employees |
| Private Company Employees | 56 | 39.2% |
| Self-Employed (Incorporated) | 0 | 0.0% |
| Self-Employed (Not Incorporated) | 4 | 2.8% |
| Not-for-profit Organizations | 9 | 6.3% |
| Local Government Employees | 65 | 45.5% |
| State Government Employees | 6 | 4.2% |
| Federal Government Employees | 3 | 2.1% |
| Unpaid Family Workers | 0 | 0.0% |
| Total | 143 | 100.0% |
Employment Status by Age in Point Hope
According to the labor force statistics for Point Hope, out of the total population over 16 years of age (391), 50.4% or 197 individuals are in the labor force, with 27.4% or 54 of them unemployed. The age group with the highest labor force participation rate is 45 to 54 years, with 89.5% or 34 individuals in the labor force. Within the labor force, the 20 to 24 years age range has the highest percentage of unemployed individuals, with 72.2% or 13 of them being unemployed.
| Age Bracket | In Labor Force | Unemployed |
| 16 to 19 Years | 2 (4.9%) | 1 (50.0%) |
| 20 to 24 Years | 18 (64.3%) | 13 (72.2%) |
| 25 to 29 Years | 40 (69.0%) | 22 (55.0%) |
| 30 to 34 Years | 33 (60.0%) | 6 (18.2%) |
| 35 to 44 Years | 47 (64.4%) | 4 (8.5%) |
| 45 to 54 Years | 34 (89.5%) | 3 (8.8%) |
| 55 to 59 Years | 15 (71.4%) | 1 (6.7%) |
| 60 to 64 Years | 7 (33.3%) | 4 (57.1%) |
| 65 to 74 Years | 1 (3.7%) | 0 (0.0%) |
| 75 Years and over | 0 (0.0%) | 0 (0.0%) |
| Total | 197 (50.4%) | 54 (27.4%) |
Employment Status by Educational Attainment in Point Hope
According to labor force statistics for Point Hope, 66.2% of individuals (176) out of the total population between 25 and 64 years of age (266) are in the labor force, with 22.7% or 40 of them being unemployed. The group with the highest labor force participation rate are those with the educational attainment of college / associate degree, with 78.0% or 71 individuals in the labor force. Within the labor force, individuals with high school diploma education have the highest percentage of unemployment, with 29.5% or 23 of them being unemployed.
| Educational Attainment | In Labor Force | Unemployed |
| Less than High School | 23 (54.8%) | 9 (21.7%) |
| High School Diploma | 78 (61.9%) | 37 (29.5%) |
| College / Associate Degree | 71 (78.0%) | 15 (16.9%) |
| Bachelor's Degree or higher | 4 (57.1%) | 0 (0.0%) |
| Total | 176 (66.2%) | 60 (22.7%) |
Employment Occupations by Sex in Point Hope
Management, Business, Science and Arts Occupations
The most common Management, Business, Science and Arts occupations in Point Hope are Community & Social Service (14 | 9.8%), Education Instruction & Library (12 | 8.4%), Management (6 | 4.2%), Business & Financial (3 | 2.1%), and Education, Arts & Media (2 | 1.4%).
Management, Business, Science and Arts Occupations by Sex
Within the Management, Business, Science and Arts occupations in Point Hope, the most male-oriented occupations are Business & Financial (100.0%), Community & Social Service (50.0%), and Education, Arts & Media (50.0%), while the most female-oriented occupations are Management (83.3%), Community & Social Service (50.0%), and Education, Arts & Media (50.0%).
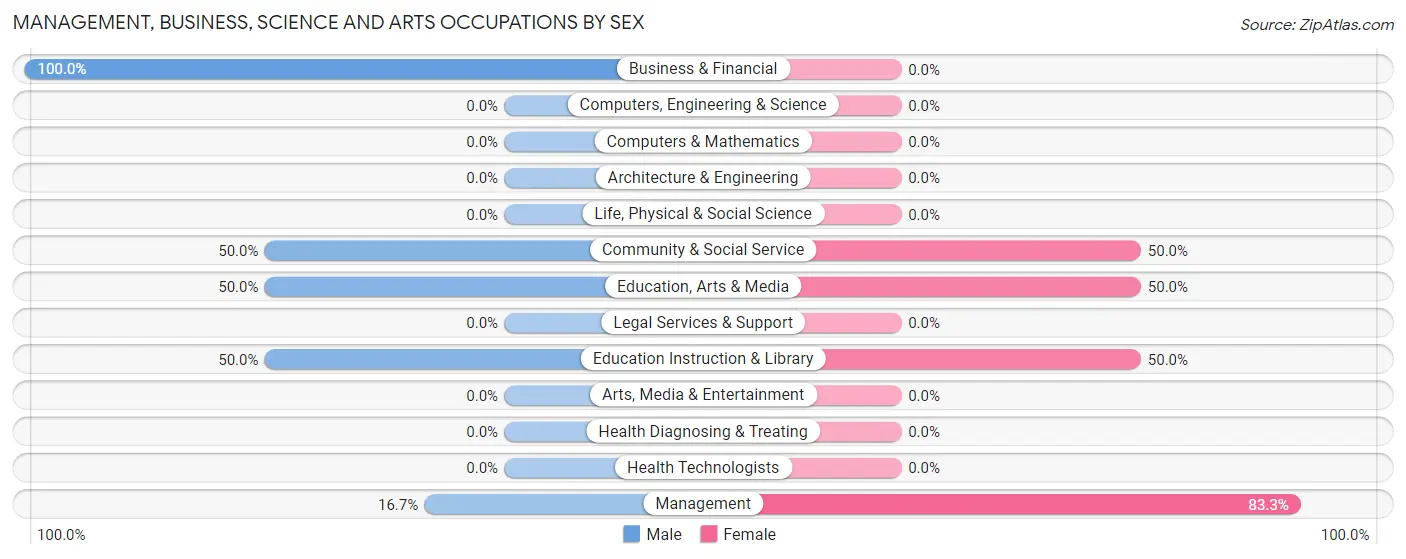
| Occupation | Male | Female |
| Management | 1 (16.7%) | 5 (83.3%) |
| Business & Financial | 3 (100.0%) | 0 (0.0%) |
| Computers, Engineering & Science | 0 (0.0%) | 0 (0.0%) |
| Computers & Mathematics | 0 (0.0%) | 0 (0.0%) |
| Architecture & Engineering | 0 (0.0%) | 0 (0.0%) |
| Life, Physical & Social Science | 0 (0.0%) | 0 (0.0%) |
| Community & Social Service | 7 (50.0%) | 7 (50.0%) |
| Education, Arts & Media | 1 (50.0%) | 1 (50.0%) |
| Legal Services & Support | 0 (0.0%) | 0 (0.0%) |
| Education Instruction & Library | 6 (50.0%) | 6 (50.0%) |
| Arts, Media & Entertainment | 0 (0.0%) | 0 (0.0%) |
| Health Diagnosing & Treating | 0 (0.0%) | 0 (0.0%) |
| Health Technologists | 0 (0.0%) | 0 (0.0%) |
| Total (Category) | 11 (47.8%) | 12 (52.2%) |
| Total (Overall) | 103 (72.0%) | 40 (28.0%) |
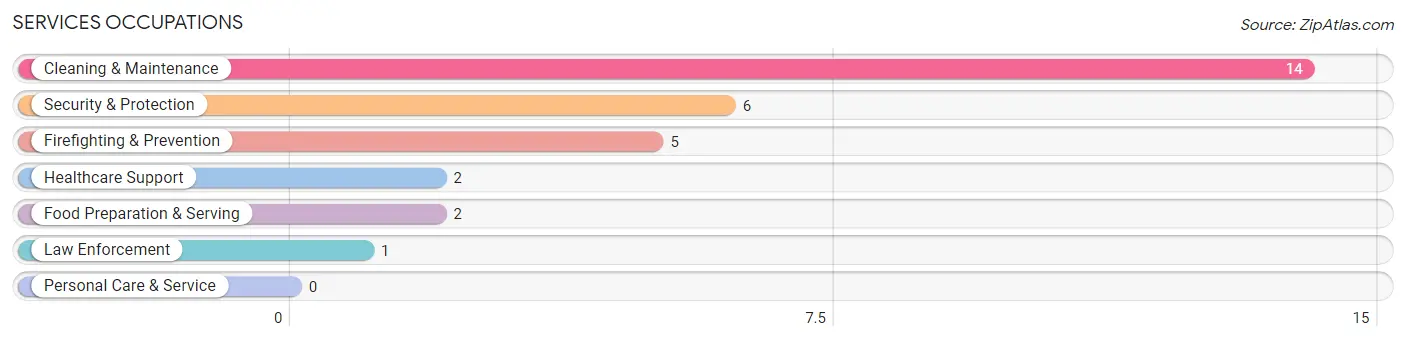
Services Occupations
The most common Services occupations in Point Hope are Cleaning & Maintenance (14 | 9.8%), Security & Protection (6 | 4.2%), Firefighting & Prevention (5 | 3.5%), Healthcare Support (2 | 1.4%), and Food Preparation & Serving (2 | 1.4%).
Services Occupations by Sex
Within the Services occupations in Point Hope, the most male-oriented occupations are Security & Protection (100.0%), Firefighting & Prevention (100.0%), and Law Enforcement (100.0%), while the most female-oriented occupations are Healthcare Support (100.0%), Food Preparation & Serving (100.0%), and Cleaning & Maintenance (21.4%).
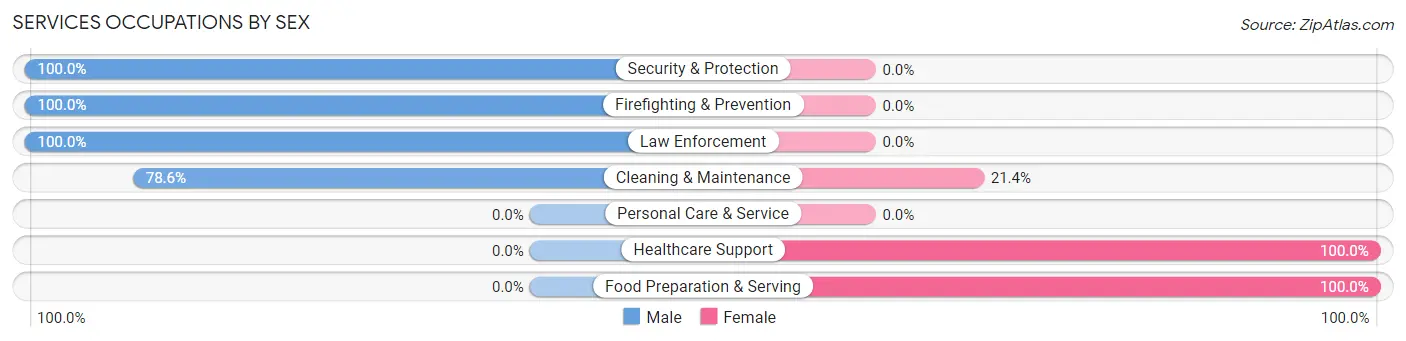
| Occupation | Male | Female |
| Healthcare Support | 0 (0.0%) | 2 (100.0%) |
| Security & Protection | 6 (100.0%) | 0 (0.0%) |
| Firefighting & Prevention | 5 (100.0%) | 0 (0.0%) |
| Law Enforcement | 1 (100.0%) | 0 (0.0%) |
| Food Preparation & Serving | 0 (0.0%) | 2 (100.0%) |
| Cleaning & Maintenance | 11 (78.6%) | 3 (21.4%) |
| Personal Care & Service | 0 (0.0%) | 0 (0.0%) |
| Total (Category) | 17 (70.8%) | 7 (29.2%) |
| Total (Overall) | 103 (72.0%) | 40 (28.0%) |
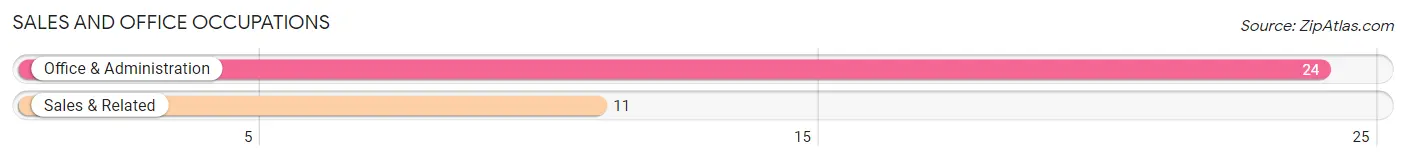
Sales and Office Occupations
The most common Sales and Office occupations in Point Hope are Office & Administration (24 | 16.8%), and Sales & Related (11 | 7.7%).
Sales and Office Occupations by Sex
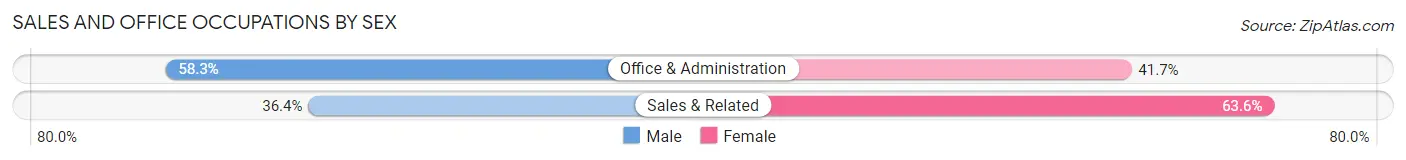
| Occupation | Male | Female |
| Sales & Related | 4 (36.4%) | 7 (63.6%) |
| Office & Administration | 14 (58.3%) | 10 (41.7%) |
| Total (Category) | 18 (51.4%) | 17 (48.6%) |
| Total (Overall) | 103 (72.0%) | 40 (28.0%) |
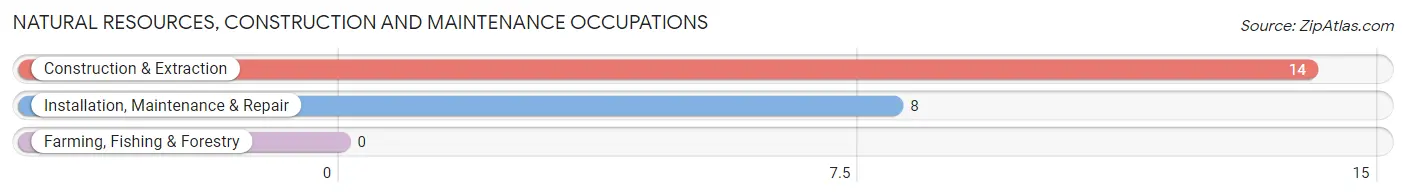
Natural Resources, Construction and Maintenance Occupations
The most common Natural Resources, Construction and Maintenance occupations in Point Hope are Construction & Extraction (14 | 9.8%), and Installation, Maintenance & Repair (8 | 5.6%).
Natural Resources, Construction and Maintenance Occupations by Sex
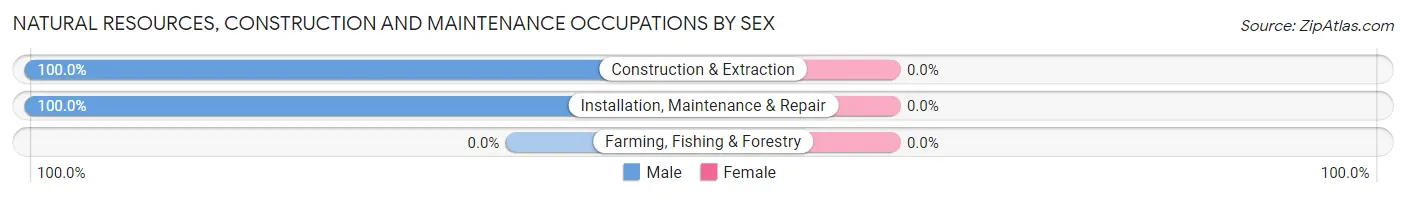
| Occupation | Male | Female |
| Farming, Fishing & Forestry | 0 (0.0%) | 0 (0.0%) |
| Construction & Extraction | 14 (100.0%) | 0 (0.0%) |
| Installation, Maintenance & Repair | 8 (100.0%) | 0 (0.0%) |
| Total (Category) | 22 (100.0%) | 0 (0.0%) |
| Total (Overall) | 103 (72.0%) | 40 (28.0%) |
Production, Transportation and Moving Occupations
The most common Production, Transportation and Moving occupations in Point Hope are Transportation (18 | 12.6%), Material Moving (12 | 8.4%), and Production (9 | 6.3%).
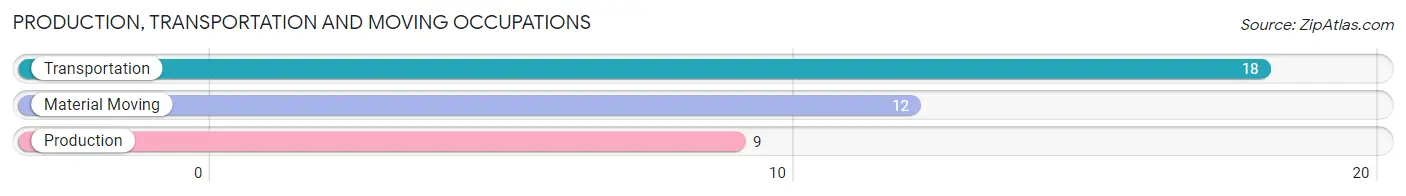
Production, Transportation and Moving Occupations by Sex
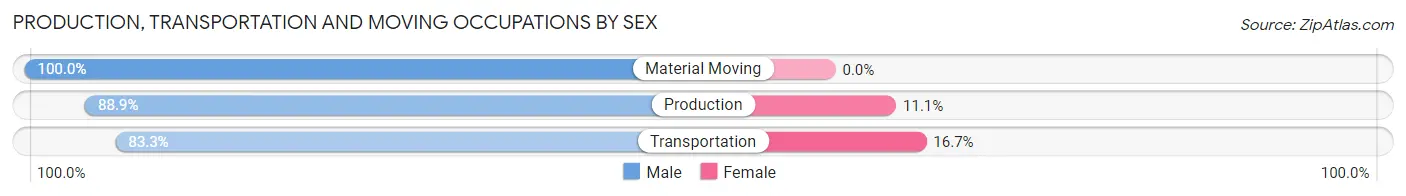
| Occupation | Male | Female |
| Production | 8 (88.9%) | 1 (11.1%) |
| Transportation | 15 (83.3%) | 3 (16.7%) |
| Material Moving | 12 (100.0%) | 0 (0.0%) |
| Total (Category) | 35 (89.7%) | 4 (10.3%) |
| Total (Overall) | 103 (72.0%) | 40 (28.0%) |
Employment Industries by Sex in Point Hope
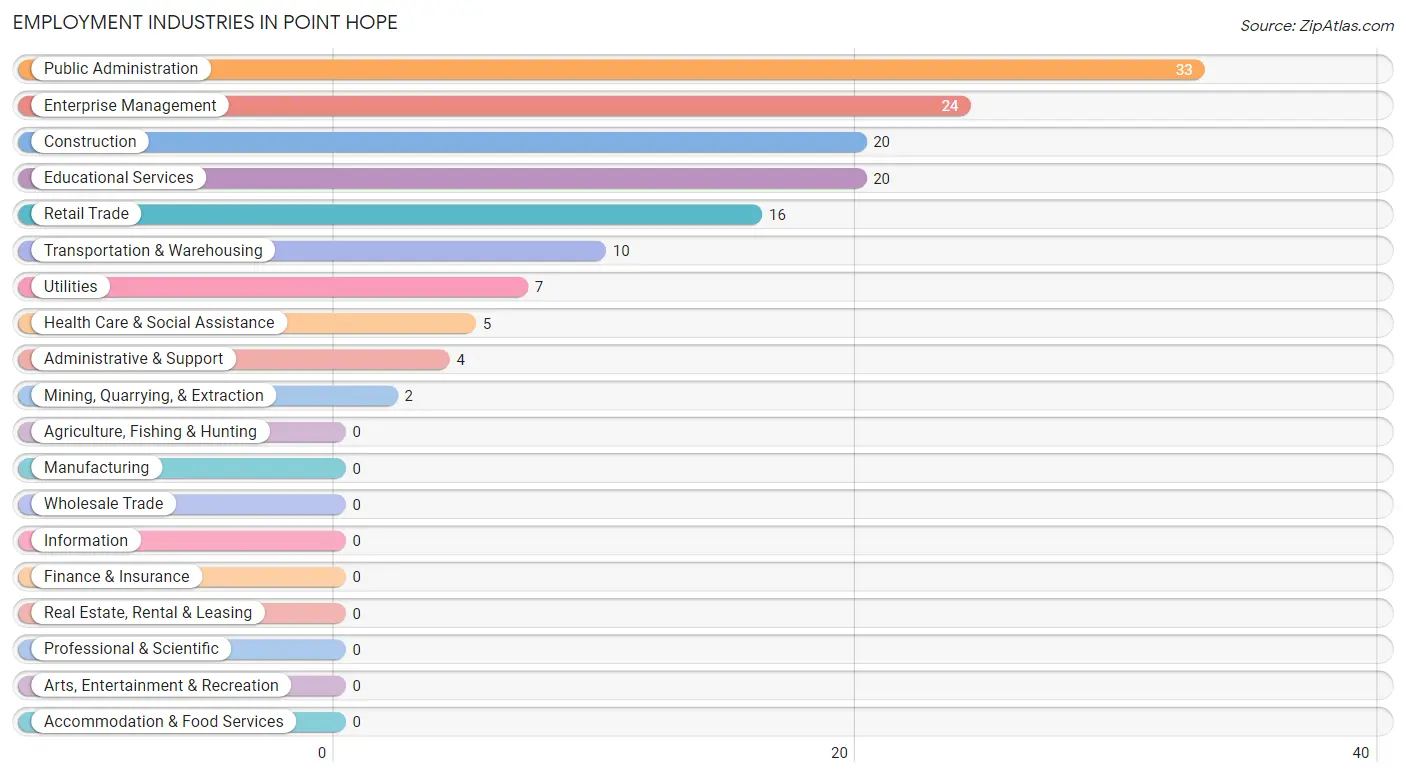
Employment Industries in Point Hope
The major employment industries in Point Hope include Public Administration (33 | 23.1%), Enterprise Management (24 | 16.8%), Construction (20 | 14.0%), Educational Services (20 | 14.0%), and Retail Trade (16 | 11.2%).
Employment Industries by Sex in Point Hope
The Point Hope industries that see more men than women are Mining, Quarrying, & Extraction (100.0%), Utilities (100.0%), and Administrative & Support (100.0%), whereas the industries that tend to have a higher number of women are Health Care & Social Assistance (100.0%), Retail Trade (62.5%), and Educational Services (40.0%).
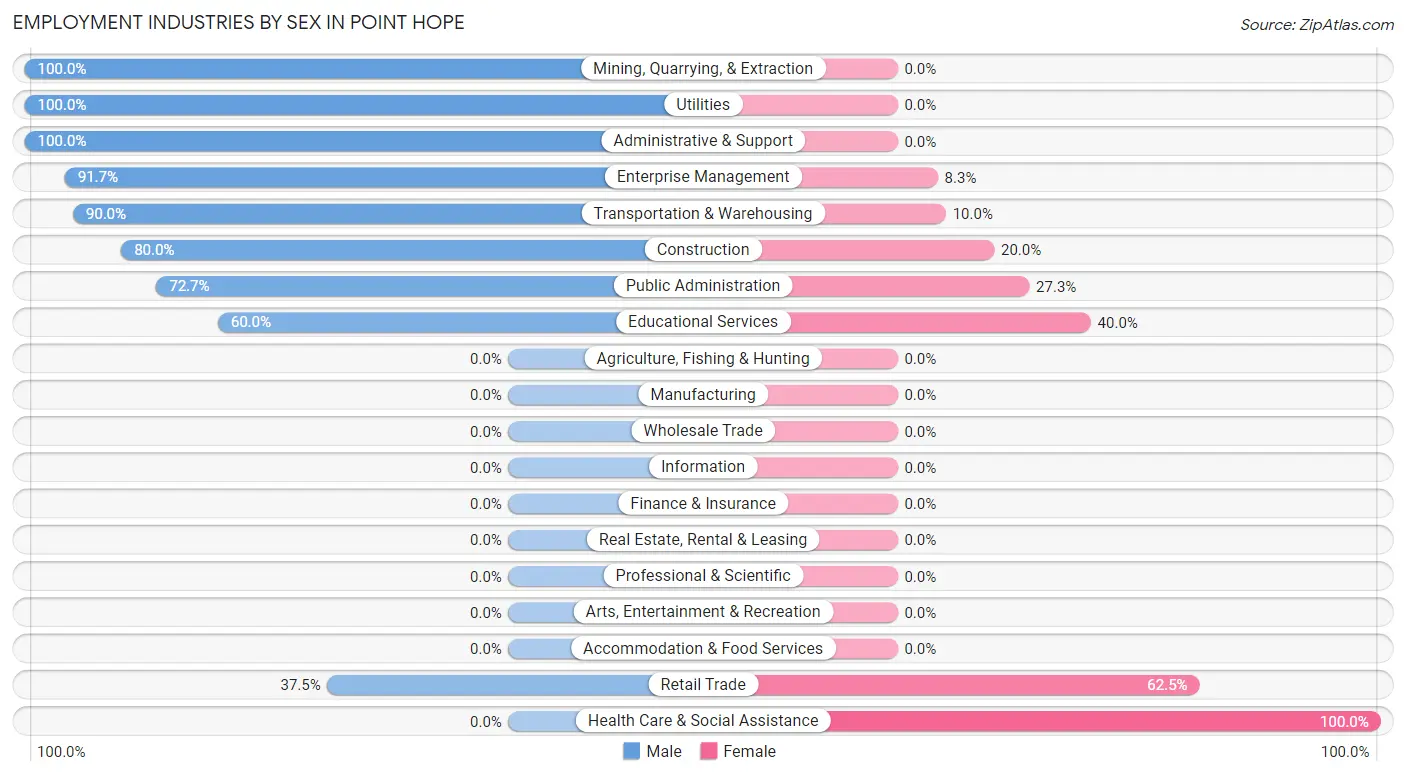
| Industry | Male | Female |
| Agriculture, Fishing & Hunting | 0 (0.0%) | 0 (0.0%) |
| Mining, Quarrying, & Extraction | 2 (100.0%) | 0 (0.0%) |
| Construction | 16 (80.0%) | 4 (20.0%) |
| Manufacturing | 0 (0.0%) | 0 (0.0%) |
| Wholesale Trade | 0 (0.0%) | 0 (0.0%) |
| Retail Trade | 6 (37.5%) | 10 (62.5%) |
| Transportation & Warehousing | 9 (90.0%) | 1 (10.0%) |
| Utilities | 7 (100.0%) | 0 (0.0%) |
| Information | 0 (0.0%) | 0 (0.0%) |
| Finance & Insurance | 0 (0.0%) | 0 (0.0%) |
| Real Estate, Rental & Leasing | 0 (0.0%) | 0 (0.0%) |
| Professional & Scientific | 0 (0.0%) | 0 (0.0%) |
| Enterprise Management | 22 (91.7%) | 2 (8.3%) |
| Administrative & Support | 4 (100.0%) | 0 (0.0%) |
| Educational Services | 12 (60.0%) | 8 (40.0%) |
| Health Care & Social Assistance | 0 (0.0%) | 5 (100.0%) |
| Arts, Entertainment & Recreation | 0 (0.0%) | 0 (0.0%) |
| Accommodation & Food Services | 0 (0.0%) | 0 (0.0%) |
| Public Administration | 24 (72.7%) | 9 (27.3%) |
| Total | 103 (72.0%) | 40 (28.0%) |
Education in Point Hope
School Enrollment in Point Hope
The most common levels of schooling among the 227 students in Point Hope are elementary school (72 | 31.7%), high school (48 | 21.1%), and middle school (47 | 20.7%).
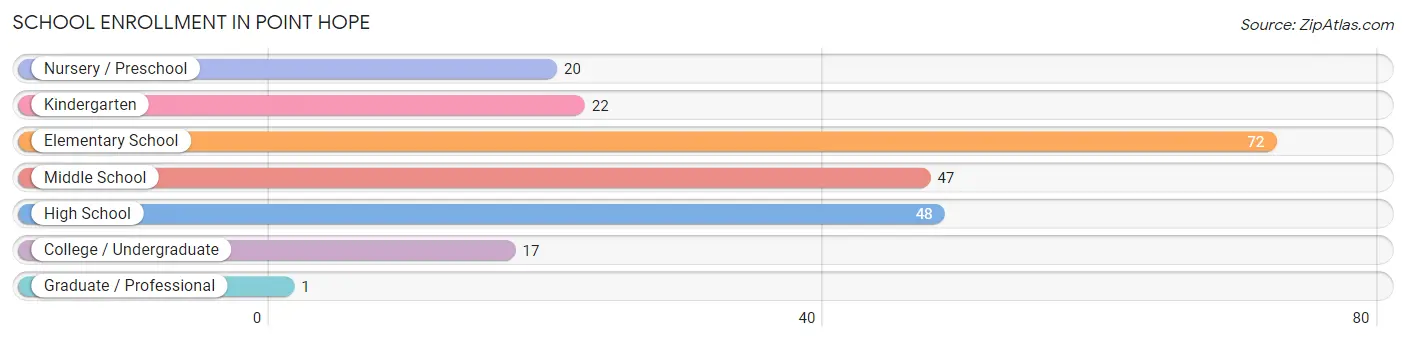
| School Level | # Students | % Students |
| Nursery / Preschool | 20 | 8.8% |
| Kindergarten | 22 | 9.7% |
| Elementary School | 72 | 31.7% |
| Middle School | 47 | 20.7% |
| High School | 48 | 21.1% |
| College / Undergraduate | 17 | 7.5% |
| Graduate / Professional | 1 | 0.4% |
| Total | 227 | 100.0% |
School Enrollment by Age by Funding Source in Point Hope
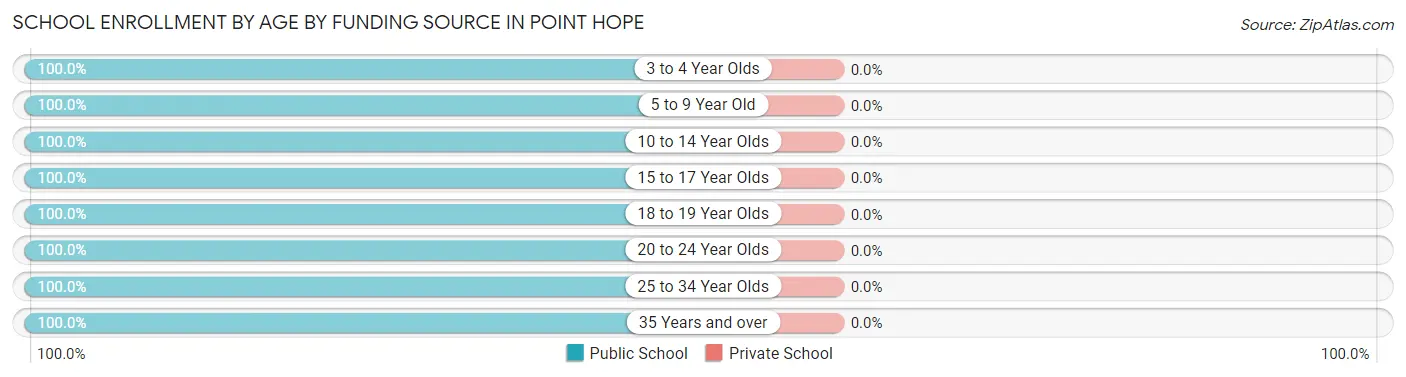
| Age Bracket | Public School | Private School |
| 3 to 4 Year Olds | 24 (100.0%) | 0 (0.0%) |
| 5 to 9 Year Old | 81 (100.0%) | 0 (0.0%) |
| 10 to 14 Year Olds | 62 (100.0%) | 0 (0.0%) |
| 15 to 17 Year Olds | 35 (100.0%) | 0 (0.0%) |
| 18 to 19 Year Olds | 3 (100.0%) | 0 (0.0%) |
| 20 to 24 Year Olds | 10 (100.0%) | 0 (0.0%) |
| 25 to 34 Year Olds | 9 (100.0%) | 0 (0.0%) |
| 35 Years and over | 3 (100.0%) | 0 (0.0%) |
| Total | 227 (100.0%) | 0 (0.0%) |
Educational Attainment by Field of Study in Point Hope
Education (11 | 64.7%), psychology (3 | 17.6%), computers & mathematics (1 | 5.9%), physical & health sciences (1 | 5.9%), and liberal arts & history (1 | 5.9%) are the most common fields of study among 17 individuals in Point Hope who have obtained a bachelor's degree or higher.
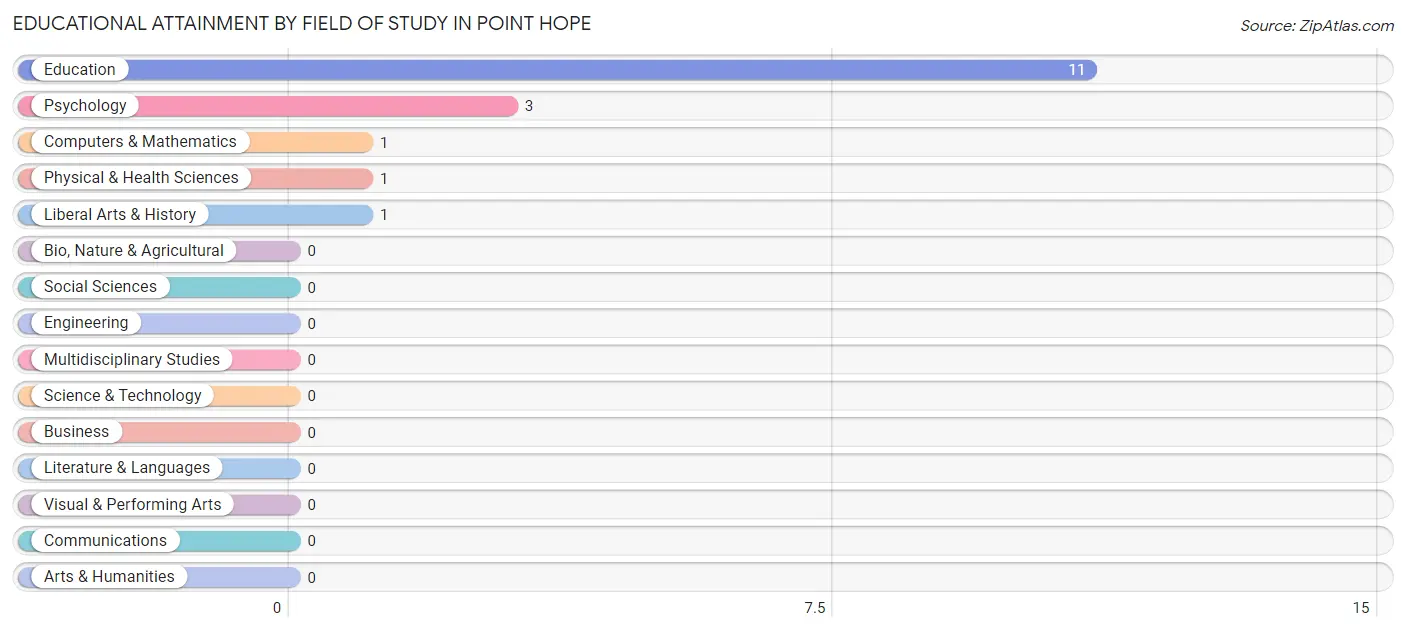
| Field of Study | # Graduates | % Graduates |
| Computers & Mathematics | 1 | 5.9% |
| Bio, Nature & Agricultural | 0 | 0.0% |
| Physical & Health Sciences | 1 | 5.9% |
| Psychology | 3 | 17.6% |
| Social Sciences | 0 | 0.0% |
| Engineering | 0 | 0.0% |
| Multidisciplinary Studies | 0 | 0.0% |
| Science & Technology | 0 | 0.0% |
| Business | 0 | 0.0% |
| Education | 11 | 64.7% |
| Literature & Languages | 0 | 0.0% |
| Liberal Arts & History | 1 | 5.9% |
| Visual & Performing Arts | 0 | 0.0% |
| Communications | 0 | 0.0% |
| Arts & Humanities | 0 | 0.0% |
| Total | 17 | 100.0% |
Transportation & Commute in Point Hope
Vehicle Availability by Sex in Point Hope
The most prevalent vehicle ownership categories in Point Hope are males with no vehicle (66, accounting for 64.1%) and females with no vehicle (26, making up 165.0%).
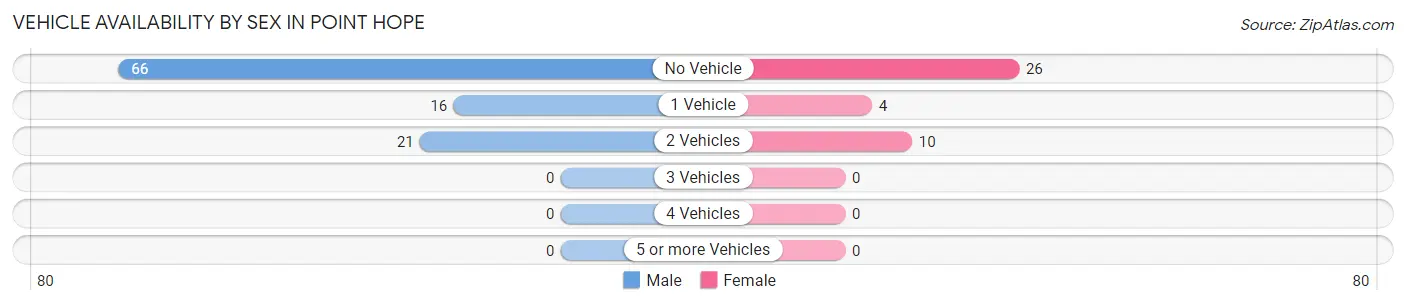
| Vehicles Available | Male | Female |
| No Vehicle | 66 (64.1%) | 26 (65.0%) |
| 1 Vehicle | 16 (15.5%) | 4 (10.0%) |
| 2 Vehicles | 21 (20.4%) | 10 (25.0%) |
| 3 Vehicles | 0 (0.0%) | 0 (0.0%) |
| 4 Vehicles | 0 (0.0%) | 0 (0.0%) |
| 5 or more Vehicles | 0 (0.0%) | 0 (0.0%) |
| Total | 103 (100.0%) | 40 (100.0%) |
Commute Time in Point Hope
The most frequently occuring commute durations in Point Hope are less than 5 minutes (95 commuters, 68.8%), 5 to 9 minutes (38 commuters, 27.5%), and 10 to 14 minutes (4 commuters, 2.9%).
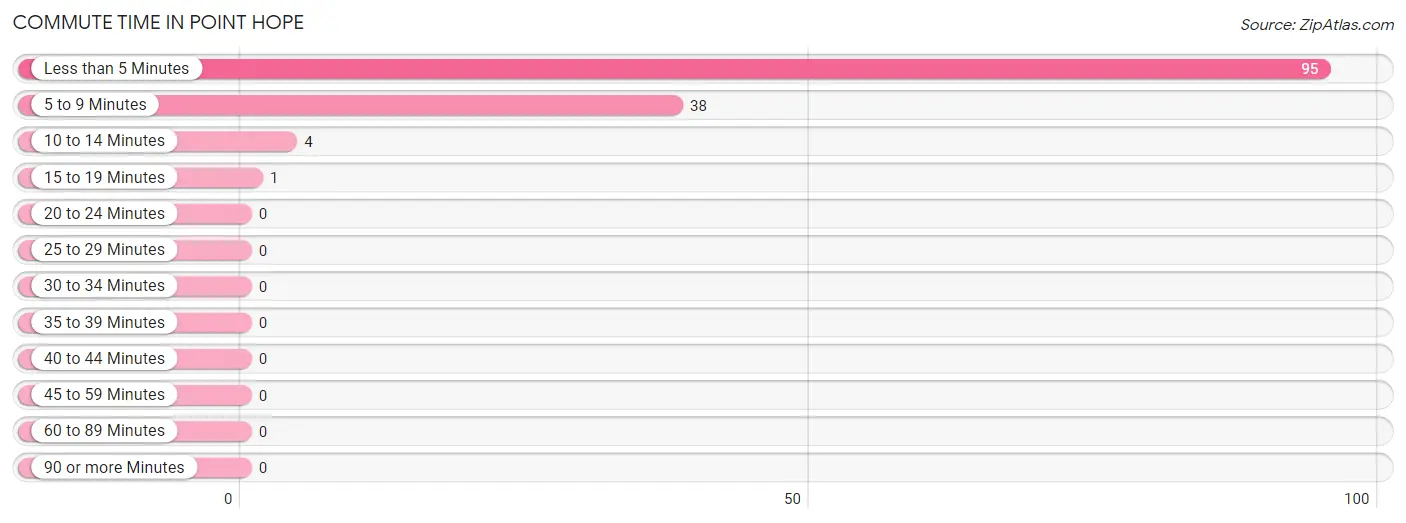
| Commute Time | # Commuters | % Commuters |
| Less than 5 Minutes | 95 | 68.8% |
| 5 to 9 Minutes | 38 | 27.5% |
| 10 to 14 Minutes | 4 | 2.9% |
| 15 to 19 Minutes | 1 | 0.7% |
| 20 to 24 Minutes | 0 | 0.0% |
| 25 to 29 Minutes | 0 | 0.0% |
| 30 to 34 Minutes | 0 | 0.0% |
| 35 to 39 Minutes | 0 | 0.0% |
| 40 to 44 Minutes | 0 | 0.0% |
| 45 to 59 Minutes | 0 | 0.0% |
| 60 to 89 Minutes | 0 | 0.0% |
| 90 or more Minutes | 0 | 0.0% |
Commute Time by Sex in Point Hope
The most common commute times in Point Hope are less than 5 minutes (69 commuters, 69.0%) for males and less than 5 minutes (26 commuters, 68.4%) for females.
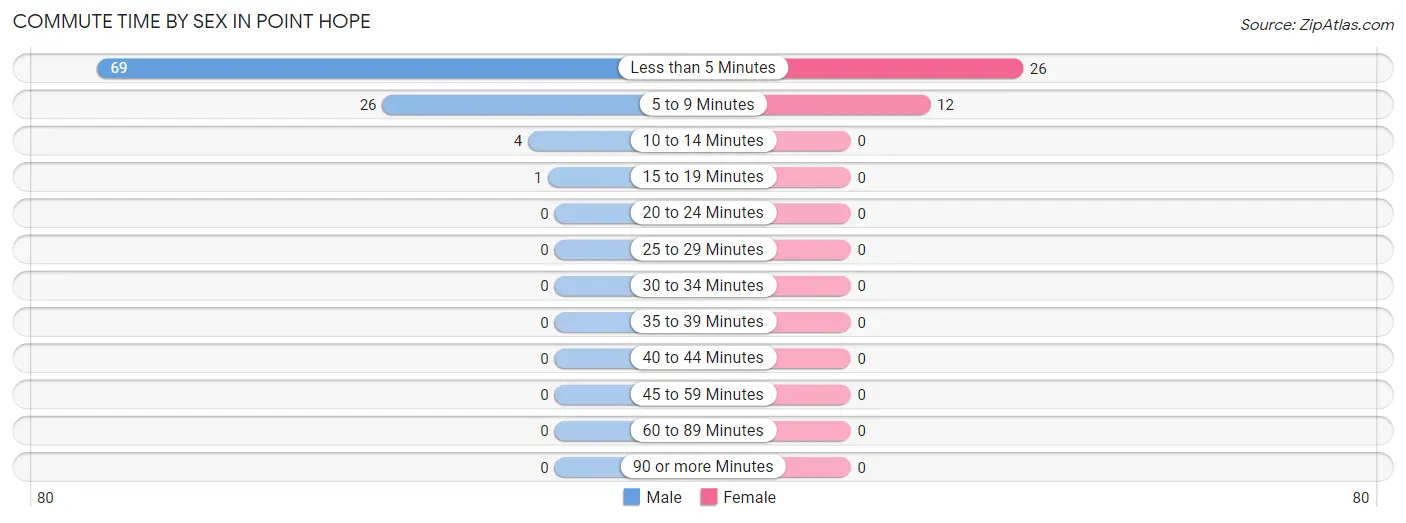
| Commute Time | Male | Female |
| Less than 5 Minutes | 69 (69.0%) | 26 (68.4%) |
| 5 to 9 Minutes | 26 (26.0%) | 12 (31.6%) |
| 10 to 14 Minutes | 4 (4.0%) | 0 (0.0%) |
| 15 to 19 Minutes | 1 (1.0%) | 0 (0.0%) |
| 20 to 24 Minutes | 0 (0.0%) | 0 (0.0%) |
| 25 to 29 Minutes | 0 (0.0%) | 0 (0.0%) |
| 30 to 34 Minutes | 0 (0.0%) | 0 (0.0%) |
| 35 to 39 Minutes | 0 (0.0%) | 0 (0.0%) |
| 40 to 44 Minutes | 0 (0.0%) | 0 (0.0%) |
| 45 to 59 Minutes | 0 (0.0%) | 0 (0.0%) |
| 60 to 89 Minutes | 0 (0.0%) | 0 (0.0%) |
| 90 or more Minutes | 0 (0.0%) | 0 (0.0%) |
Time of Departure to Work by Sex in Point Hope
The most frequent times of departure to work in Point Hope are 8:00 AM to 8:29 AM (34, 34.0%) for males and 8:30 AM to 8:59 AM (14, 36.8%) for females.
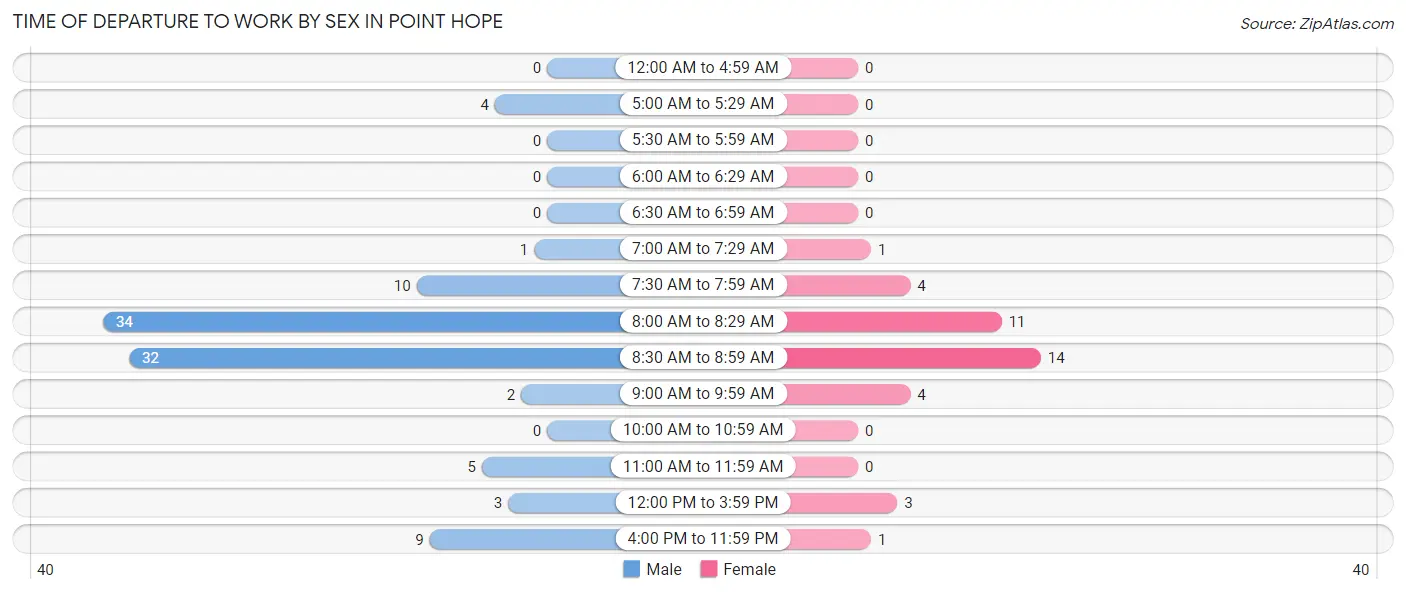
| Time of Departure | Male | Female |
| 12:00 AM to 4:59 AM | 0 (0.0%) | 0 (0.0%) |
| 5:00 AM to 5:29 AM | 4 (4.0%) | 0 (0.0%) |
| 5:30 AM to 5:59 AM | 0 (0.0%) | 0 (0.0%) |
| 6:00 AM to 6:29 AM | 0 (0.0%) | 0 (0.0%) |
| 6:30 AM to 6:59 AM | 0 (0.0%) | 0 (0.0%) |
| 7:00 AM to 7:29 AM | 1 (1.0%) | 1 (2.6%) |
| 7:30 AM to 7:59 AM | 10 (10.0%) | 4 (10.5%) |
| 8:00 AM to 8:29 AM | 34 (34.0%) | 11 (28.9%) |
| 8:30 AM to 8:59 AM | 32 (32.0%) | 14 (36.8%) |
| 9:00 AM to 9:59 AM | 2 (2.0%) | 4 (10.5%) |
| 10:00 AM to 10:59 AM | 0 (0.0%) | 0 (0.0%) |
| 11:00 AM to 11:59 AM | 5 (5.0%) | 0 (0.0%) |
| 12:00 PM to 3:59 PM | 3 (3.0%) | 3 (7.9%) |
| 4:00 PM to 11:59 PM | 9 (9.0%) | 1 (2.6%) |
| Total | 100 (100.0%) | 38 (100.0%) |
Housing Occupancy in Point Hope
Occupancy by Ownership in Point Hope
Of the total 149 dwellings in Point Hope, owner-occupied units account for 103 (69.1%), while renter-occupied units make up 46 (30.9%).
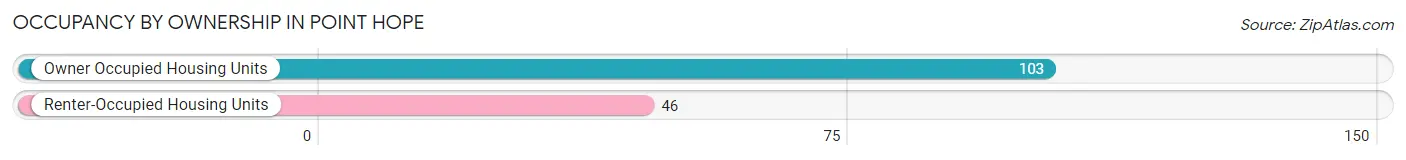
| Occupancy | # Housing Units | % Housing Units |
| Owner Occupied Housing Units | 103 | 69.1% |
| Renter-Occupied Housing Units | 46 | 30.9% |
| Total Occupied Housing Units | 149 | 100.0% |
Occupancy by Household Size in Point Hope
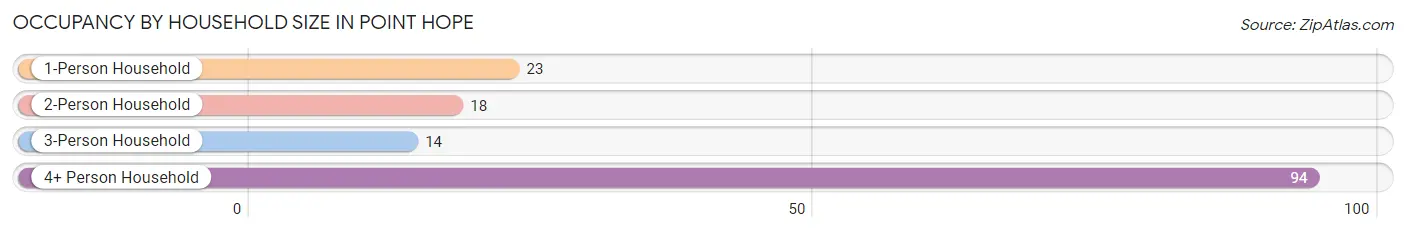
| Household Size | # Housing Units | % Housing Units |
| 1-Person Household | 23 | 15.4% |
| 2-Person Household | 18 | 12.1% |
| 3-Person Household | 14 | 9.4% |
| 4+ Person Household | 94 | 63.1% |
| Total Housing Units | 149 | 100.0% |
Occupancy by Ownership by Household Size in Point Hope
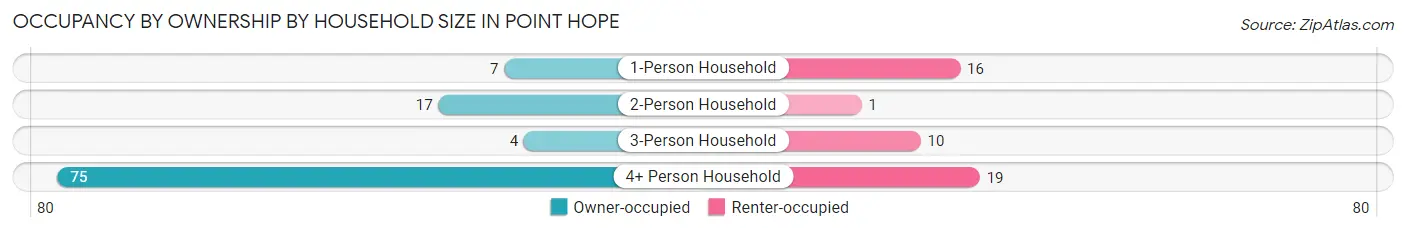
| Household Size | Owner-occupied | Renter-occupied |
| 1-Person Household | 7 (30.4%) | 16 (69.6%) |
| 2-Person Household | 17 (94.4%) | 1 (5.6%) |
| 3-Person Household | 4 (28.6%) | 10 (71.4%) |
| 4+ Person Household | 75 (79.8%) | 19 (20.2%) |
| Total Housing Units | 103 (69.1%) | 46 (30.9%) |
Occupancy by Educational Attainment in Point Hope
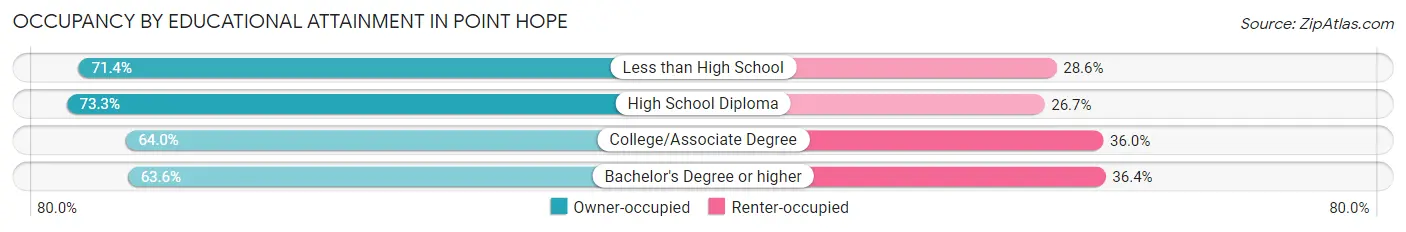
| Household Size | Owner-occupied | Renter-occupied |
| Less than High School | 20 (71.4%) | 8 (28.6%) |
| High School Diploma | 44 (73.3%) | 16 (26.7%) |
| College/Associate Degree | 32 (64.0%) | 18 (36.0%) |
| Bachelor's Degree or higher | 7 (63.6%) | 4 (36.4%) |
Occupancy by Age of Householder in Point Hope
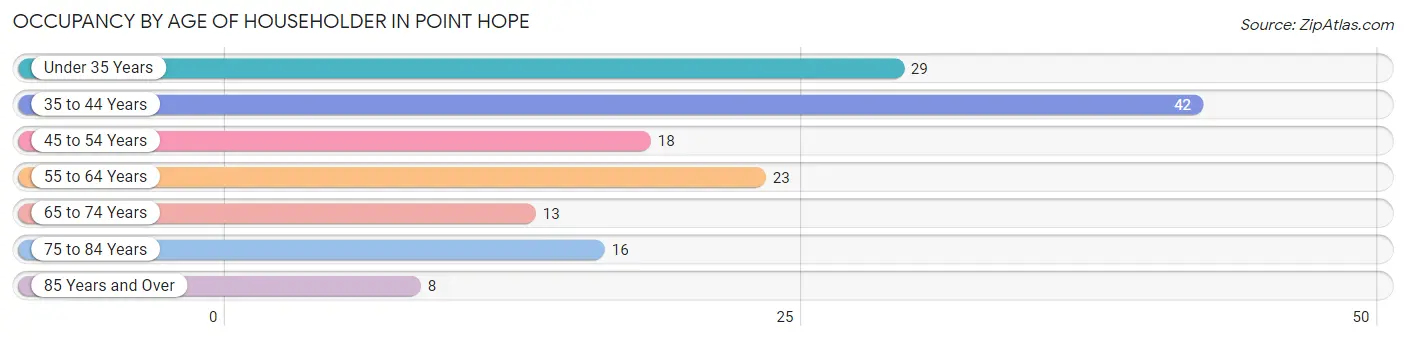
| Age Bracket | # Households | % Households |
| Under 35 Years | 29 | 19.5% |
| 35 to 44 Years | 42 | 28.2% |
| 45 to 54 Years | 18 | 12.1% |
| 55 to 64 Years | 23 | 15.4% |
| 65 to 74 Years | 13 | 8.7% |
| 75 to 84 Years | 16 | 10.7% |
| 85 Years and Over | 8 | 5.4% |
| Total | 149 | 100.0% |
Housing Finances in Point Hope
Median Income by Occupancy in Point Hope
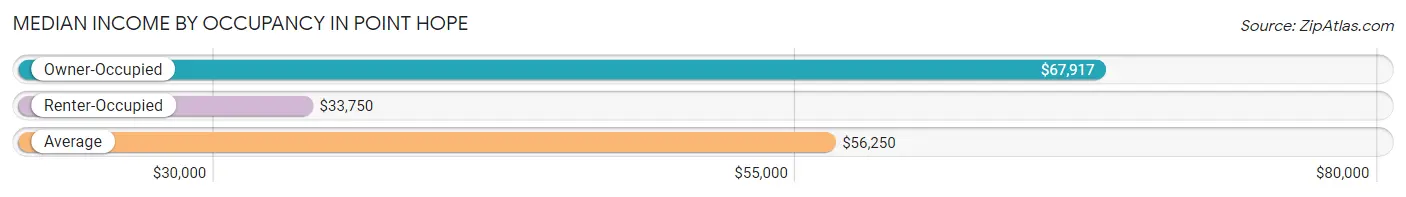
| Occupancy Type | # Households | Median Income |
| Owner-Occupied | 103 (69.1%) | $67,917 |
| Renter-Occupied | 46 (30.9%) | $33,750 |
| Average | 149 (100.0%) | $56,250 |
Occupancy by Householder Income Bracket in Point Hope
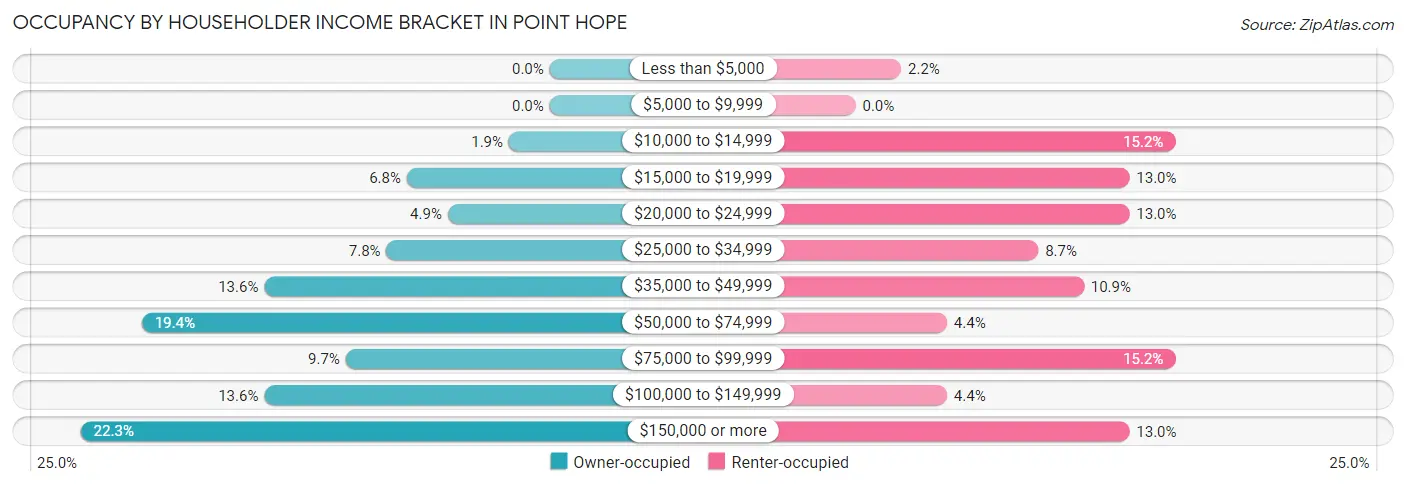
| Income Bracket | Owner-occupied | Renter-occupied |
| Less than $5,000 | 0 (0.0%) | 1 (2.2%) |
| $5,000 to $9,999 | 0 (0.0%) | 0 (0.0%) |
| $10,000 to $14,999 | 2 (1.9%) | 7 (15.2%) |
| $15,000 to $19,999 | 7 (6.8%) | 6 (13.0%) |
| $20,000 to $24,999 | 5 (4.9%) | 6 (13.0%) |
| $25,000 to $34,999 | 8 (7.8%) | 4 (8.7%) |
| $35,000 to $49,999 | 14 (13.6%) | 5 (10.9%) |
| $50,000 to $74,999 | 20 (19.4%) | 2 (4.3%) |
| $75,000 to $99,999 | 10 (9.7%) | 7 (15.2%) |
| $100,000 to $149,999 | 14 (13.6%) | 2 (4.3%) |
| $150,000 or more | 23 (22.3%) | 6 (13.0%) |
| Total | 103 (100.0%) | 46 (100.0%) |
Monthly Housing Cost Tiers in Point Hope
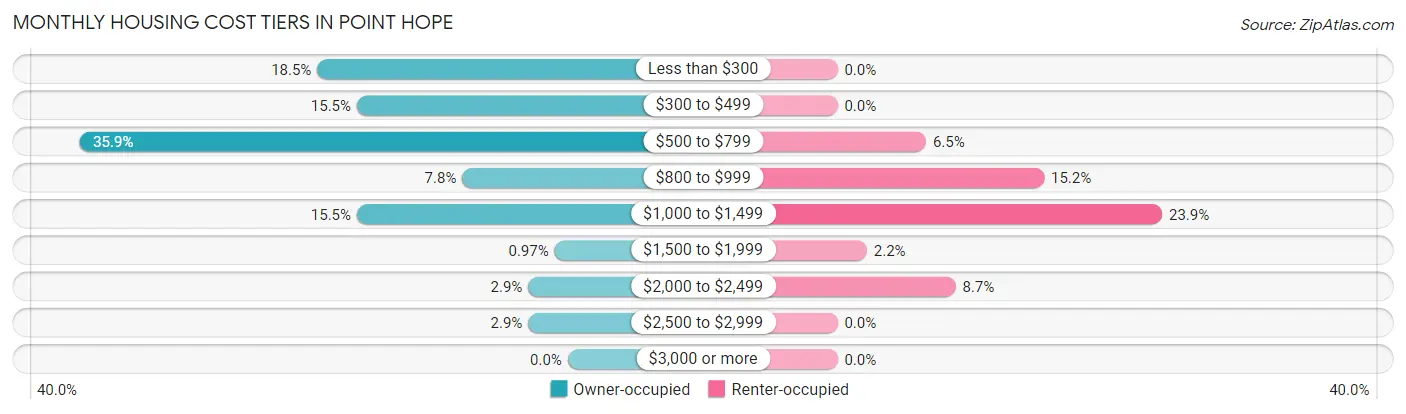
| Monthly Cost | Owner-occupied | Renter-occupied |
| Less than $300 | 19 (18.4%) | 0 (0.0%) |
| $300 to $499 | 16 (15.5%) | 0 (0.0%) |
| $500 to $799 | 37 (35.9%) | 3 (6.5%) |
| $800 to $999 | 8 (7.8%) | 7 (15.2%) |
| $1,000 to $1,499 | 16 (15.5%) | 11 (23.9%) |
| $1,500 to $1,999 | 1 (1.0%) | 1 (2.2%) |
| $2,000 to $2,499 | 3 (2.9%) | 4 (8.7%) |
| $2,500 to $2,999 | 3 (2.9%) | 0 (0.0%) |
| $3,000 or more | 0 (0.0%) | 0 (0.0%) |
| Total | 103 (100.0%) | 46 (100.0%) |
Physical Housing Characteristics in Point Hope
Housing Structures in Point Hope
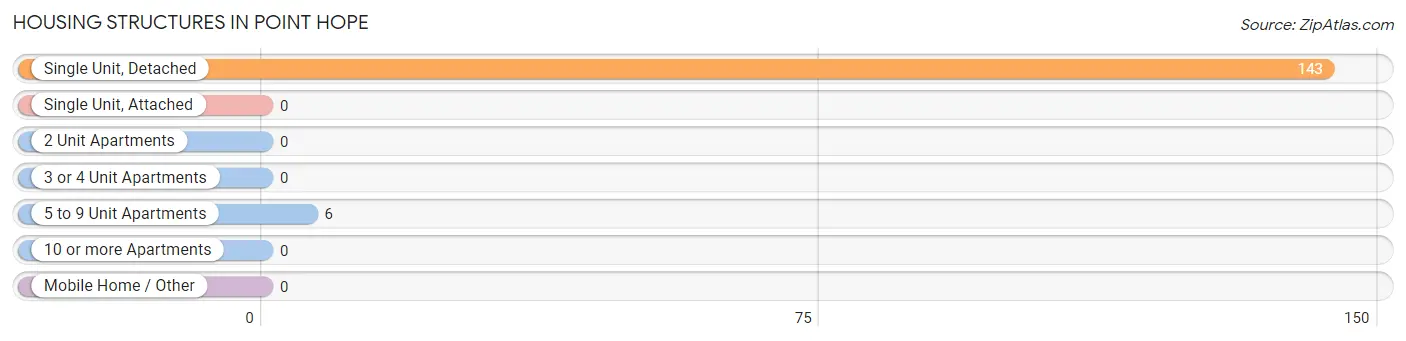
| Structure Type | # Housing Units | % Housing Units |
| Single Unit, Detached | 143 | 96.0% |
| Single Unit, Attached | 0 | 0.0% |
| 2 Unit Apartments | 0 | 0.0% |
| 3 or 4 Unit Apartments | 0 | 0.0% |
| 5 to 9 Unit Apartments | 6 | 4.0% |
| 10 or more Apartments | 0 | 0.0% |
| Mobile Home / Other | 0 | 0.0% |
| Total | 149 | 100.0% |
Housing Structures by Occupancy in Point Hope
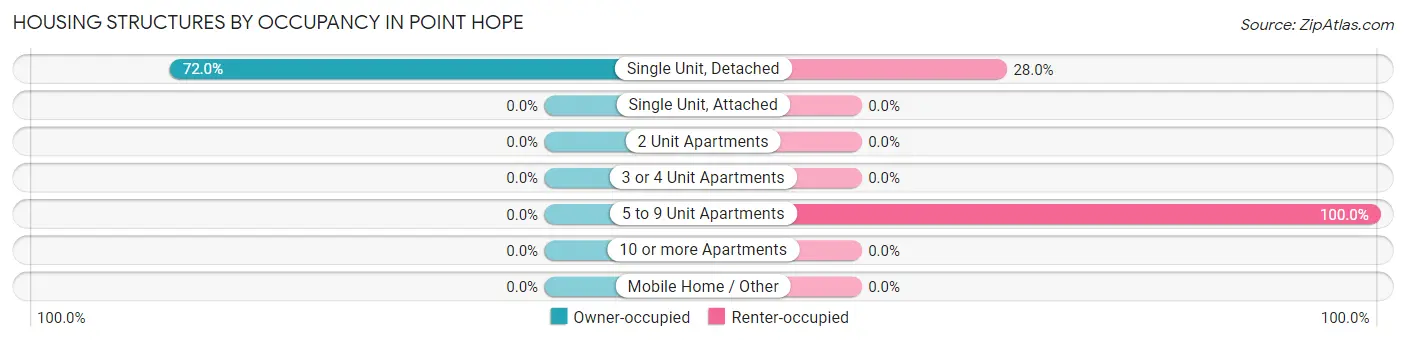
| Structure Type | Owner-occupied | Renter-occupied |
| Single Unit, Detached | 103 (72.0%) | 40 (28.0%) |
| Single Unit, Attached | 0 (0.0%) | 0 (0.0%) |
| 2 Unit Apartments | 0 (0.0%) | 0 (0.0%) |
| 3 or 4 Unit Apartments | 0 (0.0%) | 0 (0.0%) |
| 5 to 9 Unit Apartments | 0 (0.0%) | 6 (100.0%) |
| 10 or more Apartments | 0 (0.0%) | 0 (0.0%) |
| Mobile Home / Other | 0 (0.0%) | 0 (0.0%) |
| Total | 103 (69.1%) | 46 (30.9%) |
Housing Structures by Number of Rooms in Point Hope
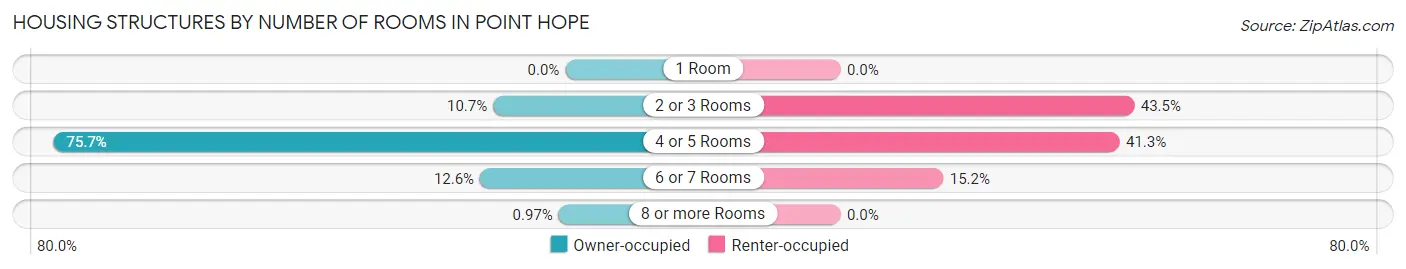
| Number of Rooms | Owner-occupied | Renter-occupied |
| 1 Room | 0 (0.0%) | 0 (0.0%) |
| 2 or 3 Rooms | 11 (10.7%) | 20 (43.5%) |
| 4 or 5 Rooms | 78 (75.7%) | 19 (41.3%) |
| 6 or 7 Rooms | 13 (12.6%) | 7 (15.2%) |
| 8 or more Rooms | 1 (1.0%) | 0 (0.0%) |
| Total | 103 (100.0%) | 46 (100.0%) |
Housing Structure by Heating Type in Point Hope
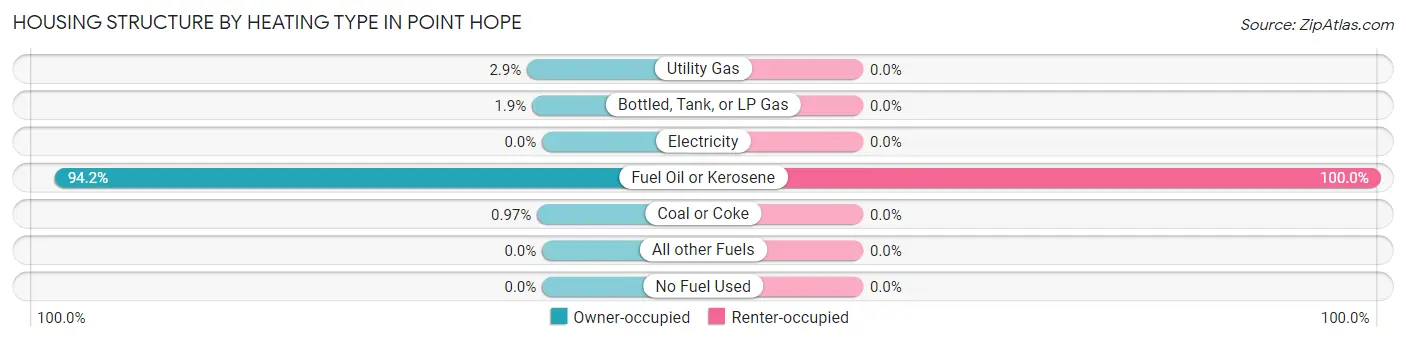
| Heating Type | Owner-occupied | Renter-occupied |
| Utility Gas | 3 (2.9%) | 0 (0.0%) |
| Bottled, Tank, or LP Gas | 2 (1.9%) | 0 (0.0%) |
| Electricity | 0 (0.0%) | 0 (0.0%) |
| Fuel Oil or Kerosene | 97 (94.2%) | 46 (100.0%) |
| Coal or Coke | 1 (1.0%) | 0 (0.0%) |
| All other Fuels | 0 (0.0%) | 0 (0.0%) |
| No Fuel Used | 0 (0.0%) | 0 (0.0%) |
| Total | 103 (100.0%) | 46 (100.0%) |
Household Vehicle Usage in Point Hope
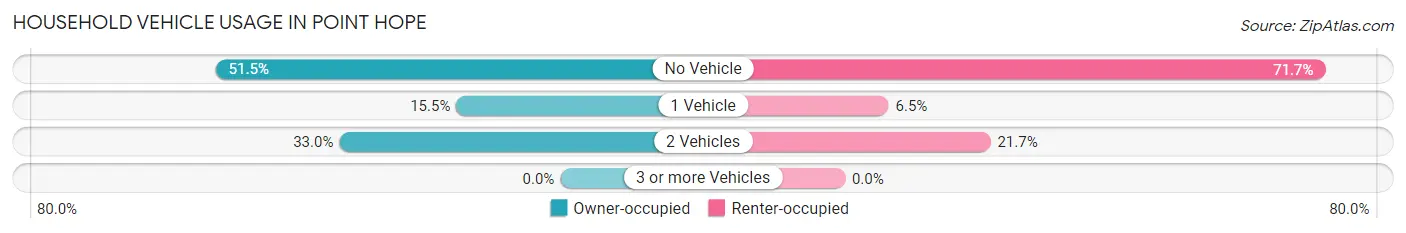
| Vehicles per Household | Owner-occupied | Renter-occupied |
| No Vehicle | 53 (51.5%) | 33 (71.7%) |
| 1 Vehicle | 16 (15.5%) | 3 (6.5%) |
| 2 Vehicles | 34 (33.0%) | 10 (21.7%) |
| 3 or more Vehicles | 0 (0.0%) | 0 (0.0%) |
| Total | 103 (100.0%) | 46 (100.0%) |
Real Estate & Mortgages in Point Hope
Real Estate and Mortgage Overview in Point Hope
| Characteristic | Without Mortgage | With Mortgage |
| Housing Units | 80 | 23 |
| Median Property Value | $158,300 | $225,000 |
| Median Household Income | $69,167 | $2 |
| Monthly Housing Costs | $542 | $0 |
| Real Estate Taxes | $4,167 | $19 |
Property Value by Mortgage Status in Point Hope
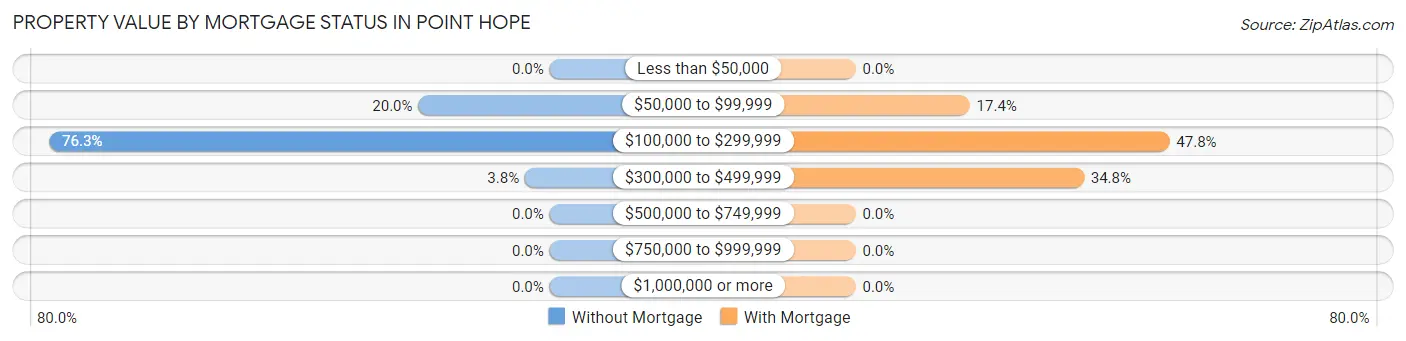
| Property Value | Without Mortgage | With Mortgage |
| Less than $50,000 | 0 (0.0%) | 0 (0.0%) |
| $50,000 to $99,999 | 16 (20.0%) | 4 (17.4%) |
| $100,000 to $299,999 | 61 (76.2%) | 11 (47.8%) |
| $300,000 to $499,999 | 3 (3.7%) | 8 (34.8%) |
| $500,000 to $749,999 | 0 (0.0%) | 0 (0.0%) |
| $750,000 to $999,999 | 0 (0.0%) | 0 (0.0%) |
| $1,000,000 or more | 0 (0.0%) | 0 (0.0%) |
| Total | 80 (100.0%) | 23 (100.0%) |
Household Income by Mortgage Status in Point Hope
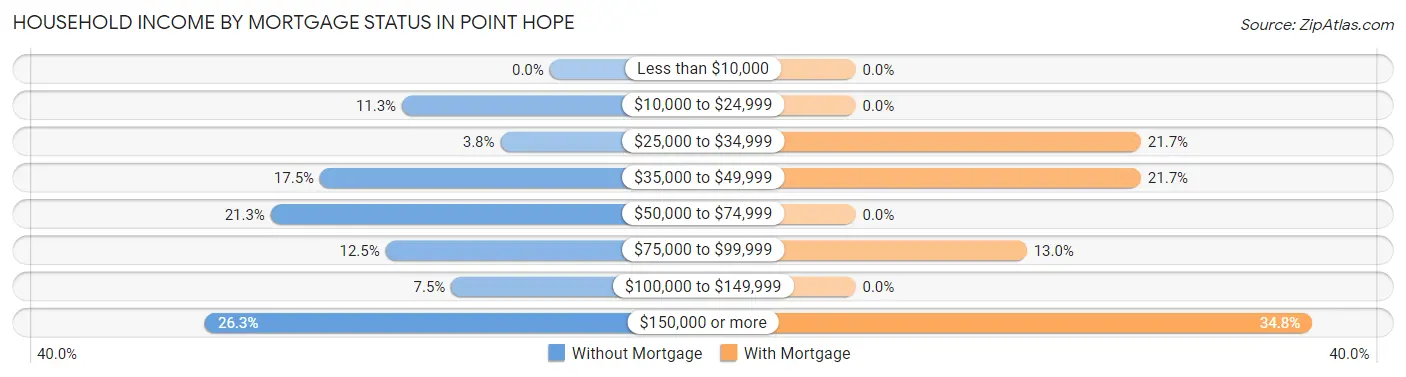
| Household Income | Without Mortgage | With Mortgage |
| Less than $10,000 | 0 (0.0%) | 0 (0.0%) |
| $10,000 to $24,999 | 9 (11.3%) | 0 (0.0%) |
| $25,000 to $34,999 | 3 (3.7%) | 5 (21.7%) |
| $35,000 to $49,999 | 14 (17.5%) | 5 (21.7%) |
| $50,000 to $74,999 | 17 (21.2%) | 0 (0.0%) |
| $75,000 to $99,999 | 10 (12.5%) | 3 (13.0%) |
| $100,000 to $149,999 | 6 (7.5%) | 0 (0.0%) |
| $150,000 or more | 21 (26.3%) | 8 (34.8%) |
| Total | 80 (100.0%) | 23 (100.0%) |
Property Value to Household Income Ratio in Point Hope
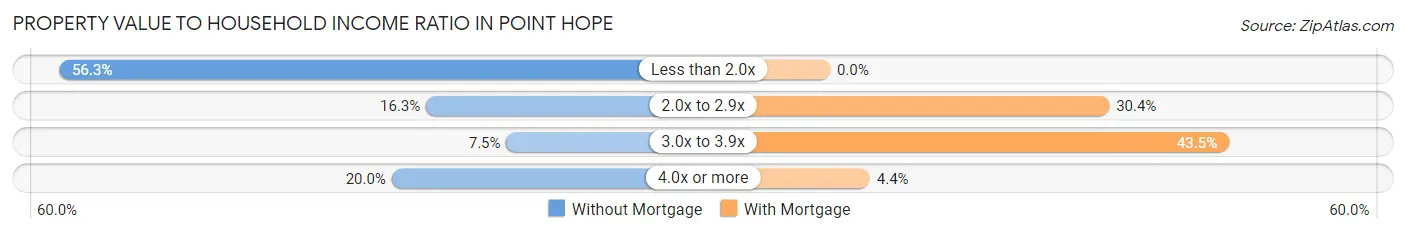
| Value-to-Income Ratio | Without Mortgage | With Mortgage |
| Less than 2.0x | 45 (56.2%) | 0 (0.0%) |
| 2.0x to 2.9x | 13 (16.3%) | 7 (30.4%) |
| 3.0x to 3.9x | 6 (7.5%) | 10 (43.5%) |
| 4.0x or more | 16 (20.0%) | 1 (4.3%) |
| Total | 80 (100.0%) | 23 (100.0%) |
Real Estate Taxes by Mortgage Status in Point Hope
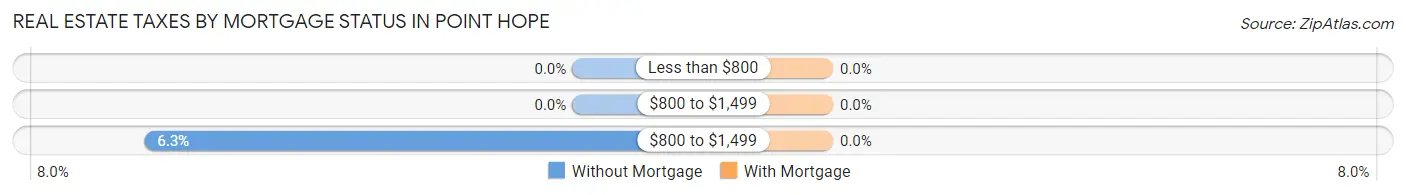
| Property Taxes | Without Mortgage | With Mortgage |
| Less than $800 | 0 (0.0%) | 0 (0.0%) |
| $800 to $1,499 | 0 (0.0%) | 0 (0.0%) |
| $800 to $1,499 | 5 (6.2%) | 0 (0.0%) |
| Total | 80 (100.0%) | 23 (100.0%) |
Health & Disability in Point Hope
Health Insurance Coverage by Age in Point Hope
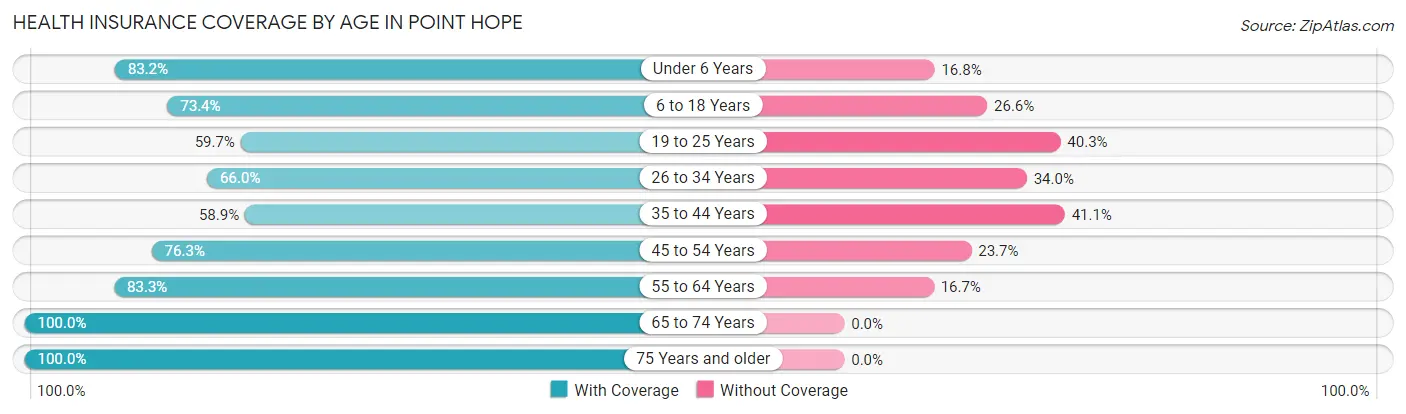
| Age Bracket | With Coverage | Without Coverage |
| Under 6 Years | 89 (83.2%) | 18 (16.8%) |
| 6 to 18 Years | 124 (73.4%) | 45 (26.6%) |
| 19 to 25 Years | 40 (59.7%) | 27 (40.3%) |
| 26 to 34 Years | 64 (66.0%) | 33 (34.0%) |
| 35 to 44 Years | 43 (58.9%) | 30 (41.1%) |
| 45 to 54 Years | 29 (76.3%) | 9 (23.7%) |
| 55 to 64 Years | 35 (83.3%) | 7 (16.7%) |
| 65 to 74 Years | 27 (100.0%) | 0 (0.0%) |
| 75 Years and older | 29 (100.0%) | 0 (0.0%) |
| Total | 480 (74.0%) | 169 (26.0%) |
Health Insurance Coverage by Citizenship Status in Point Hope
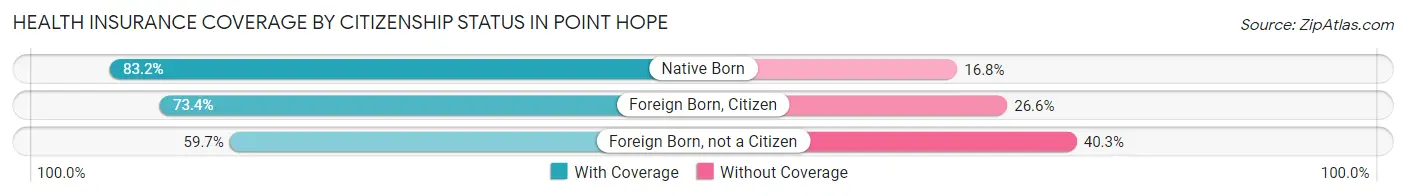
| Citizenship Status | With Coverage | Without Coverage |
| Native Born | 89 (83.2%) | 18 (16.8%) |
| Foreign Born, Citizen | 124 (73.4%) | 45 (26.6%) |
| Foreign Born, not a Citizen | 40 (59.7%) | 27 (40.3%) |
Health Insurance Coverage by Household Income in Point Hope
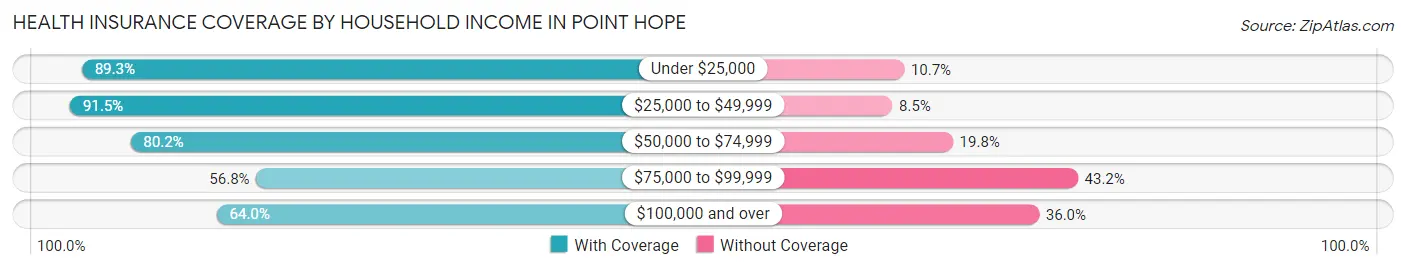
| Household Income | With Coverage | Without Coverage |
| Under $25,000 | 75 (89.3%) | 9 (10.7%) |
| $25,000 to $49,999 | 97 (91.5%) | 9 (8.5%) |
| $50,000 to $74,999 | 97 (80.2%) | 24 (19.8%) |
| $75,000 to $99,999 | 42 (56.8%) | 32 (43.2%) |
| $100,000 and over | 169 (64.0%) | 95 (36.0%) |
Public vs Private Health Insurance Coverage by Age in Point Hope
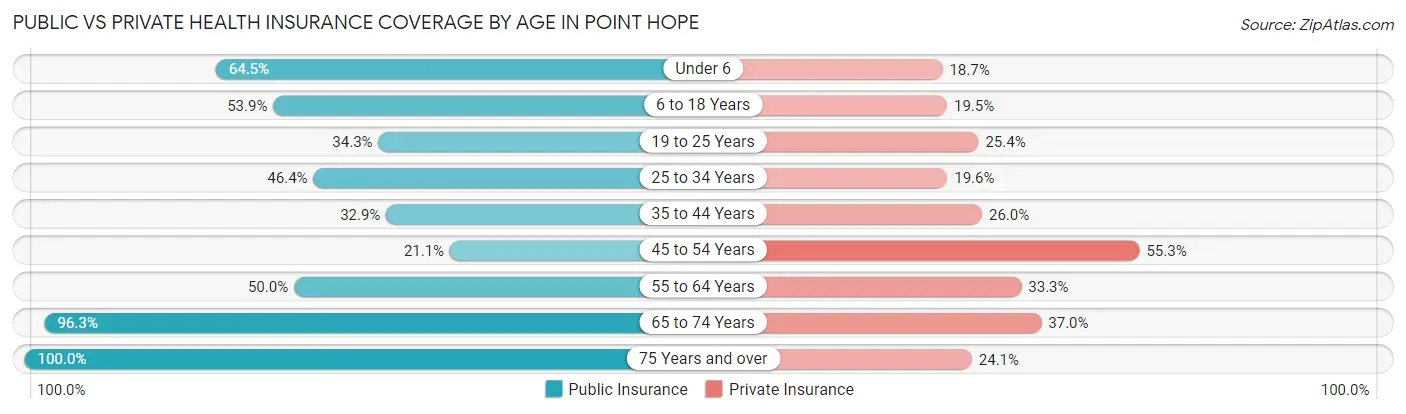
| Age Bracket | Public Insurance | Private Insurance |
| Under 6 | 69 (64.5%) | 20 (18.7%) |
| 6 to 18 Years | 91 (53.8%) | 33 (19.5%) |
| 19 to 25 Years | 23 (34.3%) | 17 (25.4%) |
| 25 to 34 Years | 45 (46.4%) | 19 (19.6%) |
| 35 to 44 Years | 24 (32.9%) | 19 (26.0%) |
| 45 to 54 Years | 8 (21.0%) | 21 (55.3%) |
| 55 to 64 Years | 21 (50.0%) | 14 (33.3%) |
| 65 to 74 Years | 26 (96.3%) | 10 (37.0%) |
| 75 Years and over | 29 (100.0%) | 7 (24.1%) |
| Total | 336 (51.8%) | 160 (24.6%) |
Disability Status by Sex by Age in Point Hope
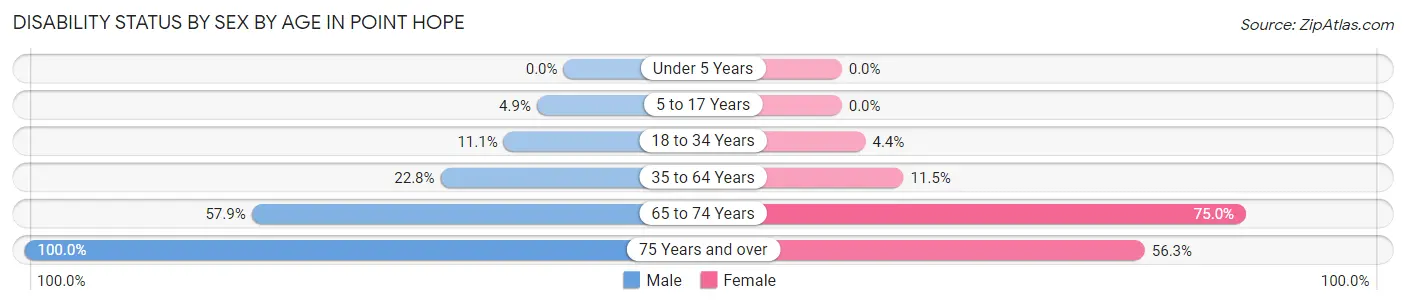
| Age Bracket | Male | Female |
| Under 5 Years | 0 (0.0%) | 0 (0.0%) |
| 5 to 17 Years | 4 (4.9%) | 0 (0.0%) |
| 18 to 34 Years | 11 (11.1%) | 3 (4.4%) |
| 35 to 64 Years | 21 (22.8%) | 7 (11.5%) |
| 65 to 74 Years | 11 (57.9%) | 6 (75.0%) |
| 75 Years and over | 13 (100.0%) | 9 (56.2%) |
Disability Class by Sex by Age in Point Hope
Disability Class: Hearing Difficulty
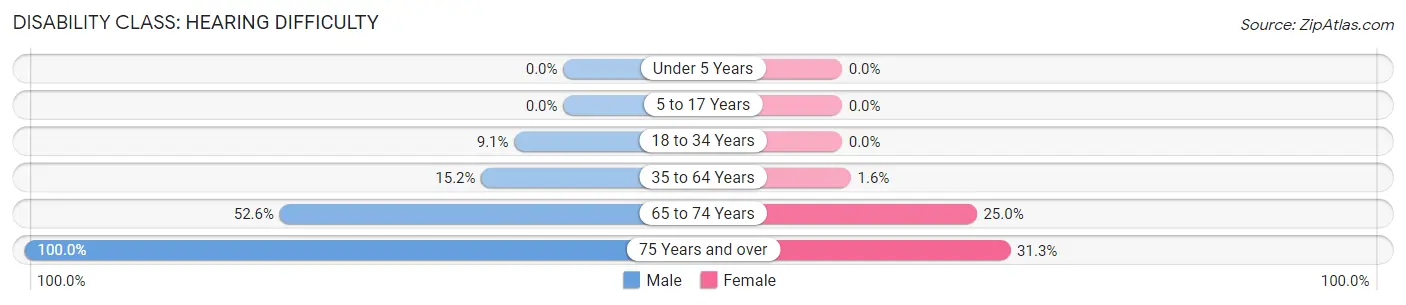
| Age Bracket | Male | Female |
| Under 5 Years | 0 (0.0%) | 0 (0.0%) |
| 5 to 17 Years | 0 (0.0%) | 0 (0.0%) |
| 18 to 34 Years | 9 (9.1%) | 0 (0.0%) |
| 35 to 64 Years | 14 (15.2%) | 1 (1.6%) |
| 65 to 74 Years | 10 (52.6%) | 2 (25.0%) |
| 75 Years and over | 13 (100.0%) | 5 (31.2%) |
Disability Class: Vision Difficulty
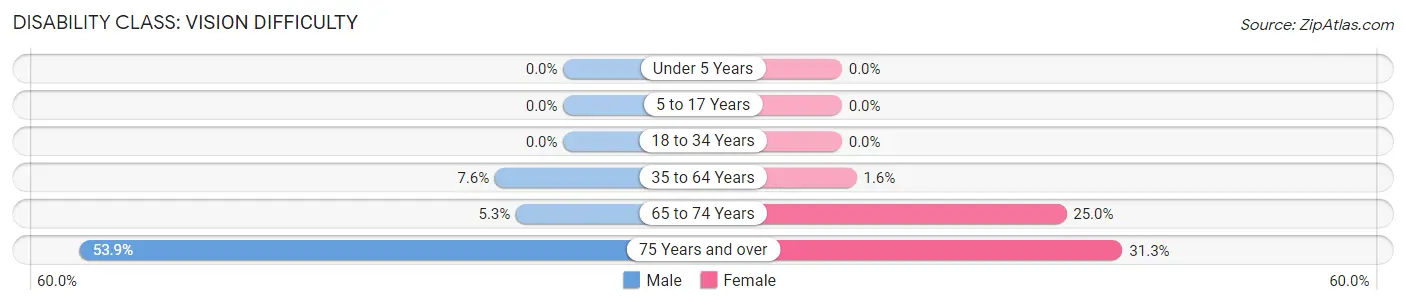
| Age Bracket | Male | Female |
| Under 5 Years | 0 (0.0%) | 0 (0.0%) |
| 5 to 17 Years | 0 (0.0%) | 0 (0.0%) |
| 18 to 34 Years | 0 (0.0%) | 0 (0.0%) |
| 35 to 64 Years | 7 (7.6%) | 1 (1.6%) |
| 65 to 74 Years | 1 (5.3%) | 2 (25.0%) |
| 75 Years and over | 7 (53.8%) | 5 (31.2%) |
Disability Class: Cognitive Difficulty
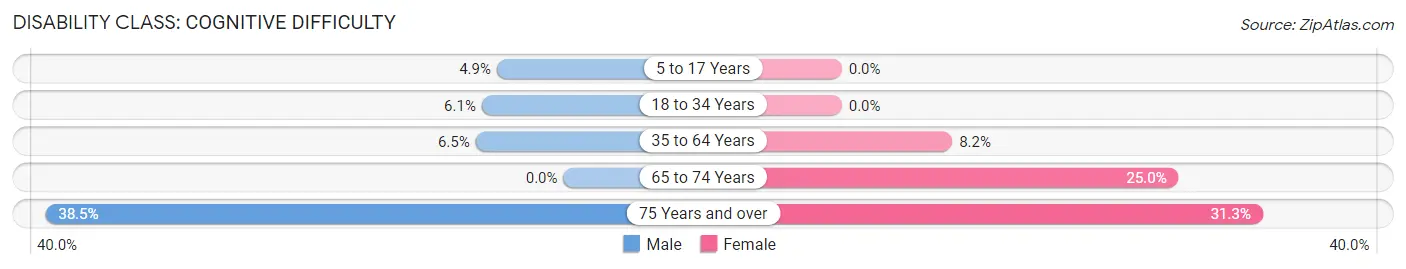
| Age Bracket | Male | Female |
| 5 to 17 Years | 4 (4.9%) | 0 (0.0%) |
| 18 to 34 Years | 6 (6.1%) | 0 (0.0%) |
| 35 to 64 Years | 6 (6.5%) | 5 (8.2%) |
| 65 to 74 Years | 0 (0.0%) | 2 (25.0%) |
| 75 Years and over | 5 (38.5%) | 5 (31.2%) |
Disability Class: Ambulatory Difficulty
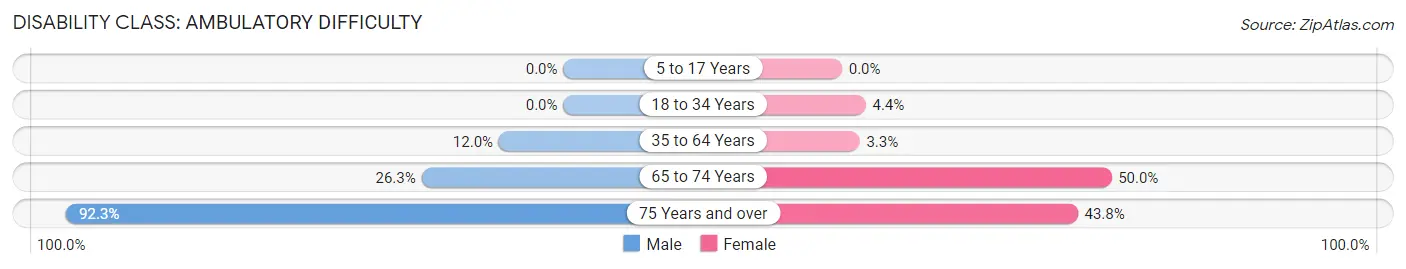
| Age Bracket | Male | Female |
| 5 to 17 Years | 0 (0.0%) | 0 (0.0%) |
| 18 to 34 Years | 0 (0.0%) | 3 (4.4%) |
| 35 to 64 Years | 11 (12.0%) | 2 (3.3%) |
| 65 to 74 Years | 5 (26.3%) | 4 (50.0%) |
| 75 Years and over | 12 (92.3%) | 7 (43.8%) |
Disability Class: Self-Care Difficulty
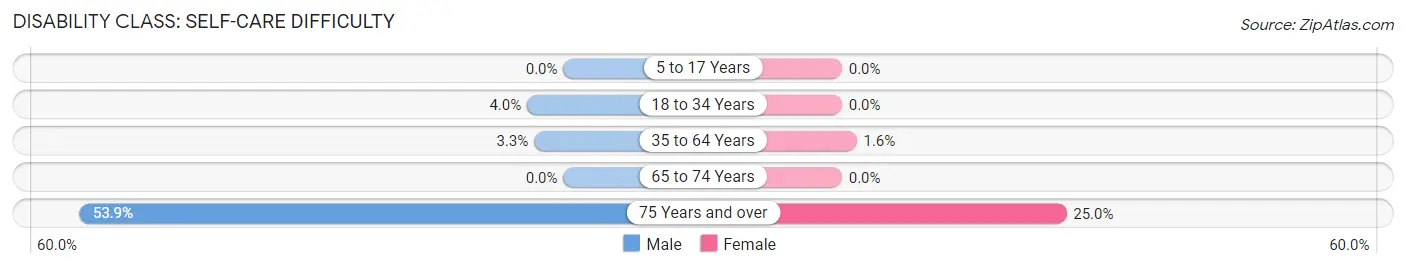
| Age Bracket | Male | Female |
| 5 to 17 Years | 0 (0.0%) | 0 (0.0%) |
| 18 to 34 Years | 4 (4.0%) | 0 (0.0%) |
| 35 to 64 Years | 3 (3.3%) | 1 (1.6%) |
| 65 to 74 Years | 0 (0.0%) | 0 (0.0%) |
| 75 Years and over | 7 (53.8%) | 4 (25.0%) |
Technology Access in Point Hope
Computing Device Access in Point Hope
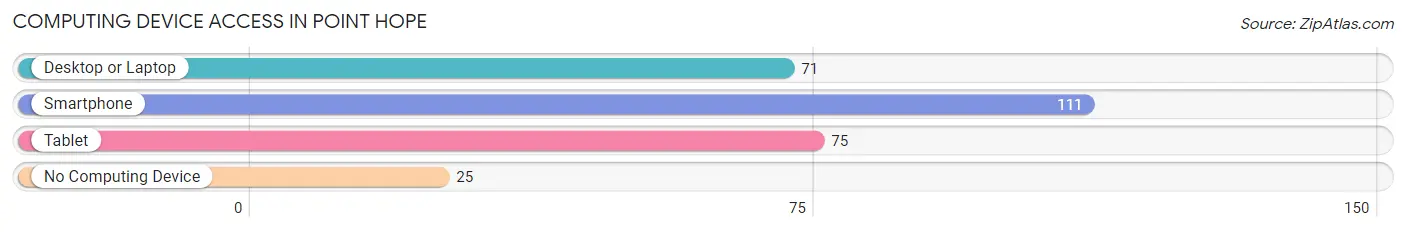
| Device Type | # Households | % Households |
| Desktop or Laptop | 71 | 47.6% |
| Smartphone | 111 | 74.5% |
| Tablet | 75 | 50.3% |
| No Computing Device | 25 | 16.8% |
| Total | 149 | 100.0% |
Internet Access in Point Hope
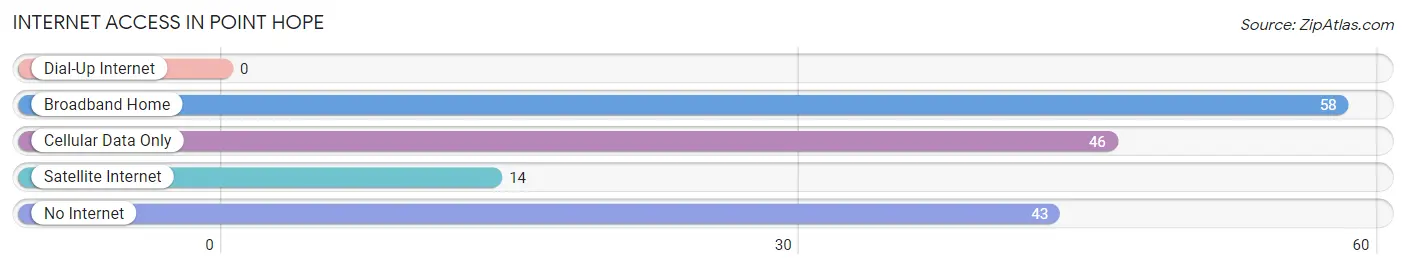
| Internet Type | # Households | % Households |
| Dial-Up Internet | 0 | 0.0% |
| Broadband Home | 58 | 38.9% |
| Cellular Data Only | 46 | 30.9% |
| Satellite Internet | 14 | 9.4% |
| No Internet | 43 | 28.9% |
| Total | 149 | 100.0% |
Point Hope Summary
Point Hope, Alaska is a small Inupiat Eskimo village located on the Chukchi Sea in the North Slope Borough of Alaska. It is the oldest continuously inhabited community in Alaska, with archaeological evidence of human habitation dating back over 10,000 years. The population of Point Hope was 738 at the 2000 census, making it the largest village in the North Slope Borough.
Geography
Point Hope is located at 68°25'N, 166°50'W, on the Chukchi Sea, about 50 miles north of the Arctic Circle. It is situated on a narrow spit of land that juts out into the sea, and is surrounded by the Chukchi Sea to the north, east, and west, and by the Kasegaluk Lagoon to the south. The village is located on a low-lying coastal plain, with the highest point in the area being only about 20 feet above sea level. The climate is subarctic, with long, cold winters and short, cool summers. The average annual temperature is about 28°F, and the average annual precipitation is about 8 inches.
History
Point Hope has been inhabited for thousands of years by the Inupiat Eskimos, who have traditionally relied on the sea for their subsistence. Archaeological evidence suggests that the area has been inhabited since at least 10,000 years ago. The Inupiat have a long history of trading with other Arctic cultures, and Point Hope was an important trading center for the region. In the 19th century, the area was visited by whalers and traders from Europe and the United States, and in 1826 the first permanent non-native settlement was established in Point Hope. In 1867, the United States purchased Alaska from Russia, and Point Hope became part of the United States. In the early 20th century, Point Hope was a major whaling center, and the population peaked at over 1,000 in the 1920s. In the 1950s, the whaling industry declined, and the population of Point Hope began to decline as well.
Economy
The economy of Point Hope is based primarily on subsistence activities, such as hunting, fishing, and gathering. The Inupiat also rely on the sale of handicrafts and artwork, as well as the sale of whale and seal products. The village also receives income from the oil and gas industry, as well as from tourism.
Demographics
As of the 2000 census, there were 738 people, 181 households, and 149 families residing in Point Hope. The population density was 1.2 people per square mile. The racial makeup of the village was 95.2% Native American, 0.3% White, 0.1% African American, 0.1% Asian, 0.1% Pacific Islander, 0.1% from other races, and 4.2% from two or more races. Hispanic or Latino of any race were 0.3% of the population.
The median income for a household in Point Hope was $25,000, and the median income for a family was $27,500. Males had a median income of $25,000 versus $20,000 for females. The per capita income for the village was $10,000. About 18.2% of families and 20.2% of the population were below the poverty line, including 25.2% of those under age 18 and none of those age 65 or over.
Common Questions
What is Per Capita Income in Point Hope?
Per Capita income in Point Hope is $20,284.
What is the Median Family Income in Point Hope?
Median Family Income in Point Hope is $63,750.
What is the Median Household income in Point Hope?
Median Household Income in Point Hope is $56,250.
What is Family Income Deficit in Point Hope?
Family Income Deficit in Point Hope is $15,228.
Families that are below poverty line in Point Hope earn $15,228 less on average than the poverty threshold level.
What is Inequality or Gini Index in Point Hope?
Inequality or Gini Index in Point Hope is 0.48.
What is the Total Population of Point Hope?
Total Population of Point Hope is 649.
What is the Total Male Population of Point Hope?
Total Male Population of Point Hope is 359.
What is the Total Female Population of Point Hope?
Total Female Population of Point Hope is 290.
What is the Ratio of Males per 100 Females in Point Hope?
There are 123.79 Males per 100 Females in Point Hope.
What is the Ratio of Females per 100 Males in Point Hope?
There are 80.78 Females per 100 Males in Point Hope.
What is the Median Population Age in Point Hope?
Median Population Age in Point Hope is 24.7 Years.
What is the Average Family Size in Point Hope
Average Family Size in Point Hope is 4.9 People.
What is the Average Household Size in Point Hope
Average Household Size in Point Hope is 4.4 People.
How Large is the Labor Force in Point Hope?
There are 197 People in the Labor Forcein in Point Hope.
What is the Percentage of People in the Labor Force in Point Hope?
50.4% of People are in the Labor Force in Point Hope.
What is the Unemployment Rate in Point Hope?
Unemployment Rate in Point Hope is 27.4%.