Mountain Village, AK Map & Demographics
Mountain Village Map
Mountain Village Overview
$13,531
PER CAPITA INCOME
$55,250
AVG FAMILY INCOME
$45,000
AVG HOUSEHOLD INCOME
44.1%
WAGE / INCOME GAP [ % ]
55.9¢/ $1
WAGE / INCOME GAP [ $ ]
0.44
INEQUALITY / GINI INDEX
884
TOTAL POPULATION
459
MALE POPULATION
425
FEMALE POPULATION
108.00
MALES / 100 FEMALES
92.59
FEMALES / 100 MALES
22.6
MEDIAN AGE
4.3
AVG FAMILY SIZE
4.4
AVG HOUSEHOLD SIZE
250
LABOR FORCE [ PEOPLE ]
44.4%
PERCENT IN LABOR FORCE
15.0%
UNEMPLOYMENT RATE
Mountain Village Zip Codes
Mountain Village Area Codes
Income in Mountain Village
Income Overview in Mountain Village
Per Capita Income in Mountain Village is $13,531, while median incomes of families and households are $55,250 and $45,000 respectively.
| Characteristic | Number | Measure |
| Per Capita Income | 884 | $13,531 |
| Median Family Income | 174 | $55,250 |
| Mean Family Income | 174 | $60,861 |
| Median Household Income | 200 | $45,000 |
| Mean Household Income | 200 | $61,790 |
| Income Deficit | 174 | $0 |
| Wage / Income Gap (%) | 884 | 44.12% |
| Wage / Income Gap ($) | 884 | 55.88¢ per $1 |
| Gini / Inequality Index | 884 | 0.44 |
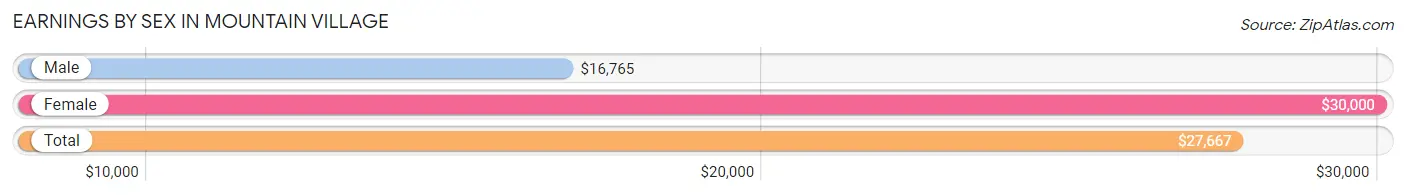
Earnings by Sex in Mountain Village
Average Earnings in Mountain Village are $27,667, $16,765 for men and $30,000 for women, a difference of 44.1%.
| Sex | Number | Average Earnings |
| Male | 152 (58.5%) | $16,765 |
| Female | 108 (41.5%) | $30,000 |
| Total | 260 (100.0%) | $27,667 |
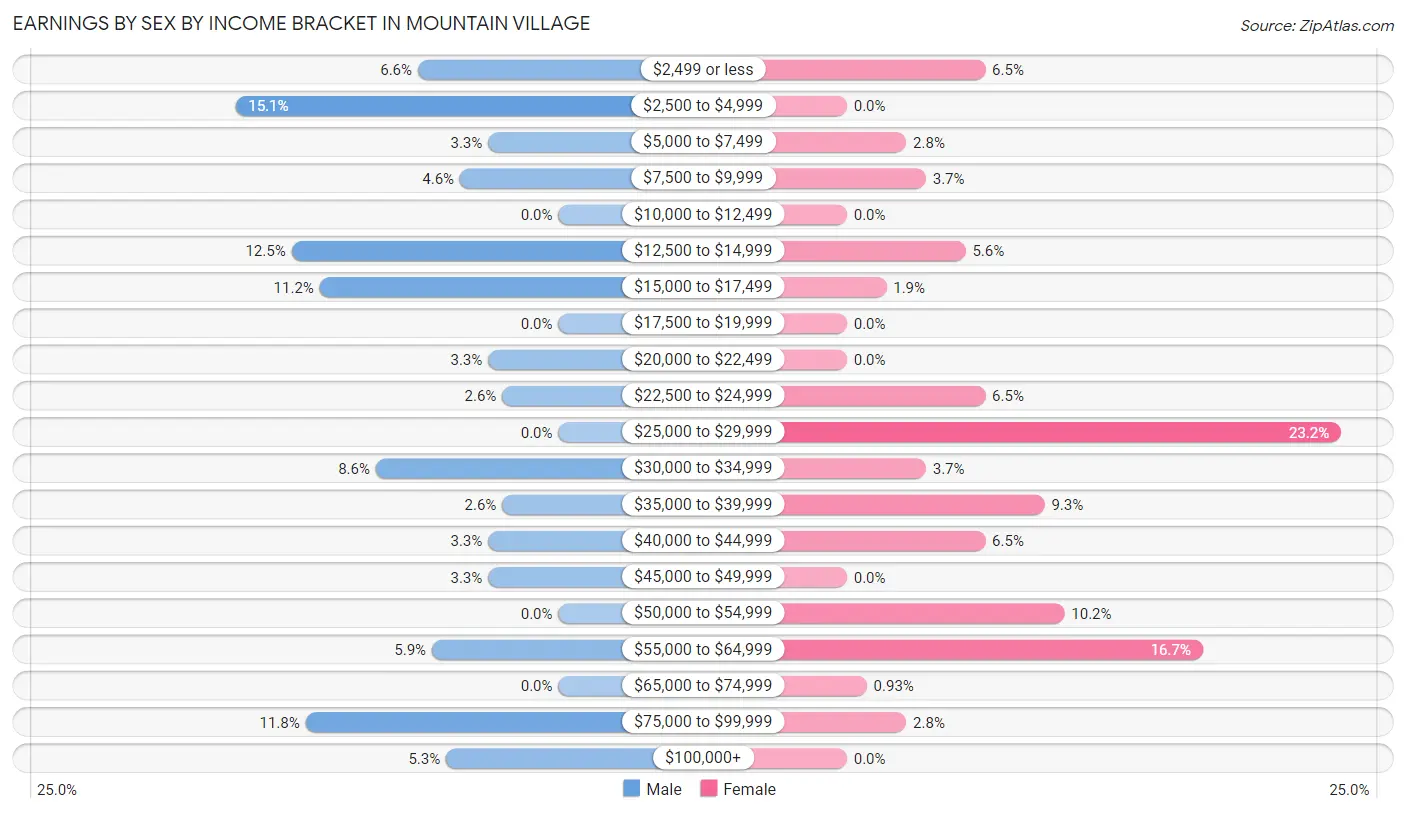
Earnings by Sex by Income Bracket in Mountain Village
The most common earnings brackets in Mountain Village are $2,500 to $4,999 for men (23 | 15.1%) and $25,000 to $29,999 for women (25 | 23.2%).
| Income | Male | Female |
| $2,499 or less | 10 (6.6%) | 7 (6.5%) |
| $2,500 to $4,999 | 23 (15.1%) | 0 (0.0%) |
| $5,000 to $7,499 | 5 (3.3%) | 3 (2.8%) |
| $7,500 to $9,999 | 7 (4.6%) | 4 (3.7%) |
| $10,000 to $12,499 | 0 (0.0%) | 0 (0.0%) |
| $12,500 to $14,999 | 19 (12.5%) | 6 (5.6%) |
| $15,000 to $17,499 | 17 (11.2%) | 2 (1.8%) |
| $17,500 to $19,999 | 0 (0.0%) | 0 (0.0%) |
| $20,000 to $22,499 | 5 (3.3%) | 0 (0.0%) |
| $22,500 to $24,999 | 4 (2.6%) | 7 (6.5%) |
| $25,000 to $29,999 | 0 (0.0%) | 25 (23.2%) |
| $30,000 to $34,999 | 13 (8.6%) | 4 (3.7%) |
| $35,000 to $39,999 | 4 (2.6%) | 10 (9.3%) |
| $40,000 to $44,999 | 5 (3.3%) | 7 (6.5%) |
| $45,000 to $49,999 | 5 (3.3%) | 0 (0.0%) |
| $50,000 to $54,999 | 0 (0.0%) | 11 (10.2%) |
| $55,000 to $64,999 | 9 (5.9%) | 18 (16.7%) |
| $65,000 to $74,999 | 0 (0.0%) | 1 (0.9%) |
| $75,000 to $99,999 | 18 (11.8%) | 3 (2.8%) |
| $100,000+ | 8 (5.3%) | 0 (0.0%) |
| Total | 152 (100.0%) | 108 (100.0%) |
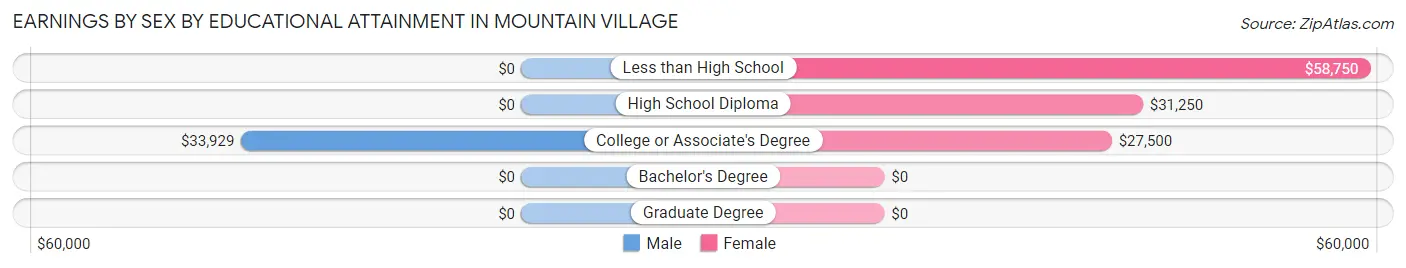
Earnings by Sex by Educational Attainment in Mountain Village
| Educational Attainment | Male Income | Female Income |
| Less than High School | - | - |
| High School Diploma | - | - |
| College or Associate's Degree | $33,929 | $27,500 |
| Bachelor's Degree | - | - |
| Graduate Degree | - | - |
| Total | - | - |
Family Income in Mountain Village
Family Income Brackets in Mountain Village
According to the Mountain Village family income data, there are 42 families falling into the less than $10,000 income range, which is the most common income bracket and makes up 24.1% of all families.
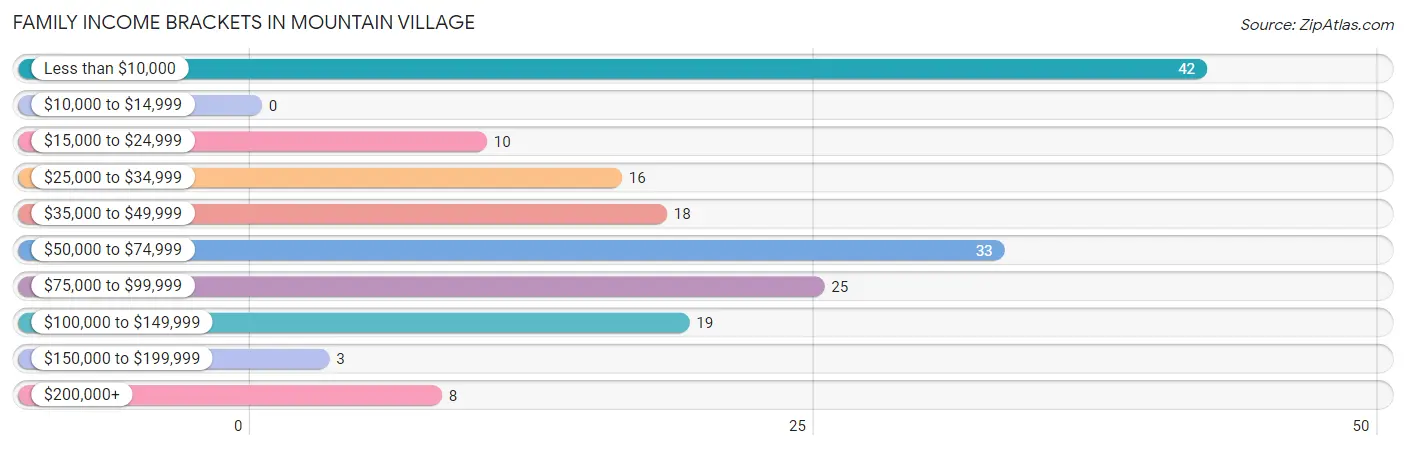
| Income Bracket | # Families | % Families |
| Less than $10,000 | 42 | 24.1% |
| $10,000 to $14,999 | 0 | 0.0% |
| $15,000 to $24,999 | 10 | 5.7% |
| $25,000 to $34,999 | 16 | 9.2% |
| $35,000 to $49,999 | 18 | 10.3% |
| $50,000 to $74,999 | 33 | 19.0% |
| $75,000 to $99,999 | 25 | 14.4% |
| $100,000 to $149,999 | 19 | 10.9% |
| $150,000 to $199,999 | 3 | 1.7% |
| $200,000+ | 8 | 4.6% |
Family Income by Famaliy Size in Mountain Village
5-person families (23 | 13.2%) account for the highest median family income in Mountain Village with $62,750 per family, while 3-person families (34 | 19.5%) have the highest median income of $18,750 per family member.
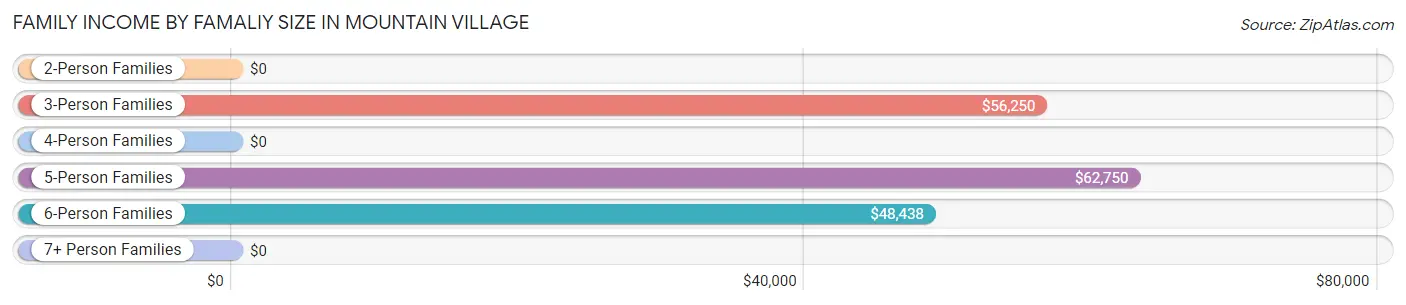
| Income Bracket | # Families | Median Income |
| 2-Person Families | 58 (33.3%) | $0 |
| 3-Person Families | 34 (19.5%) | $56,250 |
| 4-Person Families | 32 (18.4%) | $0 |
| 5-Person Families | 23 (13.2%) | $62,750 |
| 6-Person Families | 19 (10.9%) | $48,438 |
| 7+ Person Families | 8 (4.6%) | $0 |
| Total | 174 (100.0%) | $55,250 |
Family Income by Number of Earners in Mountain Village
The median family income in Mountain Village is $55,250, with families comprising 2 earners (49) having the highest median family income of $94,583, while families with no earners (35) have the lowest median family income of $8,798, accounting for 28.2% and 20.1% of families, respectively.
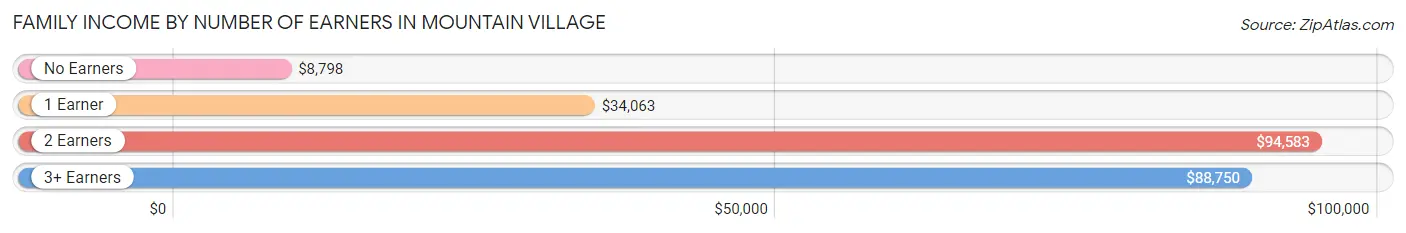
| Number of Earners | # Families | Median Income |
| No Earners | 35 (20.1%) | $8,798 |
| 1 Earner | 73 (41.9%) | $34,063 |
| 2 Earners | 49 (28.2%) | $94,583 |
| 3+ Earners | 17 (9.8%) | $88,750 |
| Total | 174 (100.0%) | $55,250 |
Household Income in Mountain Village
Household Income Brackets in Mountain Village
With 36 households falling in the category, the $75,000 to $99,999 income range is the most frequent in Mountain Village, accounting for 18.0% of all households. In contrast, only 3 households (1.5%) fall into the $150,000 to $199,999 income bracket, making it the least populous group.
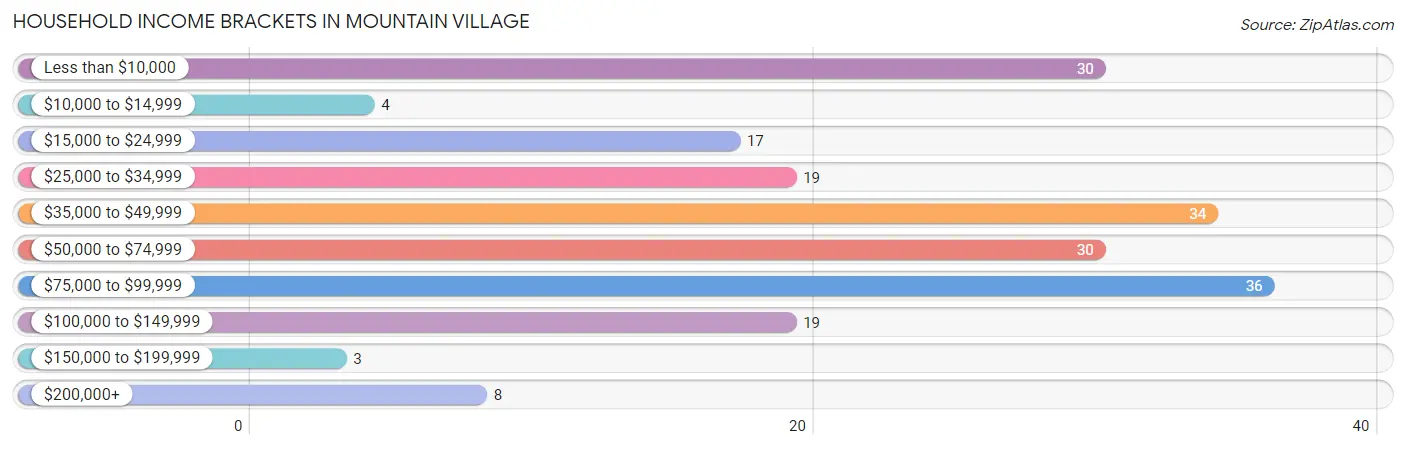
| Income Bracket | # Households | % Households |
| Less than $10,000 | 30 | 15.0% |
| $10,000 to $14,999 | 4 | 2.0% |
| $15,000 to $24,999 | 17 | 8.5% |
| $25,000 to $34,999 | 19 | 9.5% |
| $35,000 to $49,999 | 34 | 17.0% |
| $50,000 to $74,999 | 30 | 15.0% |
| $75,000 to $99,999 | 36 | 18.0% |
| $100,000 to $149,999 | 19 | 9.5% |
| $150,000 to $199,999 | 3 | 1.5% |
| $200,000+ | 8 | 4.0% |
Household Income by Householder Age in Mountain Village
The median household income in Mountain Village is $45,000, with the highest median household income of $49,688 found in the 45 to 64 years age bracket for the primary householder. A total of 103 households (51.5%) fall into this category.
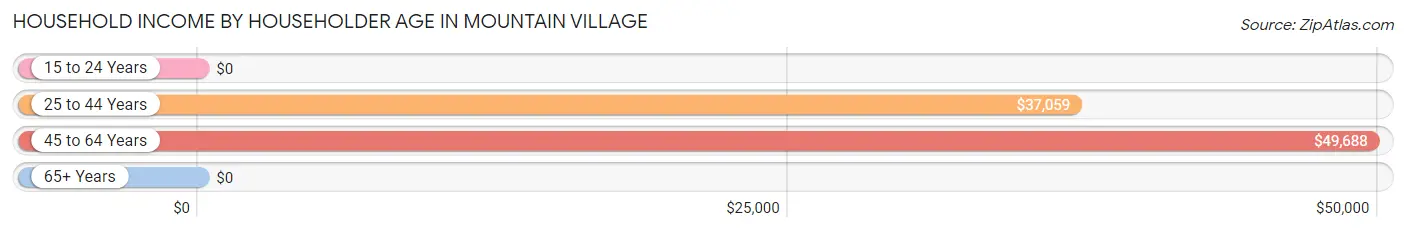
| Income Bracket | # Households | Median Income |
| 15 to 24 Years | 0 (0.0%) | $0 |
| 25 to 44 Years | 66 (33.0%) | $37,059 |
| 45 to 64 Years | 103 (51.5%) | $49,688 |
| 65+ Years | 31 (15.5%) | $0 |
| Total | 200 (100.0%) | $45,000 |
Poverty in Mountain Village
Income Below Poverty by Sex and Age in Mountain Village
With 26.6% poverty level for males and 53.4% for females among the residents of Mountain Village, 35 to 44 year old males and 5 year old females are the most vulnerable to poverty, with 24 males (54.5%) and 3 females (100.0%) in their respective age groups living below the poverty level.
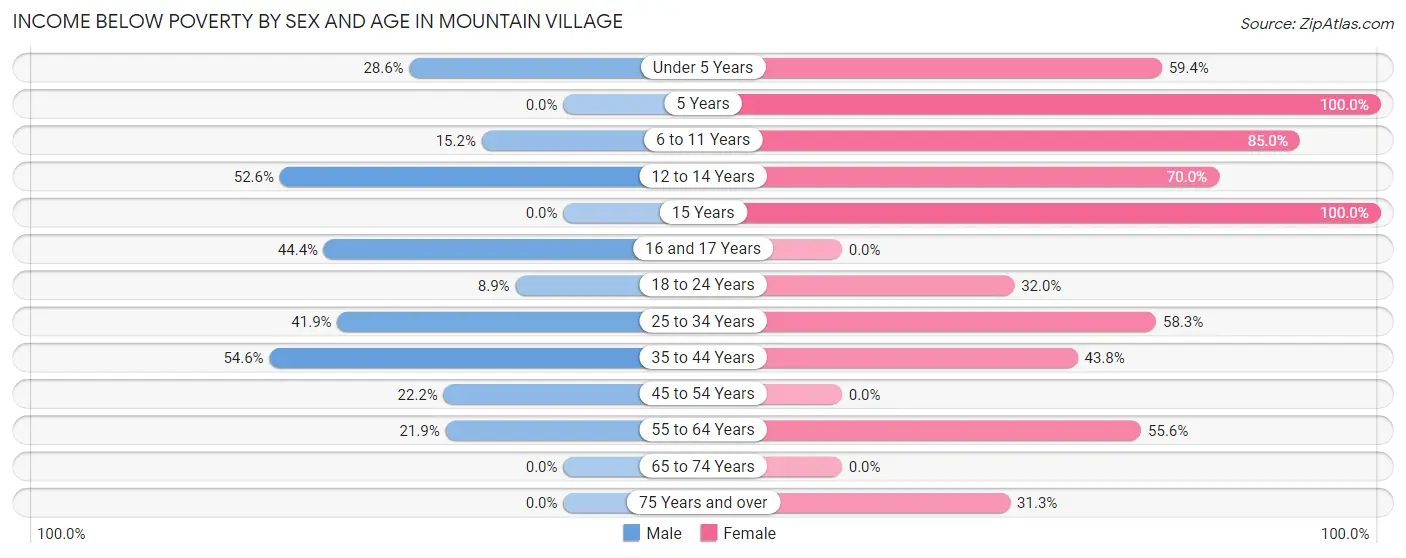
| Age Bracket | Male | Female |
| Under 5 Years | 8 (28.6%) | 19 (59.4%) |
| 5 Years | 0 (0.0%) | 3 (100.0%) |
| 6 to 11 Years | 10 (15.1%) | 51 (85.0%) |
| 12 to 14 Years | 10 (52.6%) | 35 (70.0%) |
| 15 Years | 0 (0.0%) | 3 (100.0%) |
| 16 and 17 Years | 12 (44.4%) | 0 (0.0%) |
| 18 to 24 Years | 4 (8.9%) | 8 (32.0%) |
| 25 to 34 Years | 26 (41.9%) | 42 (58.3%) |
| 35 to 44 Years | 24 (54.5%) | 14 (43.8%) |
| 45 to 54 Years | 8 (22.2%) | 0 (0.0%) |
| 55 to 64 Years | 14 (21.9%) | 40 (55.6%) |
| 65 to 74 Years | 0 (0.0%) | 0 (0.0%) |
| 75 Years and over | 0 (0.0%) | 5 (31.2%) |
| Total | 116 (26.6%) | 220 (53.4%) |
Income Above Poverty by Sex and Age in Mountain Village
According to the poverty statistics in Mountain Village, males aged 5 years and females aged 16 and 17 years are the age groups that are most secure financially, with 100.0% of males and 100.0% of females in these age groups living above the poverty line.
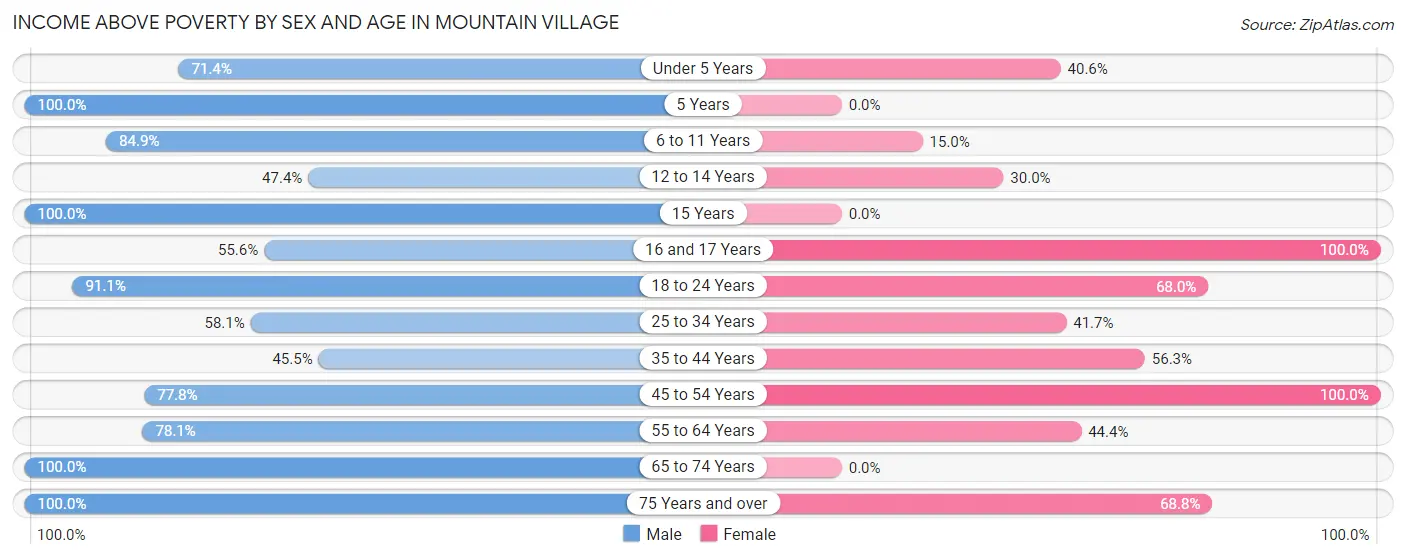
| Age Bracket | Male | Female |
| Under 5 Years | 20 (71.4%) | 13 (40.6%) |
| 5 Years | 4 (100.0%) | 0 (0.0%) |
| 6 to 11 Years | 56 (84.9%) | 9 (15.0%) |
| 12 to 14 Years | 9 (47.4%) | 15 (30.0%) |
| 15 Years | 20 (100.0%) | 0 (0.0%) |
| 16 and 17 Years | 15 (55.6%) | 28 (100.0%) |
| 18 to 24 Years | 41 (91.1%) | 17 (68.0%) |
| 25 to 34 Years | 36 (58.1%) | 30 (41.7%) |
| 35 to 44 Years | 20 (45.5%) | 18 (56.2%) |
| 45 to 54 Years | 28 (77.8%) | 19 (100.0%) |
| 55 to 64 Years | 50 (78.1%) | 32 (44.4%) |
| 65 to 74 Years | 8 (100.0%) | 0 (0.0%) |
| 75 Years and over | 13 (100.0%) | 11 (68.8%) |
| Total | 320 (73.4%) | 192 (46.6%) |
Income Below Poverty Among Married-Couple Families in Mountain Village
The poverty statistics for married-couple families in Mountain Village show that 13.9% or 9 of the total 65 families live below the poverty line. Families with 3 or 4 children have the highest poverty rate of 66.7%, comprising of 4 families. On the other hand, families with no children have the lowest poverty rate of 0.0%, which includes 0 families.
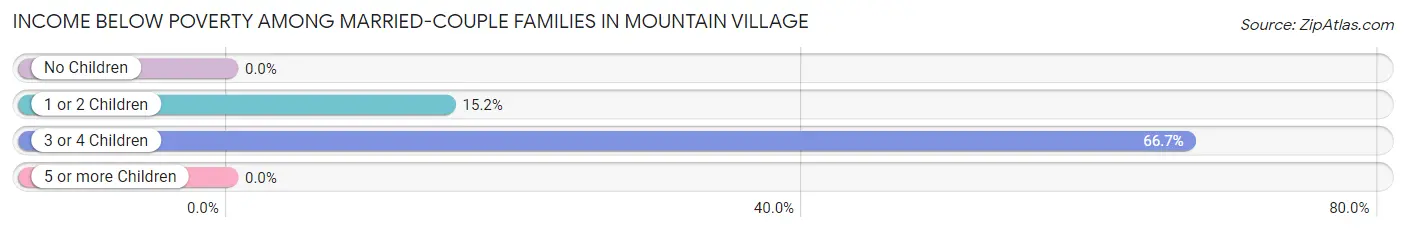
| Children | Above Poverty | Below Poverty |
| No Children | 26 (100.0%) | 0 (0.0%) |
| 1 or 2 Children | 28 (84.9%) | 5 (15.1%) |
| 3 or 4 Children | 2 (33.3%) | 4 (66.7%) |
| 5 or more Children | 0 (0.0%) | 0 (0.0%) |
| Total | 56 (86.2%) | 9 (13.9%) |
Income Below Poverty Among Single-Parent Households in Mountain Village
According to the poverty data in Mountain Village, 36.4% or 8 single-father households and 58.6% or 51 single-mother households are living below the poverty line. Among single-father households, those with 1 or 2 children have the highest poverty rate, with 8 households (61.5%) experiencing poverty. Likewise, among single-mother households, those with 5 or more children have the highest poverty rate, with 4 households (100.0%) falling below the poverty line.
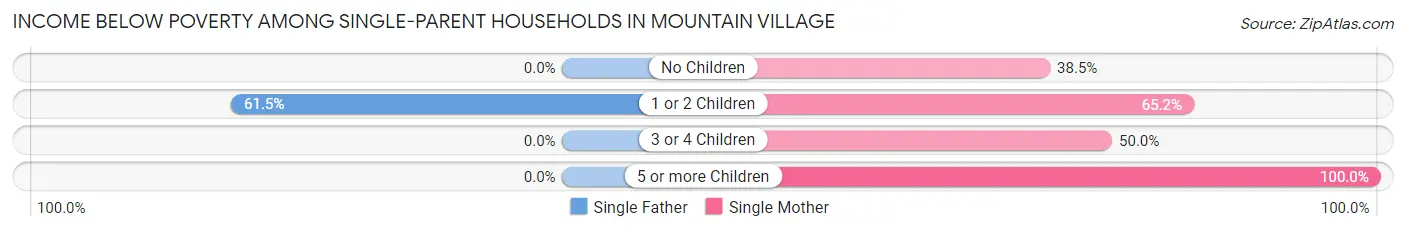
| Children | Single Father | Single Mother |
| No Children | 0 (0.0%) | 5 (38.5%) |
| 1 or 2 Children | 8 (61.5%) | 30 (65.2%) |
| 3 or 4 Children | 0 (0.0%) | 12 (50.0%) |
| 5 or more Children | 0 (0.0%) | 4 (100.0%) |
| Total | 8 (36.4%) | 51 (58.6%) |
Income Below Poverty Among Married-Couple vs Single-Parent Households in Mountain Village
The poverty data for Mountain Village shows that 9 of the married-couple family households (13.9%) and 59 of the single-parent households (54.1%) are living below the poverty level. Within the married-couple family households, those with 3 or 4 children have the highest poverty rate, with 4 households (66.7%) falling below the poverty line. Among the single-parent households, those with 5 or more children have the highest poverty rate, with 4 household (100.0%) living below poverty.
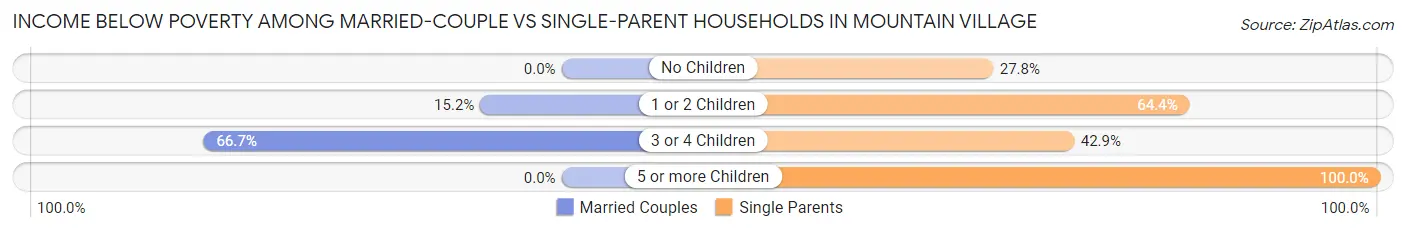
| Children | Married-Couple Families | Single-Parent Households |
| No Children | 0 (0.0%) | 5 (27.8%) |
| 1 or 2 Children | 5 (15.1%) | 38 (64.4%) |
| 3 or 4 Children | 4 (66.7%) | 12 (42.9%) |
| 5 or more Children | 0 (0.0%) | 4 (100.0%) |
| Total | 9 (13.9%) | 59 (54.1%) |
Race in Mountain Village
The most populous races in Mountain Village are Native / Alaskan (865 | 97.9%), Two or more Races (10 | 1.1%), and Hispanic or Latino (9 | 1.0%).
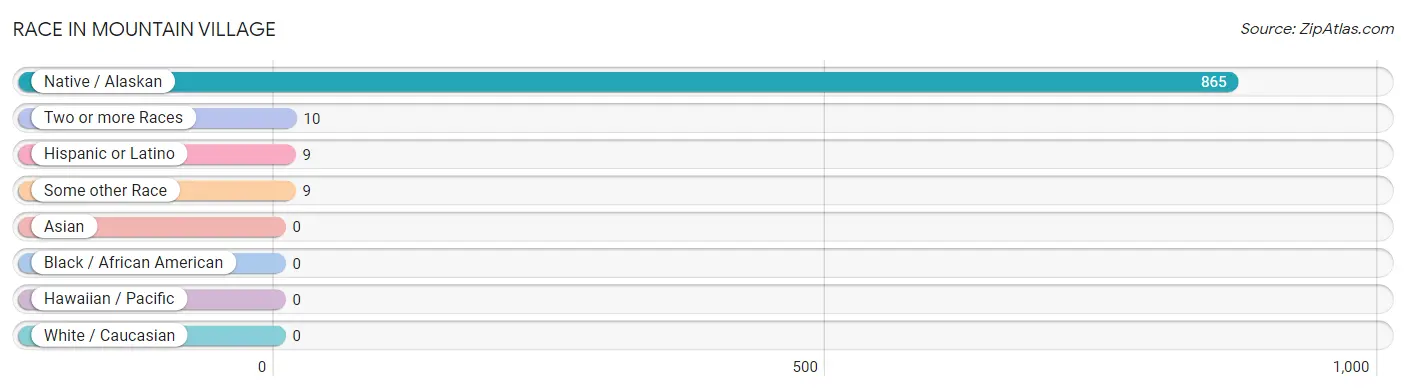
| Race | # Population | % Population |
| Asian | 0 | 0.0% |
| Black / African American | 0 | 0.0% |
| Hawaiian / Pacific | 0 | 0.0% |
| Hispanic or Latino | 9 | 1.0% |
| Native / Alaskan | 865 | 97.9% |
| White / Caucasian | 0 | 0.0% |
| Two or more Races | 10 | 1.1% |
| Some other Race | 9 | 1.0% |
| Total | 884 | 100.0% |
Ancestry in Mountain Village
The most populous ancestries reported in Mountain Village are Yup'ik (486 | 55.0%), Alaska Native (341 | 38.6%), Inupiat (24 | 2.7%), Alaskan Athabascan (11 | 1.2%), and Aleut (11 | 1.2%), together accounting for 98.7% of all Mountain Village residents.
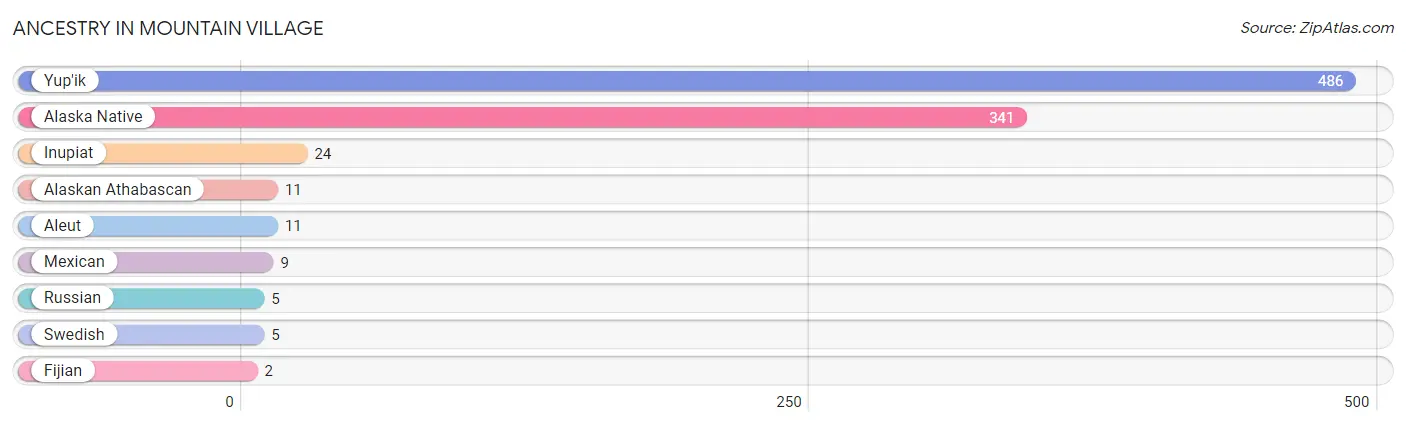
| Ancestry | # Population | % Population |
| Alaska Native | 341 | 38.6% |
| Alaskan Athabascan | 11 | 1.2% |
| Aleut | 11 | 1.2% |
| Fijian | 2 | 0.2% |
| Inupiat | 24 | 2.7% |
| Mexican | 9 | 1.0% |
| Russian | 5 | 0.6% |
| Swedish | 5 | 0.6% |
| Yup'ik | 486 | 55.0% | View All 9 Rows |
Immigrants in Mountain Village

| Immigration Origin | # Population | % Population | View All 0 Rows |
Sex and Age in Mountain Village
Sex and Age in Mountain Village
The most populous age groups in Mountain Village are 5 to 9 Years (77 | 16.8%) for men and 5 to 9 Years (67 | 15.8%) for women.
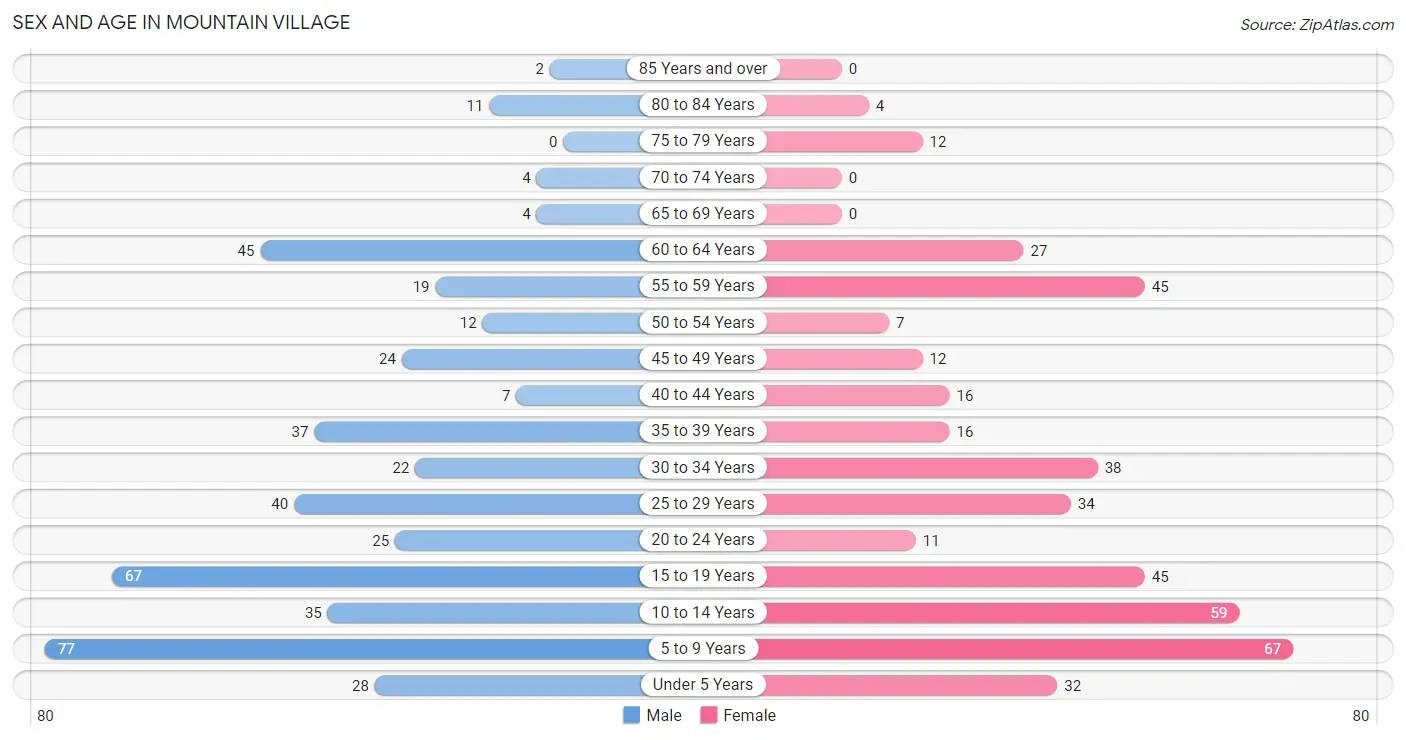
| Age Bracket | Male | Female |
| Under 5 Years | 28 (6.1%) | 32 (7.5%) |
| 5 to 9 Years | 77 (16.8%) | 67 (15.8%) |
| 10 to 14 Years | 35 (7.6%) | 59 (13.9%) |
| 15 to 19 Years | 67 (14.6%) | 45 (10.6%) |
| 20 to 24 Years | 25 (5.4%) | 11 (2.6%) |
| 25 to 29 Years | 40 (8.7%) | 34 (8.0%) |
| 30 to 34 Years | 22 (4.8%) | 38 (8.9%) |
| 35 to 39 Years | 37 (8.1%) | 16 (3.8%) |
| 40 to 44 Years | 7 (1.5%) | 16 (3.8%) |
| 45 to 49 Years | 24 (5.2%) | 12 (2.8%) |
| 50 to 54 Years | 12 (2.6%) | 7 (1.7%) |
| 55 to 59 Years | 19 (4.1%) | 45 (10.6%) |
| 60 to 64 Years | 45 (9.8%) | 27 (6.4%) |
| 65 to 69 Years | 4 (0.9%) | 0 (0.0%) |
| 70 to 74 Years | 4 (0.9%) | 0 (0.0%) |
| 75 to 79 Years | 0 (0.0%) | 12 (2.8%) |
| 80 to 84 Years | 11 (2.4%) | 4 (0.9%) |
| 85 Years and over | 2 (0.4%) | 0 (0.0%) |
| Total | 459 (100.0%) | 425 (100.0%) |
Families and Households in Mountain Village
Median Family Size in Mountain Village
The median family size in Mountain Village is 4.30 persons per family, with married-couple families (65 | 37.4%) accounting for the largest median family size of 6.85 persons per family. On the other hand, single male/father families (22 | 12.6%) represent the smallest median family size with 2.59 persons per family.
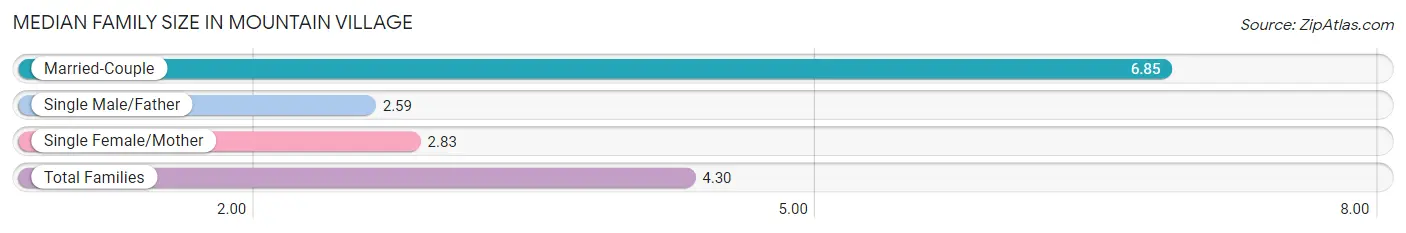
| Family Type | # Families | Family Size |
| Married-Couple | 65 (37.4%) | 6.85 |
| Single Male/Father | 22 (12.6%) | 2.59 |
| Single Female/Mother | 87 (50.0%) | 2.83 |
| Total Families | 174 (100.0%) | 4.30 |
Median Household Size in Mountain Village
The median household size in Mountain Village is 4.42 persons per household, with married-couple households (65 | 32.5%) accounting for the largest median household size of 7.17 persons per household. non-family households (26 | 13.0%) represent the smallest median household size with 2.85 persons per household.
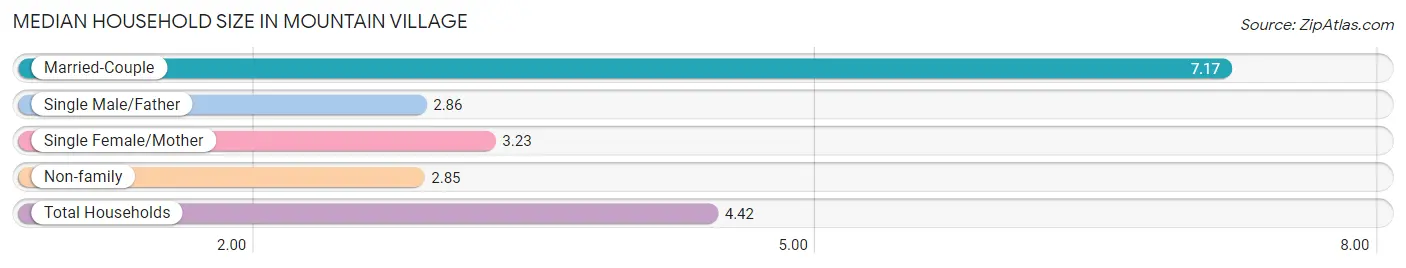
| Household Type | # Households | Household Size |
| Married-Couple | 65 (32.5%) | 7.17 |
| Single Male/Father | 22 (11.0%) | 2.86 |
| Single Female/Mother | 87 (43.5%) | 3.23 |
| Non-family | 26 (13.0%) | 2.85 |
| Total Households | 200 (100.0%) | 4.42 |
Household Size by Marriage Status in Mountain Village
Out of a total of 200 households in Mountain Village, 174 (87.0%) are family households, while 26 (13.0%) are nonfamily households. The most numerous type of family households are 2-person households, comprising 58, and the most common type of nonfamily households are 2-person households, comprising 11.
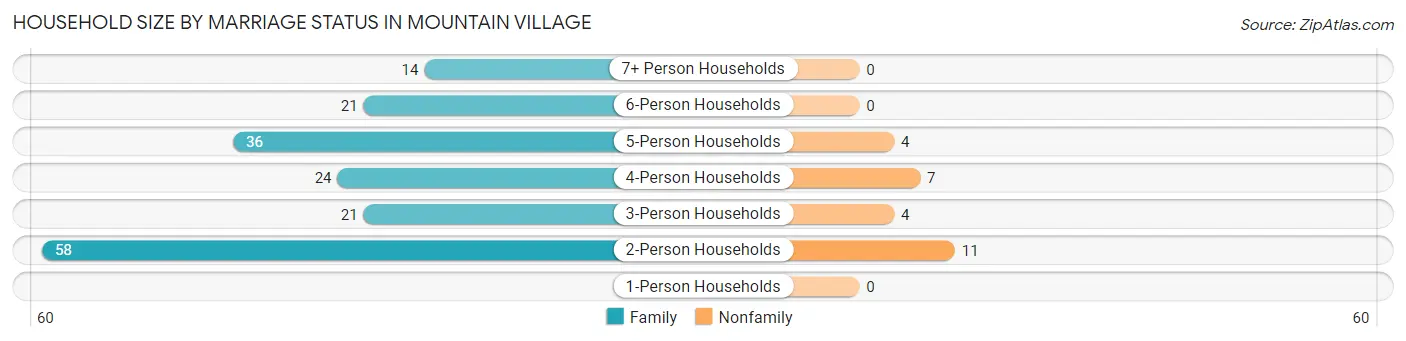
| Household Size | Family Households | Nonfamily Households |
| 1-Person Households | - | 0 (0.0%) |
| 2-Person Households | 58 (29.0%) | 11 (5.5%) |
| 3-Person Households | 21 (10.5%) | 4 (2.0%) |
| 4-Person Households | 24 (12.0%) | 7 (3.5%) |
| 5-Person Households | 36 (18.0%) | 4 (2.0%) |
| 6-Person Households | 21 (10.5%) | 0 (0.0%) |
| 7+ Person Households | 14 (7.0%) | 0 (0.0%) |
| Total | 174 (87.0%) | 26 (13.0%) |
Female Fertility in Mountain Village
Fertility by Age in Mountain Village
Average fertility rate in Mountain Village is 35.0 births per 1,000 women. Women in the age bracket of 20 to 34 years have the highest fertility rate with 72.0 births per 1,000 women. Women in the age bracket of 20 to 34 years acount for 100.0% of all women with births.
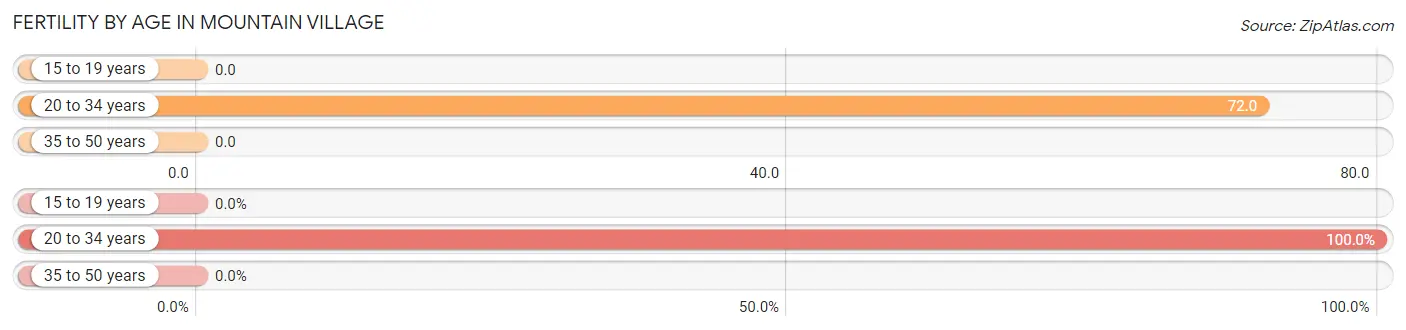
| Age Bracket | Women with Births | Births / 1,000 Women |
| 15 to 19 years | 0 (0.0%) | 0.0 |
| 20 to 34 years | 6 (100.0%) | 72.0 |
| 35 to 50 years | 0 (0.0%) | 0.0 |
| Total | 6 (100.0%) | 35.0 |
Fertility by Age by Marriage Status in Mountain Village
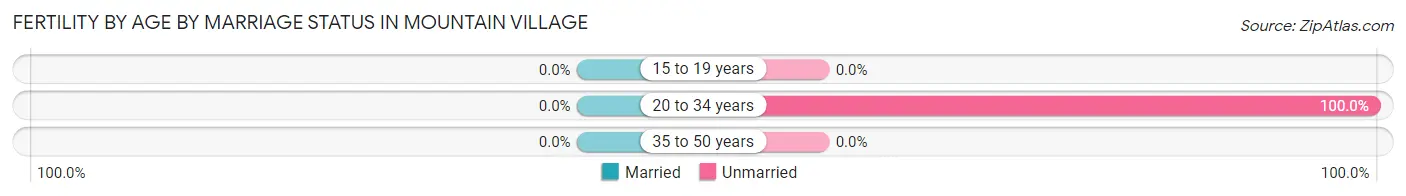
| Age Bracket | Married | Unmarried |
| 15 to 19 years | 0 (0.0%) | 0 (0.0%) |
| 20 to 34 years | 0 (0.0%) | 6 (100.0%) |
| 35 to 50 years | 0 (0.0%) | 0 (0.0%) |
| Total | 0 (0.0%) | 6 (100.0%) |
Fertility by Education in Mountain Village
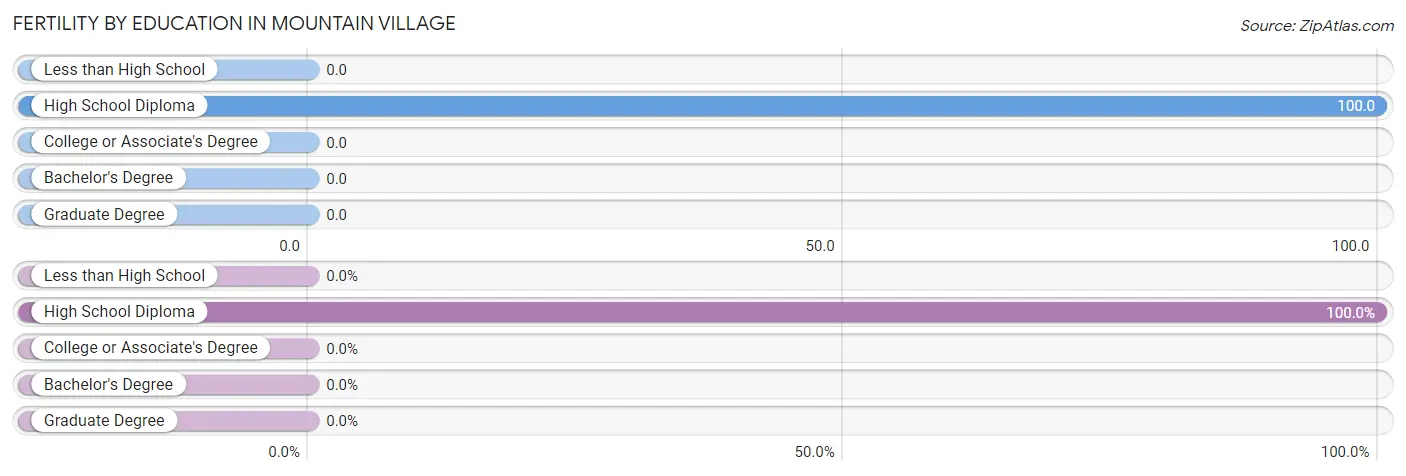
| Educational Attainment | Women with Births | Births / 1,000 Women |
| Less than High School | 0 (0.0%) | 0.0 |
| High School Diploma | 6 (100.0%) | 100.0 |
| College or Associate's Degree | 0 (0.0%) | 0.0 |
| Bachelor's Degree | 0 (0.0%) | 0.0 |
| Graduate Degree | 0 (0.0%) | 0.0 |
| Total | 6 (100.0%) | 35.0 |
Fertility by Education by Marriage Status in Mountain Village
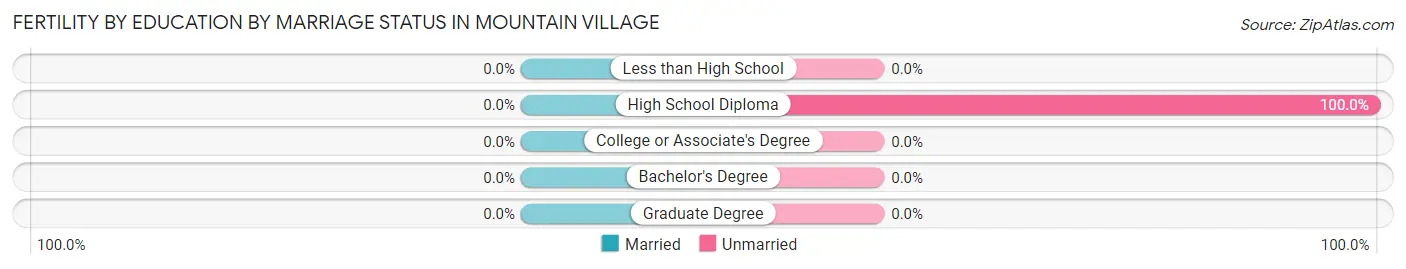
| Educational Attainment | Married | Unmarried |
| Less than High School | 0 (0.0%) | 0 (0.0%) |
| High School Diploma | 0 (0.0%) | 6 (100.0%) |
| College or Associate's Degree | 0 (0.0%) | 0 (0.0%) |
| Bachelor's Degree | 0 (0.0%) | 0 (0.0%) |
| Graduate Degree | 0 (0.0%) | 0 (0.0%) |
| Total | 0 (0.0%) | 6 (100.0%) |
Employment Characteristics in Mountain Village
Employment by Class of Employer in Mountain Village
Among the 208 employed individuals in Mountain Village, local government employees (114 | 54.8%), private company employees (40 | 19.2%), and not-for-profit organizations (24 | 11.5%) make up the most common classes of employment.
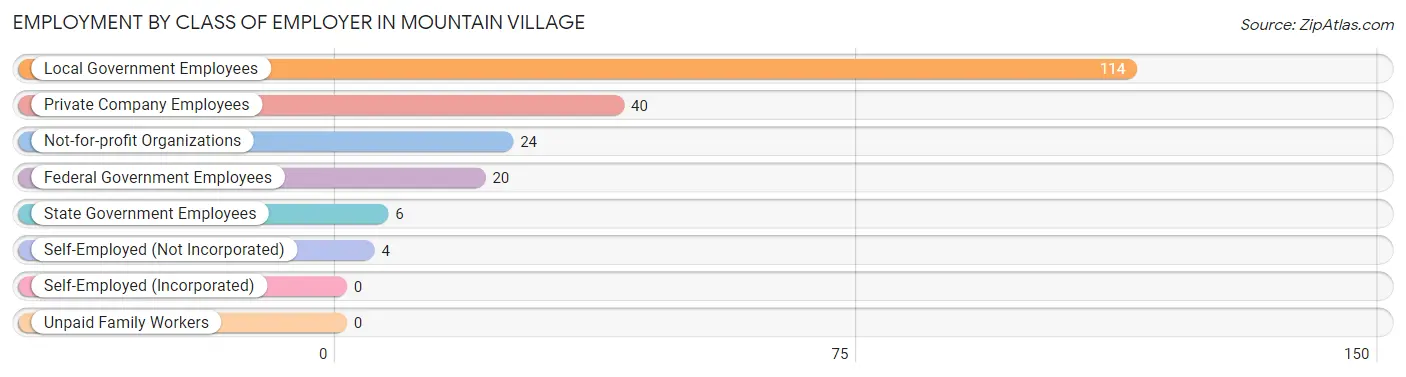
| Employer Class | # Employees | % Employees |
| Private Company Employees | 40 | 19.2% |
| Self-Employed (Incorporated) | 0 | 0.0% |
| Self-Employed (Not Incorporated) | 4 | 1.9% |
| Not-for-profit Organizations | 24 | 11.5% |
| Local Government Employees | 114 | 54.8% |
| State Government Employees | 6 | 2.9% |
| Federal Government Employees | 20 | 9.6% |
| Unpaid Family Workers | 0 | 0.0% |
| Total | 208 | 100.0% |
Employment Status by Age in Mountain Village
According to the labor force statistics for Mountain Village, out of the total population over 16 years of age (563), 44.4% or 250 individuals are in the labor force, with 15.0% or 38 of them unemployed. The age group with the highest labor force participation rate is 45 to 54 years, with 85.5% or 47 individuals in the labor force. Within the labor force, the 30 to 34 years age range has the highest percentage of unemployed individuals, with 39.3% or 11 of them being unemployed.
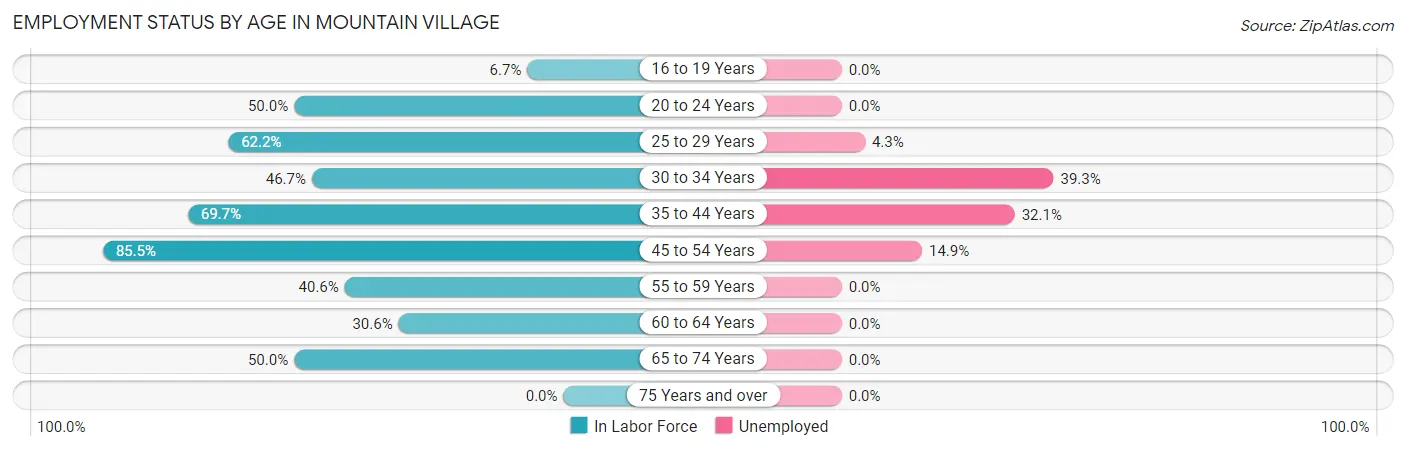
| Age Bracket | In Labor Force | Unemployed |
| 16 to 19 Years | 6 (6.7%) | 0 (0.0%) |
| 20 to 24 Years | 18 (50.0%) | 0 (0.0%) |
| 25 to 29 Years | 46 (62.2%) | 2 (4.3%) |
| 30 to 34 Years | 28 (46.7%) | 11 (39.3%) |
| 35 to 44 Years | 53 (69.7%) | 17 (32.1%) |
| 45 to 54 Years | 47 (85.5%) | 7 (14.9%) |
| 55 to 59 Years | 26 (40.6%) | 0 (0.0%) |
| 60 to 64 Years | 22 (30.6%) | 0 (0.0%) |
| 65 to 74 Years | 4 (50.0%) | 0 (0.0%) |
| 75 Years and over | 0 (0.0%) | 0 (0.0%) |
| Total | 250 (44.4%) | 38 (15.0%) |
Employment Status by Educational Attainment in Mountain Village
According to labor force statistics for Mountain Village, 55.4% of individuals (222) out of the total population between 25 and 64 years of age (401) are in the labor force, with 17.0% or 38 of them being unemployed. The group with the highest labor force participation rate are those with the educational attainment of bachelor's degree or higher, with 100.0% or 10 individuals in the labor force. Within the labor force, individuals with less than high school education have the highest percentage of unemployment, with 41.4% or 12 of them being unemployed.
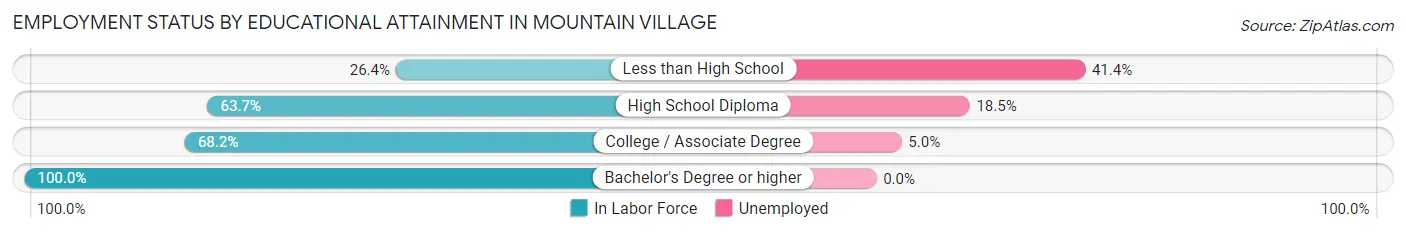
| Educational Attainment | In Labor Force | Unemployed |
| Less than High School | 29 (26.4%) | 46 (41.4%) |
| High School Diploma | 123 (63.7%) | 36 (18.5%) |
| College / Associate Degree | 60 (68.2%) | 4 (5.0%) |
| Bachelor's Degree or higher | 10 (100.0%) | 0 (0.0%) |
| Total | 222 (55.4%) | 68 (17.0%) |
Employment Occupations by Sex in Mountain Village
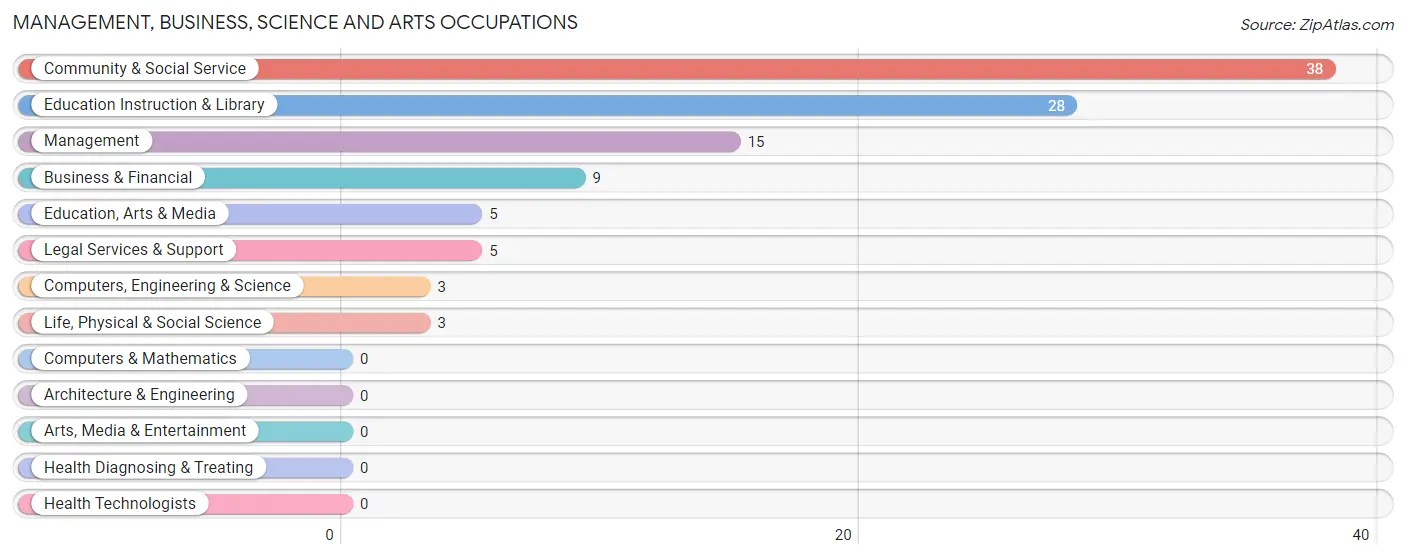
Management, Business, Science and Arts Occupations
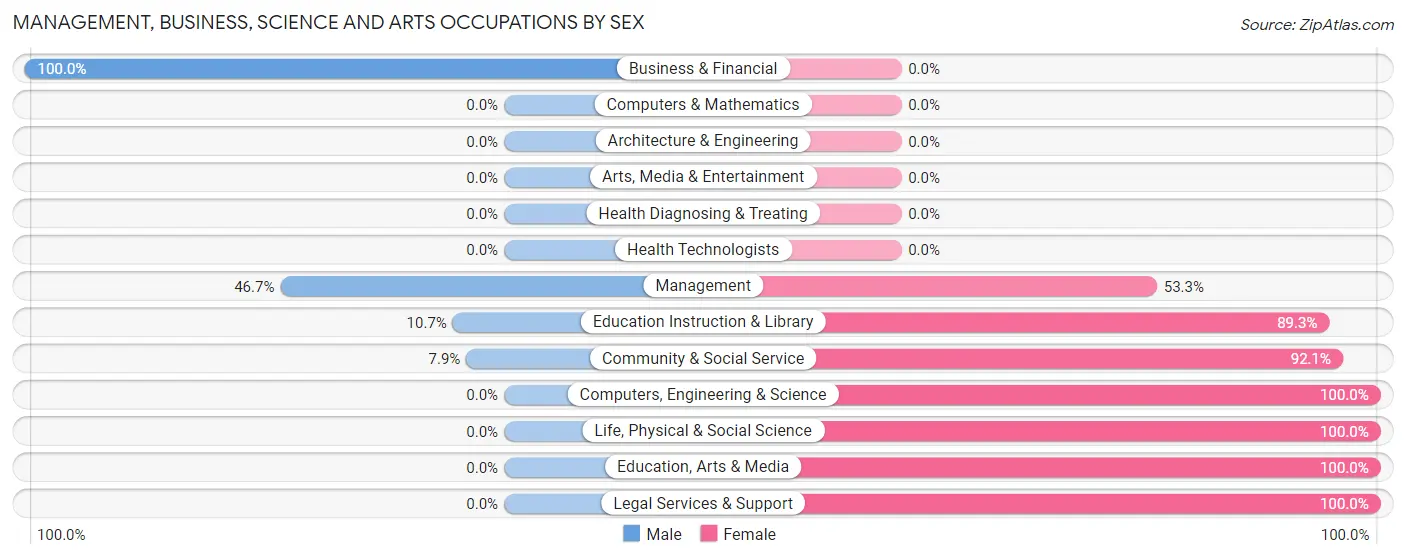
The most common Management, Business, Science and Arts occupations in Mountain Village are Community & Social Service (38 | 18.2%), Education Instruction & Library (28 | 13.4%), Management (15 | 7.2%), Business & Financial (9 | 4.3%), and Education, Arts & Media (5 | 2.4%).
Management, Business, Science and Arts Occupations by Sex
Within the Management, Business, Science and Arts occupations in Mountain Village, the most male-oriented occupations are Business & Financial (100.0%), Management (46.7%), and Education Instruction & Library (10.7%), while the most female-oriented occupations are Computers, Engineering & Science (100.0%), Life, Physical & Social Science (100.0%), and Education, Arts & Media (100.0%).
| Occupation | Male | Female |
| Management | 7 (46.7%) | 8 (53.3%) |
| Business & Financial | 9 (100.0%) | 0 (0.0%) |
| Computers, Engineering & Science | 0 (0.0%) | 3 (100.0%) |
| Computers & Mathematics | 0 (0.0%) | 0 (0.0%) |
| Architecture & Engineering | 0 (0.0%) | 0 (0.0%) |
| Life, Physical & Social Science | 0 (0.0%) | 3 (100.0%) |
| Community & Social Service | 3 (7.9%) | 35 (92.1%) |
| Education, Arts & Media | 0 (0.0%) | 5 (100.0%) |
| Legal Services & Support | 0 (0.0%) | 5 (100.0%) |
| Education Instruction & Library | 3 (10.7%) | 25 (89.3%) |
| Arts, Media & Entertainment | 0 (0.0%) | 0 (0.0%) |
| Health Diagnosing & Treating | 0 (0.0%) | 0 (0.0%) |
| Health Technologists | 0 (0.0%) | 0 (0.0%) |
| Total (Category) | 19 (29.2%) | 46 (70.8%) |
| Total (Overall) | 108 (51.7%) | 101 (48.3%) |
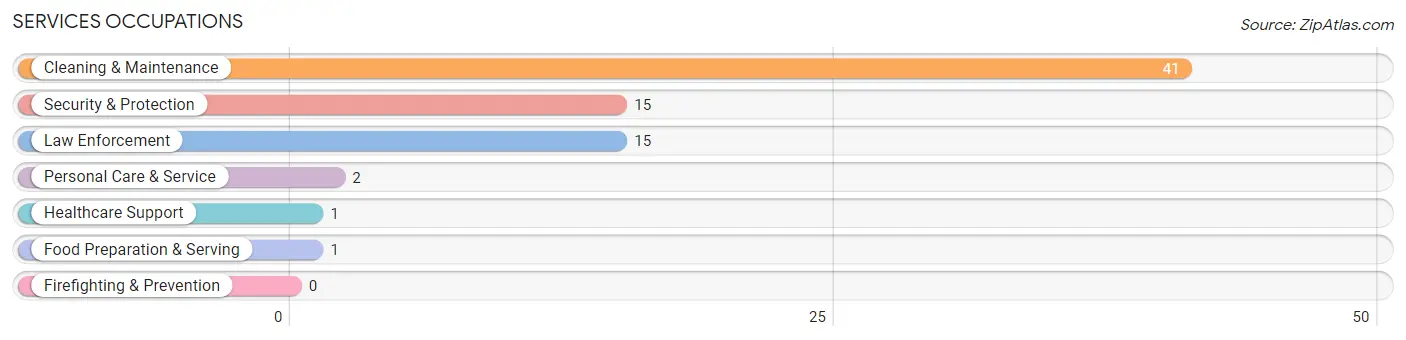
Services Occupations
The most common Services occupations in Mountain Village are Cleaning & Maintenance (41 | 19.6%), Security & Protection (15 | 7.2%), Law Enforcement (15 | 7.2%), Personal Care & Service (2 | 1.0%), and Healthcare Support (1 | 0.5%).
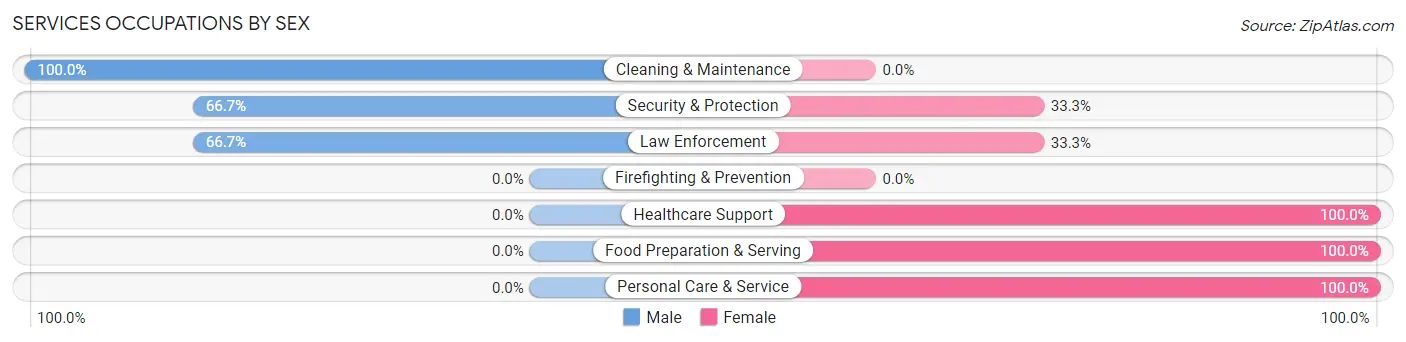
Services Occupations by Sex
Within the Services occupations in Mountain Village, the most male-oriented occupations are Cleaning & Maintenance (100.0%), Security & Protection (66.7%), and Law Enforcement (66.7%), while the most female-oriented occupations are Healthcare Support (100.0%), Food Preparation & Serving (100.0%), and Personal Care & Service (100.0%).
| Occupation | Male | Female |
| Healthcare Support | 0 (0.0%) | 1 (100.0%) |
| Security & Protection | 10 (66.7%) | 5 (33.3%) |
| Firefighting & Prevention | 0 (0.0%) | 0 (0.0%) |
| Law Enforcement | 10 (66.7%) | 5 (33.3%) |
| Food Preparation & Serving | 0 (0.0%) | 1 (100.0%) |
| Cleaning & Maintenance | 41 (100.0%) | 0 (0.0%) |
| Personal Care & Service | 0 (0.0%) | 2 (100.0%) |
| Total (Category) | 51 (85.0%) | 9 (15.0%) |
| Total (Overall) | 108 (51.7%) | 101 (48.3%) |
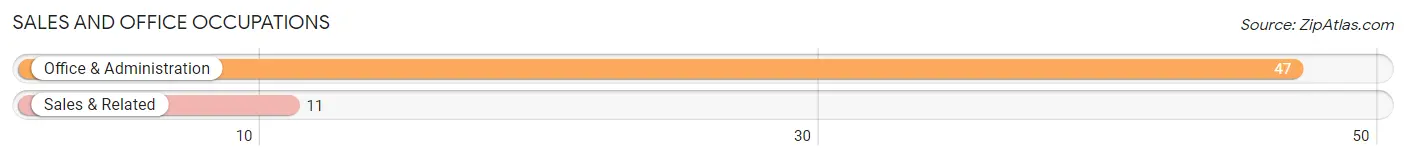
Sales and Office Occupations
The most common Sales and Office occupations in Mountain Village are Office & Administration (47 | 22.5%), and Sales & Related (11 | 5.3%).
Sales and Office Occupations by Sex
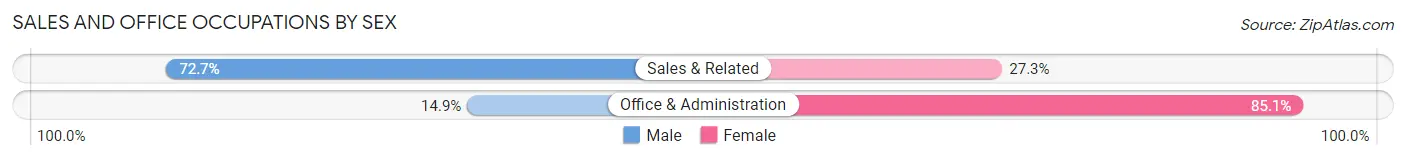
| Occupation | Male | Female |
| Sales & Related | 8 (72.7%) | 3 (27.3%) |
| Office & Administration | 7 (14.9%) | 40 (85.1%) |
| Total (Category) | 15 (25.9%) | 43 (74.1%) |
| Total (Overall) | 108 (51.7%) | 101 (48.3%) |
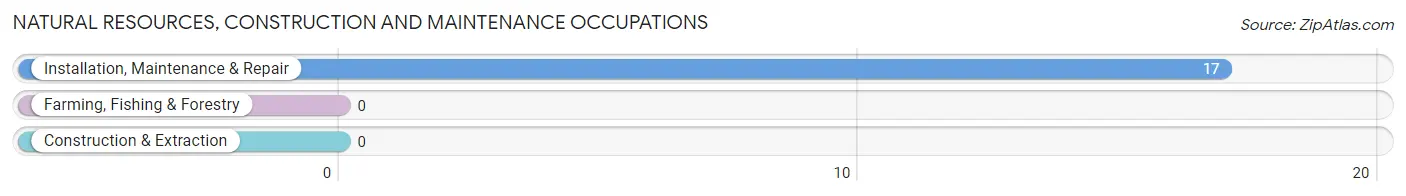
Natural Resources, Construction and Maintenance Occupations
The most common Natural Resources, Construction and Maintenance occupations in Mountain Village are , and Installation, Maintenance & Repair (17 | 8.1%).
Natural Resources, Construction and Maintenance Occupations by Sex
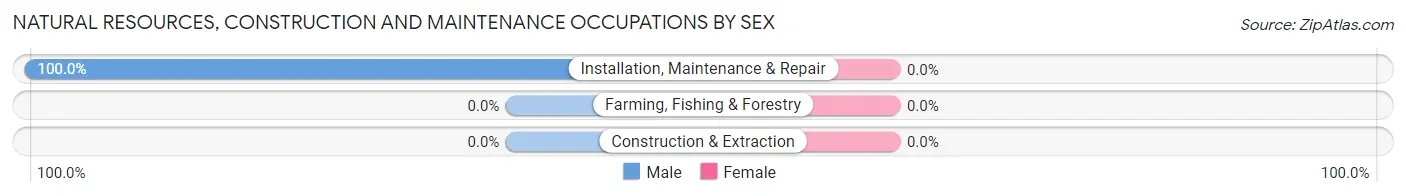
| Occupation | Male | Female |
| Farming, Fishing & Forestry | 0 (0.0%) | 0 (0.0%) |
| Construction & Extraction | 0 (0.0%) | 0 (0.0%) |
| Installation, Maintenance & Repair | 17 (100.0%) | 0 (0.0%) |
| Total (Category) | 17 (100.0%) | 0 (0.0%) |
| Total (Overall) | 108 (51.7%) | 101 (48.3%) |
Production, Transportation and Moving Occupations
The most common Production, Transportation and Moving occupations in Mountain Village are Production (6 | 2.9%), and Transportation (3 | 1.4%).
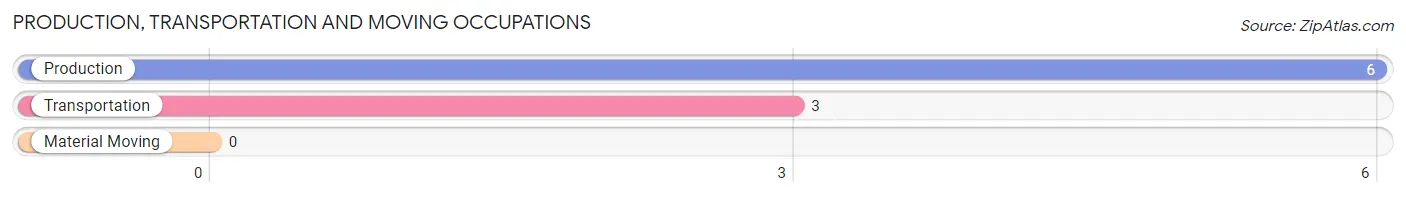
Production, Transportation and Moving Occupations by Sex
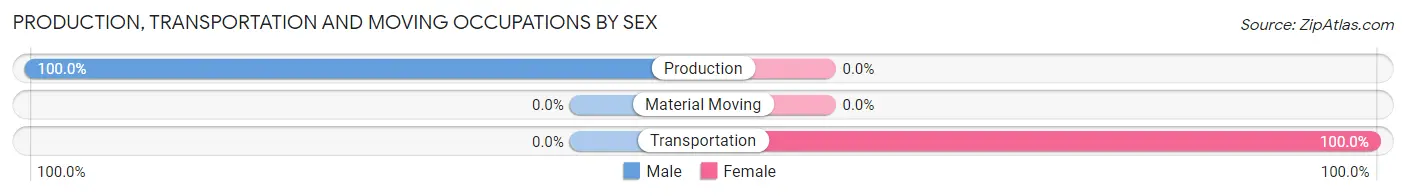
| Occupation | Male | Female |
| Production | 6 (100.0%) | 0 (0.0%) |
| Transportation | 0 (0.0%) | 3 (100.0%) |
| Material Moving | 0 (0.0%) | 0 (0.0%) |
| Total (Category) | 6 (66.7%) | 3 (33.3%) |
| Total (Overall) | 108 (51.7%) | 101 (48.3%) |
Employment Industries by Sex in Mountain Village
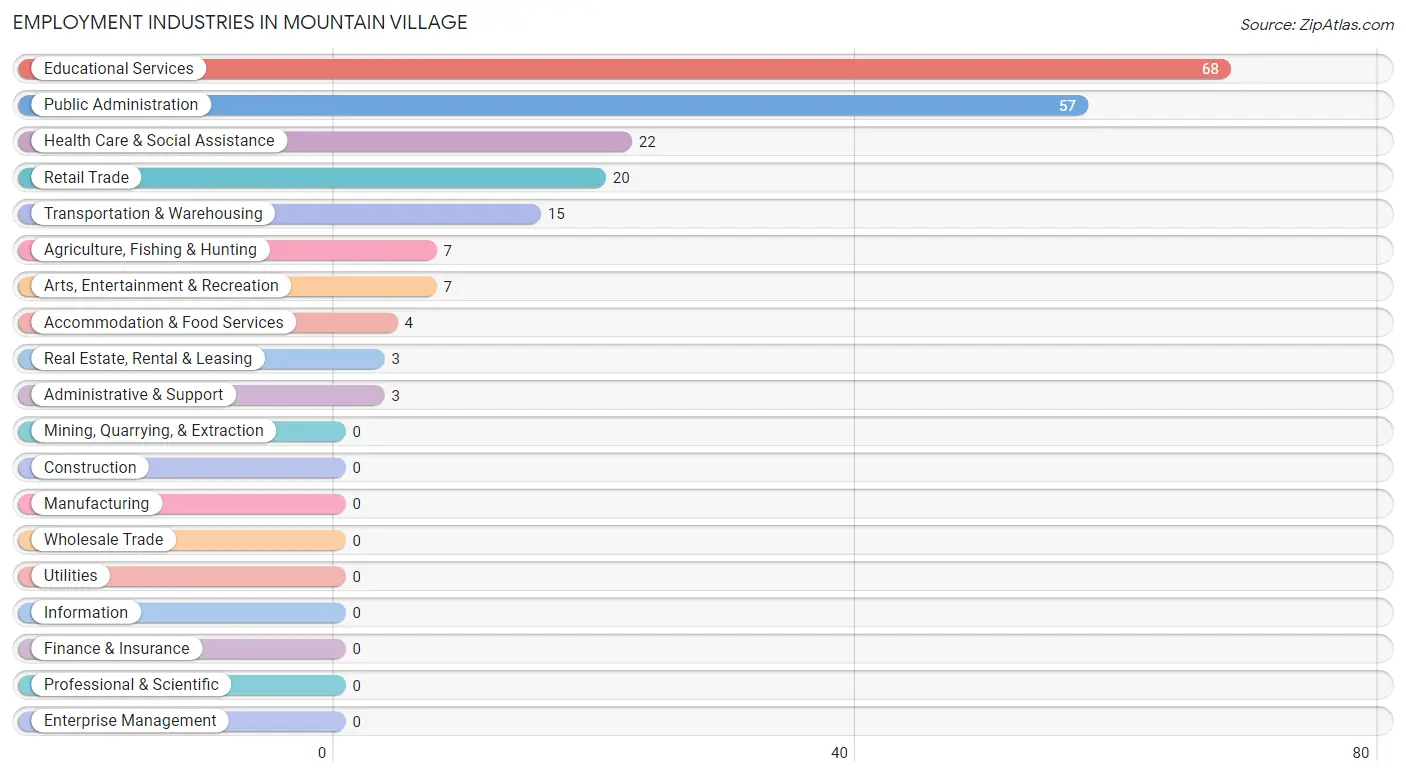
Employment Industries in Mountain Village
The major employment industries in Mountain Village include Educational Services (68 | 32.5%), Public Administration (57 | 27.3%), Health Care & Social Assistance (22 | 10.5%), Retail Trade (20 | 9.6%), and Transportation & Warehousing (15 | 7.2%).
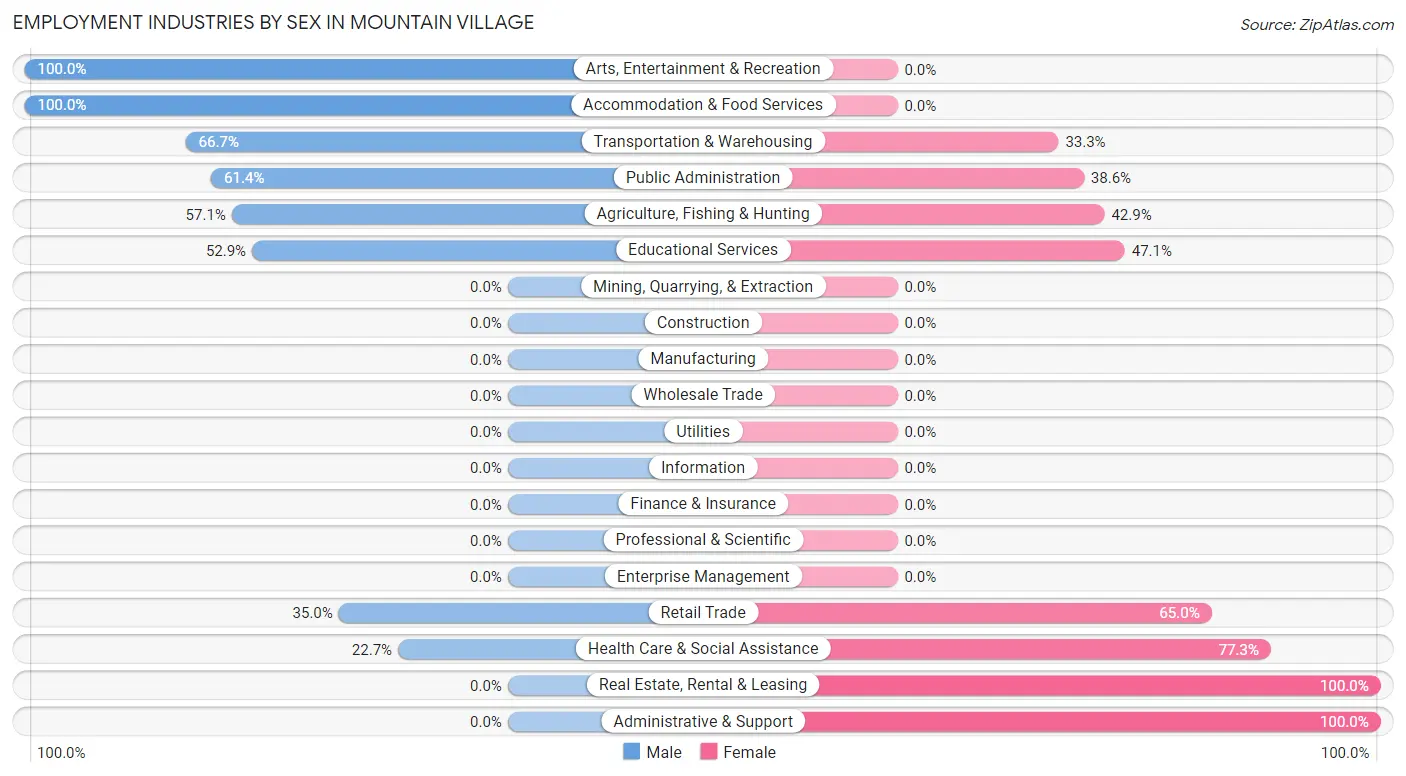
Employment Industries by Sex in Mountain Village
The Mountain Village industries that see more men than women are Arts, Entertainment & Recreation (100.0%), Accommodation & Food Services (100.0%), and Transportation & Warehousing (66.7%), whereas the industries that tend to have a higher number of women are Real Estate, Rental & Leasing (100.0%), Administrative & Support (100.0%), and Health Care & Social Assistance (77.3%).
| Industry | Male | Female |
| Agriculture, Fishing & Hunting | 4 (57.1%) | 3 (42.9%) |
| Mining, Quarrying, & Extraction | 0 (0.0%) | 0 (0.0%) |
| Construction | 0 (0.0%) | 0 (0.0%) |
| Manufacturing | 0 (0.0%) | 0 (0.0%) |
| Wholesale Trade | 0 (0.0%) | 0 (0.0%) |
| Retail Trade | 7 (35.0%) | 13 (65.0%) |
| Transportation & Warehousing | 10 (66.7%) | 5 (33.3%) |
| Utilities | 0 (0.0%) | 0 (0.0%) |
| Information | 0 (0.0%) | 0 (0.0%) |
| Finance & Insurance | 0 (0.0%) | 0 (0.0%) |
| Real Estate, Rental & Leasing | 0 (0.0%) | 3 (100.0%) |
| Professional & Scientific | 0 (0.0%) | 0 (0.0%) |
| Enterprise Management | 0 (0.0%) | 0 (0.0%) |
| Administrative & Support | 0 (0.0%) | 3 (100.0%) |
| Educational Services | 36 (52.9%) | 32 (47.1%) |
| Health Care & Social Assistance | 5 (22.7%) | 17 (77.3%) |
| Arts, Entertainment & Recreation | 7 (100.0%) | 0 (0.0%) |
| Accommodation & Food Services | 4 (100.0%) | 0 (0.0%) |
| Public Administration | 35 (61.4%) | 22 (38.6%) |
| Total | 108 (51.7%) | 101 (48.3%) |
Education in Mountain Village
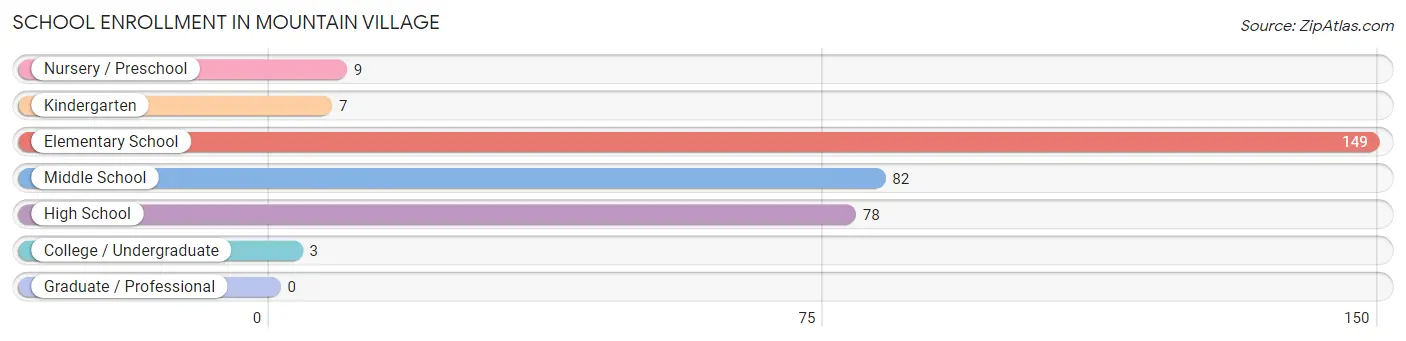
School Enrollment in Mountain Village
The most common levels of schooling among the 328 students in Mountain Village are elementary school (149 | 45.4%), middle school (82 | 25.0%), and high school (78 | 23.8%).
| School Level | # Students | % Students |
| Nursery / Preschool | 9 | 2.7% |
| Kindergarten | 7 | 2.1% |
| Elementary School | 149 | 45.4% |
| Middle School | 82 | 25.0% |
| High School | 78 | 23.8% |
| College / Undergraduate | 3 | 0.9% |
| Graduate / Professional | 0 | 0.0% |
| Total | 328 | 100.0% |
School Enrollment by Age by Funding Source in Mountain Village
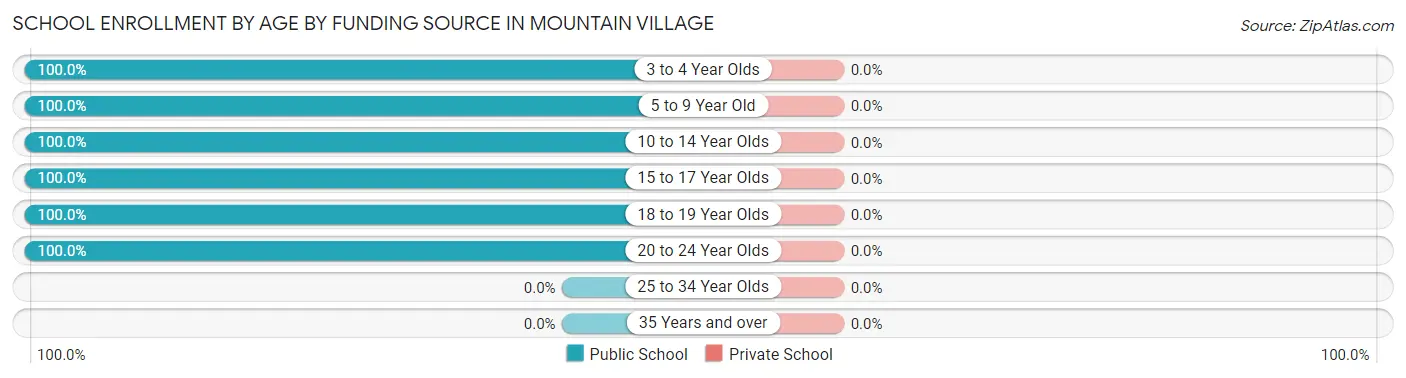
| Age Bracket | Public School | Private School |
| 3 to 4 Year Olds | 9 (100.0%) | 0 (0.0%) |
| 5 to 9 Year Old | 144 (100.0%) | 0 (0.0%) |
| 10 to 14 Year Olds | 94 (100.0%) | 0 (0.0%) |
| 15 to 17 Year Olds | 75 (100.0%) | 0 (0.0%) |
| 18 to 19 Year Olds | 3 (100.0%) | 0 (0.0%) |
| 20 to 24 Year Olds | 3 (100.0%) | 0 (0.0%) |
| 25 to 34 Year Olds | 0 (0.0%) | 0 (0.0%) |
| 35 Years and over | 0 (0.0%) | 0 (0.0%) |
| Total | 328 (100.0%) | 0 (0.0%) |
Educational Attainment by Field of Study in Mountain Village
Bio, nature & agricultural (7 | 50.0%), and physical & health sciences (7 | 50.0%) are the most common fields of study among 14 individuals in Mountain Village who have obtained a bachelor's degree or higher.
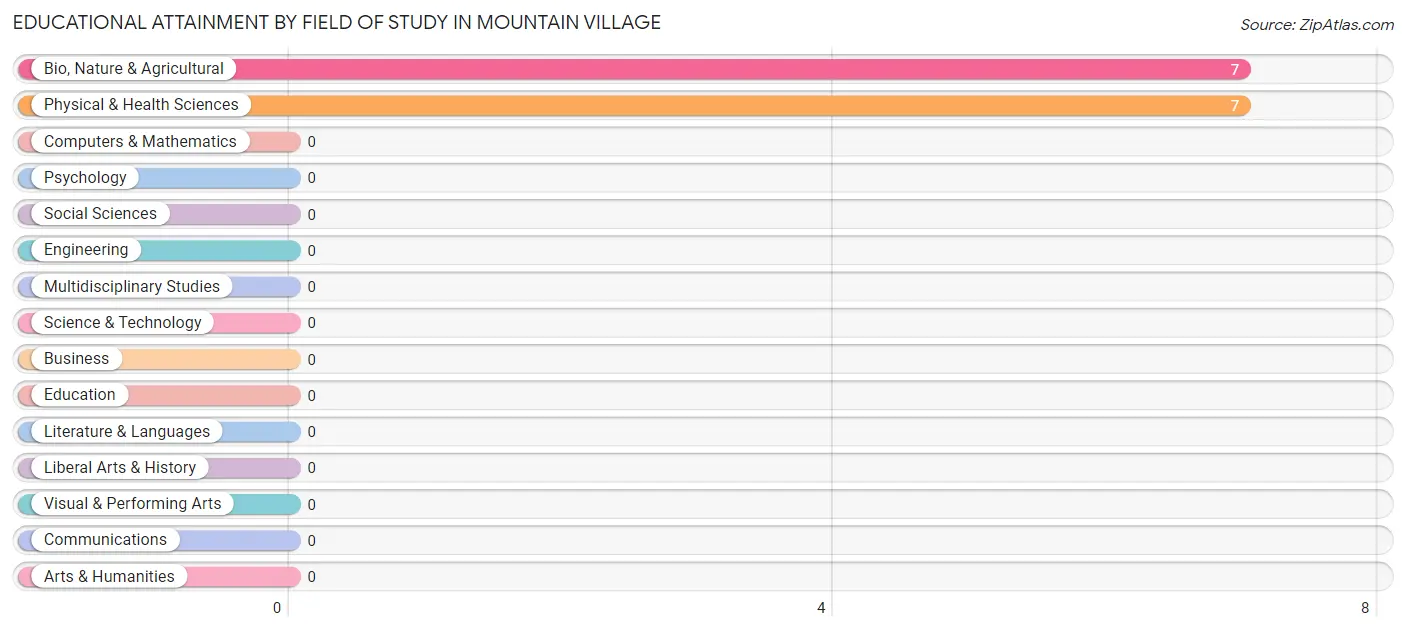
| Field of Study | # Graduates | % Graduates |
| Computers & Mathematics | 0 | 0.0% |
| Bio, Nature & Agricultural | 7 | 50.0% |
| Physical & Health Sciences | 7 | 50.0% |
| Psychology | 0 | 0.0% |
| Social Sciences | 0 | 0.0% |
| Engineering | 0 | 0.0% |
| Multidisciplinary Studies | 0 | 0.0% |
| Science & Technology | 0 | 0.0% |
| Business | 0 | 0.0% |
| Education | 0 | 0.0% |
| Literature & Languages | 0 | 0.0% |
| Liberal Arts & History | 0 | 0.0% |
| Visual & Performing Arts | 0 | 0.0% |
| Communications | 0 | 0.0% |
| Arts & Humanities | 0 | 0.0% |
| Total | 14 | 100.0% |
Transportation & Commute in Mountain Village
Vehicle Availability by Sex in Mountain Village
The most prevalent vehicle ownership categories in Mountain Village are males with no vehicle (66, accounting for 58.9%) and females with no vehicle (62, making up 68.8%).
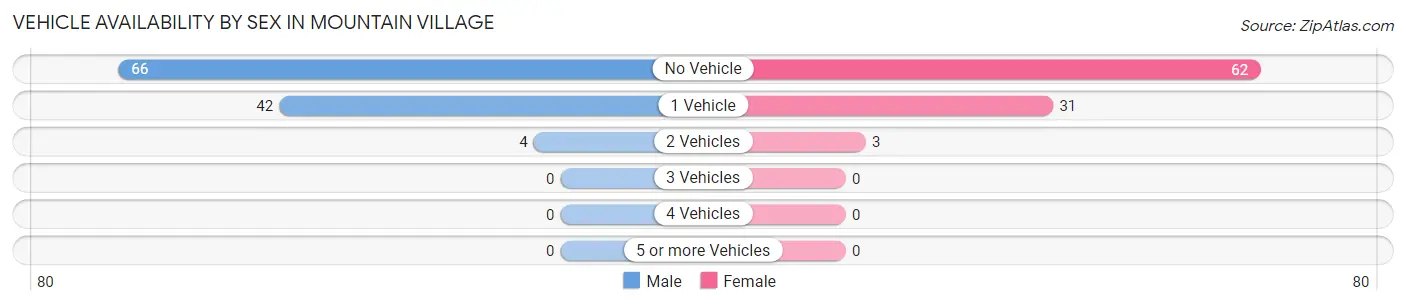
| Vehicles Available | Male | Female |
| No Vehicle | 66 (58.9%) | 62 (64.6%) |
| 1 Vehicle | 42 (37.5%) | 31 (32.3%) |
| 2 Vehicles | 4 (3.6%) | 3 (3.1%) |
| 3 Vehicles | 0 (0.0%) | 0 (0.0%) |
| 4 Vehicles | 0 (0.0%) | 0 (0.0%) |
| 5 or more Vehicles | 0 (0.0%) | 0 (0.0%) |
| Total | 112 (100.0%) | 96 (100.0%) |
Commute Time in Mountain Village
The most frequently occuring commute durations in Mountain Village are less than 5 minutes (85 commuters, 40.9%), 5 to 9 minutes (78 commuters, 37.5%), and 10 to 14 minutes (31 commuters, 14.9%).
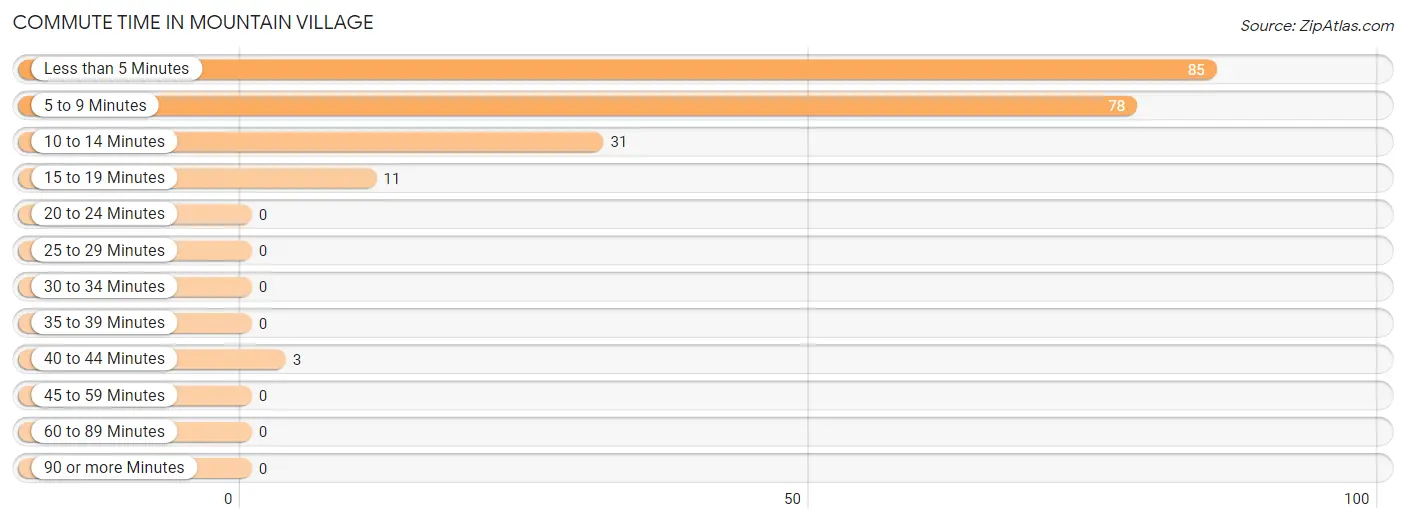
| Commute Time | # Commuters | % Commuters |
| Less than 5 Minutes | 85 | 40.9% |
| 5 to 9 Minutes | 78 | 37.5% |
| 10 to 14 Minutes | 31 | 14.9% |
| 15 to 19 Minutes | 11 | 5.3% |
| 20 to 24 Minutes | 0 | 0.0% |
| 25 to 29 Minutes | 0 | 0.0% |
| 30 to 34 Minutes | 0 | 0.0% |
| 35 to 39 Minutes | 0 | 0.0% |
| 40 to 44 Minutes | 3 | 1.4% |
| 45 to 59 Minutes | 0 | 0.0% |
| 60 to 89 Minutes | 0 | 0.0% |
| 90 or more Minutes | 0 | 0.0% |
Commute Time by Sex in Mountain Village
The most common commute times in Mountain Village are 5 to 9 minutes (54 commuters, 48.2%) for males and less than 5 minutes (51 commuters, 53.1%) for females.
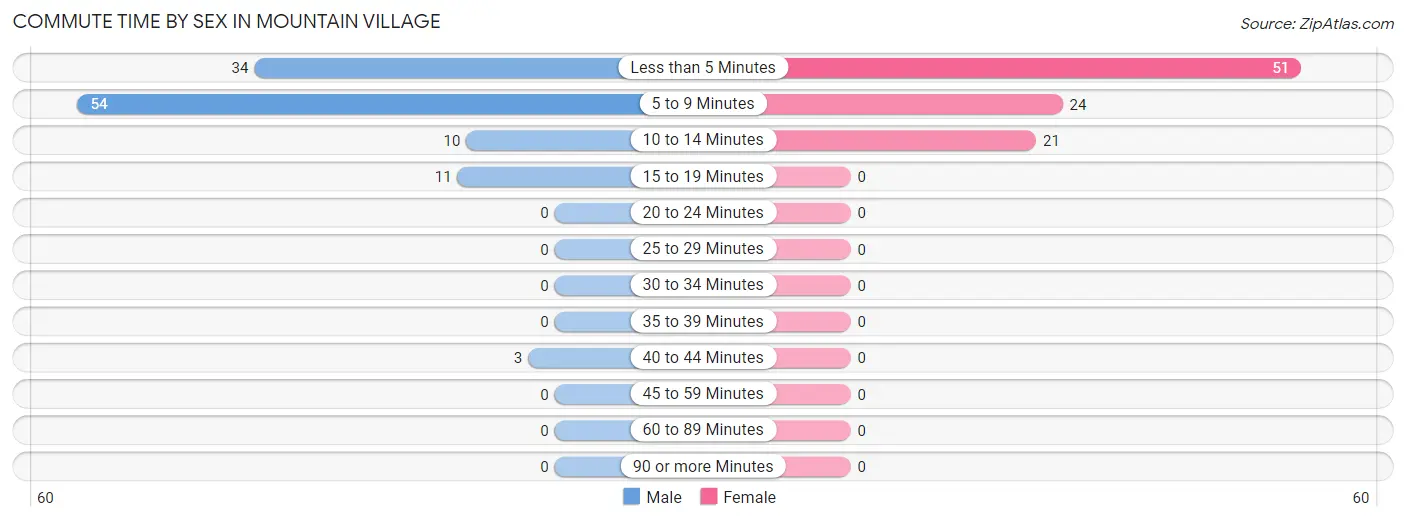
| Commute Time | Male | Female |
| Less than 5 Minutes | 34 (30.4%) | 51 (53.1%) |
| 5 to 9 Minutes | 54 (48.2%) | 24 (25.0%) |
| 10 to 14 Minutes | 10 (8.9%) | 21 (21.9%) |
| 15 to 19 Minutes | 11 (9.8%) | 0 (0.0%) |
| 20 to 24 Minutes | 0 (0.0%) | 0 (0.0%) |
| 25 to 29 Minutes | 0 (0.0%) | 0 (0.0%) |
| 30 to 34 Minutes | 0 (0.0%) | 0 (0.0%) |
| 35 to 39 Minutes | 0 (0.0%) | 0 (0.0%) |
| 40 to 44 Minutes | 3 (2.7%) | 0 (0.0%) |
| 45 to 59 Minutes | 0 (0.0%) | 0 (0.0%) |
| 60 to 89 Minutes | 0 (0.0%) | 0 (0.0%) |
| 90 or more Minutes | 0 (0.0%) | 0 (0.0%) |
Time of Departure to Work by Sex in Mountain Village
The most frequent times of departure to work in Mountain Village are 7:30 AM to 7:59 AM (40, 35.7%) for males and 8:00 AM to 8:29 AM (27, 28.1%) for females.
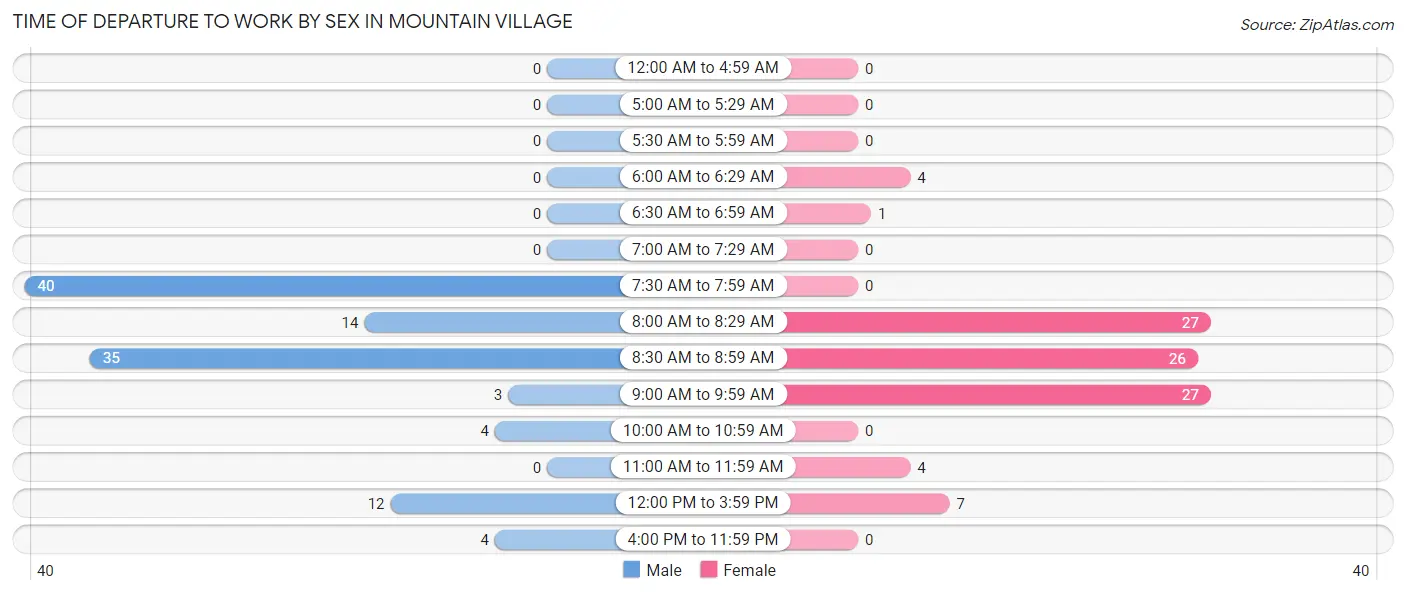
| Time of Departure | Male | Female |
| 12:00 AM to 4:59 AM | 0 (0.0%) | 0 (0.0%) |
| 5:00 AM to 5:29 AM | 0 (0.0%) | 0 (0.0%) |
| 5:30 AM to 5:59 AM | 0 (0.0%) | 0 (0.0%) |
| 6:00 AM to 6:29 AM | 0 (0.0%) | 4 (4.2%) |
| 6:30 AM to 6:59 AM | 0 (0.0%) | 1 (1.0%) |
| 7:00 AM to 7:29 AM | 0 (0.0%) | 0 (0.0%) |
| 7:30 AM to 7:59 AM | 40 (35.7%) | 0 (0.0%) |
| 8:00 AM to 8:29 AM | 14 (12.5%) | 27 (28.1%) |
| 8:30 AM to 8:59 AM | 35 (31.2%) | 26 (27.1%) |
| 9:00 AM to 9:59 AM | 3 (2.7%) | 27 (28.1%) |
| 10:00 AM to 10:59 AM | 4 (3.6%) | 0 (0.0%) |
| 11:00 AM to 11:59 AM | 0 (0.0%) | 4 (4.2%) |
| 12:00 PM to 3:59 PM | 12 (10.7%) | 7 (7.3%) |
| 4:00 PM to 11:59 PM | 4 (3.6%) | 0 (0.0%) |
| Total | 112 (100.0%) | 96 (100.0%) |
Housing Occupancy in Mountain Village
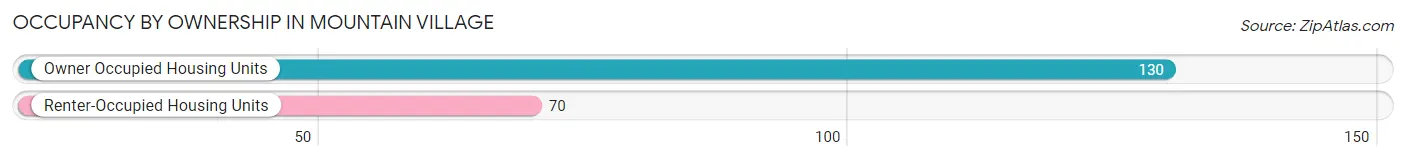
Occupancy by Ownership in Mountain Village
Of the total 200 dwellings in Mountain Village, owner-occupied units account for 130 (65.0%), while renter-occupied units make up 70 (35.0%).
| Occupancy | # Housing Units | % Housing Units |
| Owner Occupied Housing Units | 130 | 65.0% |
| Renter-Occupied Housing Units | 70 | 35.0% |
| Total Occupied Housing Units | 200 | 100.0% |
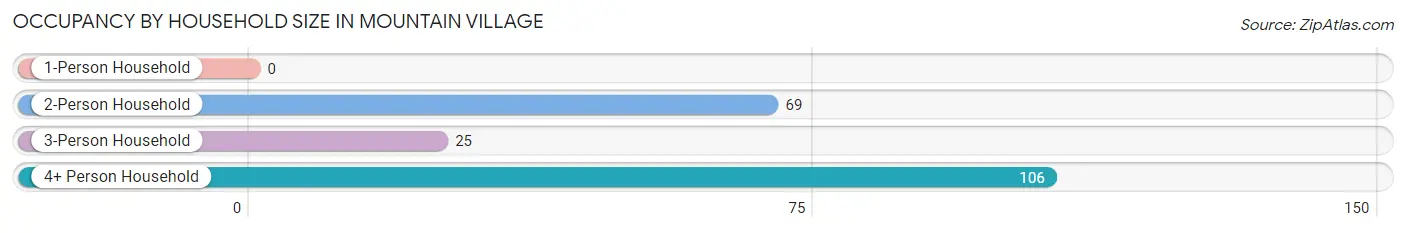
Occupancy by Household Size in Mountain Village
| Household Size | # Housing Units | % Housing Units |
| 1-Person Household | 0 | 0.0% |
| 2-Person Household | 69 | 34.5% |
| 3-Person Household | 25 | 12.5% |
| 4+ Person Household | 106 | 53.0% |
| Total Housing Units | 200 | 100.0% |
Occupancy by Ownership by Household Size in Mountain Village
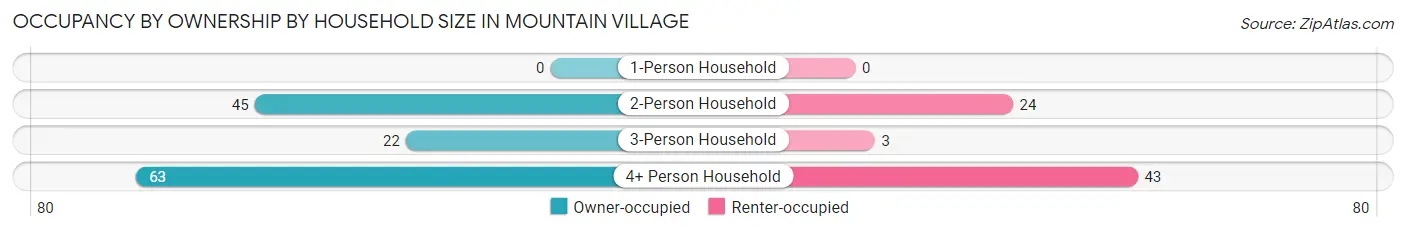
| Household Size | Owner-occupied | Renter-occupied |
| 1-Person Household | 0 (0.0%) | 0 (0.0%) |
| 2-Person Household | 45 (65.2%) | 24 (34.8%) |
| 3-Person Household | 22 (88.0%) | 3 (12.0%) |
| 4+ Person Household | 63 (59.4%) | 43 (40.6%) |
| Total Housing Units | 130 (65.0%) | 70 (35.0%) |
Occupancy by Educational Attainment in Mountain Village
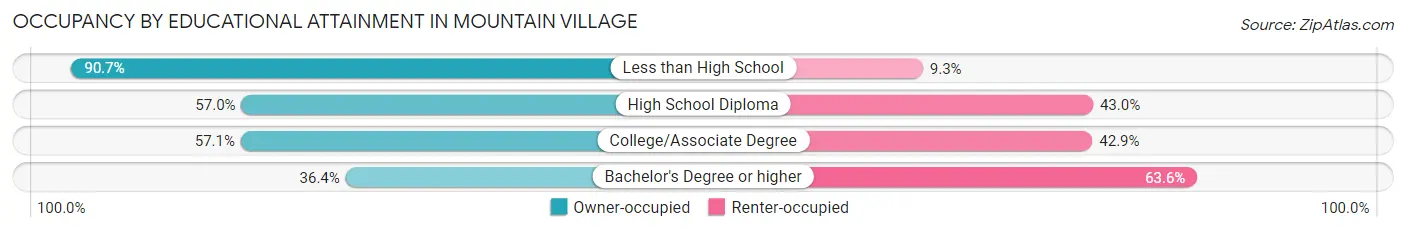
| Household Size | Owner-occupied | Renter-occupied |
| Less than High School | 49 (90.7%) | 5 (9.3%) |
| High School Diploma | 61 (57.0%) | 46 (43.0%) |
| College/Associate Degree | 16 (57.1%) | 12 (42.9%) |
| Bachelor's Degree or higher | 4 (36.4%) | 7 (63.6%) |
Occupancy by Age of Householder in Mountain Village
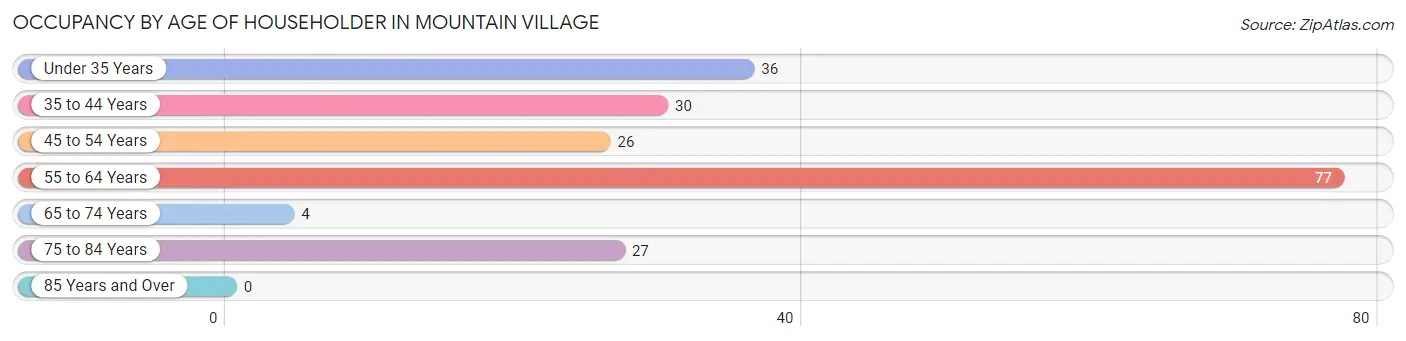
| Age Bracket | # Households | % Households |
| Under 35 Years | 36 | 18.0% |
| 35 to 44 Years | 30 | 15.0% |
| 45 to 54 Years | 26 | 13.0% |
| 55 to 64 Years | 77 | 38.5% |
| 65 to 74 Years | 4 | 2.0% |
| 75 to 84 Years | 27 | 13.5% |
| 85 Years and Over | 0 | 0.0% |
| Total | 200 | 100.0% |
Housing Finances in Mountain Village
Median Income by Occupancy in Mountain Village
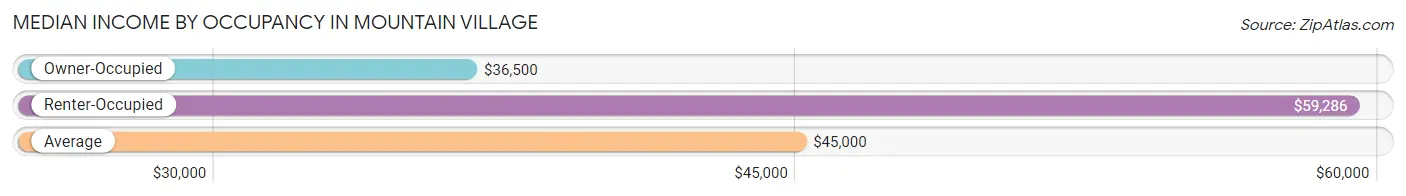
| Occupancy Type | # Households | Median Income |
| Owner-Occupied | 130 (65.0%) | $36,500 |
| Renter-Occupied | 70 (35.0%) | $59,286 |
| Average | 200 (100.0%) | $45,000 |
Occupancy by Householder Income Bracket in Mountain Village
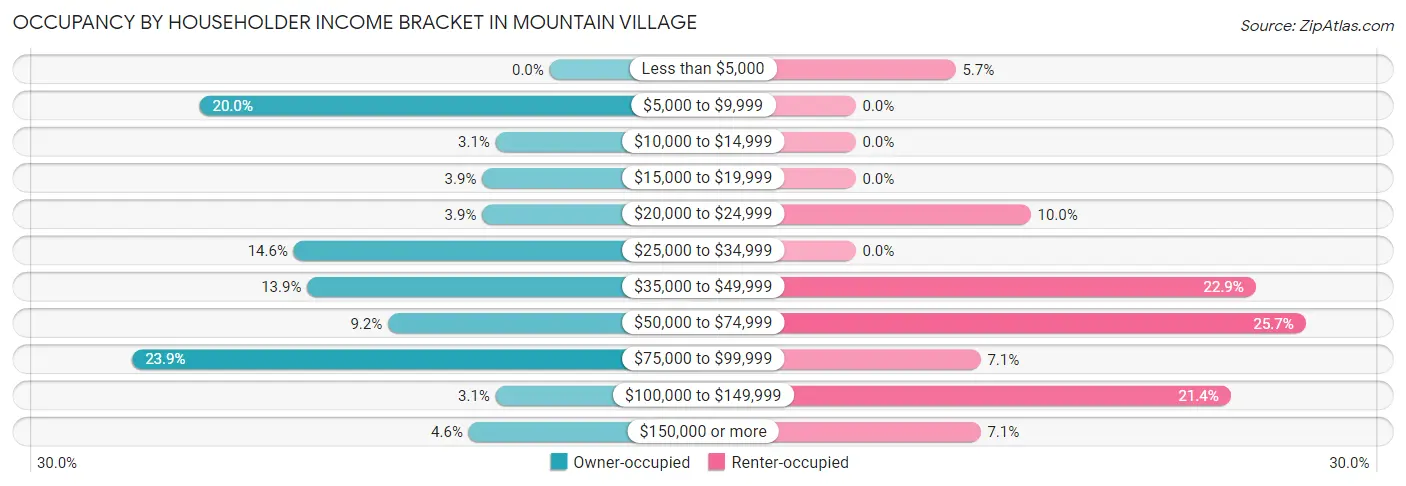
| Income Bracket | Owner-occupied | Renter-occupied |
| Less than $5,000 | 0 (0.0%) | 4 (5.7%) |
| $5,000 to $9,999 | 26 (20.0%) | 0 (0.0%) |
| $10,000 to $14,999 | 4 (3.1%) | 0 (0.0%) |
| $15,000 to $19,999 | 5 (3.8%) | 0 (0.0%) |
| $20,000 to $24,999 | 5 (3.8%) | 7 (10.0%) |
| $25,000 to $34,999 | 19 (14.6%) | 0 (0.0%) |
| $35,000 to $49,999 | 18 (13.9%) | 16 (22.9%) |
| $50,000 to $74,999 | 12 (9.2%) | 18 (25.7%) |
| $75,000 to $99,999 | 31 (23.8%) | 5 (7.1%) |
| $100,000 to $149,999 | 4 (3.1%) | 15 (21.4%) |
| $150,000 or more | 6 (4.6%) | 5 (7.1%) |
| Total | 130 (100.0%) | 70 (100.0%) |
Monthly Housing Cost Tiers in Mountain Village
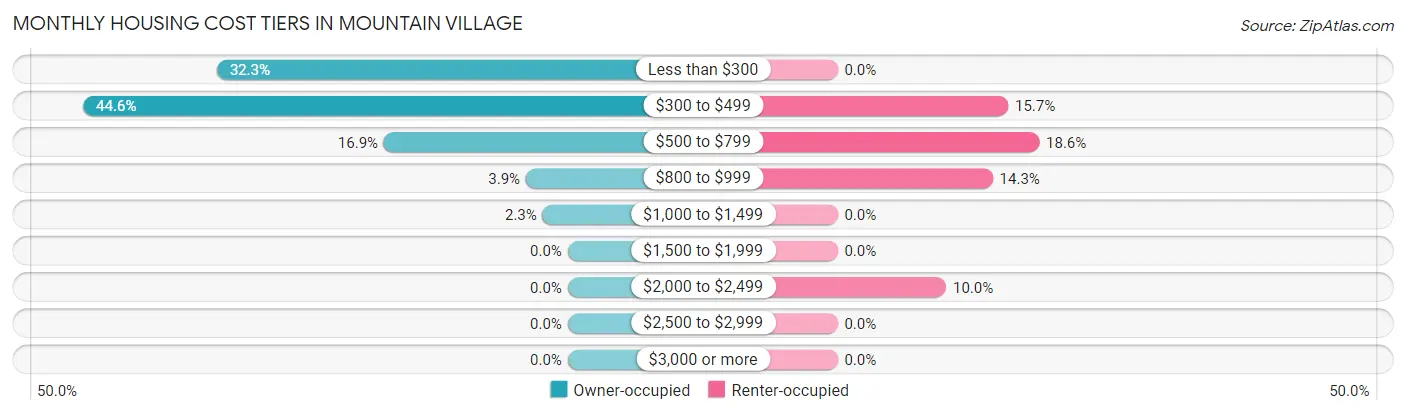
| Monthly Cost | Owner-occupied | Renter-occupied |
| Less than $300 | 42 (32.3%) | 0 (0.0%) |
| $300 to $499 | 58 (44.6%) | 11 (15.7%) |
| $500 to $799 | 22 (16.9%) | 13 (18.6%) |
| $800 to $999 | 5 (3.8%) | 10 (14.3%) |
| $1,000 to $1,499 | 3 (2.3%) | 0 (0.0%) |
| $1,500 to $1,999 | 0 (0.0%) | 0 (0.0%) |
| $2,000 to $2,499 | 0 (0.0%) | 7 (10.0%) |
| $2,500 to $2,999 | 0 (0.0%) | 0 (0.0%) |
| $3,000 or more | 0 (0.0%) | 0 (0.0%) |
| Total | 130 (100.0%) | 70 (100.0%) |
Physical Housing Characteristics in Mountain Village
Housing Structures in Mountain Village
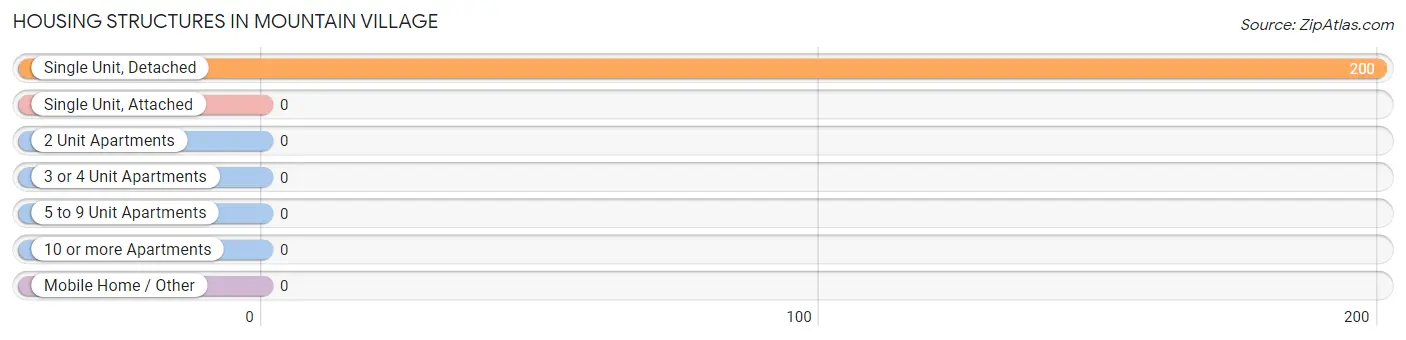
| Structure Type | # Housing Units | % Housing Units |
| Single Unit, Detached | 200 | 100.0% |
| Single Unit, Attached | 0 | 0.0% |
| 2 Unit Apartments | 0 | 0.0% |
| 3 or 4 Unit Apartments | 0 | 0.0% |
| 5 to 9 Unit Apartments | 0 | 0.0% |
| 10 or more Apartments | 0 | 0.0% |
| Mobile Home / Other | 0 | 0.0% |
| Total | 200 | 100.0% |
Housing Structures by Occupancy in Mountain Village
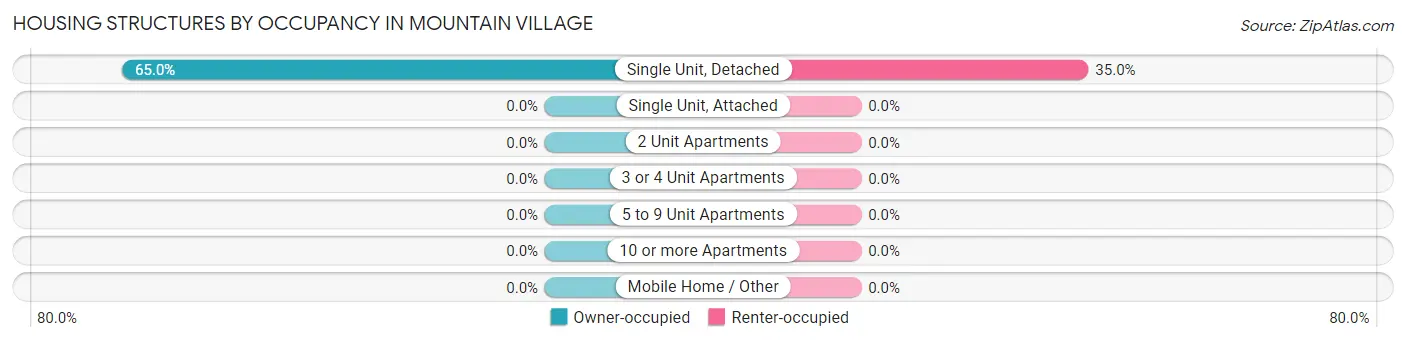
| Structure Type | Owner-occupied | Renter-occupied |
| Single Unit, Detached | 130 (65.0%) | 70 (35.0%) |
| Single Unit, Attached | 0 (0.0%) | 0 (0.0%) |
| 2 Unit Apartments | 0 (0.0%) | 0 (0.0%) |
| 3 or 4 Unit Apartments | 0 (0.0%) | 0 (0.0%) |
| 5 to 9 Unit Apartments | 0 (0.0%) | 0 (0.0%) |
| 10 or more Apartments | 0 (0.0%) | 0 (0.0%) |
| Mobile Home / Other | 0 (0.0%) | 0 (0.0%) |
| Total | 130 (65.0%) | 70 (35.0%) |
Housing Structures by Number of Rooms in Mountain Village
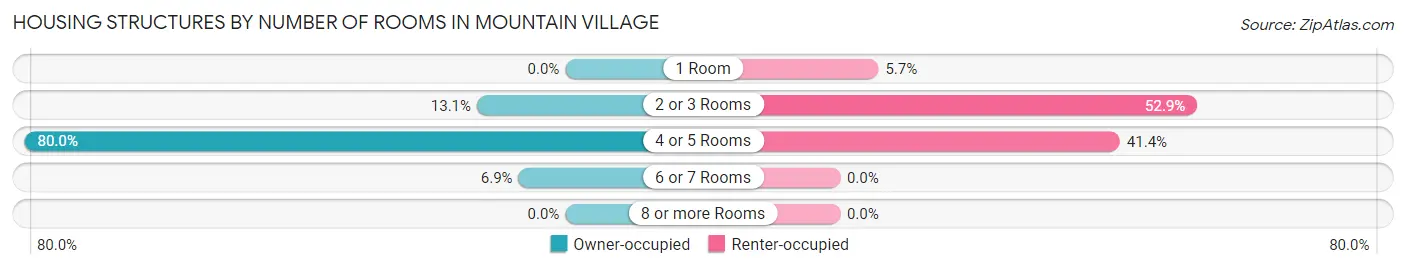
| Number of Rooms | Owner-occupied | Renter-occupied |
| 1 Room | 0 (0.0%) | 4 (5.7%) |
| 2 or 3 Rooms | 17 (13.1%) | 37 (52.9%) |
| 4 or 5 Rooms | 104 (80.0%) | 29 (41.4%) |
| 6 or 7 Rooms | 9 (6.9%) | 0 (0.0%) |
| 8 or more Rooms | 0 (0.0%) | 0 (0.0%) |
| Total | 130 (100.0%) | 70 (100.0%) |
Housing Structure by Heating Type in Mountain Village
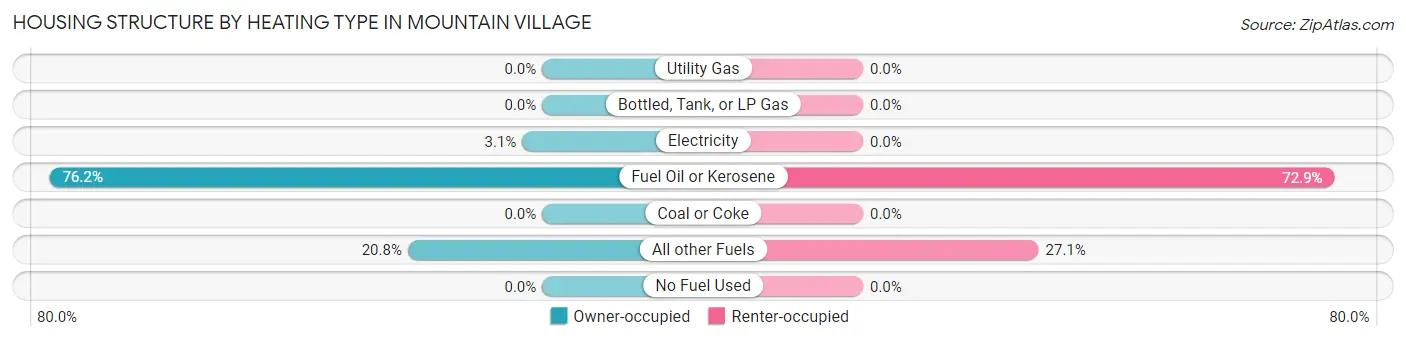
| Heating Type | Owner-occupied | Renter-occupied |
| Utility Gas | 0 (0.0%) | 0 (0.0%) |
| Bottled, Tank, or LP Gas | 0 (0.0%) | 0 (0.0%) |
| Electricity | 4 (3.1%) | 0 (0.0%) |
| Fuel Oil or Kerosene | 99 (76.1%) | 51 (72.9%) |
| Coal or Coke | 0 (0.0%) | 0 (0.0%) |
| All other Fuels | 27 (20.8%) | 19 (27.1%) |
| No Fuel Used | 0 (0.0%) | 0 (0.0%) |
| Total | 130 (100.0%) | 70 (100.0%) |
Household Vehicle Usage in Mountain Village
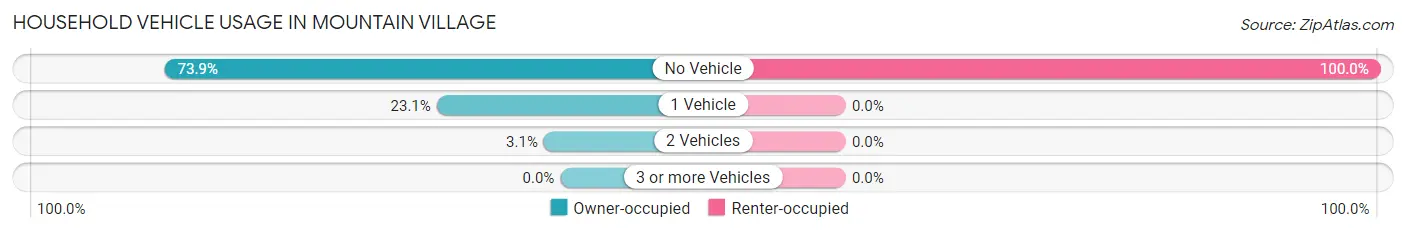
| Vehicles per Household | Owner-occupied | Renter-occupied |
| No Vehicle | 96 (73.9%) | 70 (100.0%) |
| 1 Vehicle | 30 (23.1%) | 0 (0.0%) |
| 2 Vehicles | 4 (3.1%) | 0 (0.0%) |
| 3 or more Vehicles | 0 (0.0%) | 0 (0.0%) |
| Total | 130 (100.0%) | 70 (100.0%) |
Real Estate & Mortgages in Mountain Village
Real Estate and Mortgage Overview in Mountain Village
| Characteristic | Without Mortgage | With Mortgage |
| Housing Units | 130 | 0 |
| Median Property Value | - | - |
| Median Household Income | $36,500 | $0 |
| Monthly Housing Costs | $337 | $0 |
| Real Estate Taxes | - | - |
Property Value by Mortgage Status in Mountain Village
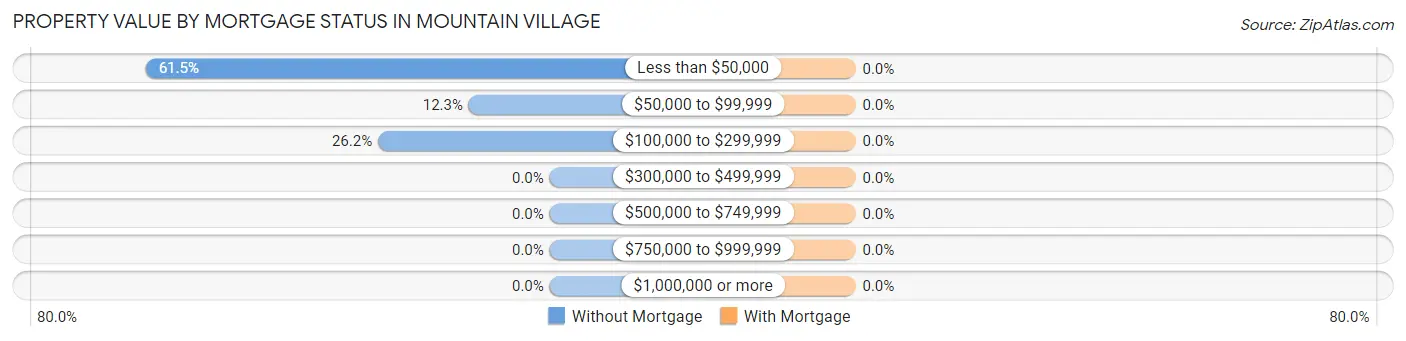
| Property Value | Without Mortgage | With Mortgage |
| Less than $50,000 | 80 (61.5%) | 0 (0.0%) |
| $50,000 to $99,999 | 16 (12.3%) | 0 (0.0%) |
| $100,000 to $299,999 | 34 (26.2%) | 0 (0.0%) |
| $300,000 to $499,999 | 0 (0.0%) | 0 (0.0%) |
| $500,000 to $749,999 | 0 (0.0%) | 0 (0.0%) |
| $750,000 to $999,999 | 0 (0.0%) | 0 (0.0%) |
| $1,000,000 or more | 0 (0.0%) | 0 (0.0%) |
| Total | 130 (100.0%) | 0 (0.0%) |
Household Income by Mortgage Status in Mountain Village
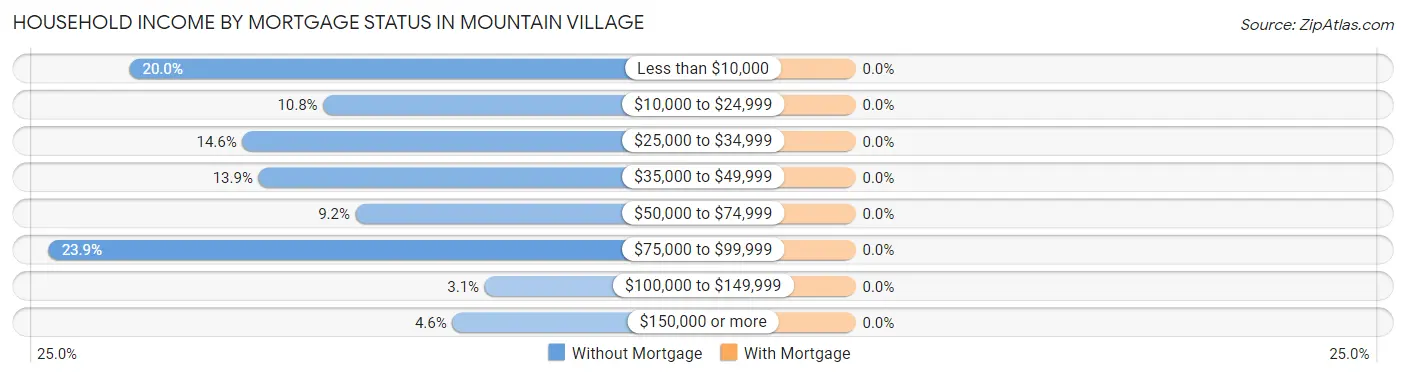
| Household Income | Without Mortgage | With Mortgage |
| Less than $10,000 | 26 (20.0%) | 0 (0.0%) |
| $10,000 to $24,999 | 14 (10.8%) | 0 (0.0%) |
| $25,000 to $34,999 | 19 (14.6%) | 0 (0.0%) |
| $35,000 to $49,999 | 18 (13.9%) | 0 (0.0%) |
| $50,000 to $74,999 | 12 (9.2%) | 0 (0.0%) |
| $75,000 to $99,999 | 31 (23.8%) | 0 (0.0%) |
| $100,000 to $149,999 | 4 (3.1%) | 0 (0.0%) |
| $150,000 or more | 6 (4.6%) | 0 (0.0%) |
| Total | 130 (100.0%) | 0 (0.0%) |
Property Value to Household Income Ratio in Mountain Village
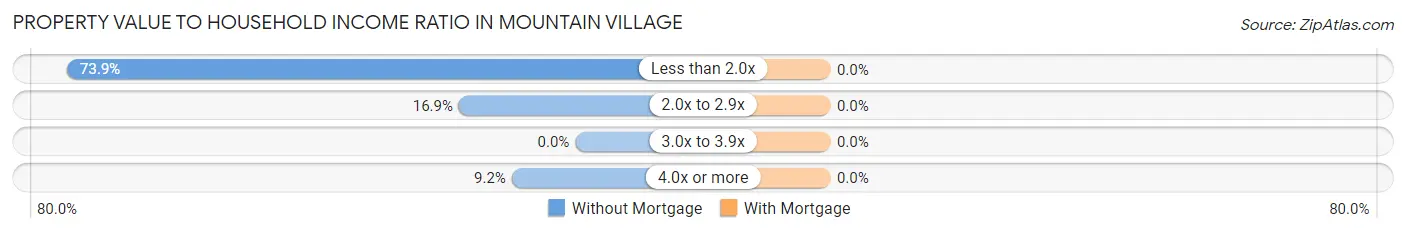
| Value-to-Income Ratio | Without Mortgage | With Mortgage |
| Less than 2.0x | 96 (73.9%) | 0 (0.0%) |
| 2.0x to 2.9x | 22 (16.9%) | 0 (0.0%) |
| 3.0x to 3.9x | 0 (0.0%) | 0 (0.0%) |
| 4.0x or more | 12 (9.2%) | 0 (0.0%) |
| Total | 130 (100.0%) | 0 (0.0%) |
Real Estate Taxes by Mortgage Status in Mountain Village
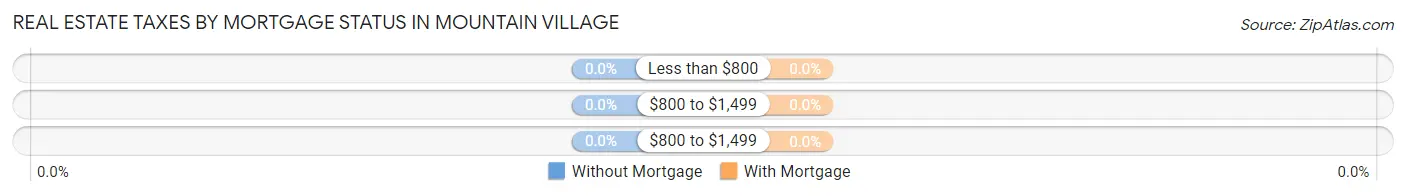
| Property Taxes | Without Mortgage | With Mortgage |
| Less than $800 | 0 (0.0%) | 0 (0.0%) |
| $800 to $1,499 | 0 (0.0%) | 0 (0.0%) |
| $800 to $1,499 | 0 (0.0%) | 0 (0.0%) |
| Total | 130 (100.0%) | 0 (0.0%) |
Health & Disability in Mountain Village
Health Insurance Coverage by Age in Mountain Village
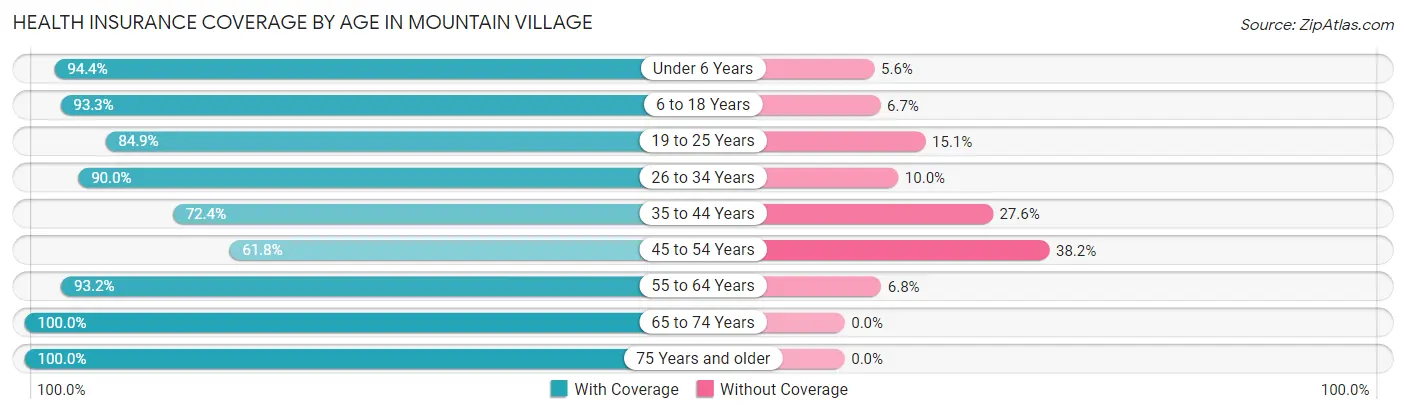
| Age Bracket | With Coverage | Without Coverage |
| Under 6 Years | 68 (94.4%) | 4 (5.6%) |
| 6 to 18 Years | 294 (93.3%) | 21 (6.7%) |
| 19 to 25 Years | 62 (84.9%) | 11 (15.1%) |
| 26 to 34 Years | 108 (90.0%) | 12 (10.0%) |
| 35 to 44 Years | 55 (72.4%) | 21 (27.6%) |
| 45 to 54 Years | 34 (61.8%) | 21 (38.2%) |
| 55 to 64 Years | 123 (93.2%) | 9 (6.8%) |
| 65 to 74 Years | 8 (100.0%) | 0 (0.0%) |
| 75 Years and older | 29 (100.0%) | 0 (0.0%) |
| Total | 781 (88.7%) | 99 (11.3%) |
Health Insurance Coverage by Citizenship Status in Mountain Village
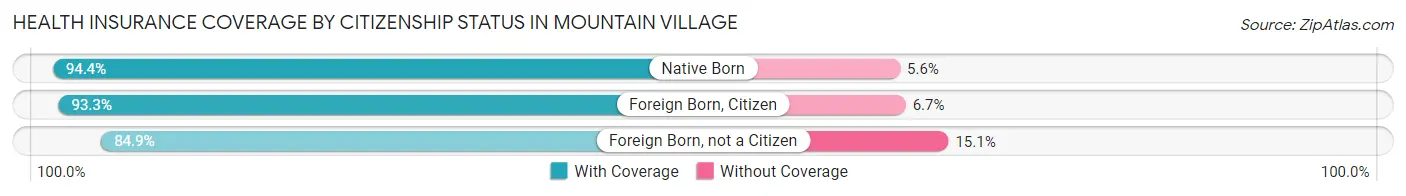
| Citizenship Status | With Coverage | Without Coverage |
| Native Born | 68 (94.4%) | 4 (5.6%) |
| Foreign Born, Citizen | 294 (93.3%) | 21 (6.7%) |
| Foreign Born, not a Citizen | 62 (84.9%) | 11 (15.1%) |
Health Insurance Coverage by Household Income in Mountain Village
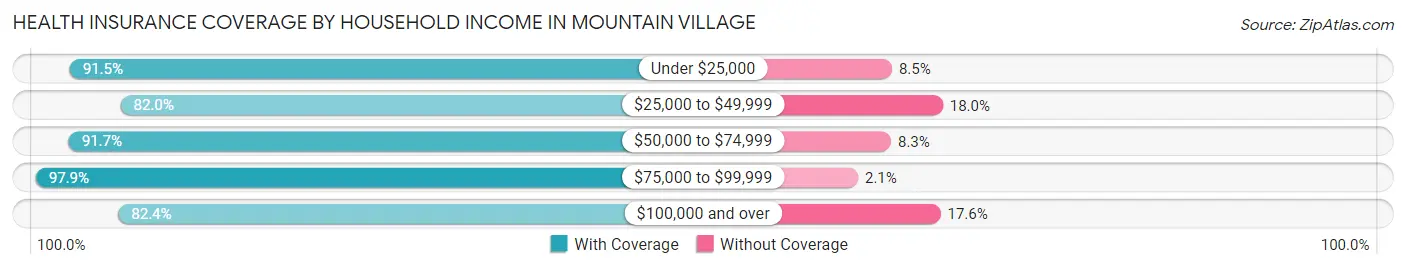
| Household Income | With Coverage | Without Coverage |
| Under $25,000 | 108 (91.5%) | 10 (8.5%) |
| $25,000 to $49,999 | 260 (82.0%) | 57 (18.0%) |
| $50,000 to $74,999 | 166 (91.7%) | 15 (8.3%) |
| $75,000 to $99,999 | 186 (97.9%) | 4 (2.1%) |
| $100,000 and over | 61 (82.4%) | 13 (17.6%) |
Public vs Private Health Insurance Coverage by Age in Mountain Village
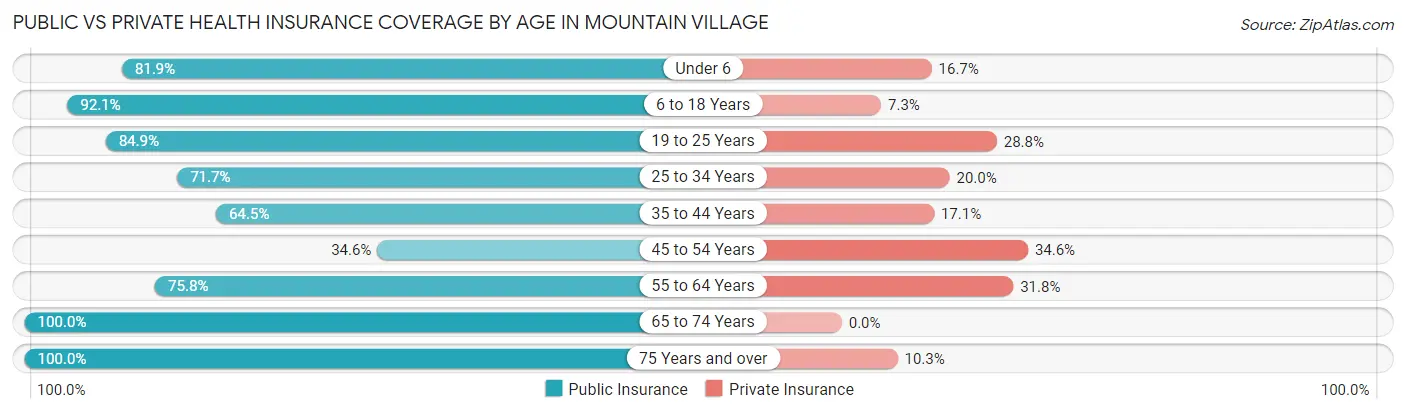
| Age Bracket | Public Insurance | Private Insurance |
| Under 6 | 59 (81.9%) | 12 (16.7%) |
| 6 to 18 Years | 290 (92.1%) | 23 (7.3%) |
| 19 to 25 Years | 62 (84.9%) | 21 (28.8%) |
| 25 to 34 Years | 86 (71.7%) | 24 (20.0%) |
| 35 to 44 Years | 49 (64.5%) | 13 (17.1%) |
| 45 to 54 Years | 19 (34.5%) | 19 (34.5%) |
| 55 to 64 Years | 100 (75.8%) | 42 (31.8%) |
| 65 to 74 Years | 8 (100.0%) | 0 (0.0%) |
| 75 Years and over | 29 (100.0%) | 3 (10.3%) |
| Total | 702 (79.8%) | 157 (17.8%) |
Disability Status by Sex by Age in Mountain Village
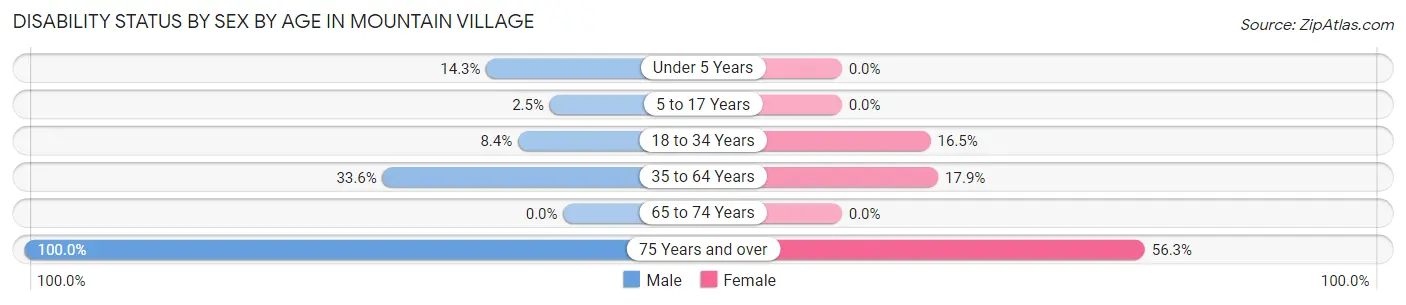
| Age Bracket | Male | Female |
| Under 5 Years | 4 (14.3%) | 0 (0.0%) |
| 5 to 17 Years | 4 (2.5%) | 0 (0.0%) |
| 18 to 34 Years | 9 (8.4%) | 16 (16.5%) |
| 35 to 64 Years | 47 (33.6%) | 22 (17.9%) |
| 65 to 74 Years | 0 (0.0%) | 0 (0.0%) |
| 75 Years and over | 13 (100.0%) | 9 (56.2%) |
Disability Class by Sex by Age in Mountain Village
Disability Class: Hearing Difficulty
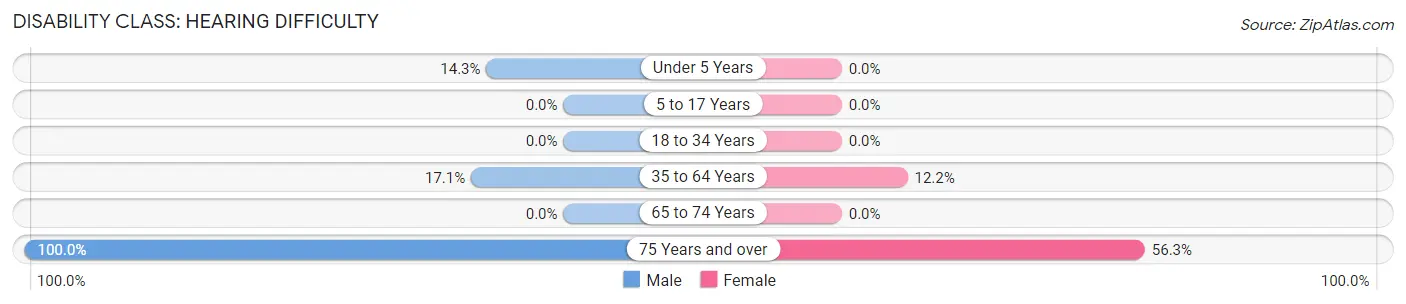
| Age Bracket | Male | Female |
| Under 5 Years | 4 (14.3%) | 0 (0.0%) |
| 5 to 17 Years | 0 (0.0%) | 0 (0.0%) |
| 18 to 34 Years | 0 (0.0%) | 0 (0.0%) |
| 35 to 64 Years | 24 (17.1%) | 15 (12.2%) |
| 65 to 74 Years | 0 (0.0%) | 0 (0.0%) |
| 75 Years and over | 13 (100.0%) | 9 (56.2%) |
Disability Class: Vision Difficulty
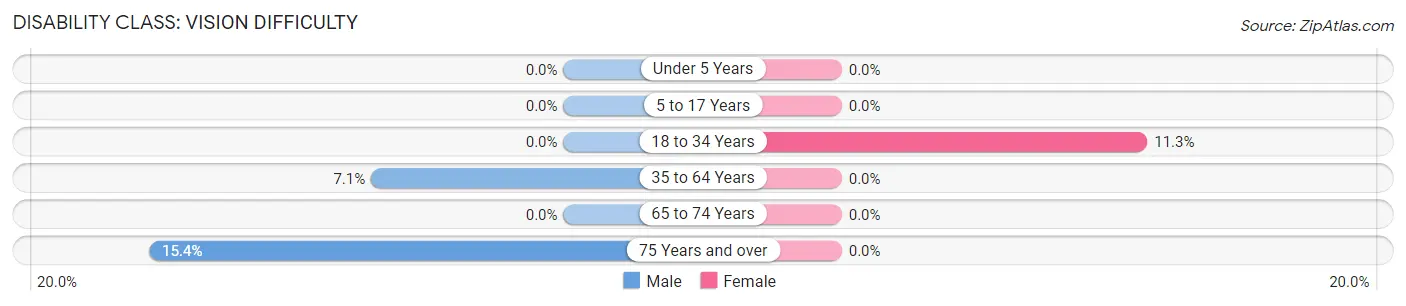
| Age Bracket | Male | Female |
| Under 5 Years | 0 (0.0%) | 0 (0.0%) |
| 5 to 17 Years | 0 (0.0%) | 0 (0.0%) |
| 18 to 34 Years | 0 (0.0%) | 11 (11.3%) |
| 35 to 64 Years | 10 (7.1%) | 0 (0.0%) |
| 65 to 74 Years | 0 (0.0%) | 0 (0.0%) |
| 75 Years and over | 2 (15.4%) | 0 (0.0%) |
Disability Class: Cognitive Difficulty
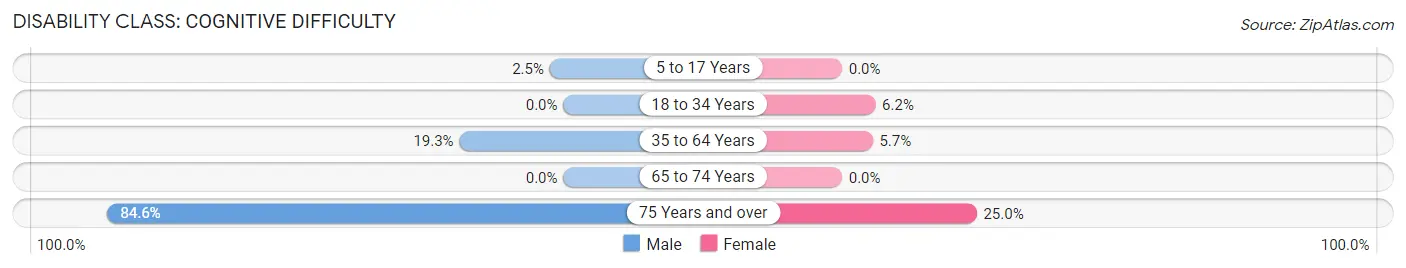
| Age Bracket | Male | Female |
| 5 to 17 Years | 4 (2.5%) | 0 (0.0%) |
| 18 to 34 Years | 0 (0.0%) | 6 (6.2%) |
| 35 to 64 Years | 27 (19.3%) | 7 (5.7%) |
| 65 to 74 Years | 0 (0.0%) | 0 (0.0%) |
| 75 Years and over | 11 (84.6%) | 4 (25.0%) |
Disability Class: Ambulatory Difficulty
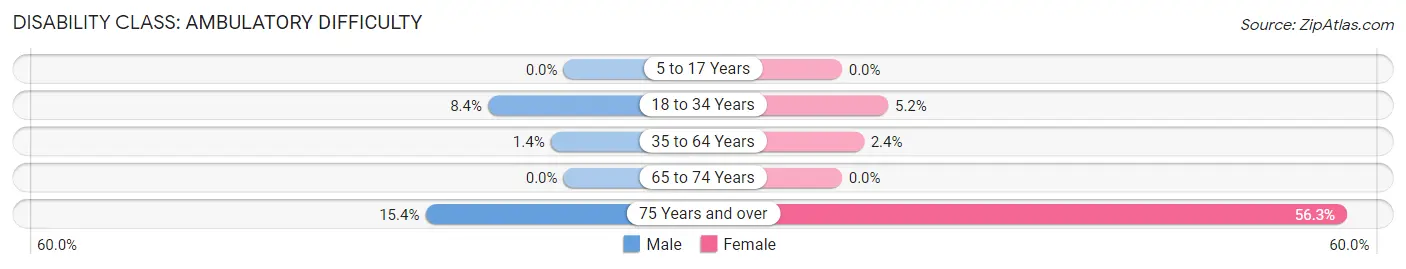
| Age Bracket | Male | Female |
| 5 to 17 Years | 0 (0.0%) | 0 (0.0%) |
| 18 to 34 Years | 9 (8.4%) | 5 (5.1%) |
| 35 to 64 Years | 2 (1.4%) | 3 (2.4%) |
| 65 to 74 Years | 0 (0.0%) | 0 (0.0%) |
| 75 Years and over | 2 (15.4%) | 9 (56.2%) |
Disability Class: Self-Care Difficulty
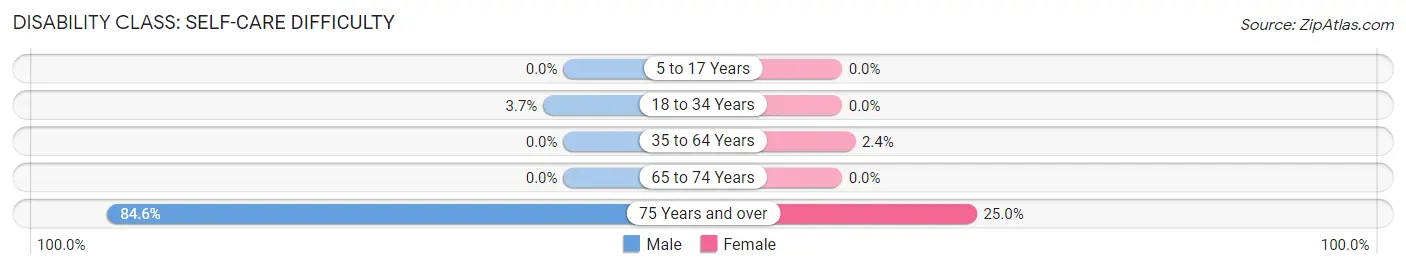
| Age Bracket | Male | Female |
| 5 to 17 Years | 0 (0.0%) | 0 (0.0%) |
| 18 to 34 Years | 4 (3.7%) | 0 (0.0%) |
| 35 to 64 Years | 0 (0.0%) | 3 (2.4%) |
| 65 to 74 Years | 0 (0.0%) | 0 (0.0%) |
| 75 Years and over | 11 (84.6%) | 4 (25.0%) |
Technology Access in Mountain Village
Computing Device Access in Mountain Village
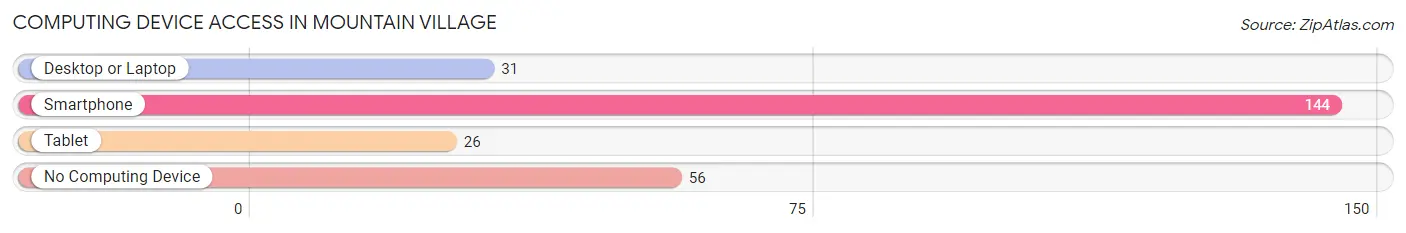
| Device Type | # Households | % Households |
| Desktop or Laptop | 31 | 15.5% |
| Smartphone | 144 | 72.0% |
| Tablet | 26 | 13.0% |
| No Computing Device | 56 | 28.0% |
| Total | 200 | 100.0% |
Internet Access in Mountain Village
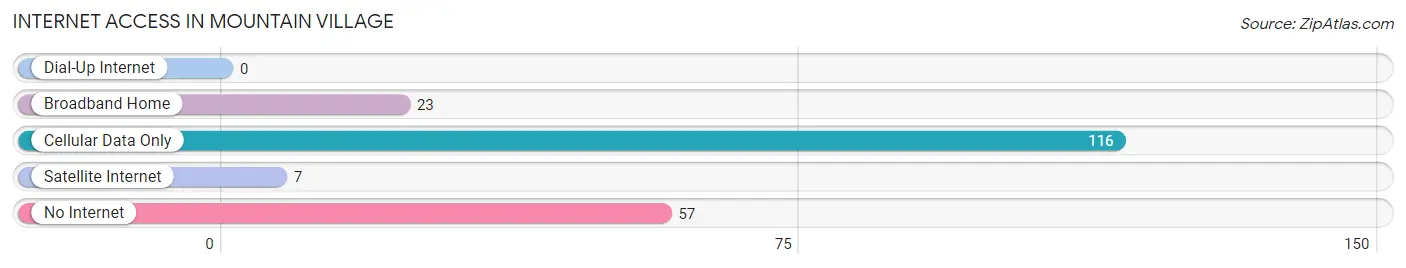
| Internet Type | # Households | % Households |
| Dial-Up Internet | 0 | 0.0% |
| Broadband Home | 23 | 11.5% |
| Cellular Data Only | 116 | 58.0% |
| Satellite Internet | 7 | 3.5% |
| No Internet | 57 | 28.5% |
| Total | 200 | 100.0% |
Mountain Village Summary
Mountain Village, Alaska is a small, rural village located in the Yukon-Kuskokwim Delta region of the state. It is situated on the south bank of the Yukon River, approximately 40 miles east of Bethel. The village is home to a population of approximately 890 people, most of whom are of Yup'ik Eskimo descent.
Geography
Mountain Village is located in the Yukon-Kuskokwim Delta region of Alaska, which is characterized by its flat, marshy terrain. The village is situated on the south bank of the Yukon River, approximately 40 miles east of Bethel. The area is known for its abundant wildlife, including moose, caribou, and migratory birds. The climate is subarctic, with long, cold winters and short, cool summers.
Economy
The economy of Mountain Village is largely based on subsistence activities, such as fishing, hunting, and trapping. The village is also home to a small commercial fishing fleet, which harvests salmon, whitefish, and other species from the Yukon River. Other economic activities include tourism, government services, and retail.
Demographics
As of the 2010 census, the population of Mountain Village was 890, of which 97.3% were Native American or Alaska Native. The median age was 28.7 years, and the median household income was $37,500. The majority of the population (90.2%) spoke Yup'ik as their primary language.
History
Mountain Village was originally inhabited by the Yup'ik Eskimos, who have lived in the area for thousands of years. The village was first established in the late 19th century as a trading post for fur traders. In the early 20th century, the village was a popular stop for riverboat travelers. In the 1950s, the village was connected to the outside world by the Alaska Railroad, which brought increased economic opportunities to the area. In the 1970s, the village was connected to the road system, which further increased economic opportunities. Today, Mountain Village is a small, rural village that is home to a population of approximately 890 people.
Common Questions
What is Per Capita Income in Mountain Village?
Per Capita income in Mountain Village is $13,531.
What is the Median Family Income in Mountain Village?
Median Family Income in Mountain Village is $55,250.
What is the Median Household income in Mountain Village?
Median Household Income in Mountain Village is $45,000.
What is Income or Wage Gap in Mountain Village?
Income or Wage Gap in Mountain Village is 44.1%.
Women in Mountain Village earn 55.9 cents for every dollar earned by a man.
What is Inequality or Gini Index in Mountain Village?
Inequality or Gini Index in Mountain Village is 0.44.
What is the Total Population of Mountain Village?
Total Population of Mountain Village is 884.
What is the Total Male Population of Mountain Village?
Total Male Population of Mountain Village is 459.
What is the Total Female Population of Mountain Village?
Total Female Population of Mountain Village is 425.
What is the Ratio of Males per 100 Females in Mountain Village?
There are 108.00 Males per 100 Females in Mountain Village.
What is the Ratio of Females per 100 Males in Mountain Village?
There are 92.59 Females per 100 Males in Mountain Village.
What is the Median Population Age in Mountain Village?
Median Population Age in Mountain Village is 22.6 Years.
What is the Average Family Size in Mountain Village
Average Family Size in Mountain Village is 4.3 People.
What is the Average Household Size in Mountain Village
Average Household Size in Mountain Village is 4.4 People.
How Large is the Labor Force in Mountain Village?
There are 250 People in the Labor Forcein in Mountain Village.
What is the Percentage of People in the Labor Force in Mountain Village?
44.4% of People are in the Labor Force in Mountain Village.
What is the Unemployment Rate in Mountain Village?
Unemployment Rate in Mountain Village is 15.0%.