Koliganek, AK Map & Demographics
Koliganek Map
Koliganek Overview
$16,508
PER CAPITA INCOME
$57,500
AVG FAMILY INCOME
$56,250
AVG HOUSEHOLD INCOME
0.34
INEQUALITY / GINI INDEX
234
TOTAL POPULATION
123
MALE POPULATION
111
FEMALE POPULATION
110.81
MALES / 100 FEMALES
90.24
FEMALES / 100 MALES
21.0
MEDIAN AGE
4.5
AVG FAMILY SIZE
4.1
AVG HOUSEHOLD SIZE
73
LABOR FORCE [ PEOPLE ]
50.7%
PERCENT IN LABOR FORCE
27.4%
UNEMPLOYMENT RATE
Koliganek Area Codes
Income in Koliganek
Income Overview in Koliganek
Per Capita Income in Koliganek is $16,508, while median incomes of families and households are $57,500 and $56,250 respectively.
| Characteristic | Number | Measure |
| Per Capita Income | 234 | $16,508 |
| Median Family Income | 48 | $57,500 |
| Mean Family Income | 48 | $71,898 |
| Median Household Income | 57 | $56,250 |
| Mean Household Income | 57 | $67,461 |
| Income Deficit | 48 | $0 |
| Wage / Income Gap (%) | 234 | 0.00% |
| Wage / Income Gap ($) | 234 | 100.00¢ per $1 |
| Gini / Inequality Index | 234 | 0.34 |
Earnings by Sex in Koliganek
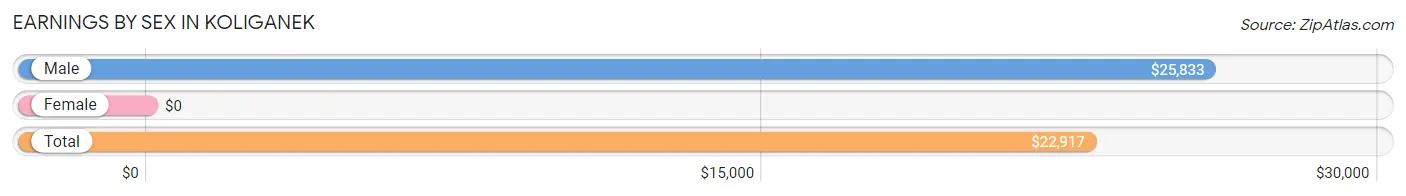
| Sex | Number | Average Earnings |
| Male | 46 (50.0%) | $25,833 |
| Female | 46 (50.0%) | $0 |
| Total | 92 (100.0%) | $22,917 |
Earnings by Sex by Income Bracket in Koliganek
The most common earnings brackets in Koliganek are $2,499 or less for men (5 | 10.9%) and $2,499 or less for women (14 | 30.4%).
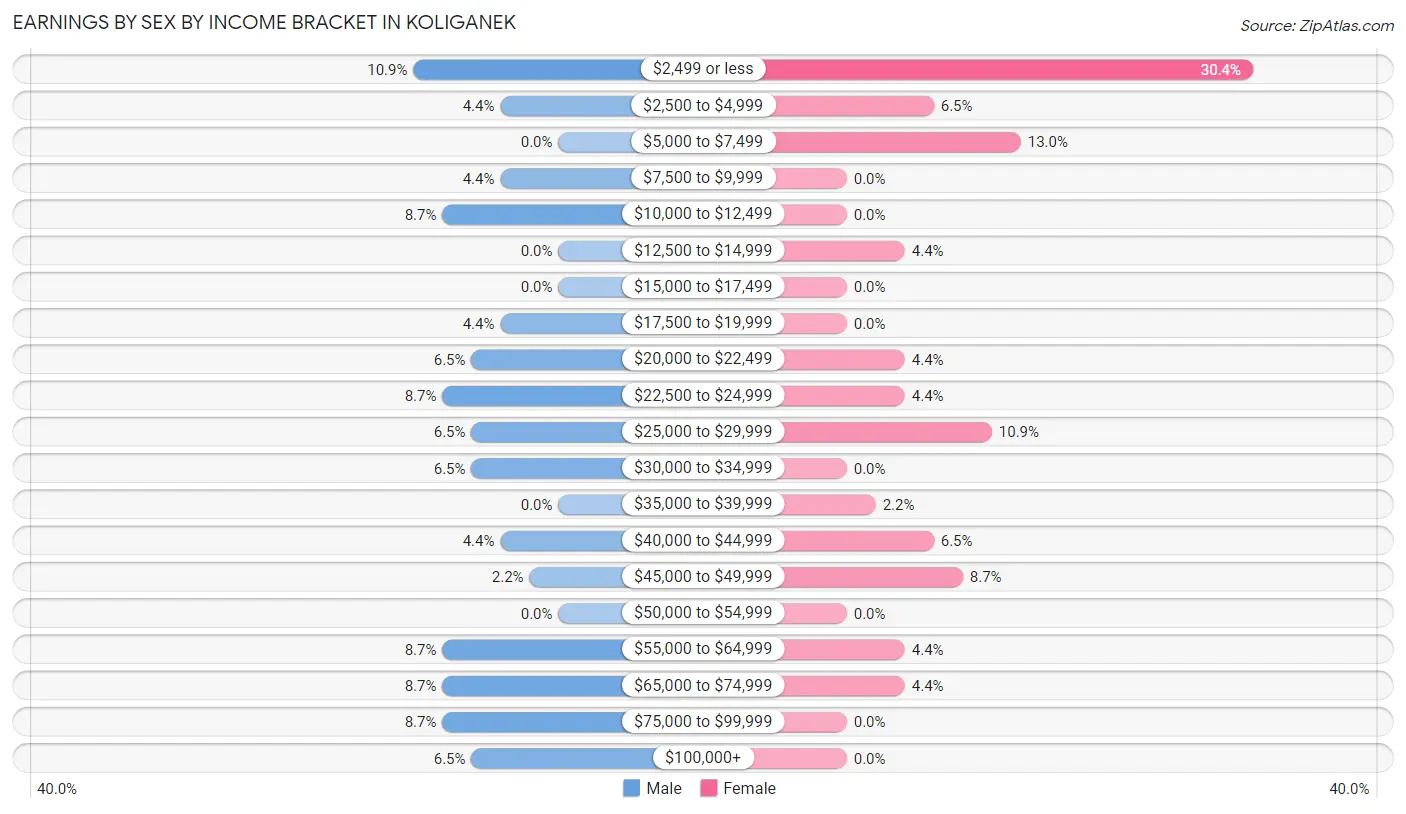
| Income | Male | Female |
| $2,499 or less | 5 (10.9%) | 14 (30.4%) |
| $2,500 to $4,999 | 2 (4.3%) | 3 (6.5%) |
| $5,000 to $7,499 | 0 (0.0%) | 6 (13.0%) |
| $7,500 to $9,999 | 2 (4.3%) | 0 (0.0%) |
| $10,000 to $12,499 | 4 (8.7%) | 0 (0.0%) |
| $12,500 to $14,999 | 0 (0.0%) | 2 (4.3%) |
| $15,000 to $17,499 | 0 (0.0%) | 0 (0.0%) |
| $17,500 to $19,999 | 2 (4.3%) | 0 (0.0%) |
| $20,000 to $22,499 | 3 (6.5%) | 2 (4.3%) |
| $22,500 to $24,999 | 4 (8.7%) | 2 (4.3%) |
| $25,000 to $29,999 | 3 (6.5%) | 5 (10.9%) |
| $30,000 to $34,999 | 3 (6.5%) | 0 (0.0%) |
| $35,000 to $39,999 | 0 (0.0%) | 1 (2.2%) |
| $40,000 to $44,999 | 2 (4.3%) | 3 (6.5%) |
| $45,000 to $49,999 | 1 (2.2%) | 4 (8.7%) |
| $50,000 to $54,999 | 0 (0.0%) | 0 (0.0%) |
| $55,000 to $64,999 | 4 (8.7%) | 2 (4.3%) |
| $65,000 to $74,999 | 4 (8.7%) | 2 (4.3%) |
| $75,000 to $99,999 | 4 (8.7%) | 0 (0.0%) |
| $100,000+ | 3 (6.5%) | 0 (0.0%) |
| Total | 46 (100.0%) | 46 (100.0%) |
Earnings by Sex by Educational Attainment in Koliganek
Average earnings in Koliganek are $26,667 for men and $29,167 for women, a difference of 8.6%. Men with an educational attainment of high school diploma enjoy the highest average annual earnings of $26,250, while those with high school diploma education earn the least with $26,250. Women with an educational attainment of college or associate's degree earn the most with the average annual earnings of $41,250, while those with high school diploma education have the smallest earnings of $24,375.
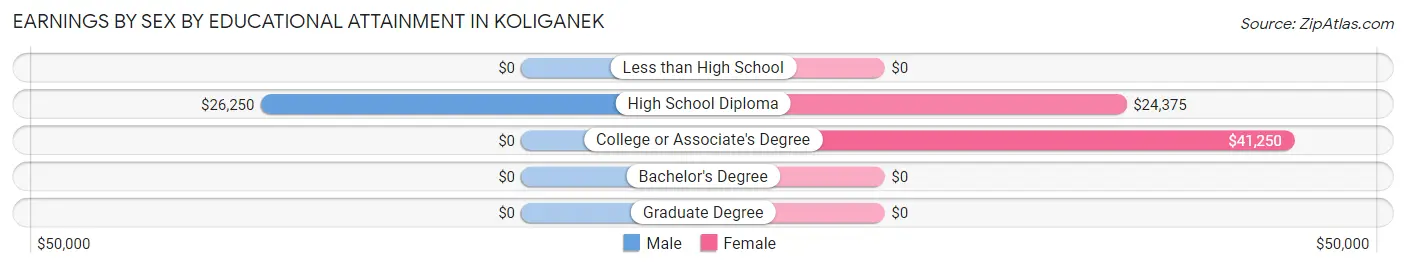
| Educational Attainment | Male Income | Female Income |
| Less than High School | - | - |
| High School Diploma | $26,250 | $24,375 |
| College or Associate's Degree | - | - |
| Bachelor's Degree | - | - |
| Graduate Degree | - | - |
| Total | $26,667 | $29,167 |
Family Income in Koliganek
Family Income Brackets in Koliganek
According to the Koliganek family income data, there are 16 families falling into the $50,000 to $74,999 income range, which is the most common income bracket and makes up 33.3% of all families.
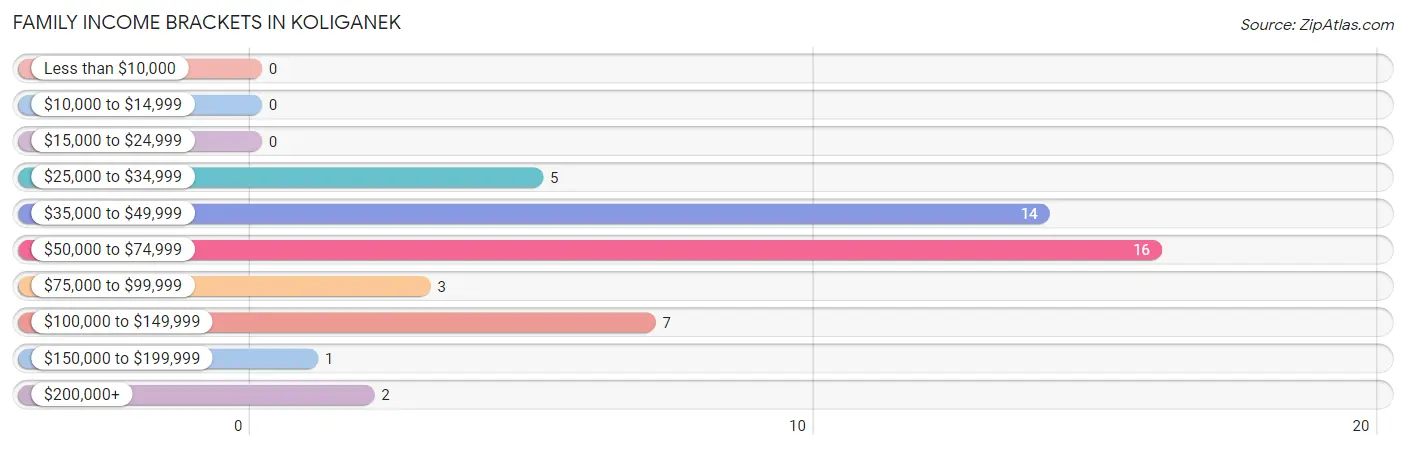
| Income Bracket | # Families | % Families |
| Less than $10,000 | 0 | 0.0% |
| $10,000 to $14,999 | 0 | 0.0% |
| $15,000 to $24,999 | 0 | 0.0% |
| $25,000 to $34,999 | 5 | 10.4% |
| $35,000 to $49,999 | 14 | 29.2% |
| $50,000 to $74,999 | 16 | 33.3% |
| $75,000 to $99,999 | 3 | 6.3% |
| $100,000 to $149,999 | 7 | 14.6% |
| $150,000 to $199,999 | 1 | 2.1% |
| $200,000+ | 2 | 4.2% |
Family Income by Famaliy Size in Koliganek
5-person families (13 | 27.1%) account for the highest median family income in Koliganek with $68,750 per family, while 2-person families (8 | 16.7%) have the highest median income of $26,875 per family member.
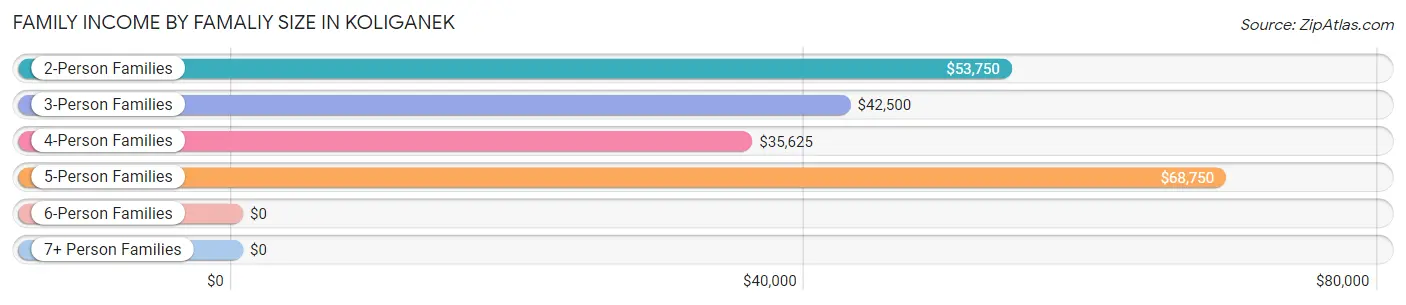
| Income Bracket | # Families | Median Income |
| 2-Person Families | 8 (16.7%) | $53,750 |
| 3-Person Families | 8 (16.7%) | $42,500 |
| 4-Person Families | 7 (14.6%) | $35,625 |
| 5-Person Families | 13 (27.1%) | $68,750 |
| 6-Person Families | 7 (14.6%) | $0 |
| 7+ Person Families | 5 (10.4%) | $0 |
| Total | 48 (100.0%) | $57,500 |
Family Income by Number of Earners in Koliganek
The median family income in Koliganek is $57,500, with families comprising 3+ earners (6) having the highest median family income of $68,750, while families with no earners (5) have the lowest median family income of $37,917, accounting for 12.5% and 10.4% of families, respectively.
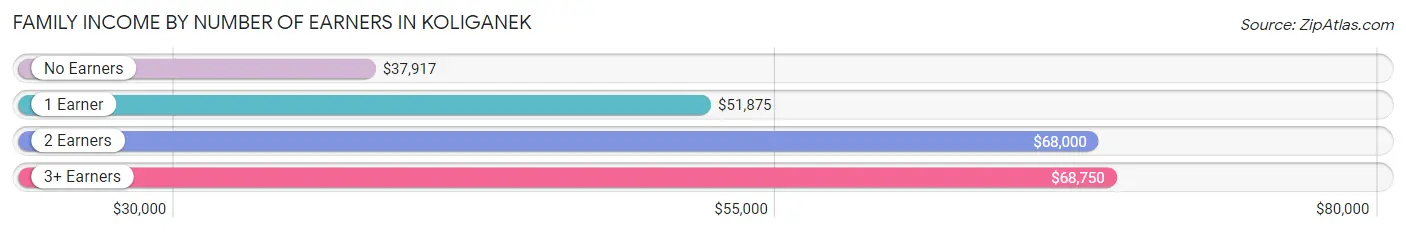
| Number of Earners | # Families | Median Income |
| No Earners | 5 (10.4%) | $37,917 |
| 1 Earner | 13 (27.1%) | $51,875 |
| 2 Earners | 24 (50.0%) | $68,000 |
| 3+ Earners | 6 (12.5%) | $68,750 |
| Total | 48 (100.0%) | $57,500 |
Household Income in Koliganek
Household Income Brackets in Koliganek
With 20 households falling in the category, the $50,000 to $74,999 income range is the most frequent in Koliganek, accounting for 35.1% of all households.
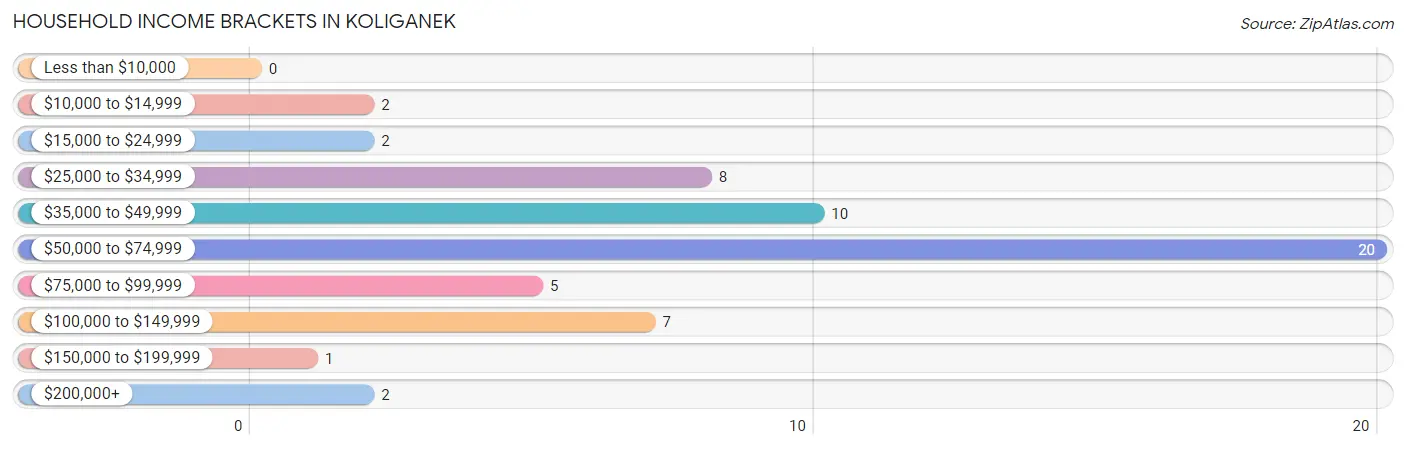
| Income Bracket | # Households | % Households |
| Less than $10,000 | 0 | 0.0% |
| $10,000 to $14,999 | 2 | 3.5% |
| $15,000 to $24,999 | 2 | 3.5% |
| $25,000 to $34,999 | 8 | 14.0% |
| $35,000 to $49,999 | 10 | 17.5% |
| $50,000 to $74,999 | 20 | 35.1% |
| $75,000 to $99,999 | 5 | 8.8% |
| $100,000 to $149,999 | 7 | 12.3% |
| $150,000 to $199,999 | 1 | 1.8% |
| $200,000+ | 2 | 3.5% |
Household Income by Householder Age in Koliganek
The median household income in Koliganek is $56,250, with the highest median household income of $66,250 found in the 25 to 44 years age bracket for the primary householder. A total of 18 households (31.6%) fall into this category.
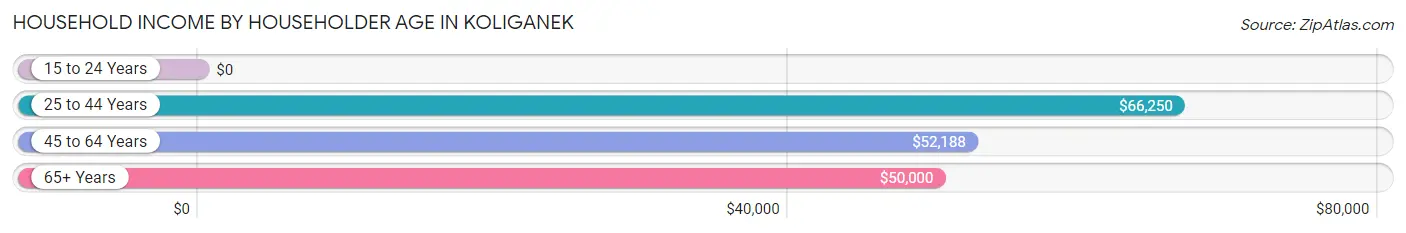
| Income Bracket | # Households | Median Income |
| 15 to 24 Years | 0 (0.0%) | $0 |
| 25 to 44 Years | 18 (31.6%) | $66,250 |
| 45 to 64 Years | 25 (43.9%) | $52,188 |
| 65+ Years | 14 (24.6%) | $50,000 |
| Total | 57 (100.0%) | $56,250 |
Poverty in Koliganek
Income Below Poverty by Sex and Age in Koliganek
With 14.6% poverty level for males and 18.0% for females among the residents of Koliganek, 35 to 44 year old males and 18 to 24 year old females are the most vulnerable to poverty, with 4 males (44.4%) and 10 females (37.0%) in their respective age groups living below the poverty level.
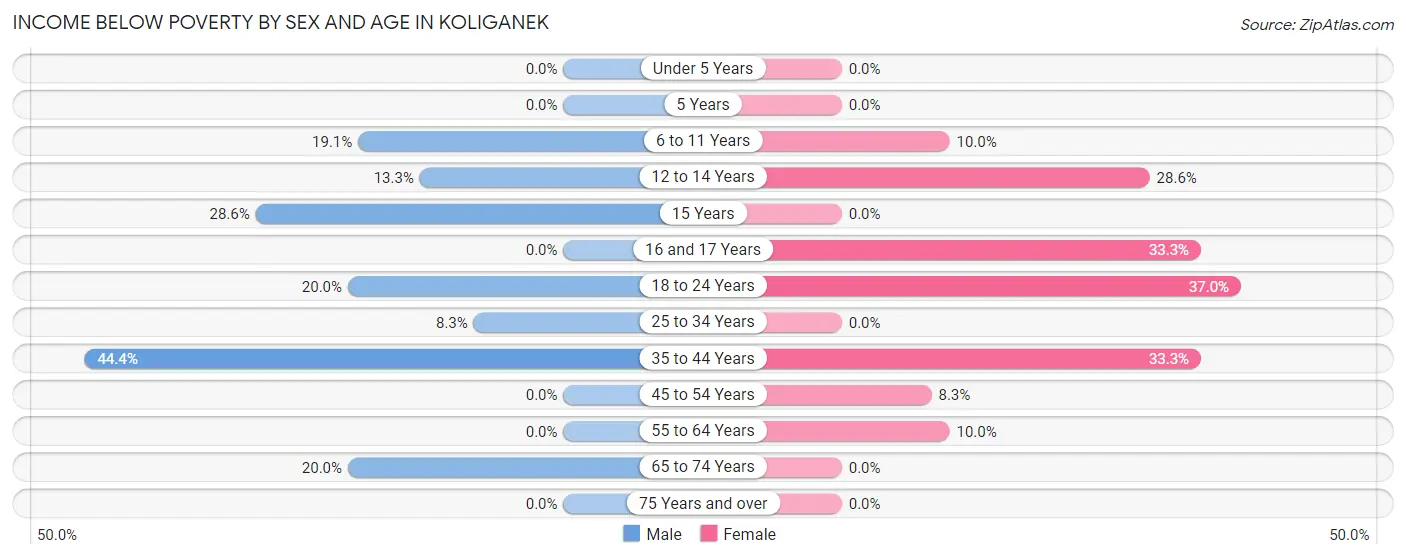
| Age Bracket | Male | Female |
| Under 5 Years | 0 (0.0%) | 0 (0.0%) |
| 5 Years | 0 (0.0%) | 0 (0.0%) |
| 6 to 11 Years | 4 (19.1%) | 2 (10.0%) |
| 12 to 14 Years | 2 (13.3%) | 2 (28.6%) |
| 15 Years | 2 (28.6%) | 0 (0.0%) |
| 16 and 17 Years | 0 (0.0%) | 1 (33.3%) |
| 18 to 24 Years | 2 (20.0%) | 10 (37.0%) |
| 25 to 34 Years | 1 (8.3%) | 0 (0.0%) |
| 35 to 44 Years | 4 (44.4%) | 3 (33.3%) |
| 45 to 54 Years | 0 (0.0%) | 1 (8.3%) |
| 55 to 64 Years | 0 (0.0%) | 1 (10.0%) |
| 65 to 74 Years | 3 (20.0%) | 0 (0.0%) |
| 75 Years and over | 0 (0.0%) | 0 (0.0%) |
| Total | 18 (14.6%) | 20 (18.0%) |
Income Above Poverty by Sex and Age in Koliganek
According to the poverty statistics in Koliganek, males aged under 5 years and females aged under 5 years are the age groups that are most secure financially, with 100.0% of males and 100.0% of females in these age groups living above the poverty line.
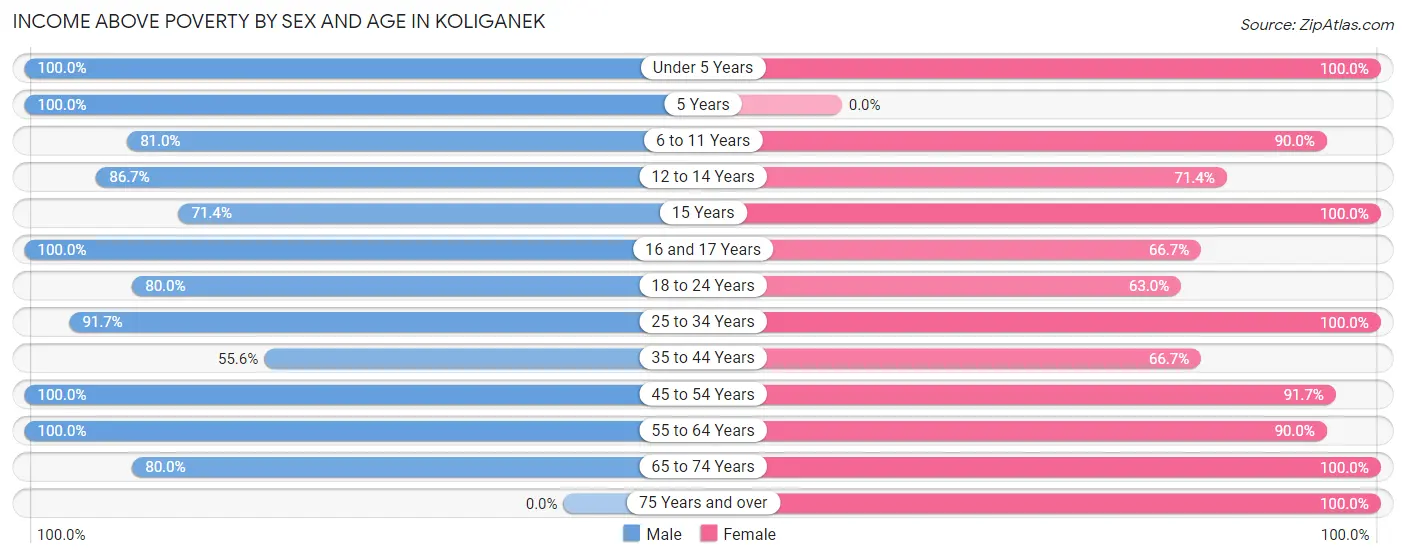
| Age Bracket | Male | Female |
| Under 5 Years | 10 (100.0%) | 7 (100.0%) |
| 5 Years | 2 (100.0%) | 0 (0.0%) |
| 6 to 11 Years | 17 (80.9%) | 18 (90.0%) |
| 12 to 14 Years | 13 (86.7%) | 5 (71.4%) |
| 15 Years | 5 (71.4%) | 1 (100.0%) |
| 16 and 17 Years | 4 (100.0%) | 2 (66.7%) |
| 18 to 24 Years | 8 (80.0%) | 17 (63.0%) |
| 25 to 34 Years | 11 (91.7%) | 7 (100.0%) |
| 35 to 44 Years | 5 (55.6%) | 6 (66.7%) |
| 45 to 54 Years | 8 (100.0%) | 11 (91.7%) |
| 55 to 64 Years | 10 (100.0%) | 9 (90.0%) |
| 65 to 74 Years | 12 (80.0%) | 4 (100.0%) |
| 75 Years and over | 0 (0.0%) | 4 (100.0%) |
| Total | 105 (85.4%) | 91 (82.0%) |
Income Below Poverty Among Married-Couple Families in Koliganek
The poverty statistics for married-couple families in Koliganek show that 9.1% or 3 of the total 33 families live below the poverty line. Families with 5 or more children have the highest poverty rate of 33.3%, comprising of 1 families. On the other hand, families with no children have the lowest poverty rate of 0.0%, which includes 0 families.
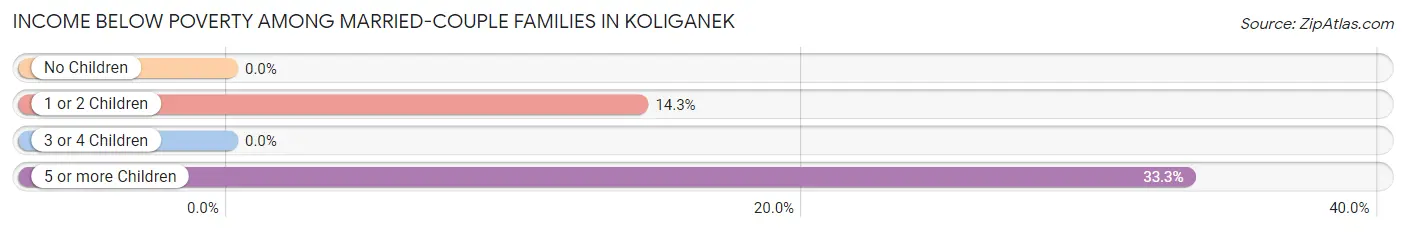
| Children | Above Poverty | Below Poverty |
| No Children | 8 (100.0%) | 0 (0.0%) |
| 1 or 2 Children | 12 (85.7%) | 2 (14.3%) |
| 3 or 4 Children | 8 (100.0%) | 0 (0.0%) |
| 5 or more Children | 2 (66.7%) | 1 (33.3%) |
| Total | 30 (90.9%) | 3 (9.1%) |
Income Below Poverty Among Single-Parent Households in Koliganek
| Children | Single Father | Single Mother |
| No Children | 0 (0.0%) | 0 (0.0%) |
| 1 or 2 Children | 0 (0.0%) | 0 (0.0%) |
| 3 or 4 Children | 0 (0.0%) | 0 (0.0%) |
| 5 or more Children | 0 (0.0%) | 0 (0.0%) |
| Total | 0 (0.0%) | 0 (0.0%) |
Income Below Poverty Among Married-Couple vs Single-Parent Households in Koliganek
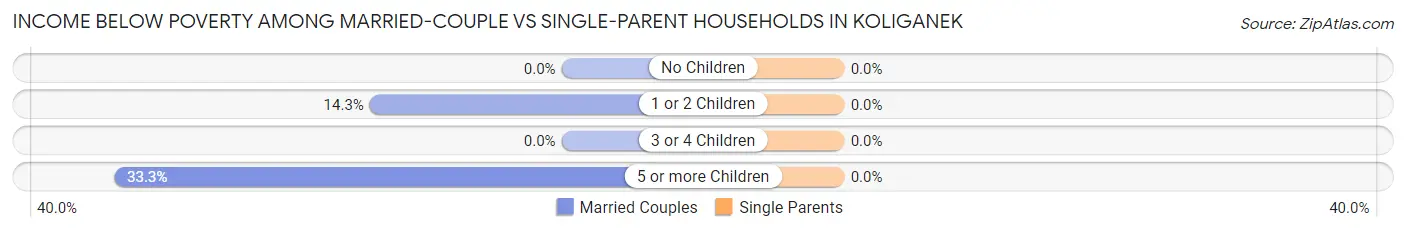
| Children | Married-Couple Families | Single-Parent Households |
| No Children | 0 (0.0%) | 0 (0.0%) |
| 1 or 2 Children | 2 (14.3%) | 0 (0.0%) |
| 3 or 4 Children | 0 (0.0%) | 0 (0.0%) |
| 5 or more Children | 1 (33.3%) | 0 (0.0%) |
| Total | 3 (9.1%) | 0 (0.0%) |
Race in Koliganek
The most populous races in Koliganek are Native / Alaskan (228 | 97.4%), White / Caucasian (3 | 1.3%), and Two or more Races (3 | 1.3%).
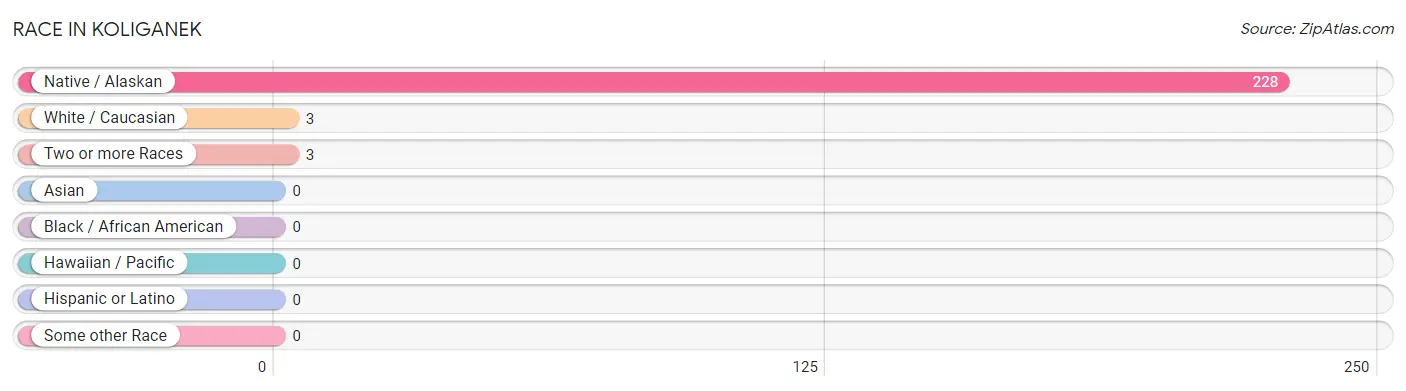
| Race | # Population | % Population |
| Asian | 0 | 0.0% |
| Black / African American | 0 | 0.0% |
| Hawaiian / Pacific | 0 | 0.0% |
| Hispanic or Latino | 0 | 0.0% |
| Native / Alaskan | 228 | 97.4% |
| White / Caucasian | 3 | 1.3% |
| Two or more Races | 3 | 1.3% |
| Some other Race | 0 | 0.0% |
| Total | 234 | 100.0% |
Ancestry in Koliganek
The most populous ancestries reported in Koliganek are Yup'ik (219 | 93.6%), Alaska Native (12 | 5.1%), Norwegian (3 | 1.3%), and Danish (1 | 0.4%), together accounting for 100.4% of all Koliganek residents.
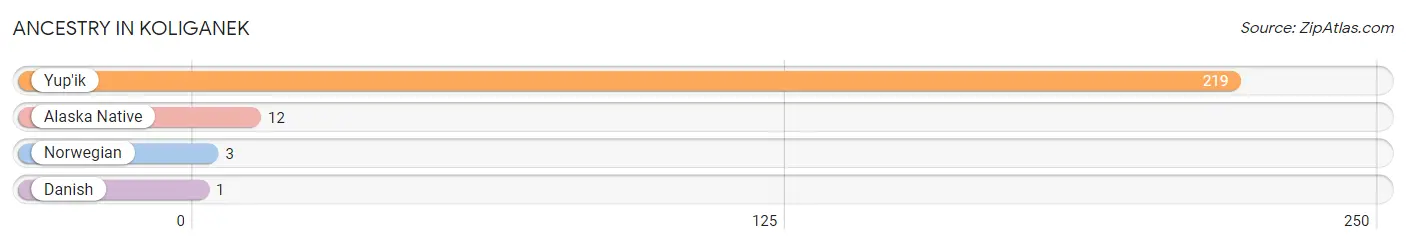
| Ancestry | # Population | % Population |
| Alaska Native | 12 | 5.1% |
| Danish | 1 | 0.4% |
| Norwegian | 3 | 1.3% |
| Yup'ik | 219 | 93.6% | View All 4 Rows |
Immigrants in Koliganek

| Immigration Origin | # Population | % Population | View All 0 Rows |
Sex and Age in Koliganek
Sex and Age in Koliganek
The most populous age groups in Koliganek are 10 to 14 Years (25 | 20.3%) for men and 15 to 19 Years (17 | 15.3%) for women.
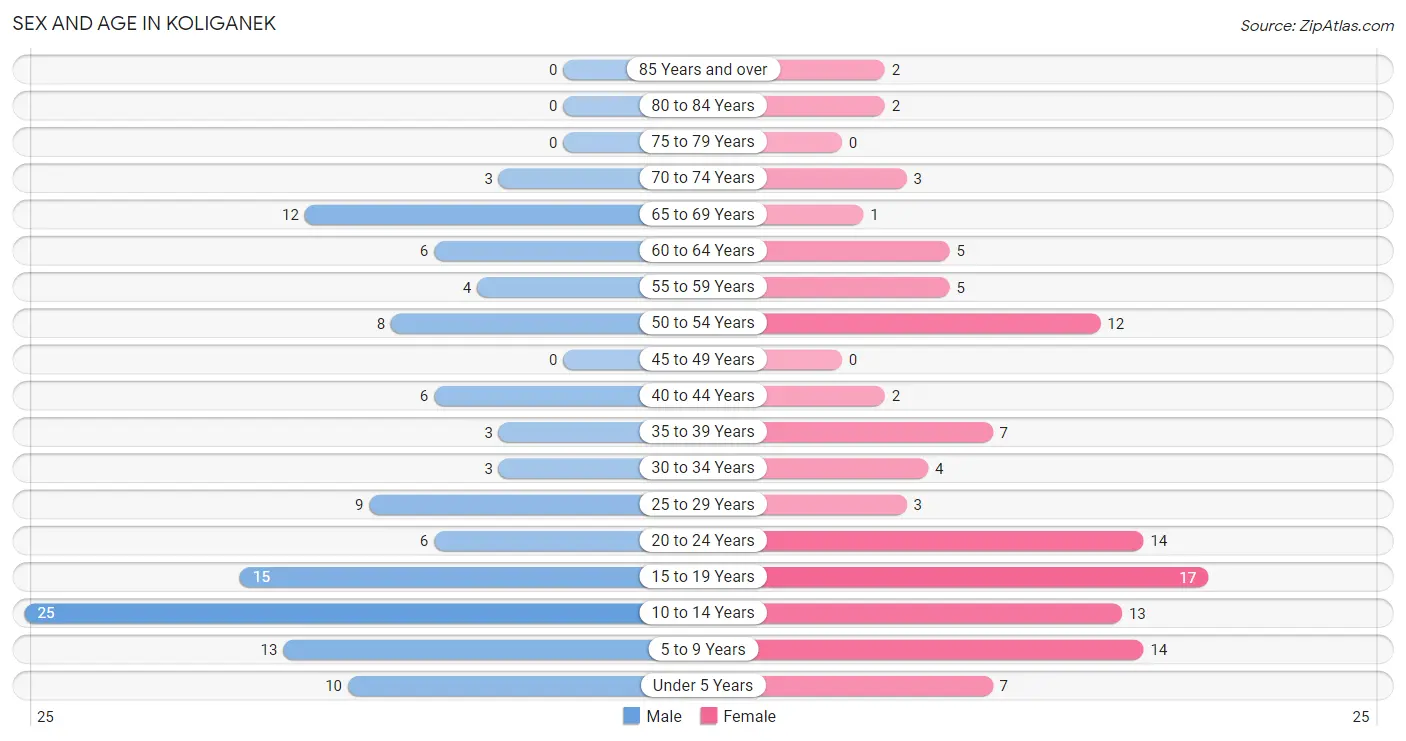
| Age Bracket | Male | Female |
| Under 5 Years | 10 (8.1%) | 7 (6.3%) |
| 5 to 9 Years | 13 (10.6%) | 14 (12.6%) |
| 10 to 14 Years | 25 (20.3%) | 13 (11.7%) |
| 15 to 19 Years | 15 (12.2%) | 17 (15.3%) |
| 20 to 24 Years | 6 (4.9%) | 14 (12.6%) |
| 25 to 29 Years | 9 (7.3%) | 3 (2.7%) |
| 30 to 34 Years | 3 (2.4%) | 4 (3.6%) |
| 35 to 39 Years | 3 (2.4%) | 7 (6.3%) |
| 40 to 44 Years | 6 (4.9%) | 2 (1.8%) |
| 45 to 49 Years | 0 (0.0%) | 0 (0.0%) |
| 50 to 54 Years | 8 (6.5%) | 12 (10.8%) |
| 55 to 59 Years | 4 (3.3%) | 5 (4.5%) |
| 60 to 64 Years | 6 (4.9%) | 5 (4.5%) |
| 65 to 69 Years | 12 (9.8%) | 1 (0.9%) |
| 70 to 74 Years | 3 (2.4%) | 3 (2.7%) |
| 75 to 79 Years | 0 (0.0%) | 0 (0.0%) |
| 80 to 84 Years | 0 (0.0%) | 2 (1.8%) |
| 85 Years and over | 0 (0.0%) | 2 (1.8%) |
| Total | 123 (100.0%) | 111 (100.0%) |
Families and Households in Koliganek
Median Family Size in Koliganek
The median family size in Koliganek is 4.46 persons per family, with married-couple families (33 | 68.8%) accounting for the largest median family size of 4.67 persons per family. On the other hand, single male/father families (3 | 6.2%) represent the smallest median family size with 3.67 persons per family.
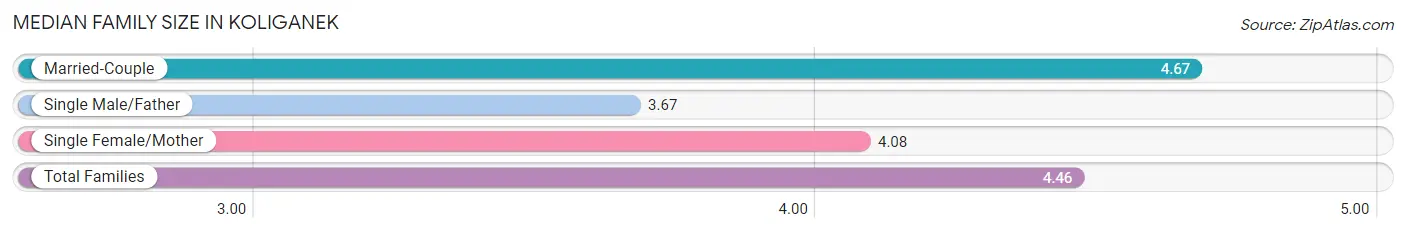
| Family Type | # Families | Family Size |
| Married-Couple | 33 (68.8%) | 4.67 |
| Single Male/Father | 3 (6.2%) | 3.67 |
| Single Female/Mother | 12 (25.0%) | 4.08 |
| Total Families | 48 (100.0%) | 4.46 |
Median Household Size in Koliganek
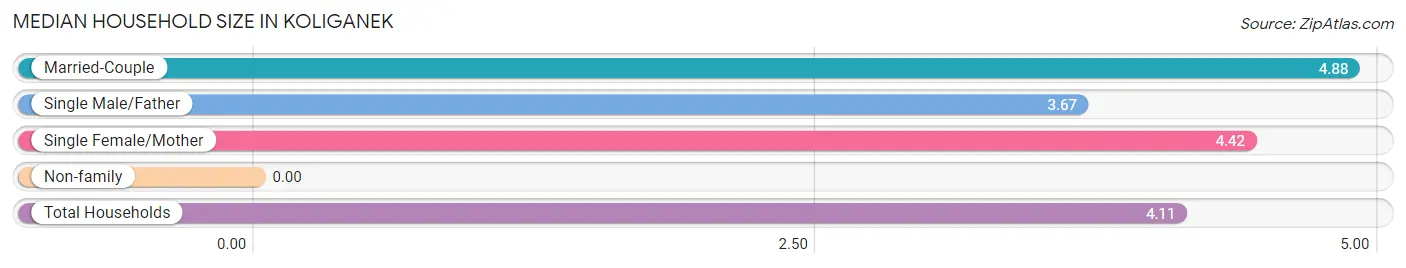
| Household Type | # Households | Household Size |
| Married-Couple | 33 (57.9%) | 4.88 |
| Single Male/Father | 3 (5.3%) | 3.67 |
| Single Female/Mother | 12 (21.0%) | 4.42 |
| Non-family | 9 (15.8%) | - |
| Total Households | 57 (100.0%) | 4.11 |
Household Size by Marriage Status in Koliganek
Out of a total of 57 households in Koliganek, 48 (84.2%) are family households, while 9 (15.8%) are nonfamily households. The most numerous type of family households are 5-person households, comprising 13, and the most common type of nonfamily households are 1-person households, comprising 9.
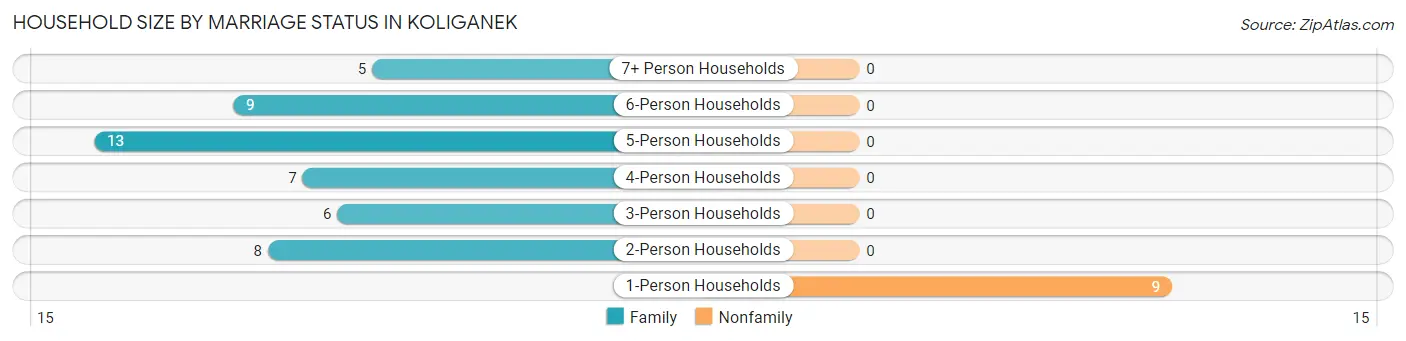
| Household Size | Family Households | Nonfamily Households |
| 1-Person Households | - | 9 (15.8%) |
| 2-Person Households | 8 (14.0%) | 0 (0.0%) |
| 3-Person Households | 6 (10.5%) | 0 (0.0%) |
| 4-Person Households | 7 (12.3%) | 0 (0.0%) |
| 5-Person Households | 13 (22.8%) | 0 (0.0%) |
| 6-Person Households | 9 (15.8%) | 0 (0.0%) |
| 7+ Person Households | 5 (8.8%) | 0 (0.0%) |
| Total | 48 (84.2%) | 9 (15.8%) |
Female Fertility in Koliganek
Fertility by Age in Koliganek
Average fertility rate in Koliganek is 64.0 births per 1,000 women. Women in the age bracket of 20 to 34 years have the highest fertility rate with 143.0 births per 1,000 women. Women in the age bracket of 20 to 34 years acount for 100.0% of all women with births.
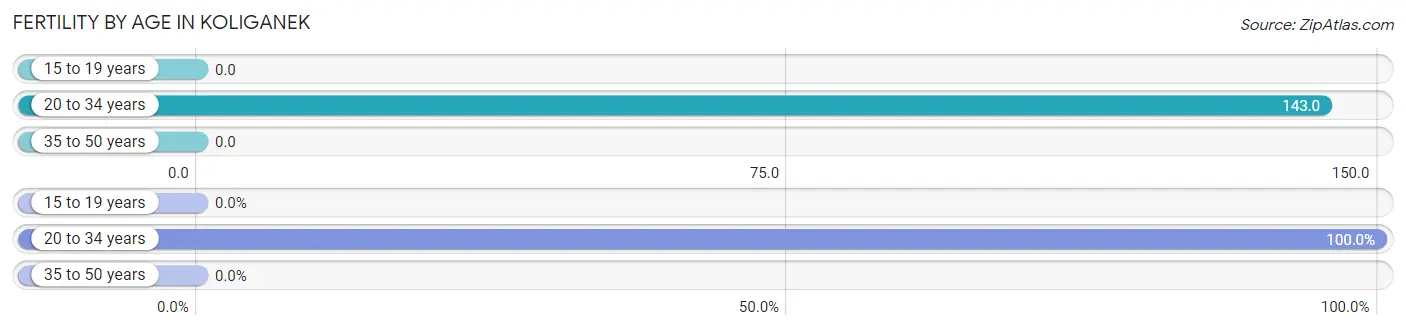
| Age Bracket | Women with Births | Births / 1,000 Women |
| 15 to 19 years | 0 (0.0%) | 0.0 |
| 20 to 34 years | 3 (100.0%) | 143.0 |
| 35 to 50 years | 0 (0.0%) | 0.0 |
| Total | 3 (100.0%) | 64.0 |
Fertility by Age by Marriage Status in Koliganek
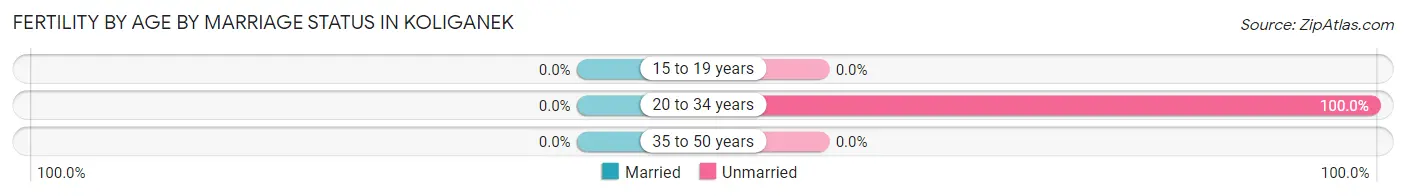
| Age Bracket | Married | Unmarried |
| 15 to 19 years | 0 (0.0%) | 0 (0.0%) |
| 20 to 34 years | 0 (0.0%) | 3 (100.0%) |
| 35 to 50 years | 0 (0.0%) | 0 (0.0%) |
| Total | 0 (0.0%) | 3 (100.0%) |
Fertility by Education in Koliganek
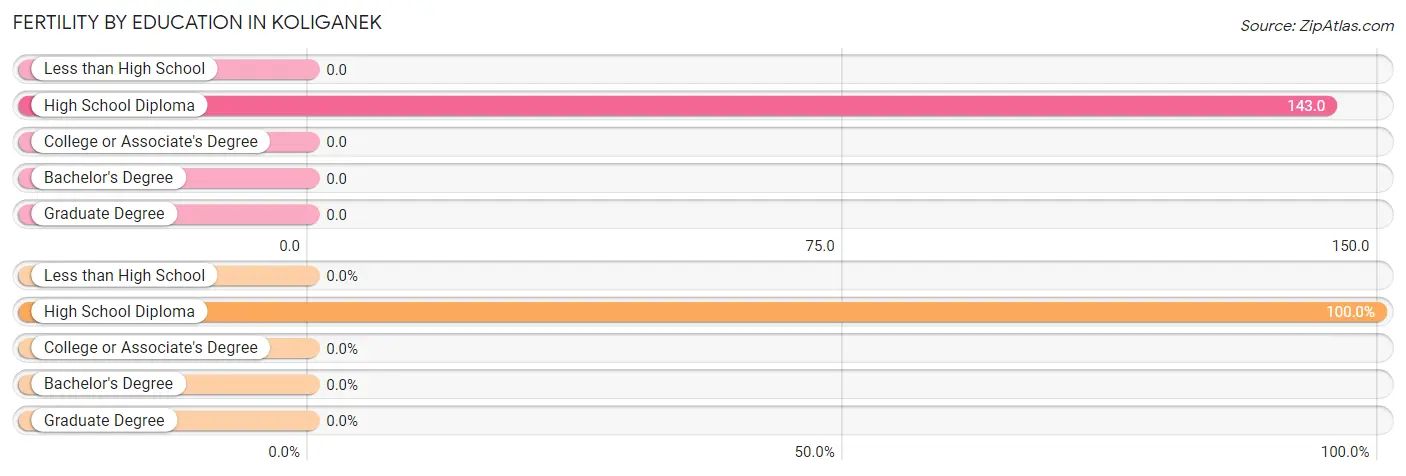
| Educational Attainment | Women with Births | Births / 1,000 Women |
| Less than High School | 0 (0.0%) | 0.0 |
| High School Diploma | 3 (100.0%) | 143.0 |
| College or Associate's Degree | 0 (0.0%) | 0.0 |
| Bachelor's Degree | 0 (0.0%) | 0.0 |
| Graduate Degree | 0 (0.0%) | 0.0 |
| Total | 3 (100.0%) | 64.0 |
Fertility by Education by Marriage Status in Koliganek
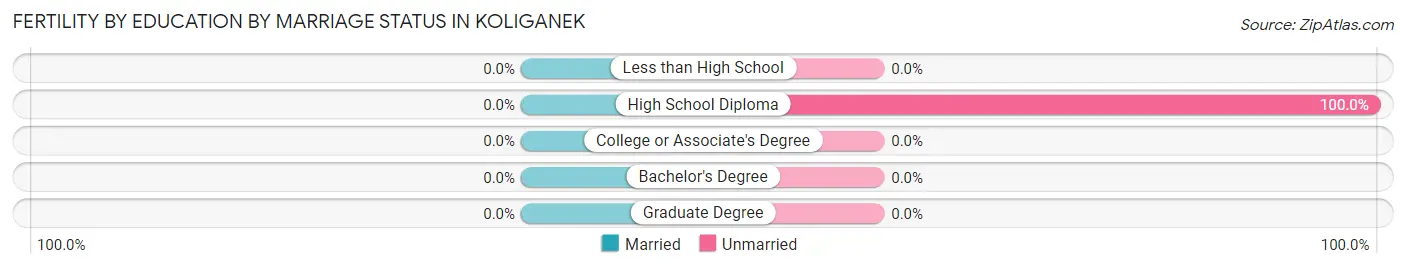
| Educational Attainment | Married | Unmarried |
| Less than High School | 0 (0.0%) | 0 (0.0%) |
| High School Diploma | 0 (0.0%) | 3 (100.0%) |
| College or Associate's Degree | 0 (0.0%) | 0 (0.0%) |
| Bachelor's Degree | 0 (0.0%) | 0 (0.0%) |
| Graduate Degree | 0 (0.0%) | 0 (0.0%) |
| Total | 0 (0.0%) | 3 (100.0%) |
Employment Characteristics in Koliganek
Employment by Class of Employer in Koliganek
Among the 47 employed individuals in Koliganek, local government employees (20 | 42.5%), not-for-profit organizations (10 | 21.3%), and private company employees (7 | 14.9%) make up the most common classes of employment.
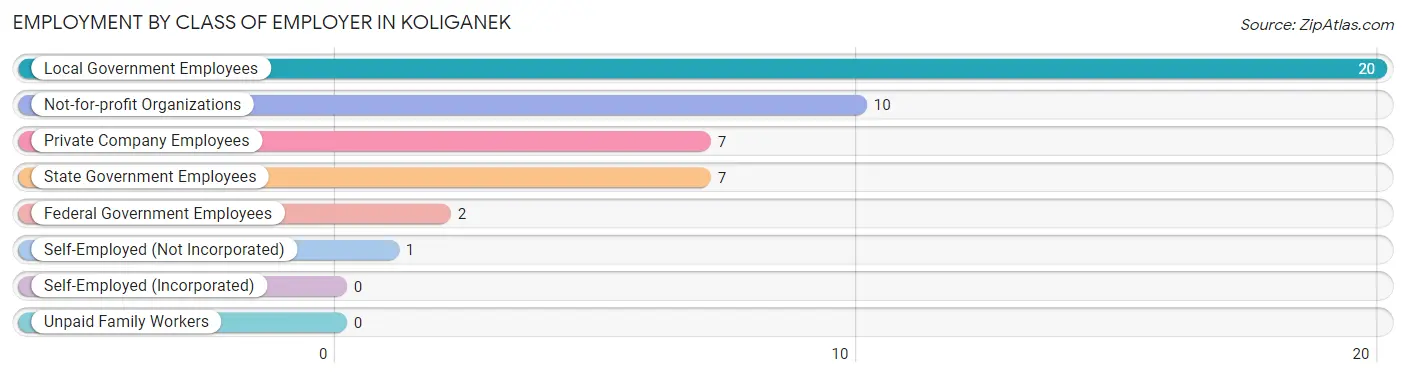
| Employer Class | # Employees | % Employees |
| Private Company Employees | 7 | 14.9% |
| Self-Employed (Incorporated) | 0 | 0.0% |
| Self-Employed (Not Incorporated) | 1 | 2.1% |
| Not-for-profit Organizations | 10 | 21.3% |
| Local Government Employees | 20 | 42.5% |
| State Government Employees | 7 | 14.9% |
| Federal Government Employees | 2 | 4.3% |
| Unpaid Family Workers | 0 | 0.0% |
| Total | 47 | 100.0% |
Employment Status by Age in Koliganek
According to the labor force statistics for Koliganek, out of the total population over 16 years of age (144), 50.7% or 73 individuals are in the labor force, with 27.4% or 20 of them unemployed. The age group with the highest labor force participation rate is 25 to 29 years, with 91.7% or 11 individuals in the labor force. Within the labor force, the 16 to 19 years age range has the highest percentage of unemployed individuals, with 100.0% or 5 of them being unemployed.
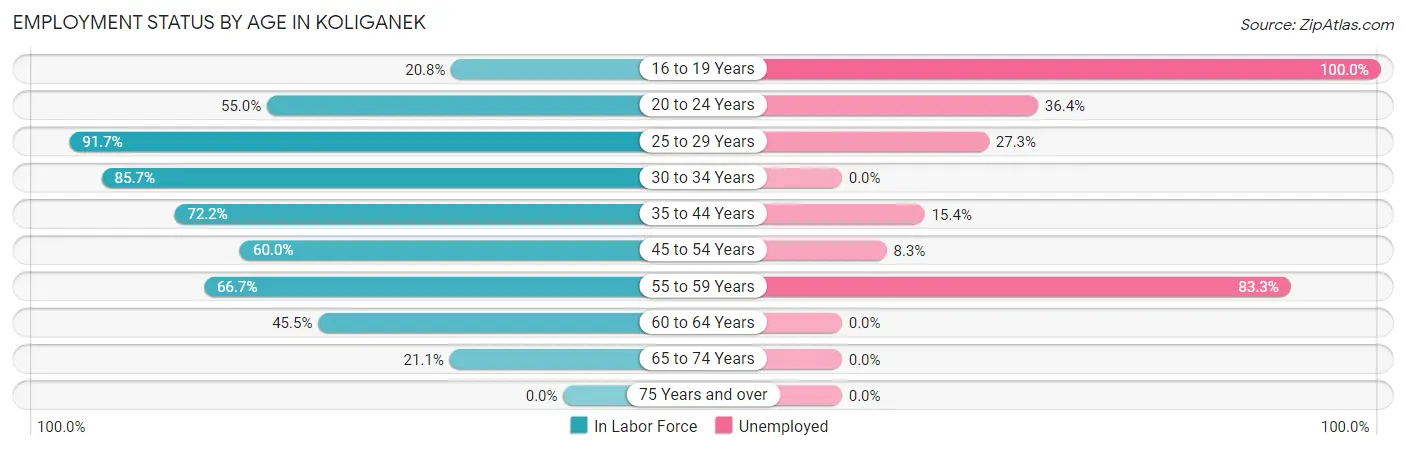
| Age Bracket | In Labor Force | Unemployed |
| 16 to 19 Years | 5 (20.8%) | 5 (100.0%) |
| 20 to 24 Years | 11 (55.0%) | 4 (36.4%) |
| 25 to 29 Years | 11 (91.7%) | 3 (27.3%) |
| 30 to 34 Years | 6 (85.7%) | 0 (0.0%) |
| 35 to 44 Years | 13 (72.2%) | 2 (15.4%) |
| 45 to 54 Years | 12 (60.0%) | 1 (8.3%) |
| 55 to 59 Years | 6 (66.7%) | 5 (83.3%) |
| 60 to 64 Years | 5 (45.5%) | 0 (0.0%) |
| 65 to 74 Years | 4 (21.1%) | 0 (0.0%) |
| 75 Years and over | 0 (0.0%) | 0 (0.0%) |
| Total | 73 (50.7%) | 20 (27.4%) |
Employment Status by Educational Attainment in Koliganek
According to labor force statistics for Koliganek, 68.8% of individuals (53) out of the total population between 25 and 64 years of age (77) are in the labor force, with 20.8% or 11 of them being unemployed. The group with the highest labor force participation rate are those with the educational attainment of bachelor's degree or higher, with 100.0% or 1 individuals in the labor force. Within the labor force, individuals with high school diploma education have the highest percentage of unemployment, with 28.6% or 8 of them being unemployed.
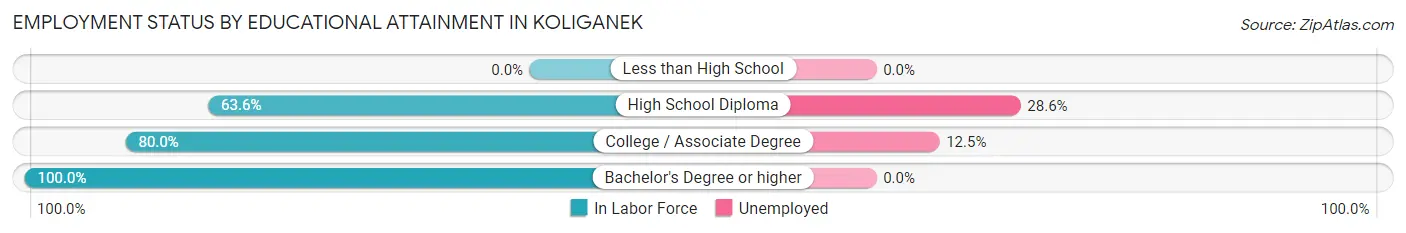
| Educational Attainment | In Labor Force | Unemployed |
| Less than High School | 0 (0.0%) | 0 (0.0%) |
| High School Diploma | 28 (63.6%) | 13 (28.6%) |
| College / Associate Degree | 24 (80.0%) | 4 (12.5%) |
| Bachelor's Degree or higher | 1 (100.0%) | 0 (0.0%) |
| Total | 53 (68.8%) | 16 (20.8%) |
Employment Occupations by Sex in Koliganek
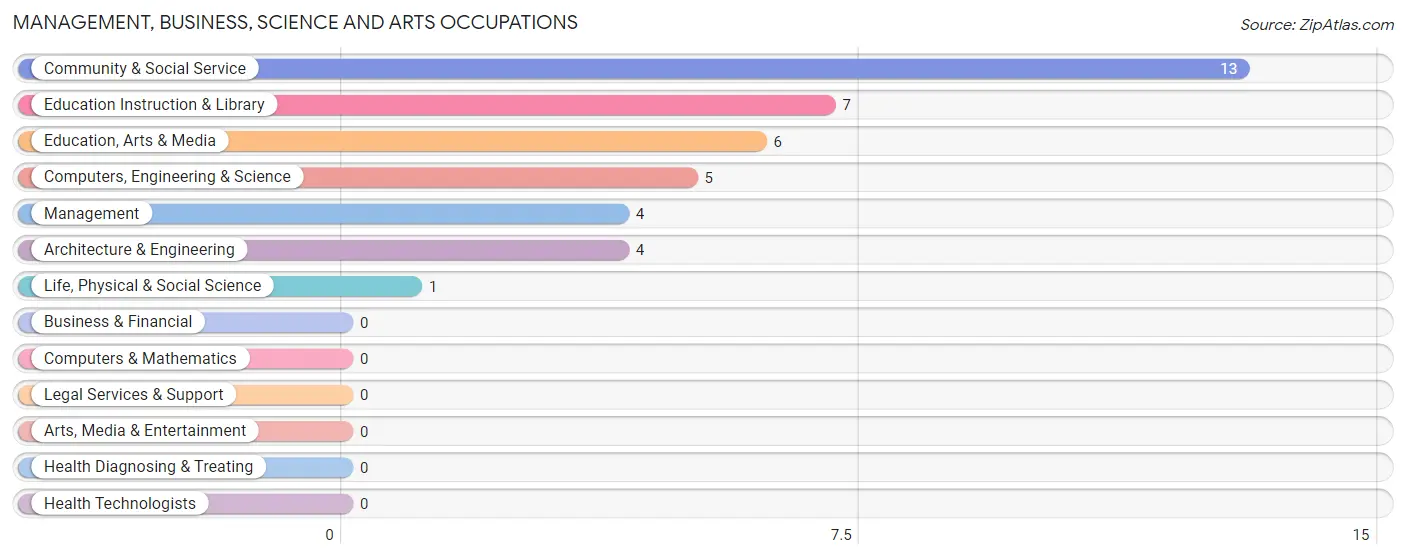
Management, Business, Science and Arts Occupations
The most common Management, Business, Science and Arts occupations in Koliganek are Community & Social Service (13 | 24.5%), Education Instruction & Library (7 | 13.2%), Education, Arts & Media (6 | 11.3%), Computers, Engineering & Science (5 | 9.4%), and Management (4 | 7.5%).
Management, Business, Science and Arts Occupations by Sex
Within the Management, Business, Science and Arts occupations in Koliganek, the most male-oriented occupations are Architecture & Engineering (50.0%), Computers, Engineering & Science (40.0%), and Education, Arts & Media (33.3%), while the most female-oriented occupations are Management (100.0%), Life, Physical & Social Science (100.0%), and Education Instruction & Library (100.0%).
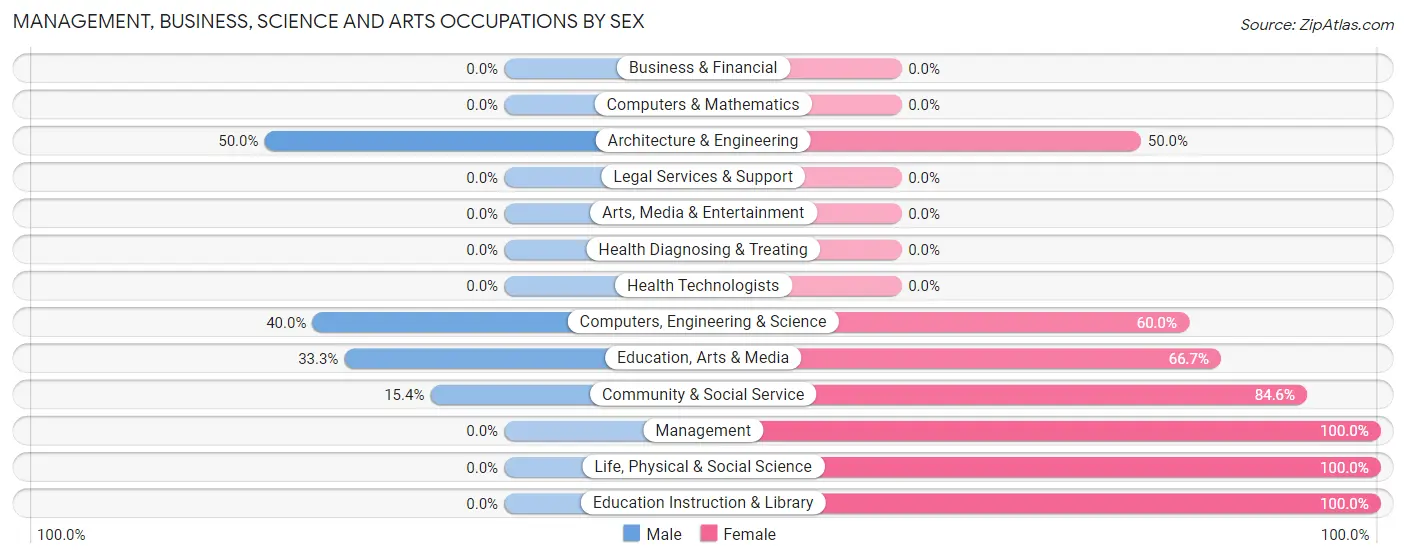
| Occupation | Male | Female |
| Management | 0 (0.0%) | 4 (100.0%) |
| Business & Financial | 0 (0.0%) | 0 (0.0%) |
| Computers, Engineering & Science | 2 (40.0%) | 3 (60.0%) |
| Computers & Mathematics | 0 (0.0%) | 0 (0.0%) |
| Architecture & Engineering | 2 (50.0%) | 2 (50.0%) |
| Life, Physical & Social Science | 0 (0.0%) | 1 (100.0%) |
| Community & Social Service | 2 (15.4%) | 11 (84.6%) |
| Education, Arts & Media | 2 (33.3%) | 4 (66.7%) |
| Legal Services & Support | 0 (0.0%) | 0 (0.0%) |
| Education Instruction & Library | 0 (0.0%) | 7 (100.0%) |
| Arts, Media & Entertainment | 0 (0.0%) | 0 (0.0%) |
| Health Diagnosing & Treating | 0 (0.0%) | 0 (0.0%) |
| Health Technologists | 0 (0.0%) | 0 (0.0%) |
| Total (Category) | 4 (18.2%) | 18 (81.8%) |
| Total (Overall) | 24 (45.3%) | 29 (54.7%) |
Services Occupations
The most common Services occupations in Koliganek are Cleaning & Maintenance (7 | 13.2%), Healthcare Support (5 | 9.4%), Security & Protection (3 | 5.7%), Law Enforcement (3 | 5.7%), and Food Preparation & Serving (1 | 1.9%).
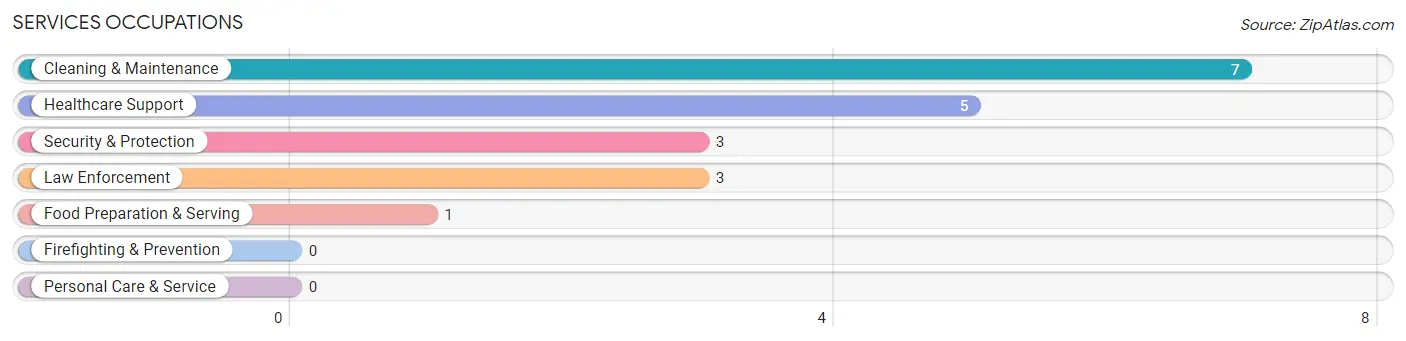
Services Occupations by Sex
Within the Services occupations in Koliganek, the most male-oriented occupations are Security & Protection (100.0%), Law Enforcement (100.0%), and Cleaning & Maintenance (42.9%), while the most female-oriented occupations are Healthcare Support (100.0%), Food Preparation & Serving (100.0%), and Cleaning & Maintenance (57.1%).
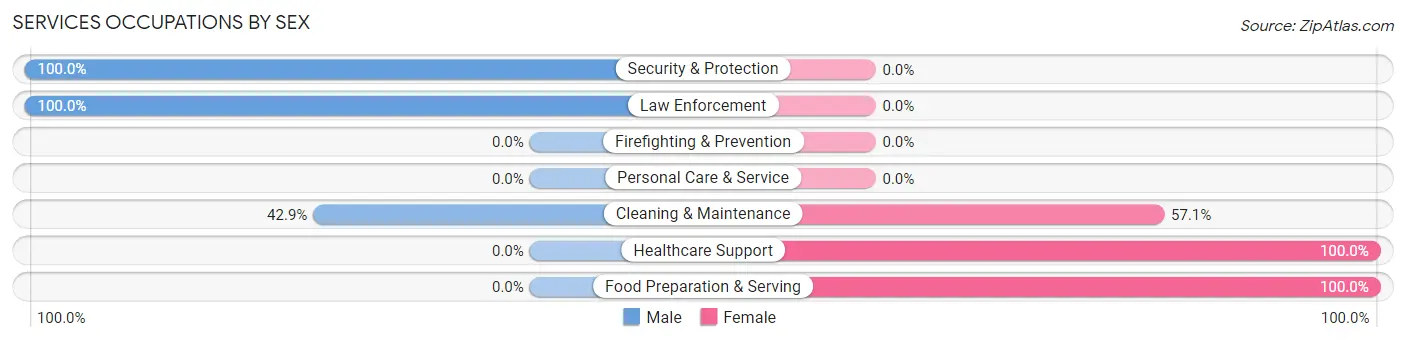
| Occupation | Male | Female |
| Healthcare Support | 0 (0.0%) | 5 (100.0%) |
| Security & Protection | 3 (100.0%) | 0 (0.0%) |
| Firefighting & Prevention | 0 (0.0%) | 0 (0.0%) |
| Law Enforcement | 3 (100.0%) | 0 (0.0%) |
| Food Preparation & Serving | 0 (0.0%) | 1 (100.0%) |
| Cleaning & Maintenance | 3 (42.9%) | 4 (57.1%) |
| Personal Care & Service | 0 (0.0%) | 0 (0.0%) |
| Total (Category) | 6 (37.5%) | 10 (62.5%) |
| Total (Overall) | 24 (45.3%) | 29 (54.7%) |
Sales and Office Occupations
The most common Sales and Office occupations in Koliganek are Office & Administration (3 | 5.7%), and Sales & Related (2 | 3.8%).
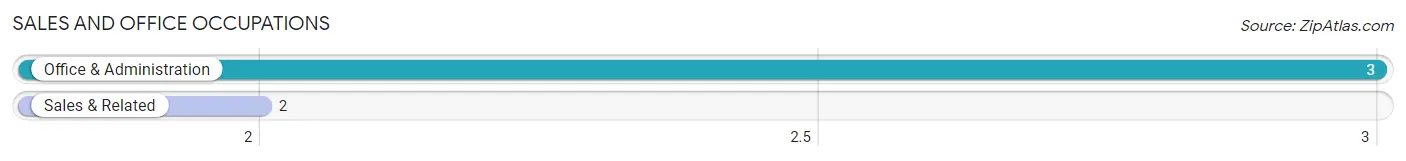
Sales and Office Occupations by Sex
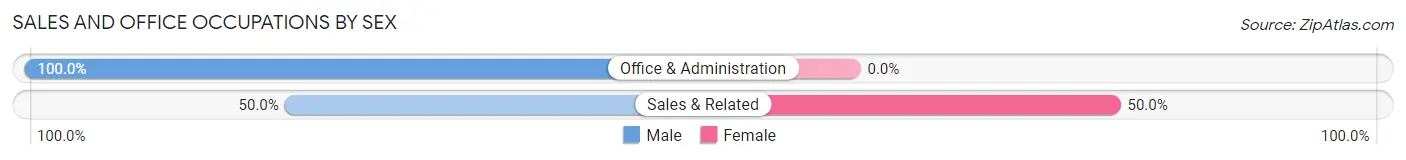
| Occupation | Male | Female |
| Sales & Related | 1 (50.0%) | 1 (50.0%) |
| Office & Administration | 3 (100.0%) | 0 (0.0%) |
| Total (Category) | 4 (80.0%) | 1 (20.0%) |
| Total (Overall) | 24 (45.3%) | 29 (54.7%) |
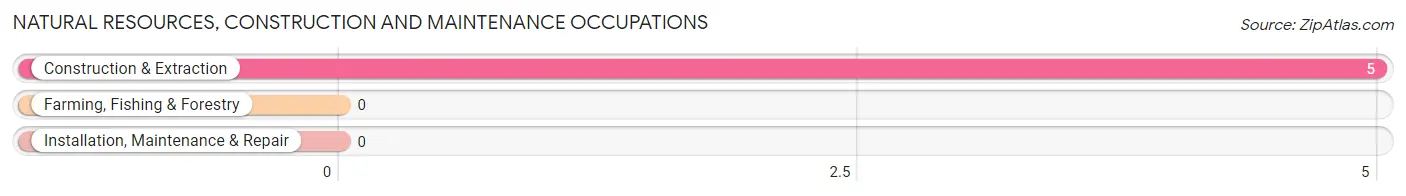
Natural Resources, Construction and Maintenance Occupations
The most common Natural Resources, Construction and Maintenance occupations in Koliganek are , and Construction & Extraction (5 | 9.4%).
Natural Resources, Construction and Maintenance Occupations by Sex
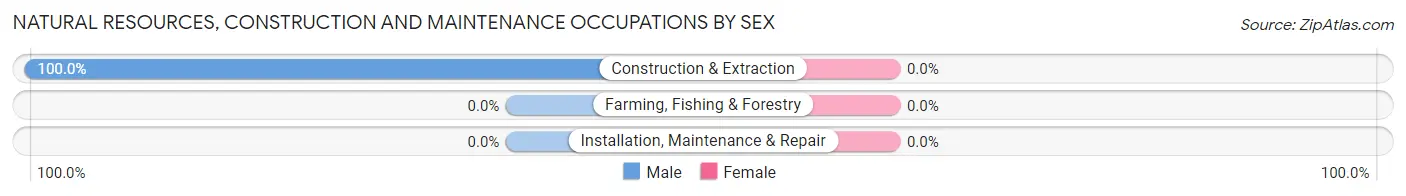
| Occupation | Male | Female |
| Farming, Fishing & Forestry | 0 (0.0%) | 0 (0.0%) |
| Construction & Extraction | 5 (100.0%) | 0 (0.0%) |
| Installation, Maintenance & Repair | 0 (0.0%) | 0 (0.0%) |
| Total (Category) | 5 (100.0%) | 0 (0.0%) |
| Total (Overall) | 24 (45.3%) | 29 (54.7%) |
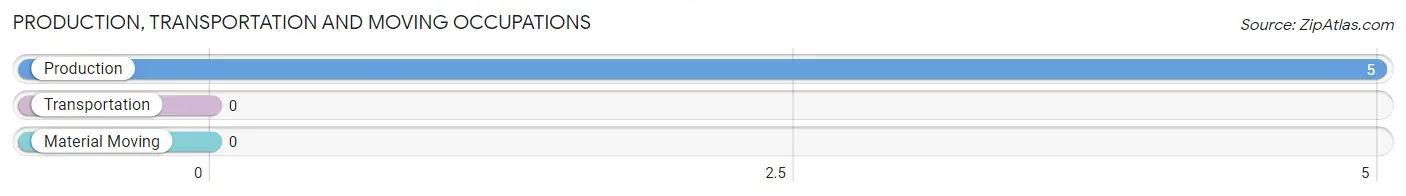
Production, Transportation and Moving Occupations
The most common Production, Transportation and Moving occupations in Koliganek are , and Production (5 | 9.4%).
Production, Transportation and Moving Occupations by Sex
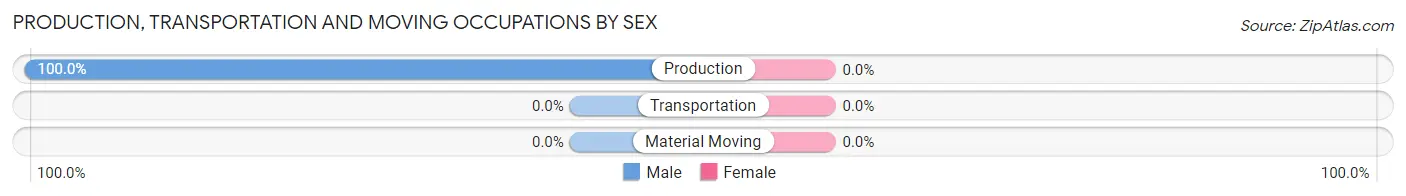
| Occupation | Male | Female |
| Production | 5 (100.0%) | 0 (0.0%) |
| Transportation | 0 (0.0%) | 0 (0.0%) |
| Material Moving | 0 (0.0%) | 0 (0.0%) |
| Total (Category) | 5 (100.0%) | 0 (0.0%) |
| Total (Overall) | 24 (45.3%) | 29 (54.7%) |
Employment Industries by Sex in Koliganek
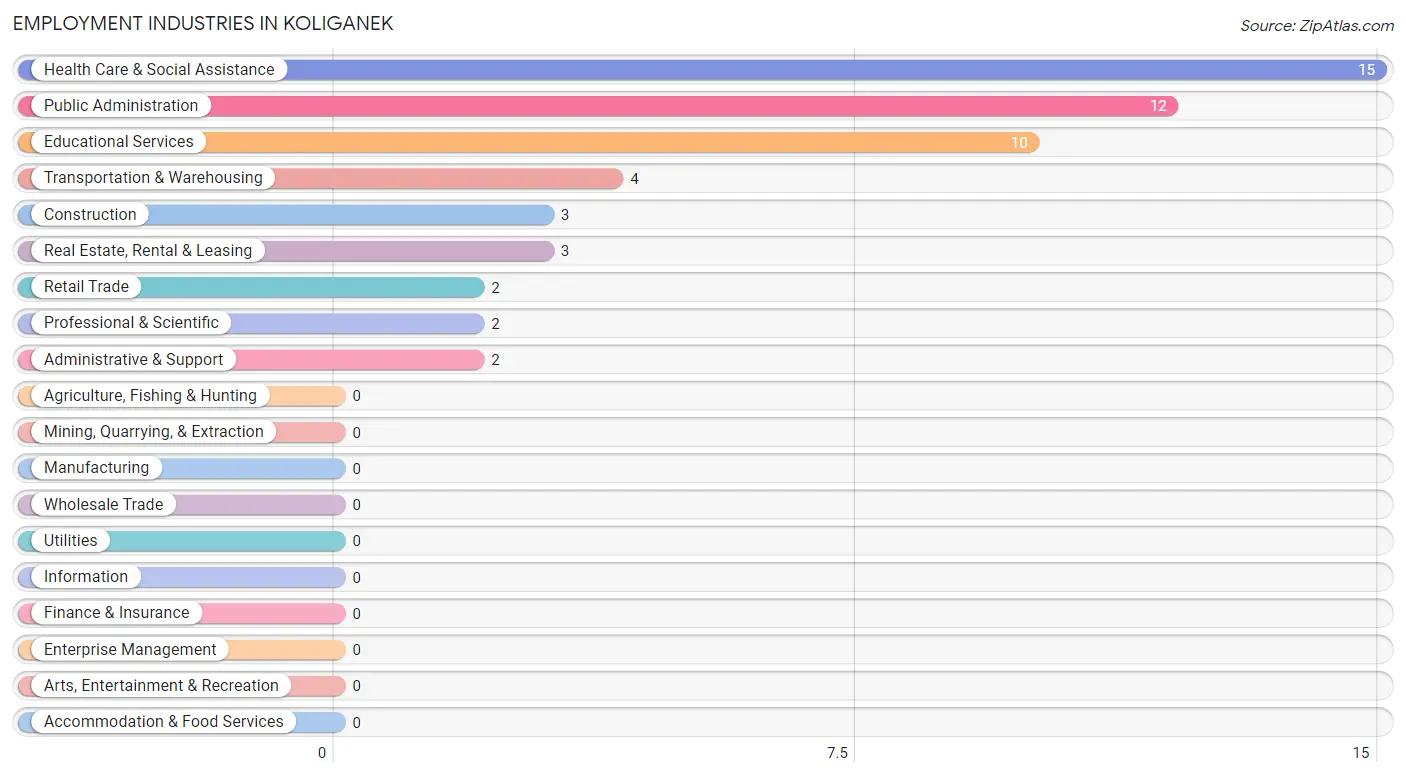
Employment Industries in Koliganek
The major employment industries in Koliganek include Health Care & Social Assistance (15 | 28.3%), Public Administration (12 | 22.6%), Educational Services (10 | 18.9%), Transportation & Warehousing (4 | 7.5%), and Construction (3 | 5.7%).
Employment Industries by Sex in Koliganek
The Koliganek industries that see more men than women are Construction (100.0%), Real Estate, Rental & Leasing (100.0%), and Professional & Scientific (100.0%), whereas the industries that tend to have a higher number of women are Health Care & Social Assistance (86.7%), Educational Services (80.0%), and Retail Trade (50.0%).
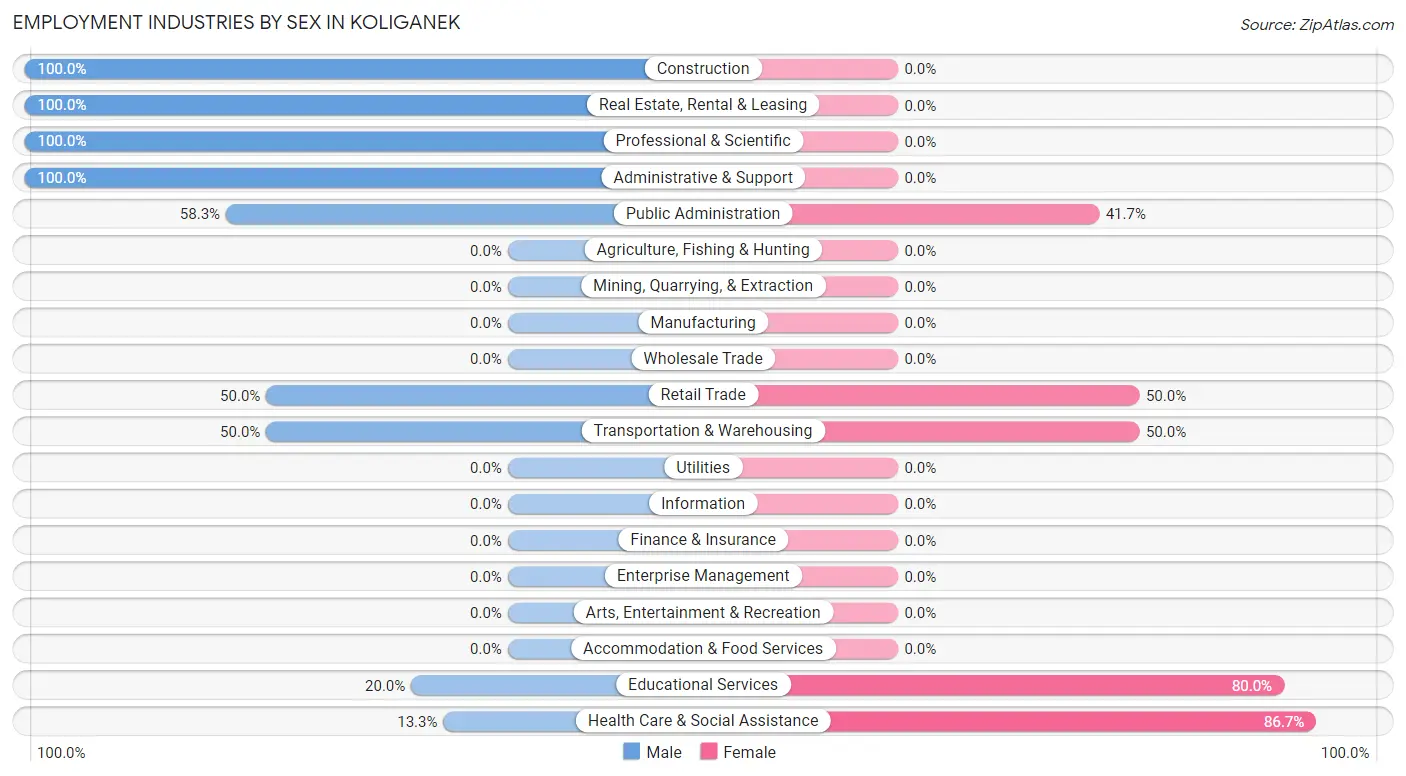
| Industry | Male | Female |
| Agriculture, Fishing & Hunting | 0 (0.0%) | 0 (0.0%) |
| Mining, Quarrying, & Extraction | 0 (0.0%) | 0 (0.0%) |
| Construction | 3 (100.0%) | 0 (0.0%) |
| Manufacturing | 0 (0.0%) | 0 (0.0%) |
| Wholesale Trade | 0 (0.0%) | 0 (0.0%) |
| Retail Trade | 1 (50.0%) | 1 (50.0%) |
| Transportation & Warehousing | 2 (50.0%) | 2 (50.0%) |
| Utilities | 0 (0.0%) | 0 (0.0%) |
| Information | 0 (0.0%) | 0 (0.0%) |
| Finance & Insurance | 0 (0.0%) | 0 (0.0%) |
| Real Estate, Rental & Leasing | 3 (100.0%) | 0 (0.0%) |
| Professional & Scientific | 2 (100.0%) | 0 (0.0%) |
| Enterprise Management | 0 (0.0%) | 0 (0.0%) |
| Administrative & Support | 2 (100.0%) | 0 (0.0%) |
| Educational Services | 2 (20.0%) | 8 (80.0%) |
| Health Care & Social Assistance | 2 (13.3%) | 13 (86.7%) |
| Arts, Entertainment & Recreation | 0 (0.0%) | 0 (0.0%) |
| Accommodation & Food Services | 0 (0.0%) | 0 (0.0%) |
| Public Administration | 7 (58.3%) | 5 (41.7%) |
| Total | 24 (45.3%) | 29 (54.7%) |
Education in Koliganek
School Enrollment in Koliganek
The most common levels of schooling among the 97 students in Koliganek are middle school (27 | 27.8%), high school (27 | 27.8%), and elementary school (24 | 24.7%).
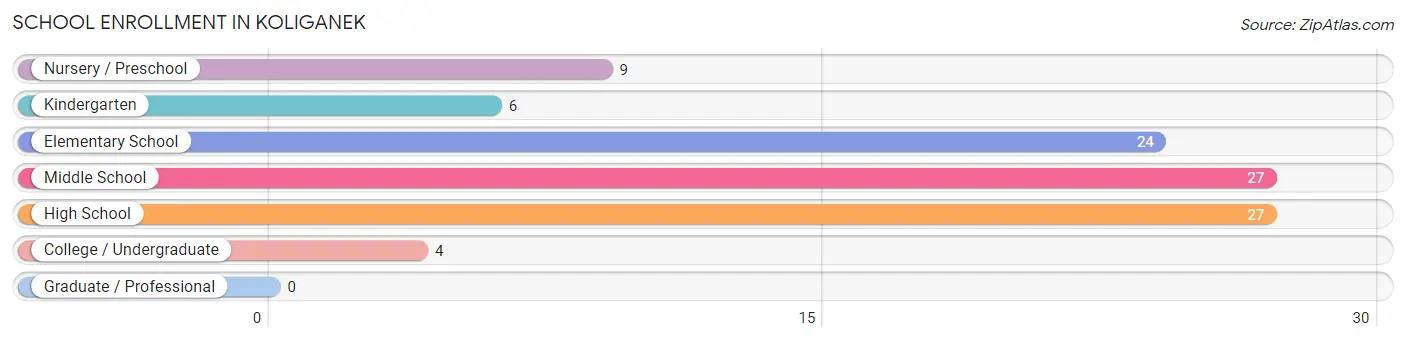
| School Level | # Students | % Students |
| Nursery / Preschool | 9 | 9.3% |
| Kindergarten | 6 | 6.2% |
| Elementary School | 24 | 24.7% |
| Middle School | 27 | 27.8% |
| High School | 27 | 27.8% |
| College / Undergraduate | 4 | 4.1% |
| Graduate / Professional | 0 | 0.0% |
| Total | 97 | 100.0% |
School Enrollment by Age by Funding Source in Koliganek
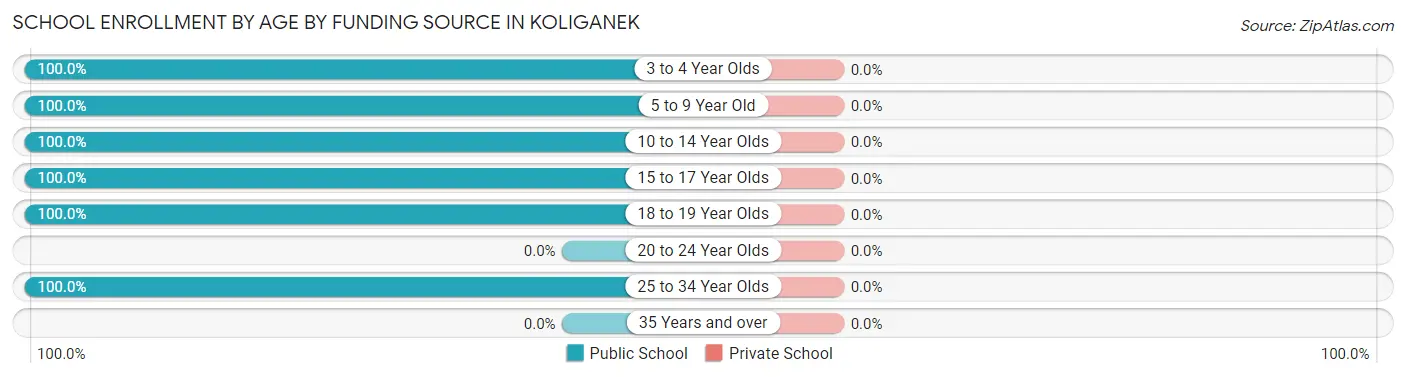
| Age Bracket | Public School | Private School |
| 3 to 4 Year Olds | 7 (100.0%) | 0 (0.0%) |
| 5 to 9 Year Old | 27 (100.0%) | 0 (0.0%) |
| 10 to 14 Year Olds | 36 (100.0%) | 0 (0.0%) |
| 15 to 17 Year Olds | 15 (100.0%) | 0 (0.0%) |
| 18 to 19 Year Olds | 10 (100.0%) | 0 (0.0%) |
| 20 to 24 Year Olds | 0 (0.0%) | 0 (0.0%) |
| 25 to 34 Year Olds | 2 (100.0%) | 0 (0.0%) |
| 35 Years and over | 0 (0.0%) | 0 (0.0%) |
| Total | 97 (100.0%) | 0 (0.0%) |
Educational Attainment by Field of Study in Koliganek
Liberal arts & history (4 | 66.7%), and education (2 | 33.3%) are the most common fields of study among 6 individuals in Koliganek who have obtained a bachelor's degree or higher.
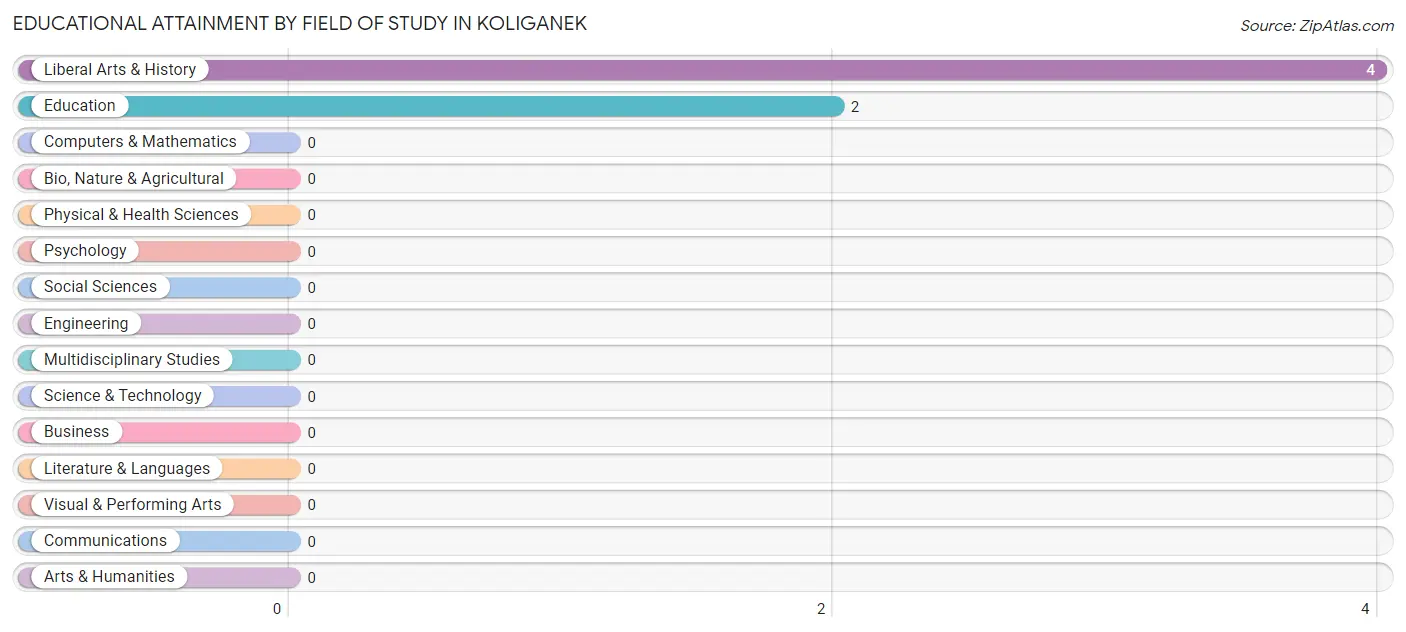
| Field of Study | # Graduates | % Graduates |
| Computers & Mathematics | 0 | 0.0% |
| Bio, Nature & Agricultural | 0 | 0.0% |
| Physical & Health Sciences | 0 | 0.0% |
| Psychology | 0 | 0.0% |
| Social Sciences | 0 | 0.0% |
| Engineering | 0 | 0.0% |
| Multidisciplinary Studies | 0 | 0.0% |
| Science & Technology | 0 | 0.0% |
| Business | 0 | 0.0% |
| Education | 2 | 33.3% |
| Literature & Languages | 0 | 0.0% |
| Liberal Arts & History | 4 | 66.7% |
| Visual & Performing Arts | 0 | 0.0% |
| Communications | 0 | 0.0% |
| Arts & Humanities | 0 | 0.0% |
| Total | 6 | 100.0% |
Transportation & Commute in Koliganek
Vehicle Availability by Sex in Koliganek
The most prevalent vehicle ownership categories in Koliganek are males with no vehicle (10, accounting for 47.6%) and females with no vehicle (20, making up 38.5%).
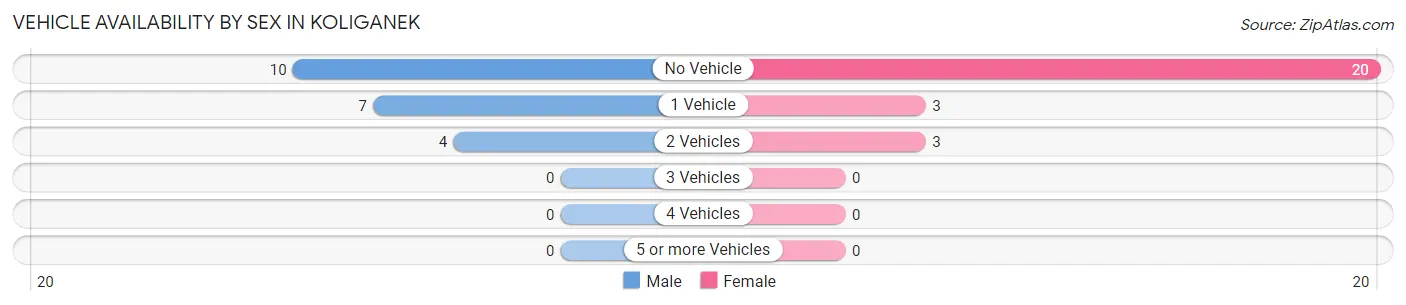
| Vehicles Available | Male | Female |
| No Vehicle | 10 (47.6%) | 20 (76.9%) |
| 1 Vehicle | 7 (33.3%) | 3 (11.5%) |
| 2 Vehicles | 4 (19.1%) | 3 (11.5%) |
| 3 Vehicles | 0 (0.0%) | 0 (0.0%) |
| 4 Vehicles | 0 (0.0%) | 0 (0.0%) |
| 5 or more Vehicles | 0 (0.0%) | 0 (0.0%) |
| Total | 21 (100.0%) | 26 (100.0%) |
Commute Time in Koliganek
The most frequently occuring commute durations in Koliganek are less than 5 minutes (28 commuters, 63.6%), 5 to 9 minutes (9 commuters, 20.4%), and 10 to 14 minutes (3 commuters, 6.8%).
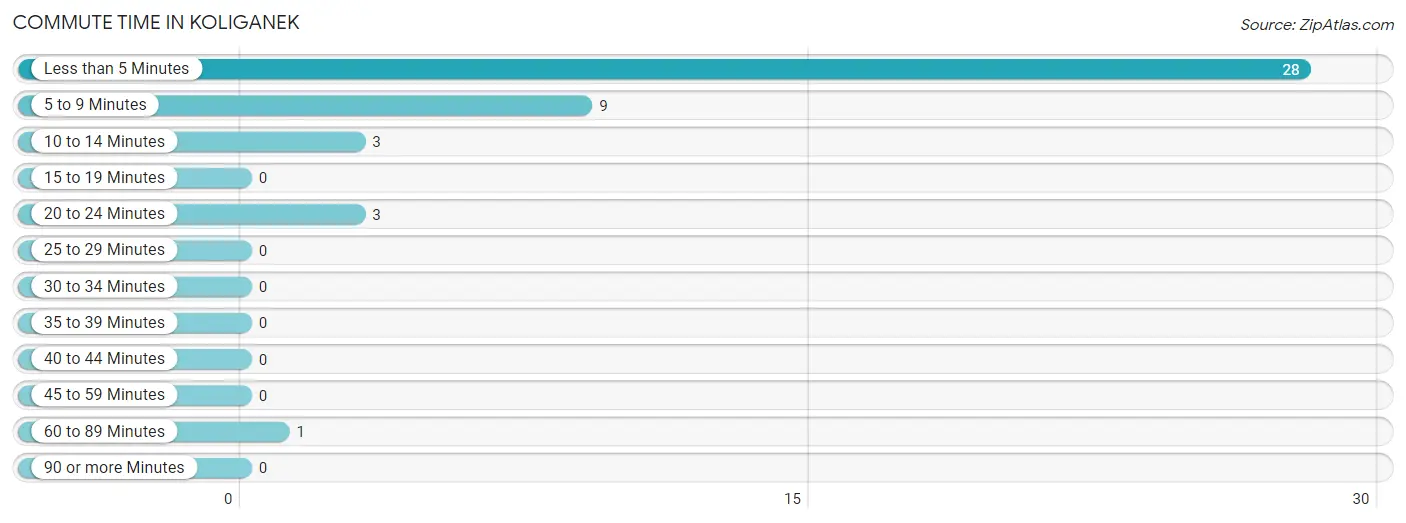
| Commute Time | # Commuters | % Commuters |
| Less than 5 Minutes | 28 | 63.6% |
| 5 to 9 Minutes | 9 | 20.4% |
| 10 to 14 Minutes | 3 | 6.8% |
| 15 to 19 Minutes | 0 | 0.0% |
| 20 to 24 Minutes | 3 | 6.8% |
| 25 to 29 Minutes | 0 | 0.0% |
| 30 to 34 Minutes | 0 | 0.0% |
| 35 to 39 Minutes | 0 | 0.0% |
| 40 to 44 Minutes | 0 | 0.0% |
| 45 to 59 Minutes | 0 | 0.0% |
| 60 to 89 Minutes | 1 | 2.3% |
| 90 or more Minutes | 0 | 0.0% |
Commute Time by Sex in Koliganek
The most common commute times in Koliganek are less than 5 minutes (12 commuters, 57.1%) for males and less than 5 minutes (16 commuters, 69.6%) for females.
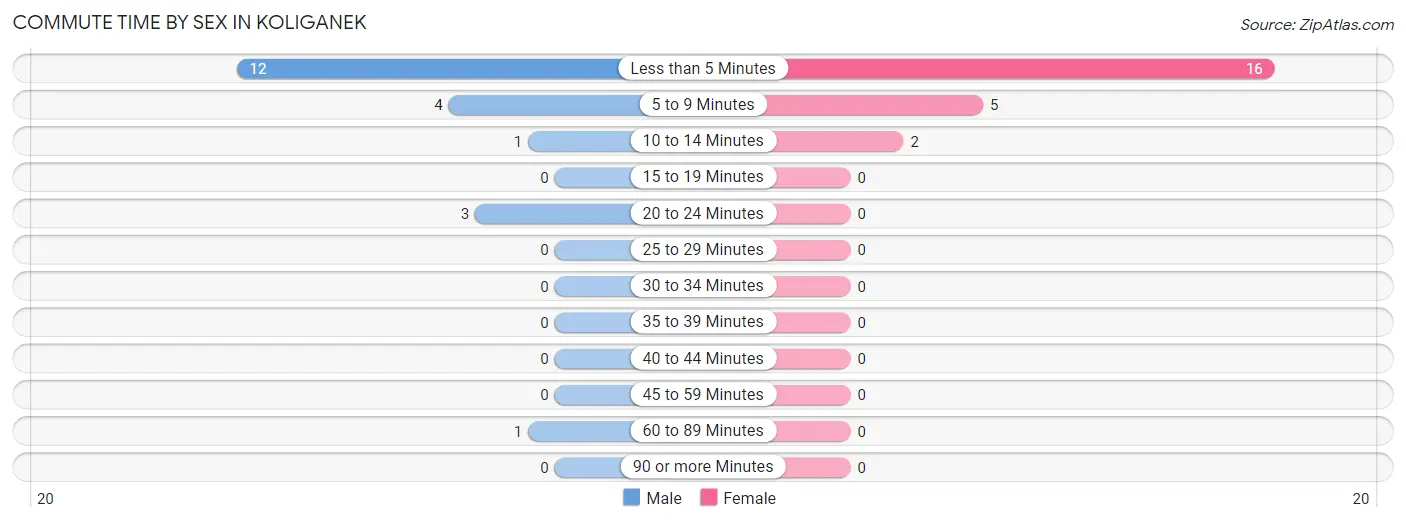
| Commute Time | Male | Female |
| Less than 5 Minutes | 12 (57.1%) | 16 (69.6%) |
| 5 to 9 Minutes | 4 (19.1%) | 5 (21.7%) |
| 10 to 14 Minutes | 1 (4.8%) | 2 (8.7%) |
| 15 to 19 Minutes | 0 (0.0%) | 0 (0.0%) |
| 20 to 24 Minutes | 3 (14.3%) | 0 (0.0%) |
| 25 to 29 Minutes | 0 (0.0%) | 0 (0.0%) |
| 30 to 34 Minutes | 0 (0.0%) | 0 (0.0%) |
| 35 to 39 Minutes | 0 (0.0%) | 0 (0.0%) |
| 40 to 44 Minutes | 0 (0.0%) | 0 (0.0%) |
| 45 to 59 Minutes | 0 (0.0%) | 0 (0.0%) |
| 60 to 89 Minutes | 1 (4.8%) | 0 (0.0%) |
| 90 or more Minutes | 0 (0.0%) | 0 (0.0%) |
Time of Departure to Work by Sex in Koliganek
The most frequent times of departure to work in Koliganek are 8:30 AM to 8:59 AM (10, 47.6%) for males and 8:30 AM to 8:59 AM (12, 52.2%) for females.
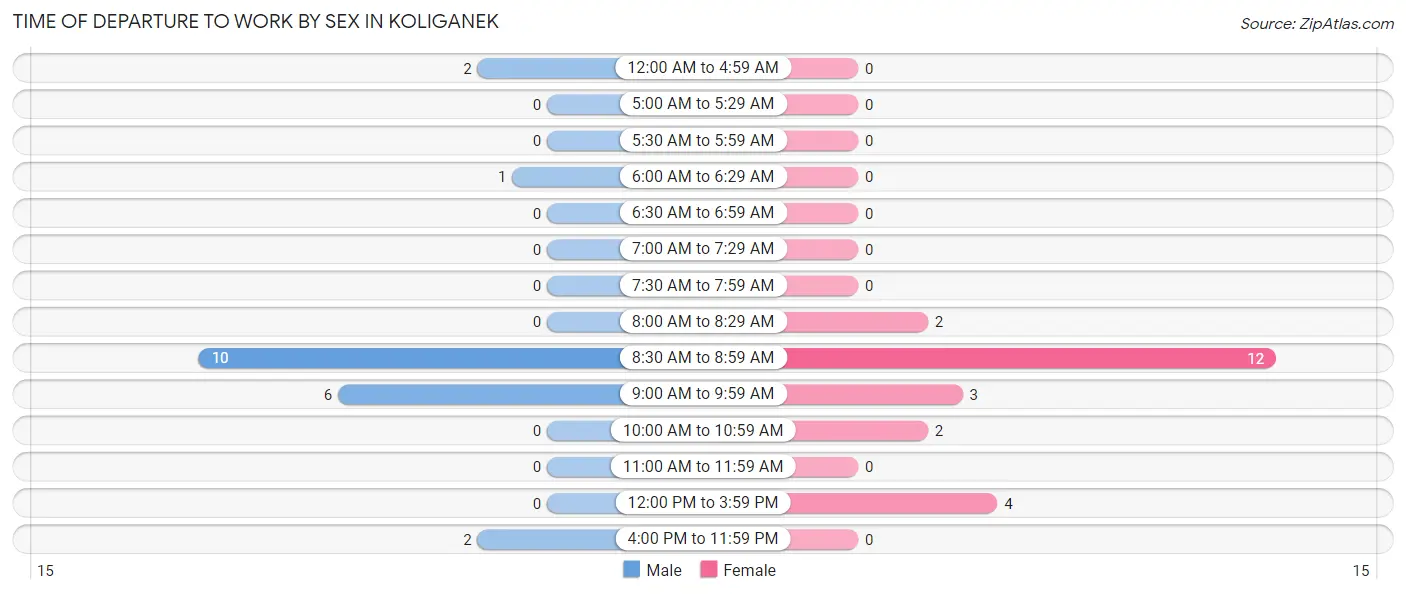
| Time of Departure | Male | Female |
| 12:00 AM to 4:59 AM | 2 (9.5%) | 0 (0.0%) |
| 5:00 AM to 5:29 AM | 0 (0.0%) | 0 (0.0%) |
| 5:30 AM to 5:59 AM | 0 (0.0%) | 0 (0.0%) |
| 6:00 AM to 6:29 AM | 1 (4.8%) | 0 (0.0%) |
| 6:30 AM to 6:59 AM | 0 (0.0%) | 0 (0.0%) |
| 7:00 AM to 7:29 AM | 0 (0.0%) | 0 (0.0%) |
| 7:30 AM to 7:59 AM | 0 (0.0%) | 0 (0.0%) |
| 8:00 AM to 8:29 AM | 0 (0.0%) | 2 (8.7%) |
| 8:30 AM to 8:59 AM | 10 (47.6%) | 12 (52.2%) |
| 9:00 AM to 9:59 AM | 6 (28.6%) | 3 (13.0%) |
| 10:00 AM to 10:59 AM | 0 (0.0%) | 2 (8.7%) |
| 11:00 AM to 11:59 AM | 0 (0.0%) | 0 (0.0%) |
| 12:00 PM to 3:59 PM | 0 (0.0%) | 4 (17.4%) |
| 4:00 PM to 11:59 PM | 2 (9.5%) | 0 (0.0%) |
| Total | 21 (100.0%) | 23 (100.0%) |
Housing Occupancy in Koliganek
Occupancy by Ownership in Koliganek
Of the total 57 dwellings in Koliganek, owner-occupied units account for 39 (68.4%), while renter-occupied units make up 18 (31.6%).
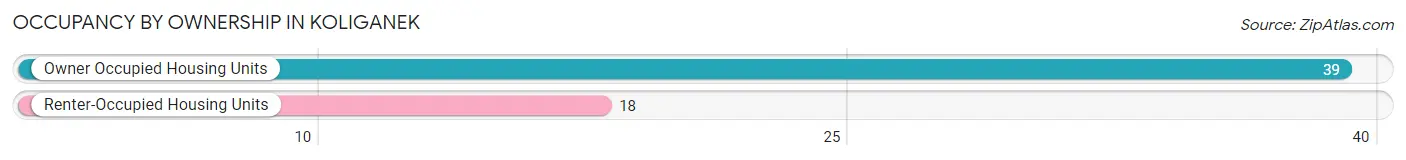
| Occupancy | # Housing Units | % Housing Units |
| Owner Occupied Housing Units | 39 | 68.4% |
| Renter-Occupied Housing Units | 18 | 31.6% |
| Total Occupied Housing Units | 57 | 100.0% |
Occupancy by Household Size in Koliganek
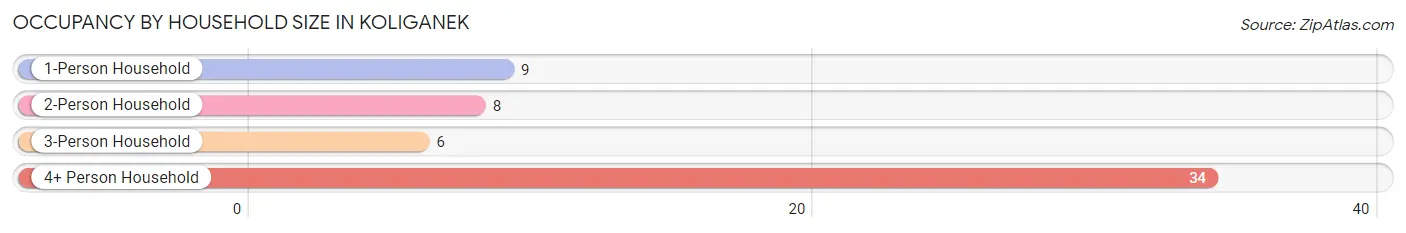
| Household Size | # Housing Units | % Housing Units |
| 1-Person Household | 9 | 15.8% |
| 2-Person Household | 8 | 14.0% |
| 3-Person Household | 6 | 10.5% |
| 4+ Person Household | 34 | 59.7% |
| Total Housing Units | 57 | 100.0% |
Occupancy by Ownership by Household Size in Koliganek
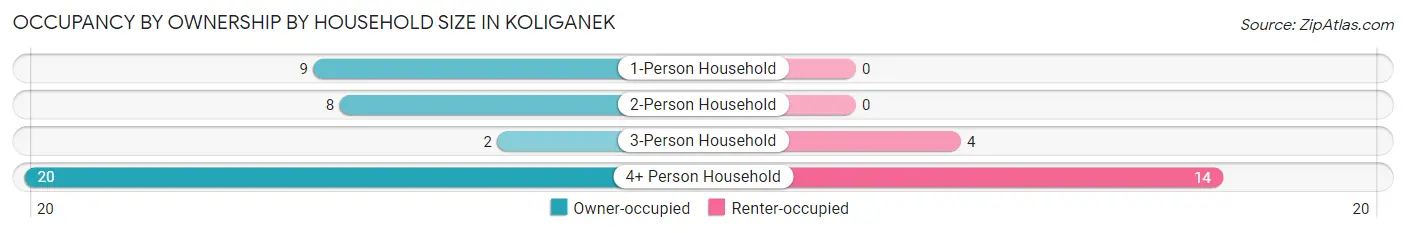
| Household Size | Owner-occupied | Renter-occupied |
| 1-Person Household | 9 (100.0%) | 0 (0.0%) |
| 2-Person Household | 8 (100.0%) | 0 (0.0%) |
| 3-Person Household | 2 (33.3%) | 4 (66.7%) |
| 4+ Person Household | 20 (58.8%) | 14 (41.2%) |
| Total Housing Units | 39 (68.4%) | 18 (31.6%) |
Occupancy by Educational Attainment in Koliganek
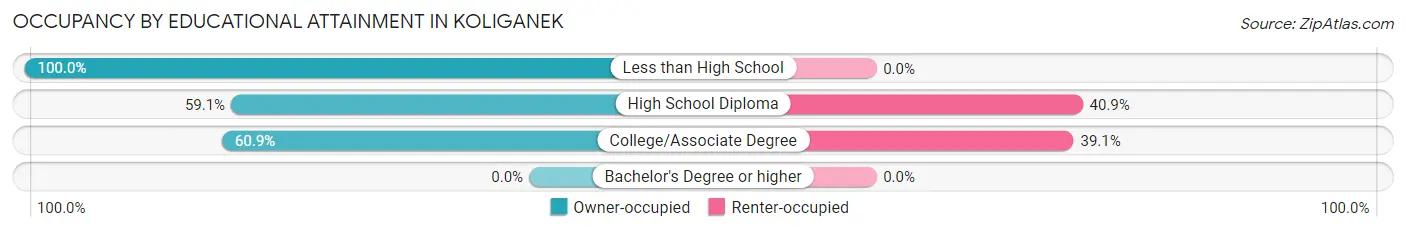
| Household Size | Owner-occupied | Renter-occupied |
| Less than High School | 12 (100.0%) | 0 (0.0%) |
| High School Diploma | 13 (59.1%) | 9 (40.9%) |
| College/Associate Degree | 14 (60.9%) | 9 (39.1%) |
| Bachelor's Degree or higher | 0 (0.0%) | 0 (0.0%) |
Occupancy by Age of Householder in Koliganek
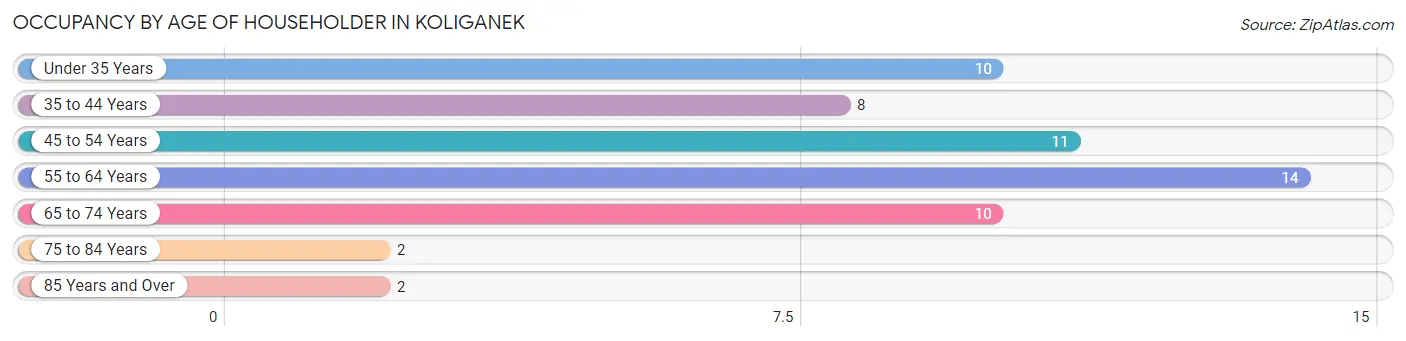
| Age Bracket | # Households | % Households |
| Under 35 Years | 10 | 17.5% |
| 35 to 44 Years | 8 | 14.0% |
| 45 to 54 Years | 11 | 19.3% |
| 55 to 64 Years | 14 | 24.6% |
| 65 to 74 Years | 10 | 17.5% |
| 75 to 84 Years | 2 | 3.5% |
| 85 Years and Over | 2 | 3.5% |
| Total | 57 | 100.0% |
Housing Finances in Koliganek
Median Income by Occupancy in Koliganek
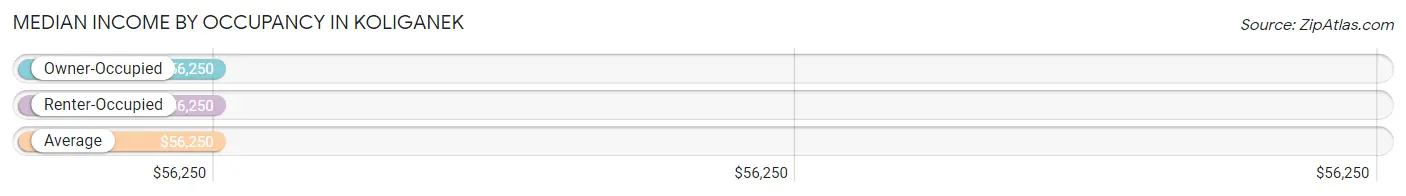
| Occupancy Type | # Households | Median Income |
| Owner-Occupied | 39 (68.4%) | $56,250 |
| Renter-Occupied | 18 (31.6%) | $56,250 |
| Average | 57 (100.0%) | $56,250 |
Occupancy by Householder Income Bracket in Koliganek
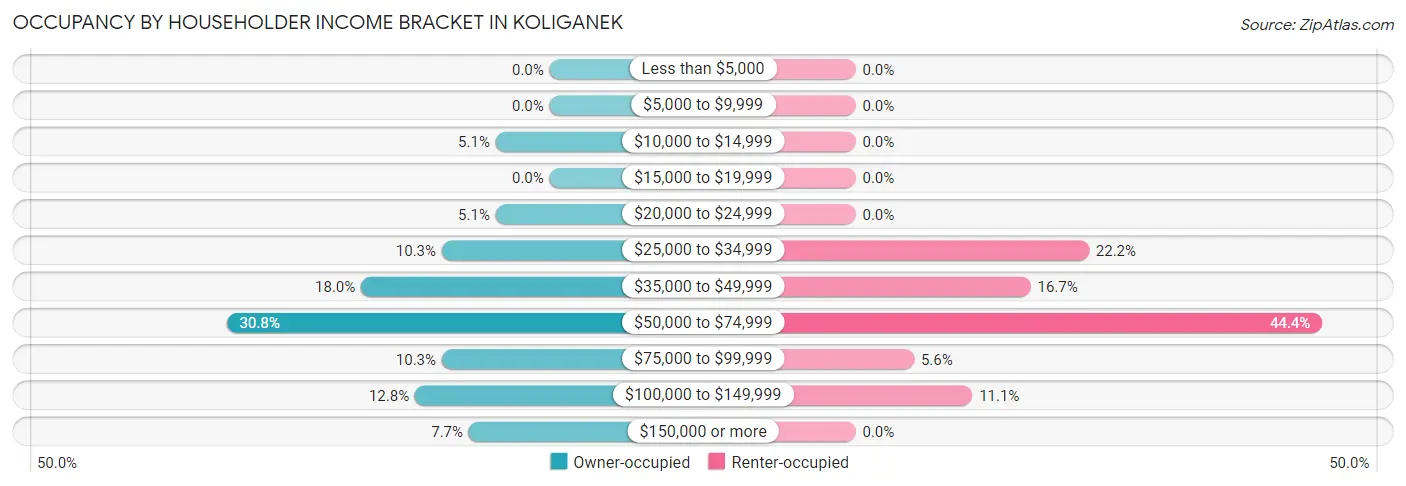
| Income Bracket | Owner-occupied | Renter-occupied |
| Less than $5,000 | 0 (0.0%) | 0 (0.0%) |
| $5,000 to $9,999 | 0 (0.0%) | 0 (0.0%) |
| $10,000 to $14,999 | 2 (5.1%) | 0 (0.0%) |
| $15,000 to $19,999 | 0 (0.0%) | 0 (0.0%) |
| $20,000 to $24,999 | 2 (5.1%) | 0 (0.0%) |
| $25,000 to $34,999 | 4 (10.3%) | 4 (22.2%) |
| $35,000 to $49,999 | 7 (17.9%) | 3 (16.7%) |
| $50,000 to $74,999 | 12 (30.8%) | 8 (44.4%) |
| $75,000 to $99,999 | 4 (10.3%) | 1 (5.6%) |
| $100,000 to $149,999 | 5 (12.8%) | 2 (11.1%) |
| $150,000 or more | 3 (7.7%) | 0 (0.0%) |
| Total | 39 (100.0%) | 18 (100.0%) |
Monthly Housing Cost Tiers in Koliganek
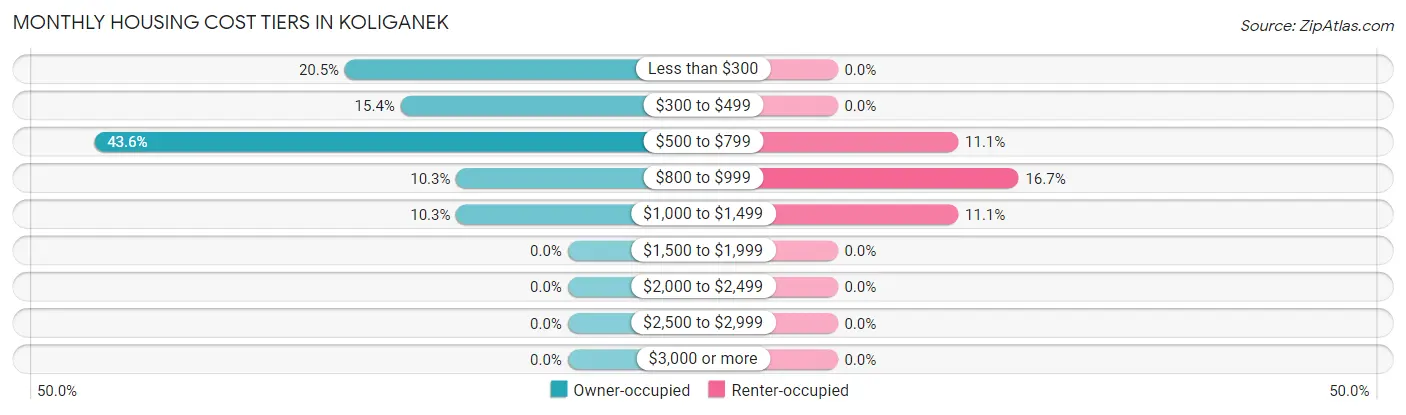
| Monthly Cost | Owner-occupied | Renter-occupied |
| Less than $300 | 8 (20.5%) | 0 (0.0%) |
| $300 to $499 | 6 (15.4%) | 0 (0.0%) |
| $500 to $799 | 17 (43.6%) | 2 (11.1%) |
| $800 to $999 | 4 (10.3%) | 3 (16.7%) |
| $1,000 to $1,499 | 4 (10.3%) | 2 (11.1%) |
| $1,500 to $1,999 | 0 (0.0%) | 0 (0.0%) |
| $2,000 to $2,499 | 0 (0.0%) | 0 (0.0%) |
| $2,500 to $2,999 | 0 (0.0%) | 0 (0.0%) |
| $3,000 or more | 0 (0.0%) | 0 (0.0%) |
| Total | 39 (100.0%) | 18 (100.0%) |
Physical Housing Characteristics in Koliganek
Housing Structures in Koliganek
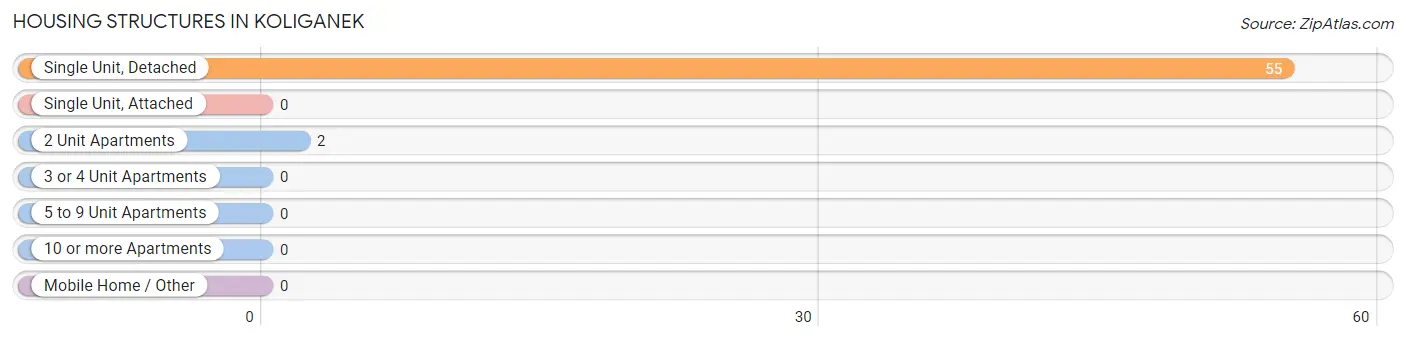
| Structure Type | # Housing Units | % Housing Units |
| Single Unit, Detached | 55 | 96.5% |
| Single Unit, Attached | 0 | 0.0% |
| 2 Unit Apartments | 2 | 3.5% |
| 3 or 4 Unit Apartments | 0 | 0.0% |
| 5 to 9 Unit Apartments | 0 | 0.0% |
| 10 or more Apartments | 0 | 0.0% |
| Mobile Home / Other | 0 | 0.0% |
| Total | 57 | 100.0% |
Housing Structures by Occupancy in Koliganek
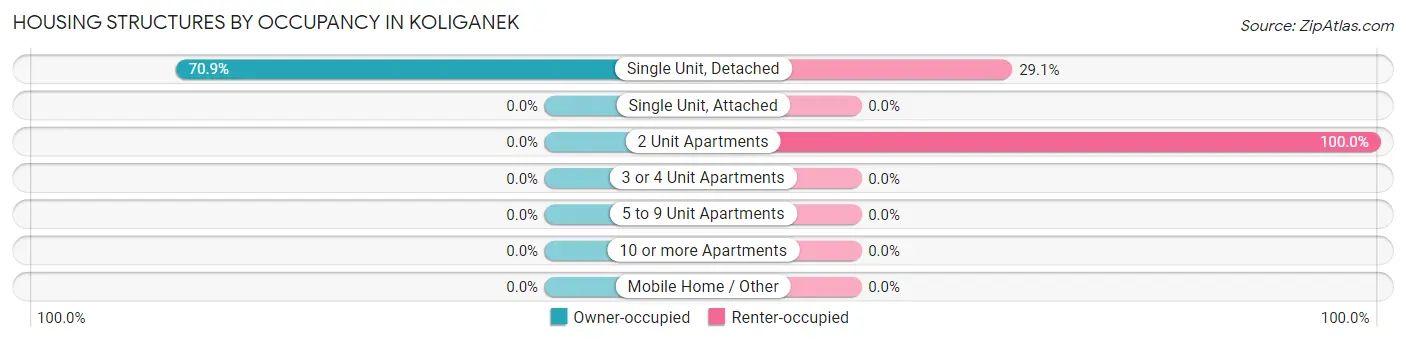
| Structure Type | Owner-occupied | Renter-occupied |
| Single Unit, Detached | 39 (70.9%) | 16 (29.1%) |
| Single Unit, Attached | 0 (0.0%) | 0 (0.0%) |
| 2 Unit Apartments | 0 (0.0%) | 2 (100.0%) |
| 3 or 4 Unit Apartments | 0 (0.0%) | 0 (0.0%) |
| 5 to 9 Unit Apartments | 0 (0.0%) | 0 (0.0%) |
| 10 or more Apartments | 0 (0.0%) | 0 (0.0%) |
| Mobile Home / Other | 0 (0.0%) | 0 (0.0%) |
| Total | 39 (68.4%) | 18 (31.6%) |
Housing Structures by Number of Rooms in Koliganek
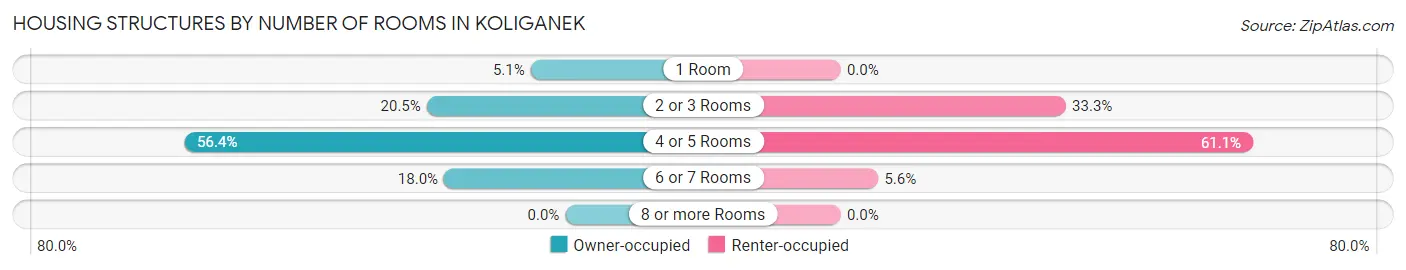
| Number of Rooms | Owner-occupied | Renter-occupied |
| 1 Room | 2 (5.1%) | 0 (0.0%) |
| 2 or 3 Rooms | 8 (20.5%) | 6 (33.3%) |
| 4 or 5 Rooms | 22 (56.4%) | 11 (61.1%) |
| 6 or 7 Rooms | 7 (17.9%) | 1 (5.6%) |
| 8 or more Rooms | 0 (0.0%) | 0 (0.0%) |
| Total | 39 (100.0%) | 18 (100.0%) |
Housing Structure by Heating Type in Koliganek
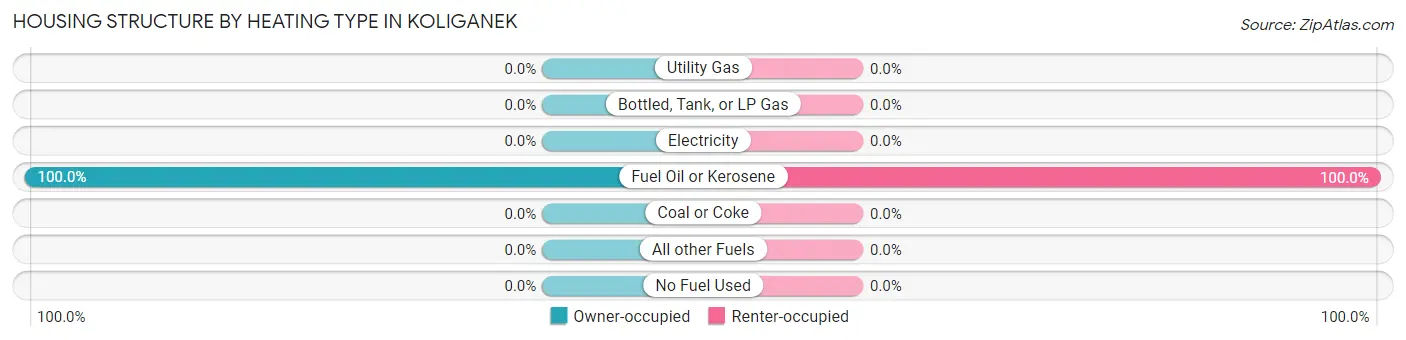
| Heating Type | Owner-occupied | Renter-occupied |
| Utility Gas | 0 (0.0%) | 0 (0.0%) |
| Bottled, Tank, or LP Gas | 0 (0.0%) | 0 (0.0%) |
| Electricity | 0 (0.0%) | 0 (0.0%) |
| Fuel Oil or Kerosene | 39 (100.0%) | 18 (100.0%) |
| Coal or Coke | 0 (0.0%) | 0 (0.0%) |
| All other Fuels | 0 (0.0%) | 0 (0.0%) |
| No Fuel Used | 0 (0.0%) | 0 (0.0%) |
| Total | 39 (100.0%) | 18 (100.0%) |
Household Vehicle Usage in Koliganek
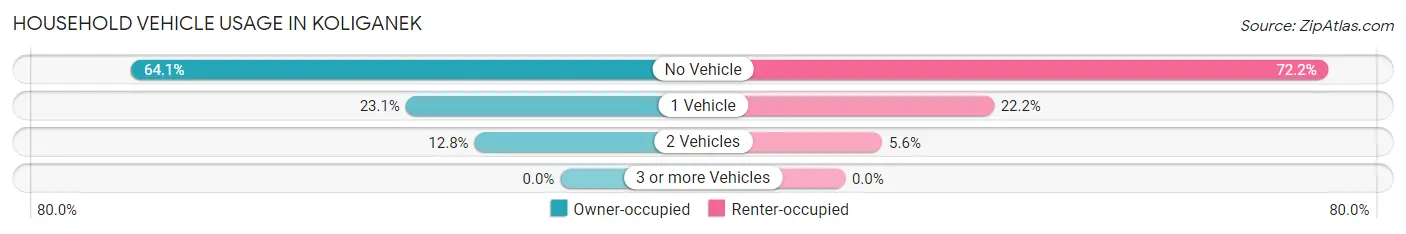
| Vehicles per Household | Owner-occupied | Renter-occupied |
| No Vehicle | 25 (64.1%) | 13 (72.2%) |
| 1 Vehicle | 9 (23.1%) | 4 (22.2%) |
| 2 Vehicles | 5 (12.8%) | 1 (5.6%) |
| 3 or more Vehicles | 0 (0.0%) | 0 (0.0%) |
| Total | 39 (100.0%) | 18 (100.0%) |
Real Estate & Mortgages in Koliganek
Real Estate and Mortgage Overview in Koliganek
| Characteristic | Without Mortgage | With Mortgage |
| Housing Units | 37 | 2 |
| Median Property Value | $119,300 | $0 |
| Median Household Income | $54,375 | $0 |
| Monthly Housing Costs | $590 | $0 |
| Real Estate Taxes | $199 | $2 |
Property Value by Mortgage Status in Koliganek
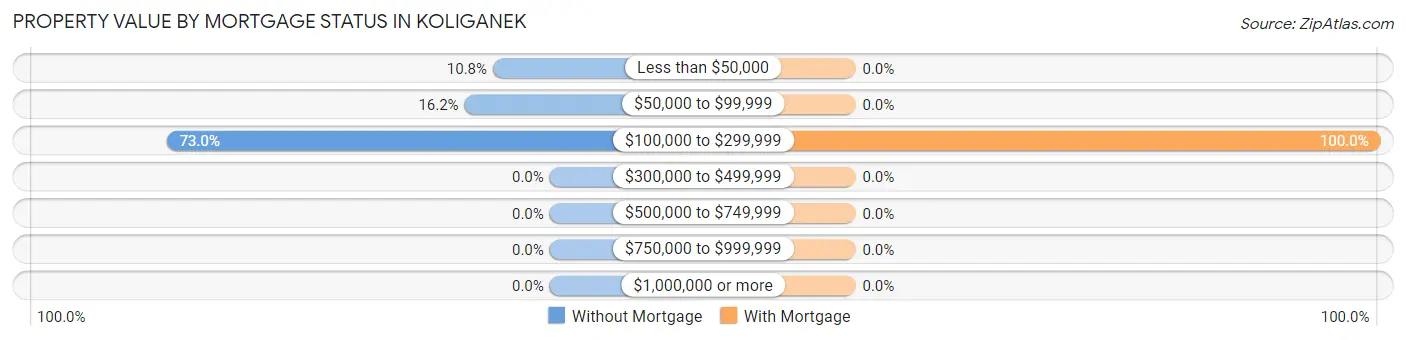
| Property Value | Without Mortgage | With Mortgage |
| Less than $50,000 | 4 (10.8%) | 0 (0.0%) |
| $50,000 to $99,999 | 6 (16.2%) | 0 (0.0%) |
| $100,000 to $299,999 | 27 (73.0%) | 2 (100.0%) |
| $300,000 to $499,999 | 0 (0.0%) | 0 (0.0%) |
| $500,000 to $749,999 | 0 (0.0%) | 0 (0.0%) |
| $750,000 to $999,999 | 0 (0.0%) | 0 (0.0%) |
| $1,000,000 or more | 0 (0.0%) | 0 (0.0%) |
| Total | 37 (100.0%) | 2 (100.0%) |
Household Income by Mortgage Status in Koliganek
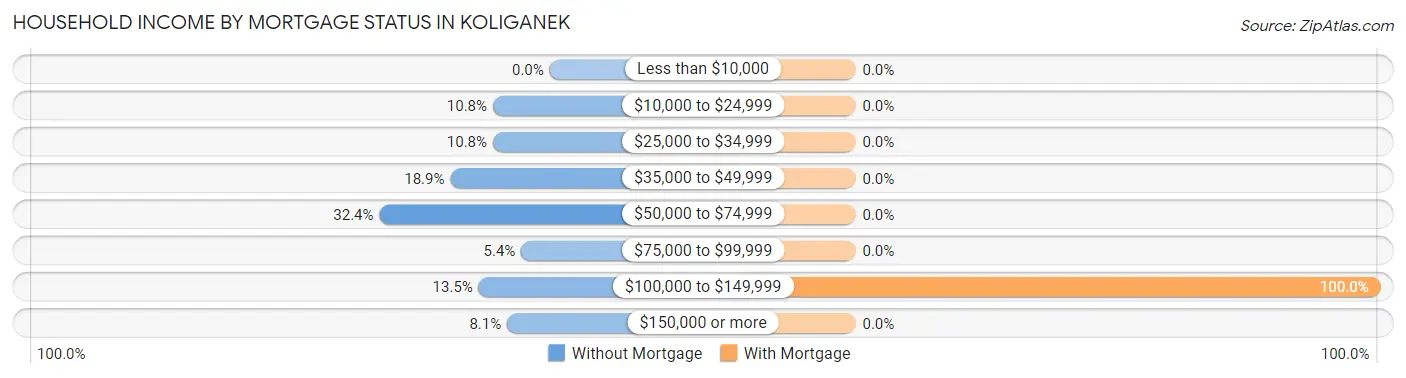
| Household Income | Without Mortgage | With Mortgage |
| Less than $10,000 | 0 (0.0%) | 0 (0.0%) |
| $10,000 to $24,999 | 4 (10.8%) | 0 (0.0%) |
| $25,000 to $34,999 | 4 (10.8%) | 0 (0.0%) |
| $35,000 to $49,999 | 7 (18.9%) | 0 (0.0%) |
| $50,000 to $74,999 | 12 (32.4%) | 0 (0.0%) |
| $75,000 to $99,999 | 2 (5.4%) | 0 (0.0%) |
| $100,000 to $149,999 | 5 (13.5%) | 2 (100.0%) |
| $150,000 or more | 3 (8.1%) | 0 (0.0%) |
| Total | 37 (100.0%) | 2 (100.0%) |
Property Value to Household Income Ratio in Koliganek
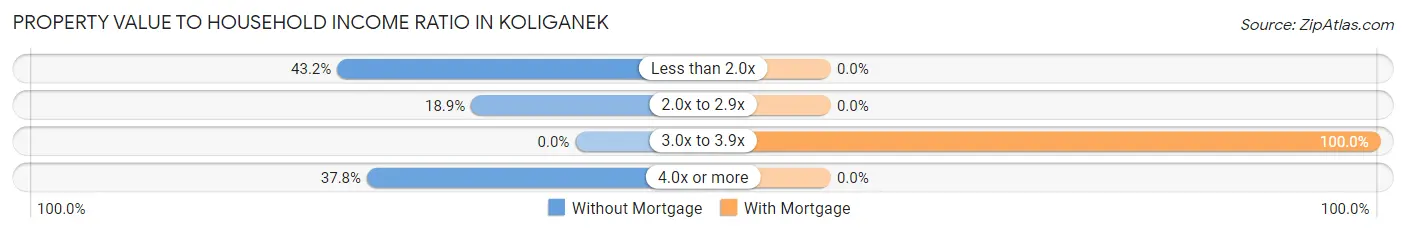
| Value-to-Income Ratio | Without Mortgage | With Mortgage |
| Less than 2.0x | 16 (43.2%) | 0 (0.0%) |
| 2.0x to 2.9x | 7 (18.9%) | 0 (0.0%) |
| 3.0x to 3.9x | 0 (0.0%) | 2 (100.0%) |
| 4.0x or more | 14 (37.8%) | 0 (0.0%) |
| Total | 37 (100.0%) | 2 (100.0%) |
Real Estate Taxes by Mortgage Status in Koliganek
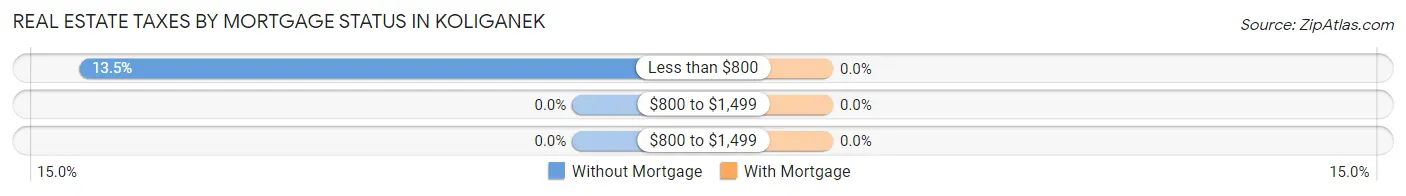
| Property Taxes | Without Mortgage | With Mortgage |
| Less than $800 | 5 (13.5%) | 0 (0.0%) |
| $800 to $1,499 | 0 (0.0%) | 0 (0.0%) |
| $800 to $1,499 | 0 (0.0%) | 0 (0.0%) |
| Total | 37 (100.0%) | 2 (100.0%) |
Health & Disability in Koliganek
Health Insurance Coverage by Age in Koliganek
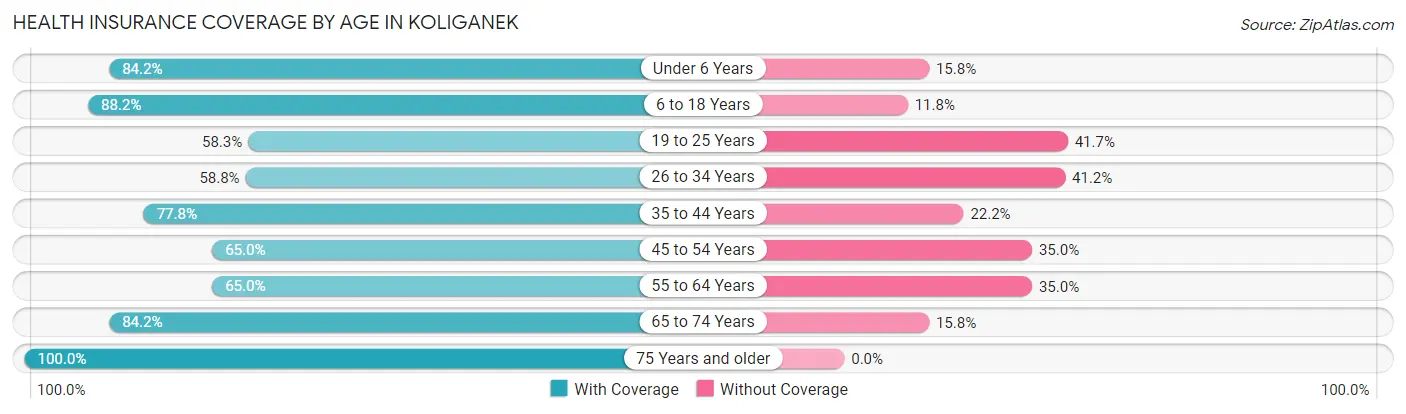
| Age Bracket | With Coverage | Without Coverage |
| Under 6 Years | 16 (84.2%) | 3 (15.8%) |
| 6 to 18 Years | 82 (88.2%) | 11 (11.8%) |
| 19 to 25 Years | 14 (58.3%) | 10 (41.7%) |
| 26 to 34 Years | 10 (58.8%) | 7 (41.2%) |
| 35 to 44 Years | 14 (77.8%) | 4 (22.2%) |
| 45 to 54 Years | 13 (65.0%) | 7 (35.0%) |
| 55 to 64 Years | 13 (65.0%) | 7 (35.0%) |
| 65 to 74 Years | 16 (84.2%) | 3 (15.8%) |
| 75 Years and older | 4 (100.0%) | 0 (0.0%) |
| Total | 182 (77.8%) | 52 (22.2%) |
Health Insurance Coverage by Citizenship Status in Koliganek
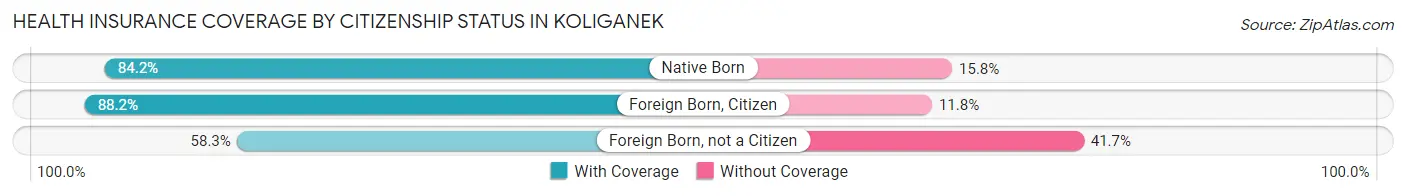
| Citizenship Status | With Coverage | Without Coverage |
| Native Born | 16 (84.2%) | 3 (15.8%) |
| Foreign Born, Citizen | 82 (88.2%) | 11 (11.8%) |
| Foreign Born, not a Citizen | 14 (58.3%) | 10 (41.7%) |
Health Insurance Coverage by Household Income in Koliganek
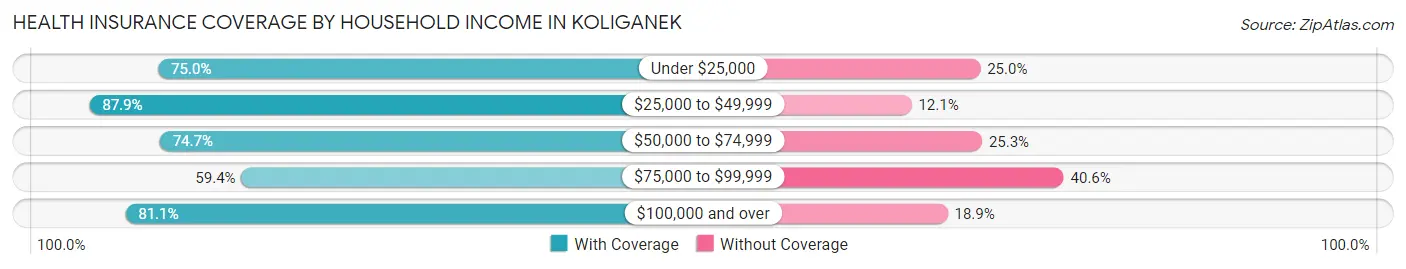
| Household Income | With Coverage | Without Coverage |
| Under $25,000 | 3 (75.0%) | 1 (25.0%) |
| $25,000 to $49,999 | 58 (87.9%) | 8 (12.1%) |
| $50,000 to $74,999 | 59 (74.7%) | 20 (25.3%) |
| $75,000 to $99,999 | 19 (59.4%) | 13 (40.6%) |
| $100,000 and over | 43 (81.1%) | 10 (18.9%) |
Public vs Private Health Insurance Coverage by Age in Koliganek
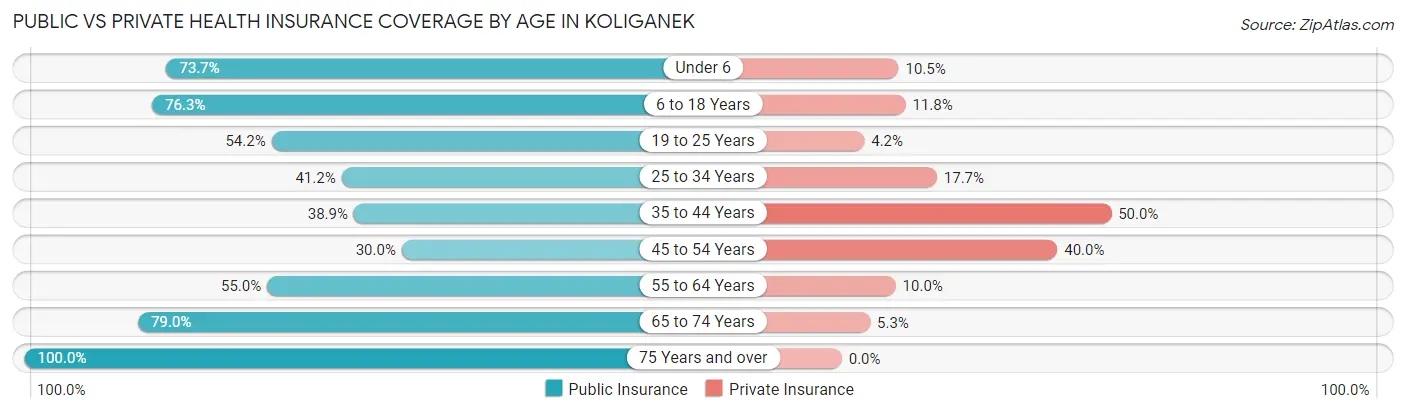
| Age Bracket | Public Insurance | Private Insurance |
| Under 6 | 14 (73.7%) | 2 (10.5%) |
| 6 to 18 Years | 71 (76.3%) | 11 (11.8%) |
| 19 to 25 Years | 13 (54.2%) | 1 (4.2%) |
| 25 to 34 Years | 7 (41.2%) | 3 (17.6%) |
| 35 to 44 Years | 7 (38.9%) | 9 (50.0%) |
| 45 to 54 Years | 6 (30.0%) | 8 (40.0%) |
| 55 to 64 Years | 11 (55.0%) | 2 (10.0%) |
| 65 to 74 Years | 15 (78.9%) | 1 (5.3%) |
| 75 Years and over | 4 (100.0%) | 0 (0.0%) |
| Total | 148 (63.2%) | 37 (15.8%) |
Disability Status by Sex by Age in Koliganek
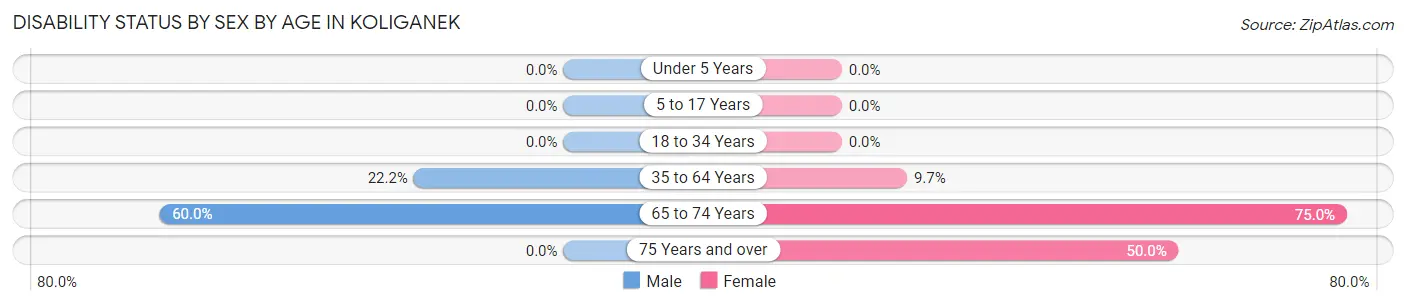
| Age Bracket | Male | Female |
| Under 5 Years | 0 (0.0%) | 0 (0.0%) |
| 5 to 17 Years | 0 (0.0%) | 0 (0.0%) |
| 18 to 34 Years | 0 (0.0%) | 0 (0.0%) |
| 35 to 64 Years | 6 (22.2%) | 3 (9.7%) |
| 65 to 74 Years | 9 (60.0%) | 3 (75.0%) |
| 75 Years and over | 0 (0.0%) | 2 (50.0%) |
Disability Class by Sex by Age in Koliganek
Disability Class: Hearing Difficulty
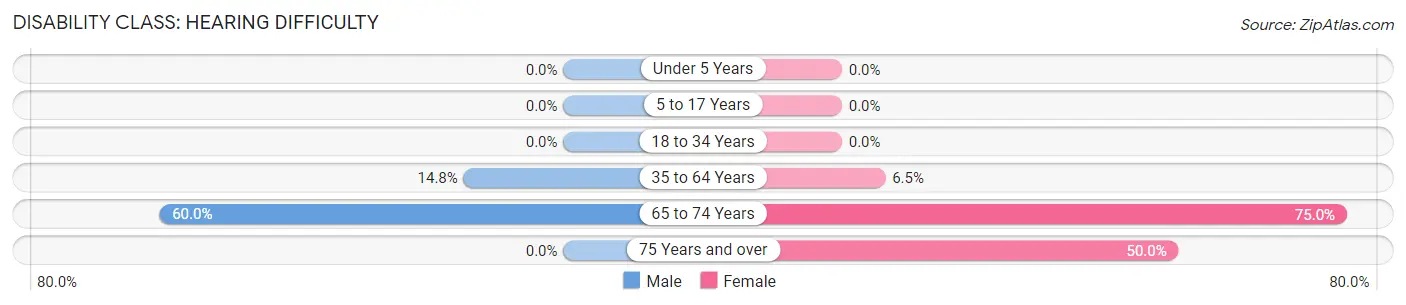
| Age Bracket | Male | Female |
| Under 5 Years | 0 (0.0%) | 0 (0.0%) |
| 5 to 17 Years | 0 (0.0%) | 0 (0.0%) |
| 18 to 34 Years | 0 (0.0%) | 0 (0.0%) |
| 35 to 64 Years | 4 (14.8%) | 2 (6.5%) |
| 65 to 74 Years | 9 (60.0%) | 3 (75.0%) |
| 75 Years and over | 0 (0.0%) | 2 (50.0%) |
Disability Class: Vision Difficulty
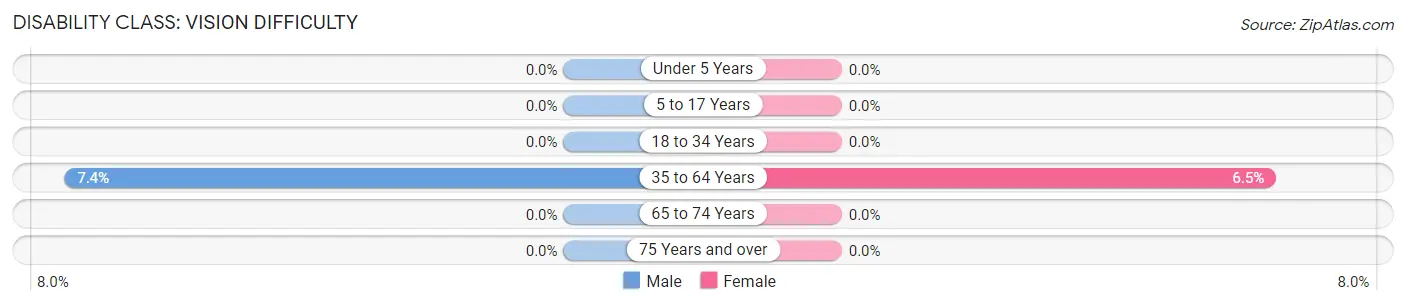
| Age Bracket | Male | Female |
| Under 5 Years | 0 (0.0%) | 0 (0.0%) |
| 5 to 17 Years | 0 (0.0%) | 0 (0.0%) |
| 18 to 34 Years | 0 (0.0%) | 0 (0.0%) |
| 35 to 64 Years | 2 (7.4%) | 2 (6.5%) |
| 65 to 74 Years | 0 (0.0%) | 0 (0.0%) |
| 75 Years and over | 0 (0.0%) | 0 (0.0%) |
Disability Class: Cognitive Difficulty
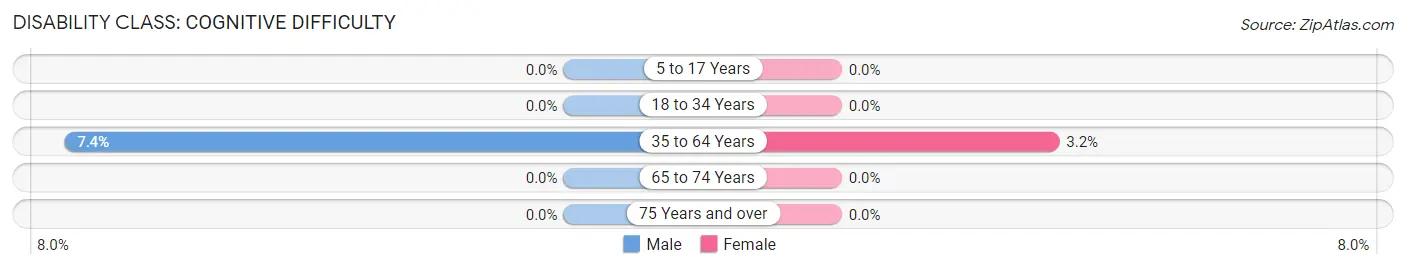
| Age Bracket | Male | Female |
| 5 to 17 Years | 0 (0.0%) | 0 (0.0%) |
| 18 to 34 Years | 0 (0.0%) | 0 (0.0%) |
| 35 to 64 Years | 2 (7.4%) | 1 (3.2%) |
| 65 to 74 Years | 0 (0.0%) | 0 (0.0%) |
| 75 Years and over | 0 (0.0%) | 0 (0.0%) |
Disability Class: Ambulatory Difficulty
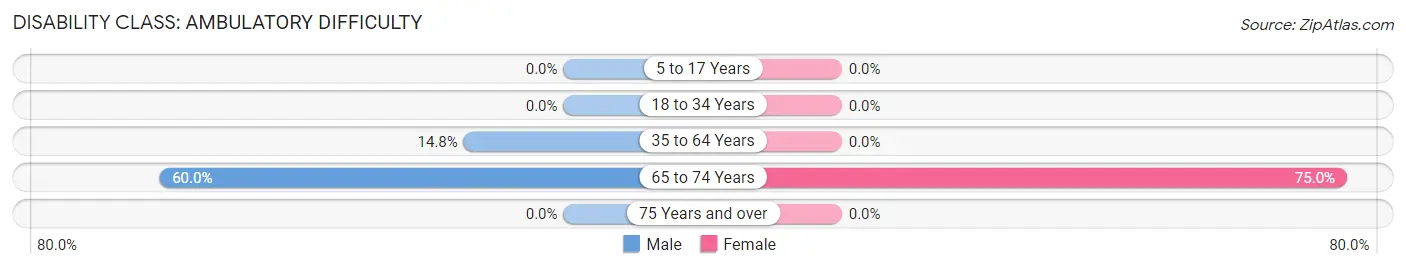
| Age Bracket | Male | Female |
| 5 to 17 Years | 0 (0.0%) | 0 (0.0%) |
| 18 to 34 Years | 0 (0.0%) | 0 (0.0%) |
| 35 to 64 Years | 4 (14.8%) | 0 (0.0%) |
| 65 to 74 Years | 9 (60.0%) | 3 (75.0%) |
| 75 Years and over | 0 (0.0%) | 0 (0.0%) |
Disability Class: Self-Care Difficulty
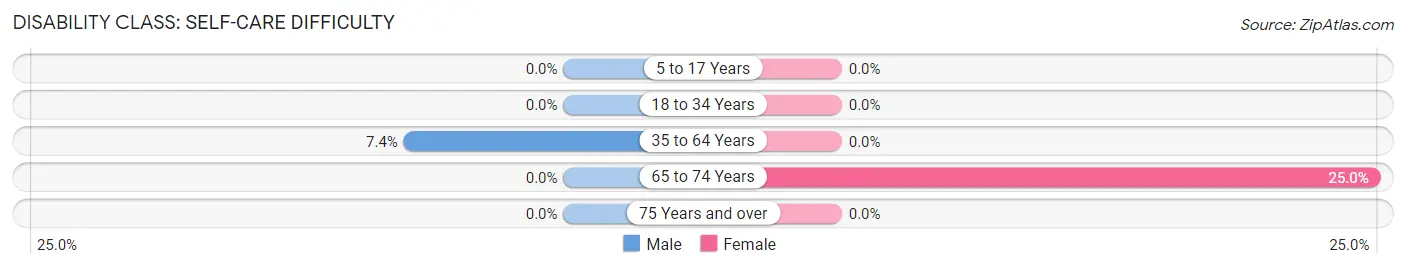
| Age Bracket | Male | Female |
| 5 to 17 Years | 0 (0.0%) | 0 (0.0%) |
| 18 to 34 Years | 0 (0.0%) | 0 (0.0%) |
| 35 to 64 Years | 2 (7.4%) | 0 (0.0%) |
| 65 to 74 Years | 0 (0.0%) | 1 (25.0%) |
| 75 Years and over | 0 (0.0%) | 0 (0.0%) |
Technology Access in Koliganek
Computing Device Access in Koliganek
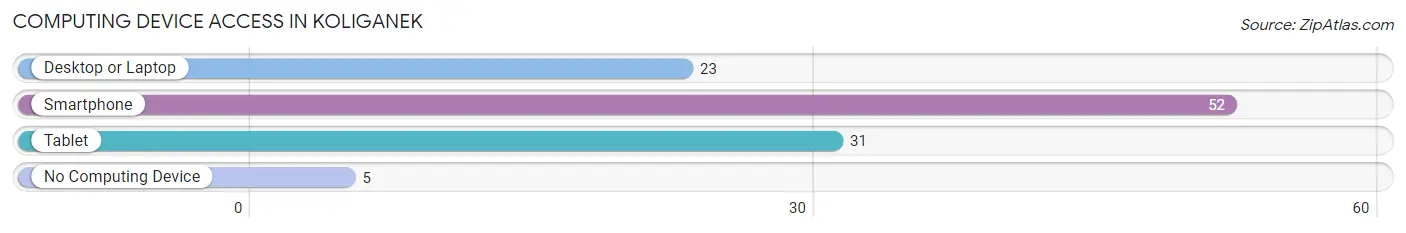
| Device Type | # Households | % Households |
| Desktop or Laptop | 23 | 40.4% |
| Smartphone | 52 | 91.2% |
| Tablet | 31 | 54.4% |
| No Computing Device | 5 | 8.8% |
| Total | 57 | 100.0% |
Internet Access in Koliganek
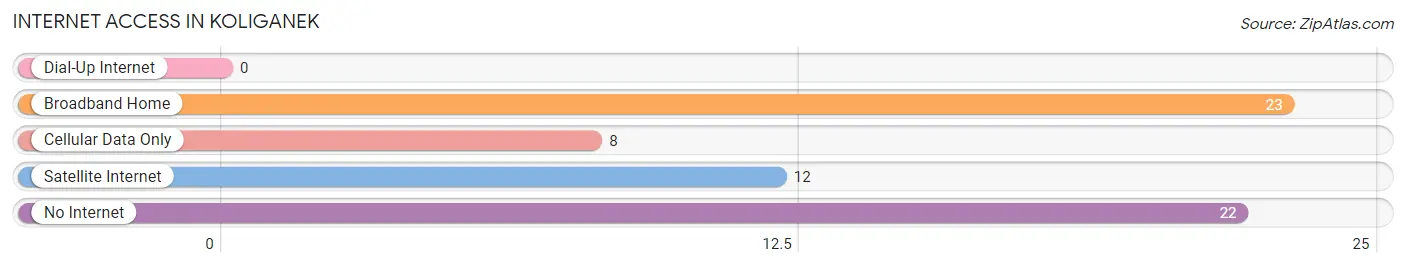
| Internet Type | # Households | % Households |
| Dial-Up Internet | 0 | 0.0% |
| Broadband Home | 23 | 40.4% |
| Cellular Data Only | 8 | 14.0% |
| Satellite Internet | 12 | 21.0% |
| No Internet | 22 | 38.6% |
| Total | 57 | 100.0% |
Koliganek Summary
Koliganek is a small village located in the Bristol Bay Borough of Alaska. It is situated on the west bank of the Nushagak River, approximately 40 miles upstream from the Bering Sea. The village is home to the Dena'ina Athabascan people, who have lived in the area for centuries. The population of Koliganek was estimated to be around 200 people in 2020.
Koliganek has a rich history that dates back to the early 1800s. The Dena'ina Athabascan people have lived in the area for centuries, and the village was first established in the late 1800s. The village was originally called "Koliganek," which means "place of the river." The village was a trading post for the Dena'ina Athabascan people, and it was also a popular fishing spot for the local population.
Koliganek is located in a remote area of Alaska, and it is surrounded by mountains and forests. The climate in the area is cold and wet, with temperatures ranging from -20°F in the winter to 70°F in the summer. The area receives an average of 40 inches of precipitation each year.
The economy of Koliganek is largely based on subsistence activities, such as fishing, hunting, and gathering. The village also has a small commercial fishing industry, and some of the residents are employed in the tourism industry. The village is home to a small school, a post office, and a health clinic.
Koliganek is served by the Alaska Marine Highway System, which provides ferry service to the village. The village is also served by a small airport, which provides air service to Anchorage and other nearby communities.
Koliganek is a culturally rich village, and the Dena'ina Athabascan people are very proud of their heritage. The village is home to a number of traditional festivals and celebrations, including the Nushagak River Festival, which is held every summer. The village also hosts a number of cultural events, such as the Dena'ina Cultural Festival, which is held every fall.
Koliganek is a small, remote village in Alaska, but it is a vibrant and culturally rich community. The village is home to a proud and resilient population, and it is a great place to visit and experience the unique culture of the Dena'ina Athabascan people.
Common Questions
What is Per Capita Income in Koliganek?
Per Capita income in Koliganek is $16,508.
What is the Median Family Income in Koliganek?
Median Family Income in Koliganek is $57,500.
What is the Median Household income in Koliganek?
Median Household Income in Koliganek is $56,250.
What is Inequality or Gini Index in Koliganek?
Inequality or Gini Index in Koliganek is 0.34.
What is the Total Population of Koliganek?
Total Population of Koliganek is 234.
What is the Total Male Population of Koliganek?
Total Male Population of Koliganek is 123.
What is the Total Female Population of Koliganek?
Total Female Population of Koliganek is 111.
What is the Ratio of Males per 100 Females in Koliganek?
There are 110.81 Males per 100 Females in Koliganek.
What is the Ratio of Females per 100 Males in Koliganek?
There are 90.24 Females per 100 Males in Koliganek.
What is the Median Population Age in Koliganek?
Median Population Age in Koliganek is 21.0 Years.
What is the Average Family Size in Koliganek
Average Family Size in Koliganek is 4.5 People.
What is the Average Household Size in Koliganek
Average Household Size in Koliganek is 4.1 People.
How Large is the Labor Force in Koliganek?
There are 73 People in the Labor Forcein in Koliganek.
What is the Percentage of People in the Labor Force in Koliganek?
50.7% of People are in the Labor Force in Koliganek.
What is the Unemployment Rate in Koliganek?
Unemployment Rate in Koliganek is 27.4%.