Wainwright, AK Map & Demographics
Wainwright Map
Wainwright Overview
$68,028
PER CAPITA INCOME
$90,833
AVG FAMILY INCOME
$79,500
AVG HOUSEHOLD INCOME
0.42
INEQUALITY / GINI INDEX
621
TOTAL POPULATION
373
MALE POPULATION
248
FEMALE POPULATION
150.40
MALES / 100 FEMALES
66.49
FEMALES / 100 MALES
40.8
MEDIAN AGE
3.9
AVG FAMILY SIZE
3.5
AVG HOUSEHOLD SIZE
323
LABOR FORCE [ PEOPLE ]
69.0%
PERCENT IN LABOR FORCE
8.0%
UNEMPLOYMENT RATE
Wainwright Zip Codes
Wainwright Area Codes
Income in Wainwright
Income Overview in Wainwright
Per Capita Income in Wainwright is $68,028, while median incomes of families and households are $90,833 and $79,500 respectively.
| Characteristic | Number | Measure |
| Per Capita Income | 621 | $68,028 |
| Median Family Income | 98 | $90,833 |
| Mean Family Income | 98 | $102,786 |
| Median Household Income | 140 | $79,500 |
| Mean Household Income | 140 | $90,664 |
| Income Deficit | 98 | $0 |
| Wage / Income Gap (%) | 621 | 0.00% |
| Wage / Income Gap ($) | 621 | 100.00¢ per $1 |
| Gini / Inequality Index | 621 | 0.42 |
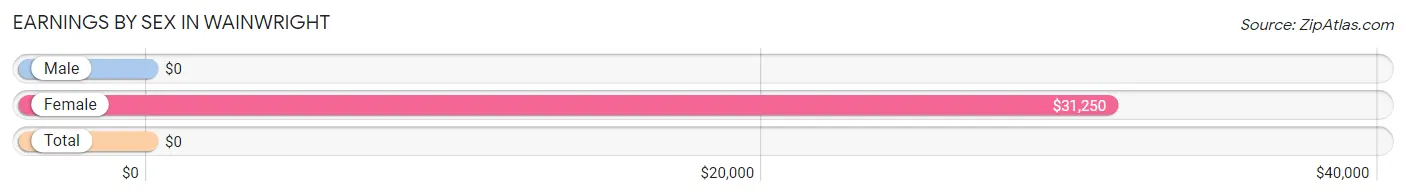
Earnings by Sex in Wainwright
| Sex | Number | Average Earnings |
| Male | 218 (68.5%) | $0 |
| Female | 100 (31.5%) | $31,250 |
| Total | 318 (100.0%) | $0 |
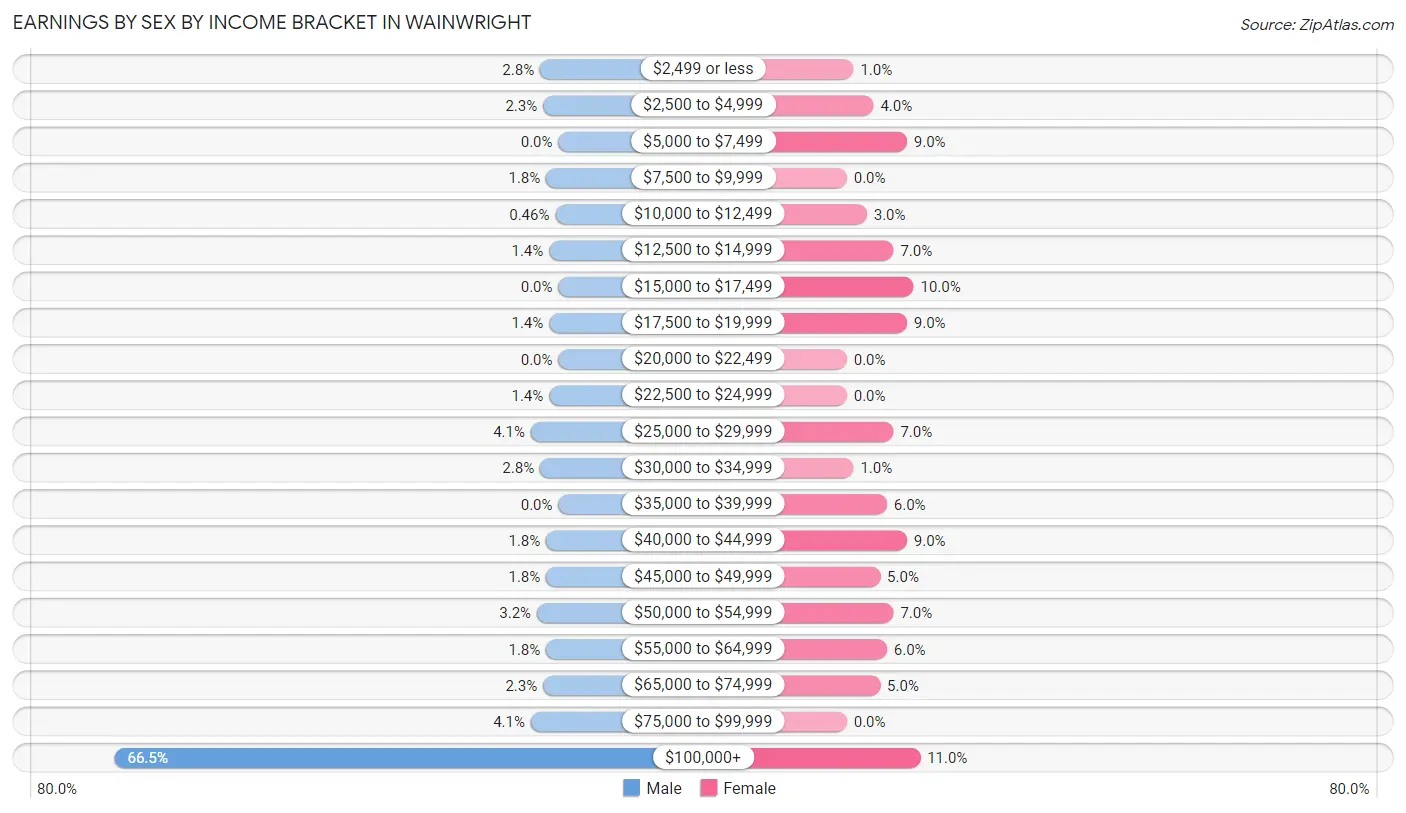
Earnings by Sex by Income Bracket in Wainwright
The most common earnings brackets in Wainwright are $100,000+ for men (145 | 66.5%) and $100,000+ for women (11 | 11.0%).
| Income | Male | Female |
| $2,499 or less | 6 (2.8%) | 1 (1.0%) |
| $2,500 to $4,999 | 5 (2.3%) | 4 (4.0%) |
| $5,000 to $7,499 | 0 (0.0%) | 9 (9.0%) |
| $7,500 to $9,999 | 4 (1.8%) | 0 (0.0%) |
| $10,000 to $12,499 | 1 (0.5%) | 3 (3.0%) |
| $12,500 to $14,999 | 3 (1.4%) | 7 (7.0%) |
| $15,000 to $17,499 | 0 (0.0%) | 10 (10.0%) |
| $17,500 to $19,999 | 3 (1.4%) | 9 (9.0%) |
| $20,000 to $22,499 | 0 (0.0%) | 0 (0.0%) |
| $22,500 to $24,999 | 3 (1.4%) | 0 (0.0%) |
| $25,000 to $29,999 | 9 (4.1%) | 7 (7.0%) |
| $30,000 to $34,999 | 6 (2.8%) | 1 (1.0%) |
| $35,000 to $39,999 | 0 (0.0%) | 6 (6.0%) |
| $40,000 to $44,999 | 4 (1.8%) | 9 (9.0%) |
| $45,000 to $49,999 | 4 (1.8%) | 5 (5.0%) |
| $50,000 to $54,999 | 7 (3.2%) | 7 (7.0%) |
| $55,000 to $64,999 | 4 (1.8%) | 6 (6.0%) |
| $65,000 to $74,999 | 5 (2.3%) | 5 (5.0%) |
| $75,000 to $99,999 | 9 (4.1%) | 0 (0.0%) |
| $100,000+ | 145 (66.5%) | 11 (11.0%) |
| Total | 218 (100.0%) | 100 (100.0%) |
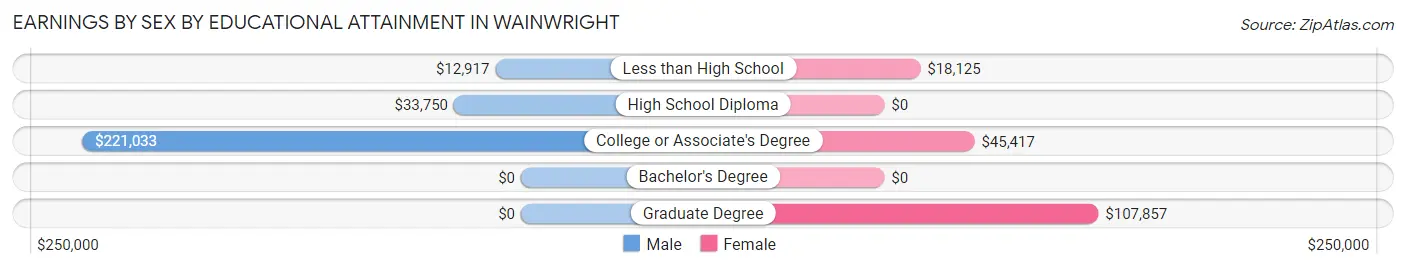
Earnings by Sex by Educational Attainment in Wainwright
| Educational Attainment | Male Income | Female Income |
| Less than High School | $12,917 | $18,125 |
| High School Diploma | $33,750 | $0 |
| College or Associate's Degree | $221,033 | $45,417 |
| Bachelor's Degree | - | - |
| Graduate Degree | - | - |
| Total | - | - |
Family Income in Wainwright
Family Income Brackets in Wainwright
According to the Wainwright family income data, there are 23 families falling into the $100,000 to $149,999 income range, which is the most common income bracket and makes up 23.5% of all families.
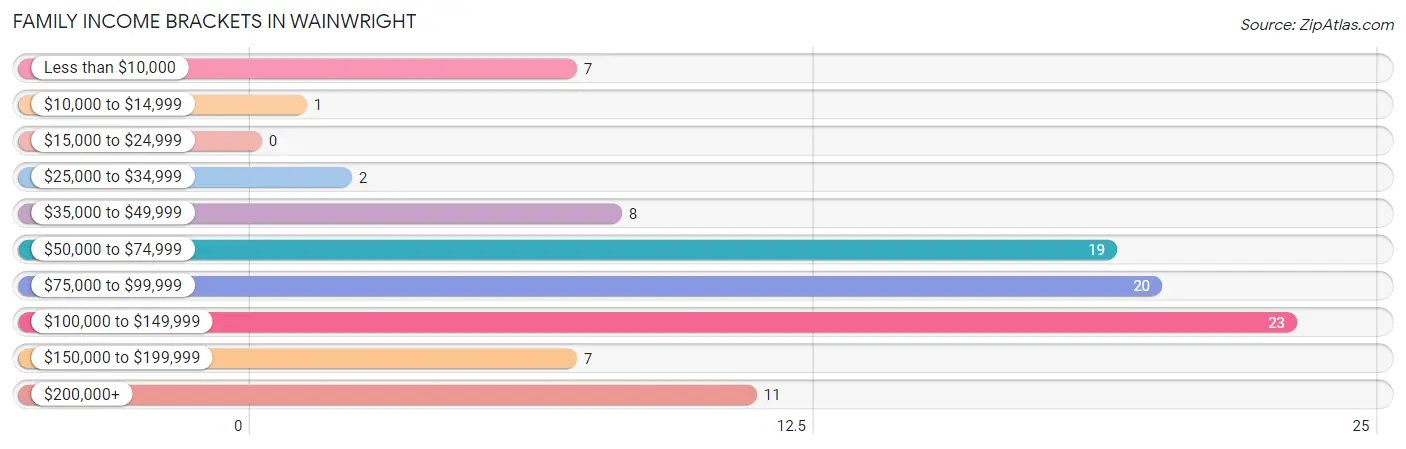
| Income Bracket | # Families | % Families |
| Less than $10,000 | 7 | 7.1% |
| $10,000 to $14,999 | 1 | 1.0% |
| $15,000 to $24,999 | 0 | 0.0% |
| $25,000 to $34,999 | 2 | 2.0% |
| $35,000 to $49,999 | 8 | 8.2% |
| $50,000 to $74,999 | 19 | 19.4% |
| $75,000 to $99,999 | 20 | 20.4% |
| $100,000 to $149,999 | 23 | 23.5% |
| $150,000 to $199,999 | 7 | 7.1% |
| $200,000+ | 11 | 11.2% |
Family Income by Famaliy Size in Wainwright
6-person families (18 | 18.4%) account for the highest median family income in Wainwright with $94,000 per family, while 3-person families (32 | 32.7%) have the highest median income of $21,667 per family member.
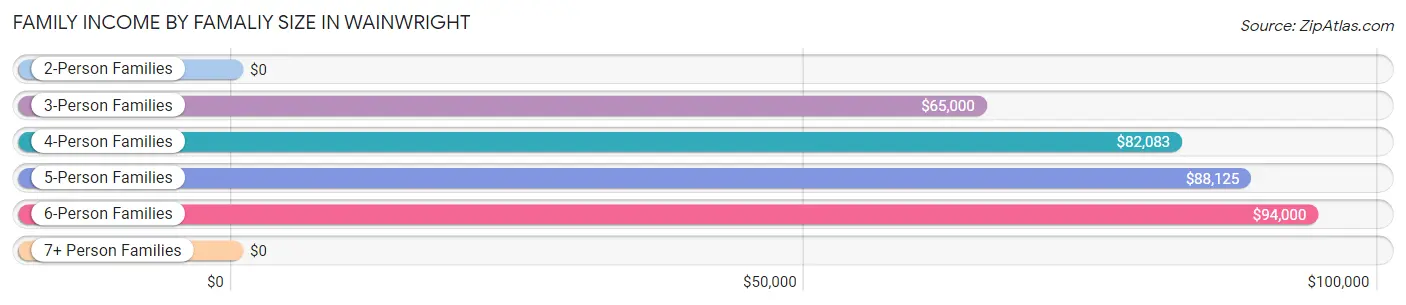
| Income Bracket | # Families | Median Income |
| 2-Person Families | 28 (28.6%) | $0 |
| 3-Person Families | 32 (32.7%) | $65,000 |
| 4-Person Families | 7 (7.1%) | $82,083 |
| 5-Person Families | 7 (7.1%) | $88,125 |
| 6-Person Families | 18 (18.4%) | $94,000 |
| 7+ Person Families | 6 (6.1%) | $0 |
| Total | 98 (100.0%) | $90,833 |
Family Income by Number of Earners in Wainwright
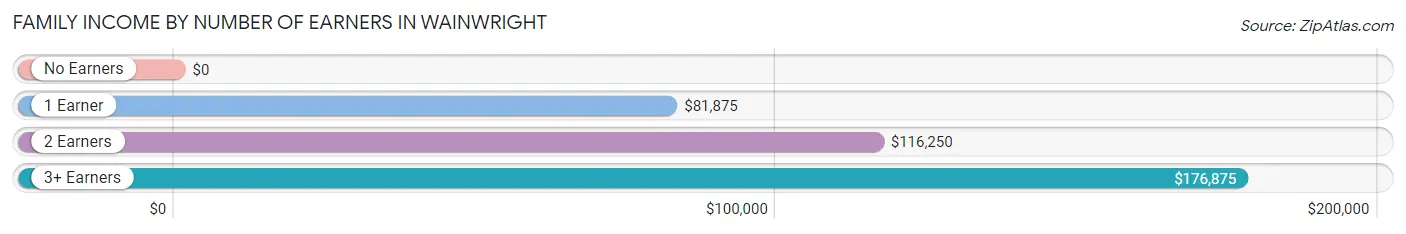
| Number of Earners | # Families | Median Income |
| No Earners | 12 (12.2%) | $0 |
| 1 Earner | 39 (39.8%) | $81,875 |
| 2 Earners | 42 (42.9%) | $116,250 |
| 3+ Earners | 5 (5.1%) | $176,875 |
| Total | 98 (100.0%) | $90,833 |
Household Income in Wainwright
Household Income Brackets in Wainwright
With 36 households falling in the category, the $100,000 to $149,999 income range is the most frequent in Wainwright, accounting for 25.7% of all households.
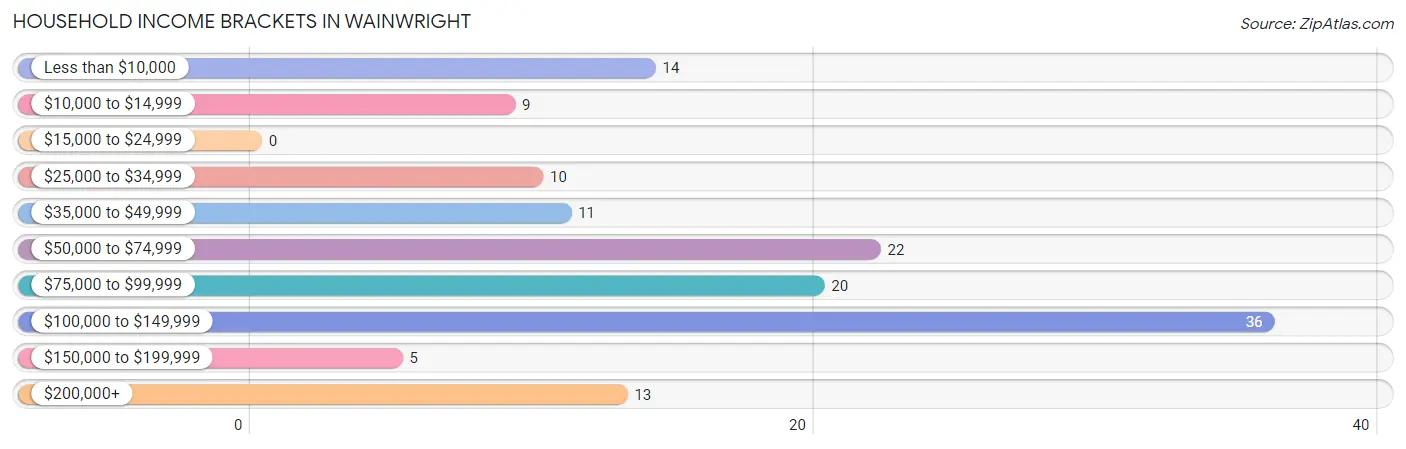
| Income Bracket | # Households | % Households |
| Less than $10,000 | 14 | 10.0% |
| $10,000 to $14,999 | 9 | 6.4% |
| $15,000 to $24,999 | 0 | 0.0% |
| $25,000 to $34,999 | 10 | 7.1% |
| $35,000 to $49,999 | 11 | 7.9% |
| $50,000 to $74,999 | 22 | 15.7% |
| $75,000 to $99,999 | 20 | 14.3% |
| $100,000 to $149,999 | 36 | 25.7% |
| $150,000 to $199,999 | 5 | 3.6% |
| $200,000+ | 13 | 9.3% |
Household Income by Householder Age in Wainwright
The median household income in Wainwright is $79,500, with the highest median household income of $98,750 found in the 45 to 64 years age bracket for the primary householder. A total of 65 households (46.4%) fall into this category. Meanwhile, the 15 to 24 years age bracket for the primary householder has the lowest median household income of $0, with 5 households (3.6%) in this group.

| Income Bracket | # Households | Median Income |
| 15 to 24 Years | 5 (3.6%) | $0 |
| 25 to 44 Years | 38 (27.1%) | $78,125 |
| 45 to 64 Years | 65 (46.4%) | $98,750 |
| 65+ Years | 32 (22.9%) | $0 |
| Total | 140 (100.0%) | $79,500 |
Poverty in Wainwright
Income Below Poverty by Sex and Age in Wainwright
With 10.0% poverty level for males and 8.0% for females among the residents of Wainwright, 18 to 24 year old males and 5 year old females are the most vulnerable to poverty, with 7 males (58.3%) and 4 females (30.8%) in their respective age groups living below the poverty level.
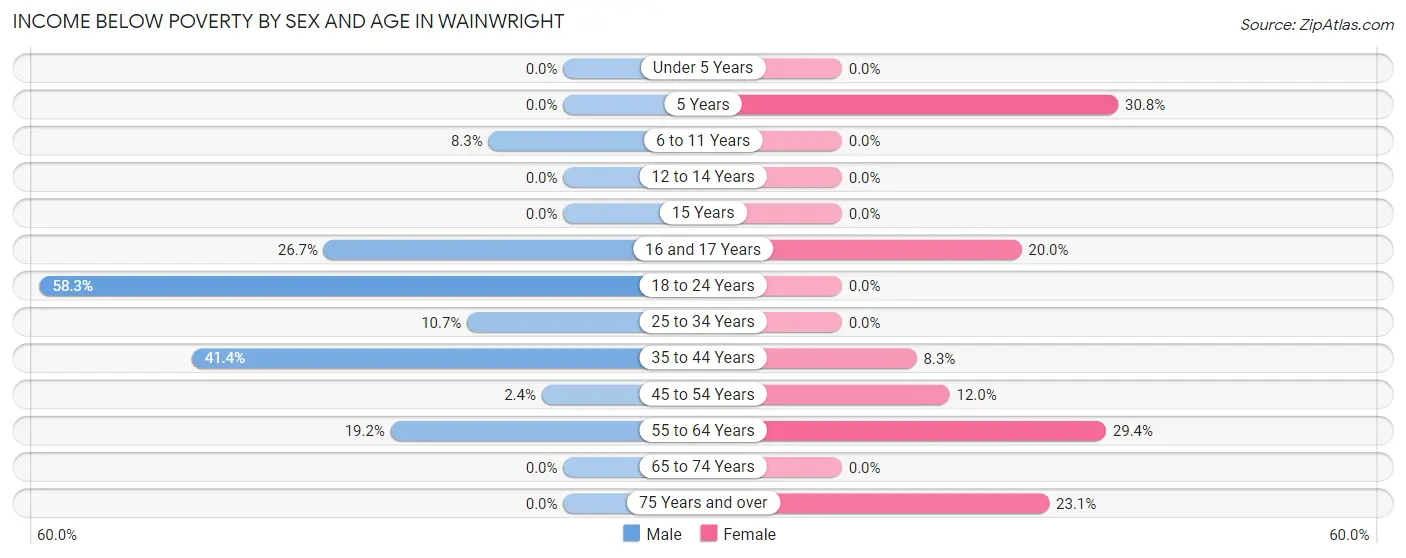
| Age Bracket | Male | Female |
| Under 5 Years | 0 (0.0%) | 0 (0.0%) |
| 5 Years | 0 (0.0%) | 4 (30.8%) |
| 6 to 11 Years | 2 (8.3%) | 0 (0.0%) |
| 12 to 14 Years | 0 (0.0%) | 0 (0.0%) |
| 15 Years | 0 (0.0%) | 0 (0.0%) |
| 16 and 17 Years | 4 (26.7%) | 1 (20.0%) |
| 18 to 24 Years | 7 (58.3%) | 0 (0.0%) |
| 25 to 34 Years | 3 (10.7%) | 0 (0.0%) |
| 35 to 44 Years | 12 (41.4%) | 3 (8.3%) |
| 45 to 54 Years | 4 (2.4%) | 3 (12.0%) |
| 55 to 64 Years | 5 (19.2%) | 5 (29.4%) |
| 65 to 74 Years | 0 (0.0%) | 0 (0.0%) |
| 75 Years and over | 0 (0.0%) | 3 (23.1%) |
| Total | 37 (10.0%) | 19 (8.0%) |
Income Above Poverty by Sex and Age in Wainwright
According to the poverty statistics in Wainwright, males aged under 5 years and females aged under 5 years are the age groups that are most secure financially, with 100.0% of males and 100.0% of females in these age groups living above the poverty line.
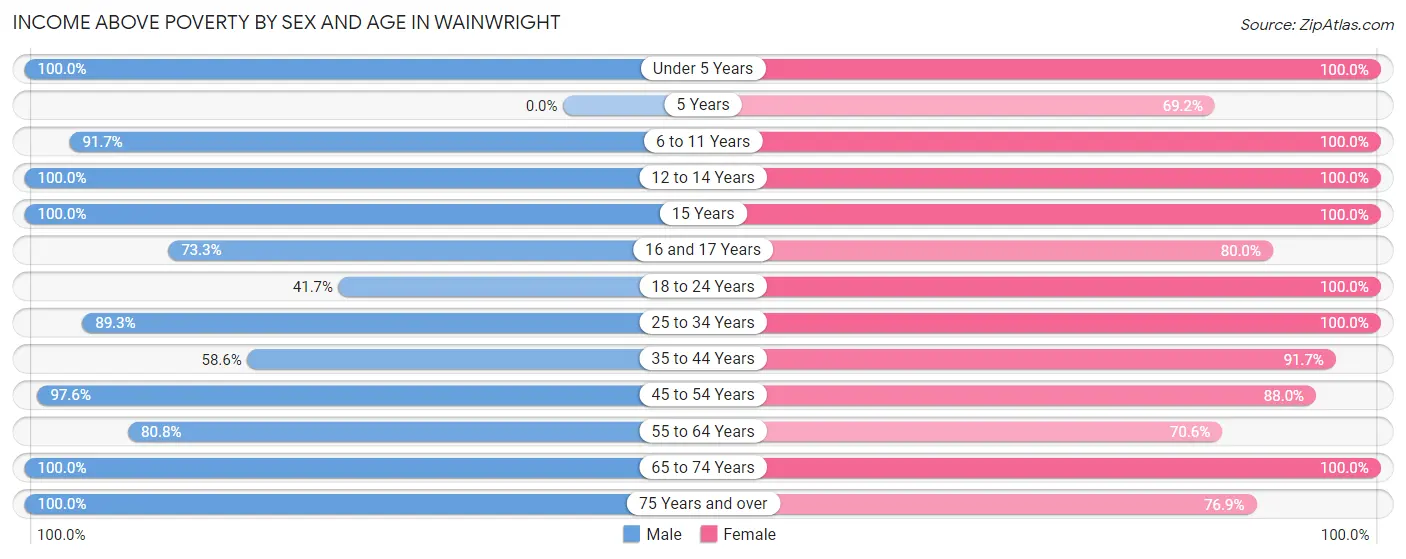
| Age Bracket | Male | Female |
| Under 5 Years | 10 (100.0%) | 13 (100.0%) |
| 5 Years | 0 (0.0%) | 9 (69.2%) |
| 6 to 11 Years | 22 (91.7%) | 28 (100.0%) |
| 12 to 14 Years | 15 (100.0%) | 17 (100.0%) |
| 15 Years | 16 (100.0%) | 4 (100.0%) |
| 16 and 17 Years | 11 (73.3%) | 4 (80.0%) |
| 18 to 24 Years | 5 (41.7%) | 28 (100.0%) |
| 25 to 34 Years | 25 (89.3%) | 31 (100.0%) |
| 35 to 44 Years | 17 (58.6%) | 33 (91.7%) |
| 45 to 54 Years | 163 (97.6%) | 22 (88.0%) |
| 55 to 64 Years | 21 (80.8%) | 12 (70.6%) |
| 65 to 74 Years | 24 (100.0%) | 7 (100.0%) |
| 75 Years and over | 5 (100.0%) | 10 (76.9%) |
| Total | 334 (90.0%) | 218 (92.0%) |
Income Below Poverty Among Married-Couple Families in Wainwright
The poverty statistics for married-couple families in Wainwright show that 2.1% or 1 of the total 48 families live below the poverty line. Families with no children have the highest poverty rate of 5.9%, comprising of 1 families. On the other hand, families with 1 or 2 children have the lowest poverty rate of 0.0%, which includes 0 families.
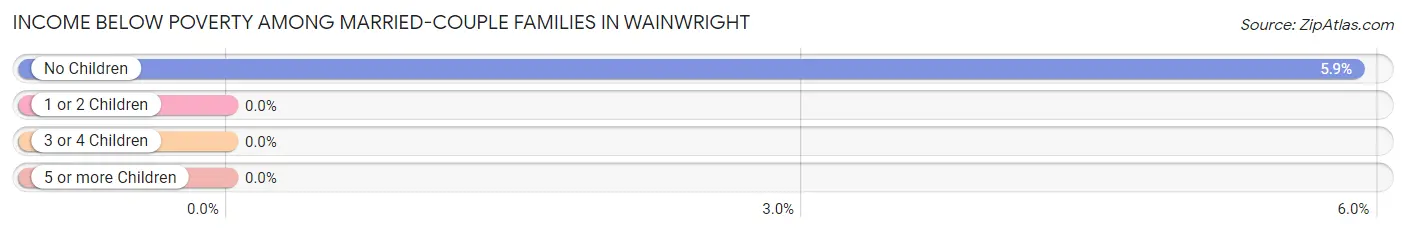
| Children | Above Poverty | Below Poverty |
| No Children | 16 (94.1%) | 1 (5.9%) |
| 1 or 2 Children | 17 (100.0%) | 0 (0.0%) |
| 3 or 4 Children | 8 (100.0%) | 0 (0.0%) |
| 5 or more Children | 6 (100.0%) | 0 (0.0%) |
| Total | 47 (97.9%) | 1 (2.1%) |
Income Below Poverty Among Single-Parent Households in Wainwright
According to the poverty data in Wainwright, 19.1% or 4 single-father households and 10.3% or 3 single-mother households are living below the poverty line. Among single-father households, those with no children have the highest poverty rate, with 4 households (30.8%) experiencing poverty. Likewise, among single-mother households, those with 1 or 2 children have the highest poverty rate, with 3 households (11.5%) falling below the poverty line.
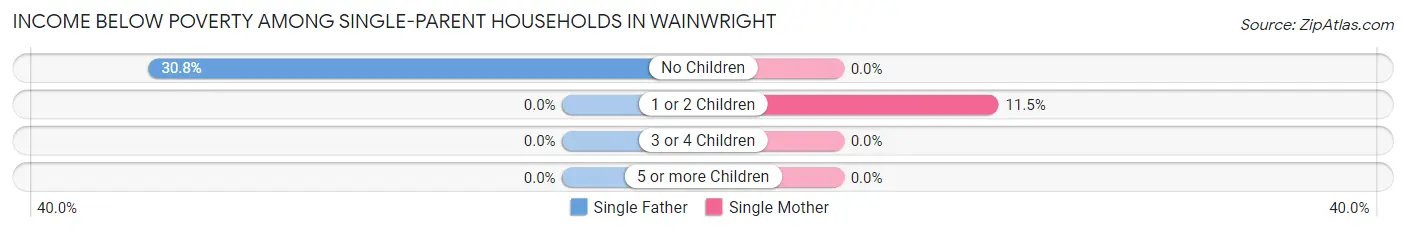
| Children | Single Father | Single Mother |
| No Children | 4 (30.8%) | 0 (0.0%) |
| 1 or 2 Children | 0 (0.0%) | 3 (11.5%) |
| 3 or 4 Children | 0 (0.0%) | 0 (0.0%) |
| 5 or more Children | 0 (0.0%) | 0 (0.0%) |
| Total | 4 (19.1%) | 3 (10.3%) |
Income Below Poverty Among Married-Couple vs Single-Parent Households in Wainwright
The poverty data for Wainwright shows that 1 of the married-couple family households (2.1%) and 7 of the single-parent households (14.0%) are living below the poverty level. Within the married-couple family households, those with no children have the highest poverty rate, with 1 households (5.9%) falling below the poverty line. Among the single-parent households, those with no children have the highest poverty rate, with 4 household (25.0%) living below poverty.
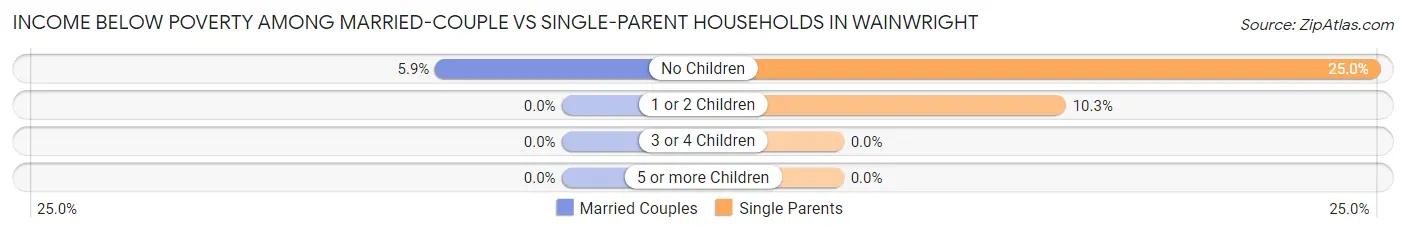
| Children | Married-Couple Families | Single-Parent Households |
| No Children | 1 (5.9%) | 4 (25.0%) |
| 1 or 2 Children | 0 (0.0%) | 3 (10.3%) |
| 3 or 4 Children | 0 (0.0%) | 0 (0.0%) |
| 5 or more Children | 0 (0.0%) | 0 (0.0%) |
| Total | 1 (2.1%) | 7 (14.0%) |
Race in Wainwright
The most populous races in Wainwright are Native / Alaskan (463 | 74.6%), White / Caucasian (147 | 23.7%), and Two or more Races (11 | 1.8%).
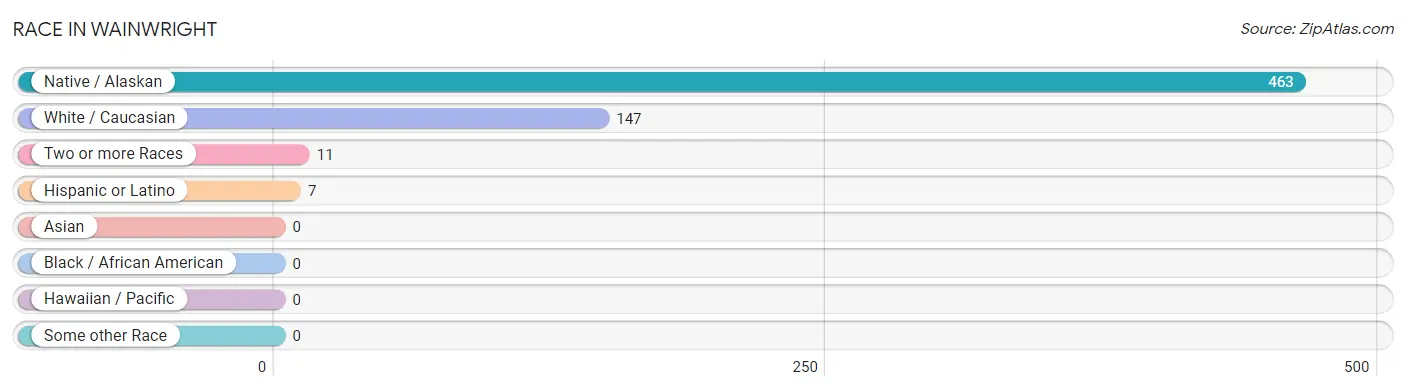
| Race | # Population | % Population |
| Asian | 0 | 0.0% |
| Black / African American | 0 | 0.0% |
| Hawaiian / Pacific | 0 | 0.0% |
| Hispanic or Latino | 7 | 1.1% |
| Native / Alaskan | 463 | 74.6% |
| White / Caucasian | 147 | 23.7% |
| Two or more Races | 11 | 1.8% |
| Some other Race | 0 | 0.0% |
| Total | 621 | 100.0% |
Ancestry in Wainwright
The most populous ancestries reported in Wainwright are Inupiat (470 | 75.7%), Colombian (7 | 1.1%), European (7 | 1.1%), French (7 | 1.1%), and South American (7 | 1.1%), together accounting for 80.2% of all Wainwright residents.
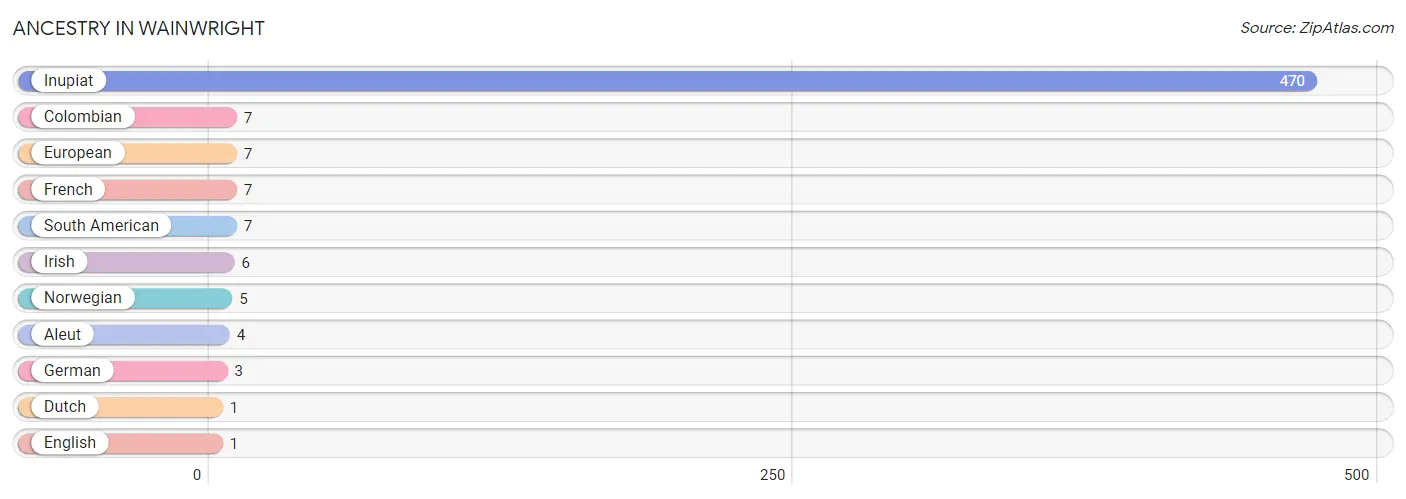
| Ancestry | # Population | % Population |
| Aleut | 4 | 0.6% |
| Colombian | 7 | 1.1% |
| Dutch | 1 | 0.2% |
| English | 1 | 0.2% |
| European | 7 | 1.1% |
| French | 7 | 1.1% |
| German | 3 | 0.5% |
| Inupiat | 470 | 75.7% |
| Irish | 6 | 1.0% |
| Norwegian | 5 | 0.8% |
| South American | 7 | 1.1% | View All 11 Rows |
Immigrants in Wainwright

| Immigration Origin | # Population | % Population | View All 0 Rows |
Sex and Age in Wainwright
Sex and Age in Wainwright
The most populous age groups in Wainwright are 45 to 49 Years (146 | 39.1%) for men and 15 to 19 Years (33 | 13.3%) for women.
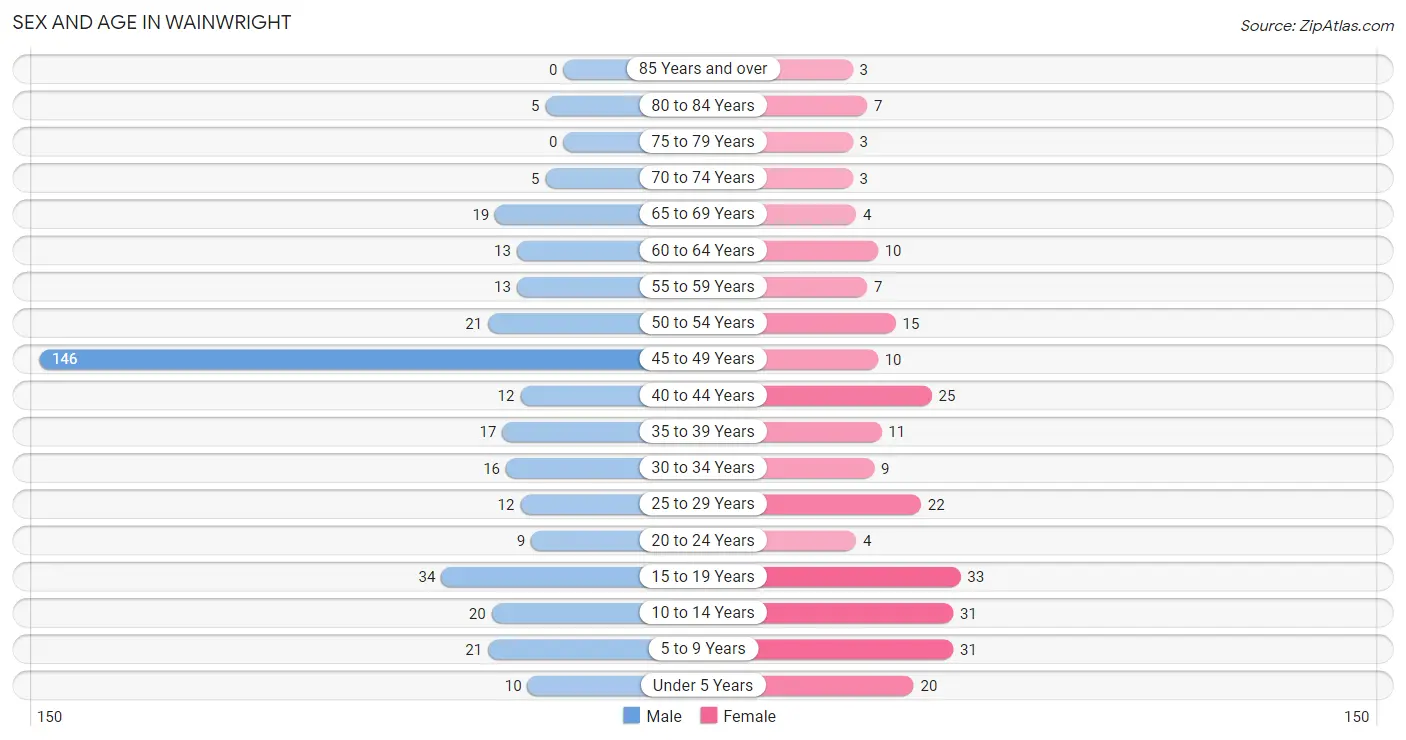
| Age Bracket | Male | Female |
| Under 5 Years | 10 (2.7%) | 20 (8.1%) |
| 5 to 9 Years | 21 (5.6%) | 31 (12.5%) |
| 10 to 14 Years | 20 (5.4%) | 31 (12.5%) |
| 15 to 19 Years | 34 (9.1%) | 33 (13.3%) |
| 20 to 24 Years | 9 (2.4%) | 4 (1.6%) |
| 25 to 29 Years | 12 (3.2%) | 22 (8.9%) |
| 30 to 34 Years | 16 (4.3%) | 9 (3.6%) |
| 35 to 39 Years | 17 (4.6%) | 11 (4.4%) |
| 40 to 44 Years | 12 (3.2%) | 25 (10.1%) |
| 45 to 49 Years | 146 (39.1%) | 10 (4.0%) |
| 50 to 54 Years | 21 (5.6%) | 15 (6.0%) |
| 55 to 59 Years | 13 (3.5%) | 7 (2.8%) |
| 60 to 64 Years | 13 (3.5%) | 10 (4.0%) |
| 65 to 69 Years | 19 (5.1%) | 4 (1.6%) |
| 70 to 74 Years | 5 (1.3%) | 3 (1.2%) |
| 75 to 79 Years | 0 (0.0%) | 3 (1.2%) |
| 80 to 84 Years | 5 (1.3%) | 7 (2.8%) |
| 85 Years and over | 0 (0.0%) | 3 (1.2%) |
| Total | 373 (100.0%) | 248 (100.0%) |
Families and Households in Wainwright
Median Family Size in Wainwright
The median family size in Wainwright is 3.92 persons per family, with married-couple families (48 | 49.0%) accounting for the largest median family size of 4.63 persons per family. On the other hand, single female/mother families (29 | 29.6%) represent the smallest median family size with 3.10 persons per family.
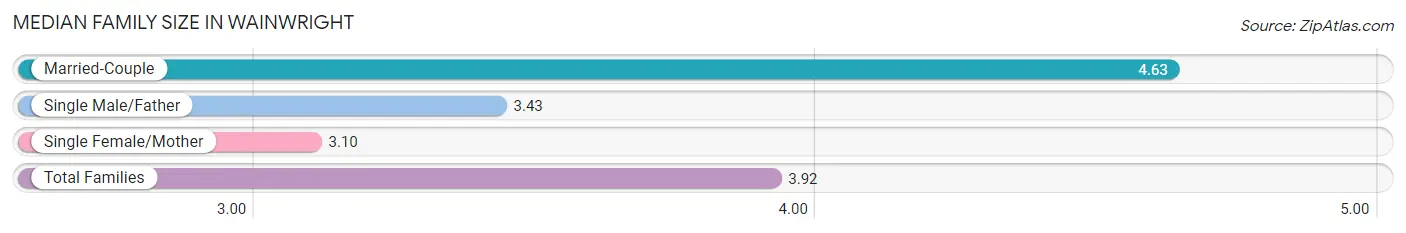
| Family Type | # Families | Family Size |
| Married-Couple | 48 (49.0%) | 4.63 |
| Single Male/Father | 21 (21.4%) | 3.43 |
| Single Female/Mother | 29 (29.6%) | 3.10 |
| Total Families | 98 (100.0%) | 3.92 |
Median Household Size in Wainwright
The median household size in Wainwright is 3.48 persons per household, with married-couple households (48 | 34.3%) accounting for the largest median household size of 4.71 persons per household. non-family households (42 | 30.0%) represent the smallest median household size with 1.79 persons per household.
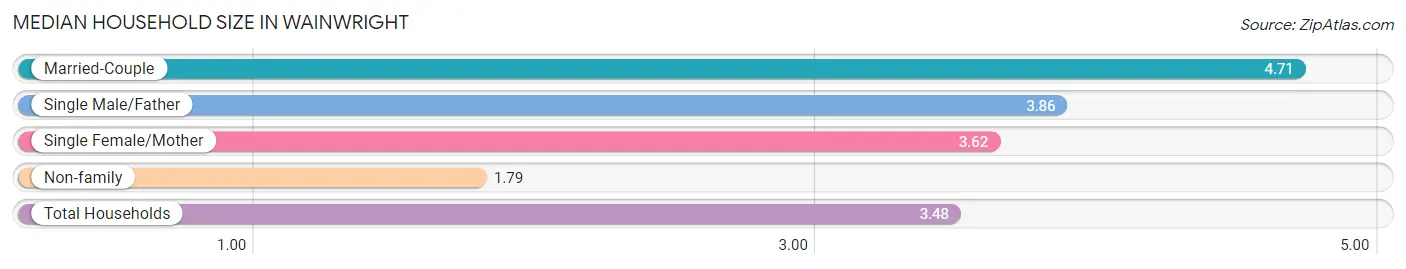
| Household Type | # Households | Household Size |
| Married-Couple | 48 (34.3%) | 4.71 |
| Single Male/Father | 21 (15.0%) | 3.86 |
| Single Female/Mother | 29 (20.7%) | 3.62 |
| Non-family | 42 (30.0%) | 1.79 |
| Total Households | 140 (100.0%) | 3.48 |
Household Size by Marriage Status in Wainwright
Out of a total of 140 households in Wainwright, 98 (70.0%) are family households, while 42 (30.0%) are nonfamily households. The most numerous type of family households are 3-person households, comprising 34, and the most common type of nonfamily households are 1-person households, comprising 32.
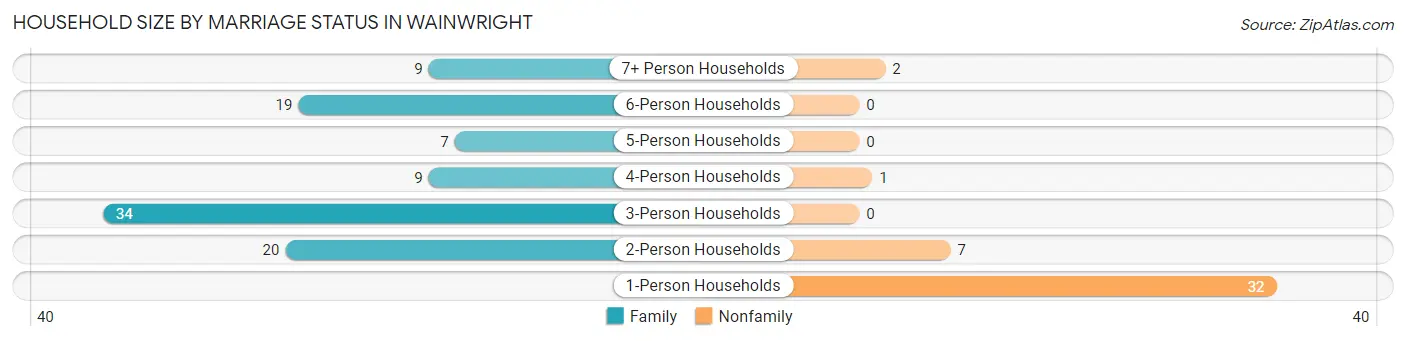
| Household Size | Family Households | Nonfamily Households |
| 1-Person Households | - | 32 (22.9%) |
| 2-Person Households | 20 (14.3%) | 7 (5.0%) |
| 3-Person Households | 34 (24.3%) | 0 (0.0%) |
| 4-Person Households | 9 (6.4%) | 1 (0.7%) |
| 5-Person Households | 7 (5.0%) | 0 (0.0%) |
| 6-Person Households | 19 (13.6%) | 0 (0.0%) |
| 7+ Person Households | 9 (6.4%) | 2 (1.4%) |
| Total | 98 (70.0%) | 42 (30.0%) |
Female Fertility in Wainwright
Fertility by Age in Wainwright
Average fertility rate in Wainwright is 61.0 births per 1,000 women. Women in the age bracket of 20 to 34 years have the highest fertility rate with 114.0 births per 1,000 women. Women in the age bracket of 20 to 34 years acount for 57.1% of all women with births.
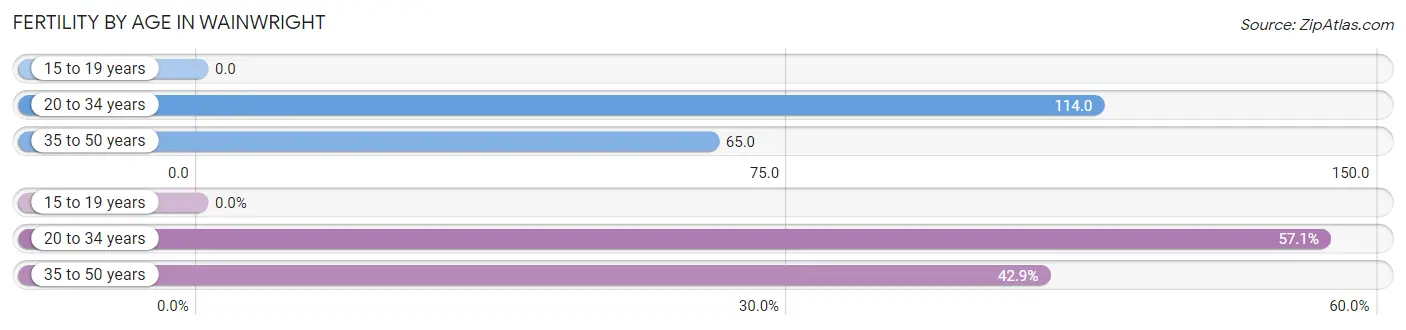
| Age Bracket | Women with Births | Births / 1,000 Women |
| 15 to 19 years | 0 (0.0%) | 0.0 |
| 20 to 34 years | 4 (57.1%) | 114.0 |
| 35 to 50 years | 3 (42.9%) | 65.0 |
| Total | 7 (100.0%) | 61.0 |
Fertility by Age by Marriage Status in Wainwright
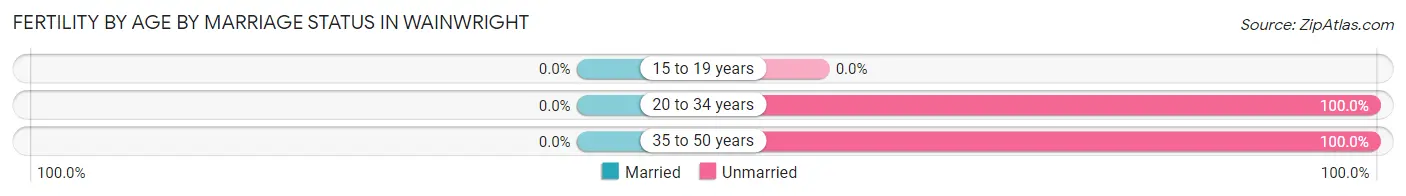
| Age Bracket | Married | Unmarried |
| 15 to 19 years | 0 (0.0%) | 0 (0.0%) |
| 20 to 34 years | 0 (0.0%) | 4 (100.0%) |
| 35 to 50 years | 0 (0.0%) | 3 (100.0%) |
| Total | 0 (0.0%) | 7 (100.0%) |
Fertility by Education in Wainwright
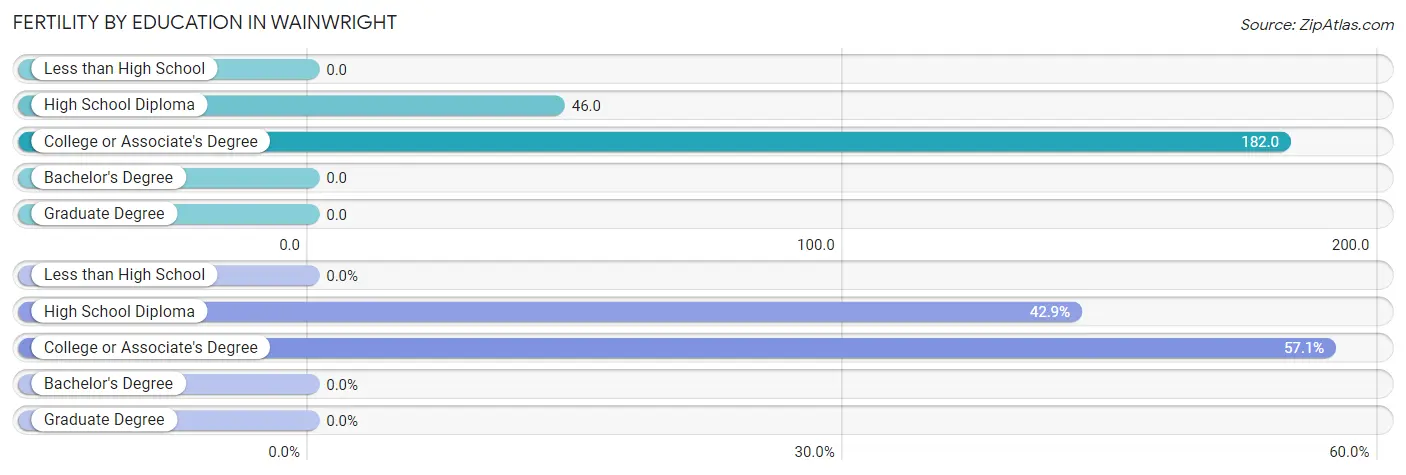
| Educational Attainment | Women with Births | Births / 1,000 Women |
| Less than High School | 0 (0.0%) | 0.0 |
| High School Diploma | 3 (42.9%) | 46.0 |
| College or Associate's Degree | 4 (57.1%) | 182.0 |
| Bachelor's Degree | 0 (0.0%) | 0.0 |
| Graduate Degree | 0 (0.0%) | 0.0 |
| Total | 7 (100.0%) | 61.0 |
Fertility by Education by Marriage Status in Wainwright
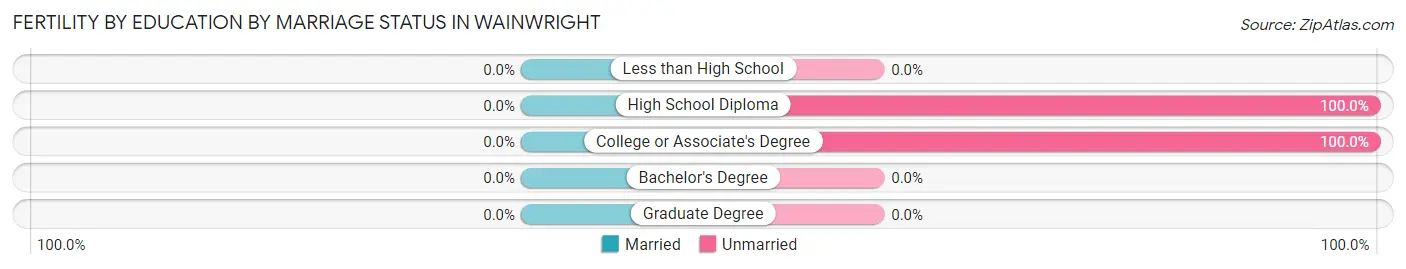
| Educational Attainment | Married | Unmarried |
| Less than High School | 0 (0.0%) | 0 (0.0%) |
| High School Diploma | 0 (0.0%) | 3 (100.0%) |
| College or Associate's Degree | 0 (0.0%) | 4 (100.0%) |
| Bachelor's Degree | 0 (0.0%) | 0 (0.0%) |
| Graduate Degree | 0 (0.0%) | 0 (0.0%) |
| Total | 0 (0.0%) | 7 (100.0%) |
Employment Characteristics in Wainwright
Employment by Class of Employer in Wainwright
Among the 284 employed individuals in Wainwright, private company employees (159 | 56.0%), local government employees (109 | 38.4%), and self-employed (not incorporated) (7 | 2.5%) make up the most common classes of employment.
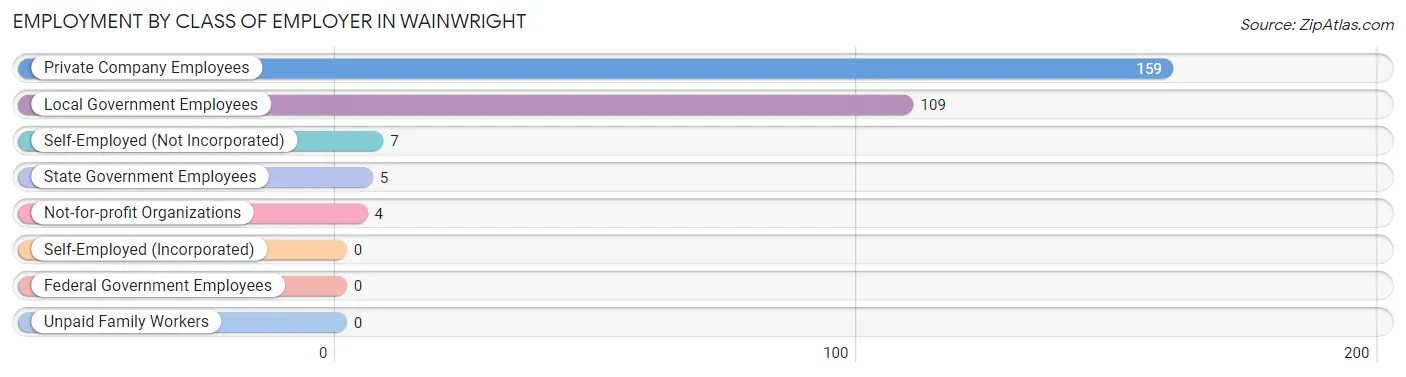
| Employer Class | # Employees | % Employees |
| Private Company Employees | 159 | 56.0% |
| Self-Employed (Incorporated) | 0 | 0.0% |
| Self-Employed (Not Incorporated) | 7 | 2.5% |
| Not-for-profit Organizations | 4 | 1.4% |
| Local Government Employees | 109 | 38.4% |
| State Government Employees | 5 | 1.8% |
| Federal Government Employees | 0 | 0.0% |
| Unpaid Family Workers | 0 | 0.0% |
| Total | 284 | 100.0% |
Employment Status by Age in Wainwright
According to the labor force statistics for Wainwright, out of the total population over 16 years of age (468), 69.0% or 323 individuals are in the labor force, with 8.0% or 26 of them unemployed. The age group with the highest labor force participation rate is 45 to 54 years, with 91.7% or 176 individuals in the labor force. Within the labor force, the 16 to 19 years age range has the highest percentage of unemployed individuals, with 38.5% or 10 of them being unemployed.
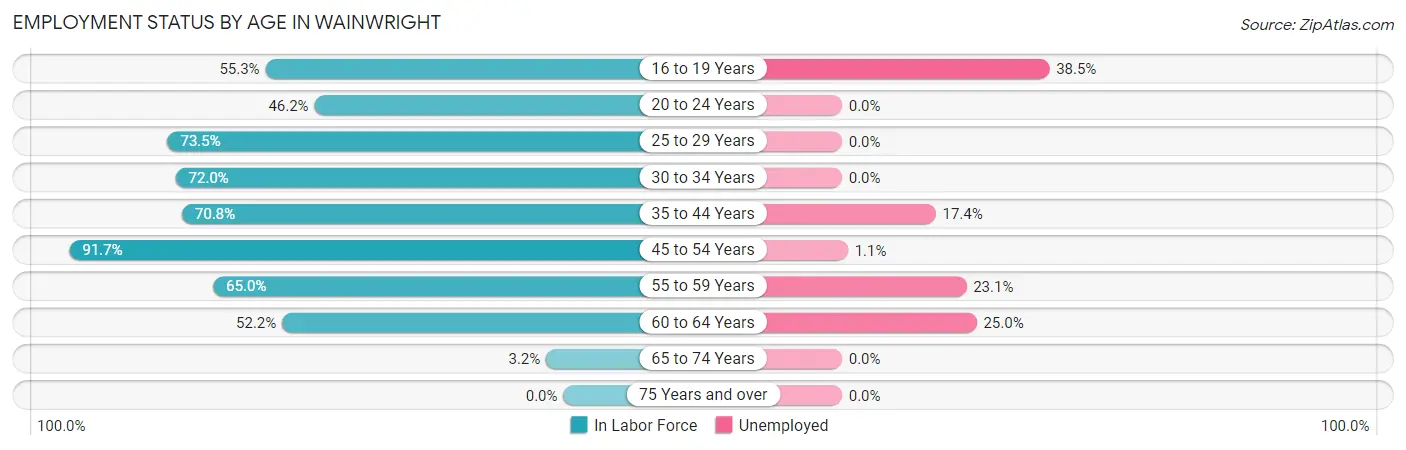
| Age Bracket | In Labor Force | Unemployed |
| 16 to 19 Years | 26 (55.3%) | 10 (38.5%) |
| 20 to 24 Years | 6 (46.2%) | 0 (0.0%) |
| 25 to 29 Years | 25 (73.5%) | 0 (0.0%) |
| 30 to 34 Years | 18 (72.0%) | 0 (0.0%) |
| 35 to 44 Years | 46 (70.8%) | 8 (17.4%) |
| 45 to 54 Years | 176 (91.7%) | 2 (1.1%) |
| 55 to 59 Years | 13 (65.0%) | 3 (23.1%) |
| 60 to 64 Years | 12 (52.2%) | 3 (25.0%) |
| 65 to 74 Years | 1 (3.2%) | 0 (0.0%) |
| 75 Years and over | 0 (0.0%) | 0 (0.0%) |
| Total | 323 (69.0%) | 26 (8.0%) |
Employment Status by Educational Attainment in Wainwright
According to labor force statistics for Wainwright, 80.8% of individuals (290) out of the total population between 25 and 64 years of age (359) are in the labor force, with 5.5% or 16 of them being unemployed. The group with the highest labor force participation rate are those with the educational attainment of bachelor's degree or higher, with 100.0% or 13 individuals in the labor force. Within the labor force, individuals with high school diploma education have the highest percentage of unemployment, with 16.3% or 16 of them being unemployed.
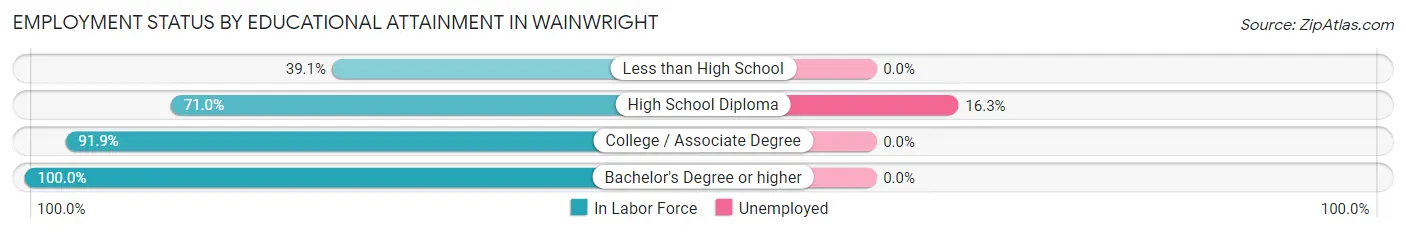
| Educational Attainment | In Labor Force | Unemployed |
| Less than High School | 9 (39.1%) | 0 (0.0%) |
| High School Diploma | 98 (71.0%) | 22 (16.3%) |
| College / Associate Degree | 170 (91.9%) | 0 (0.0%) |
| Bachelor's Degree or higher | 13 (100.0%) | 0 (0.0%) |
| Total | 290 (80.8%) | 20 (5.5%) |
Employment Occupations by Sex in Wainwright
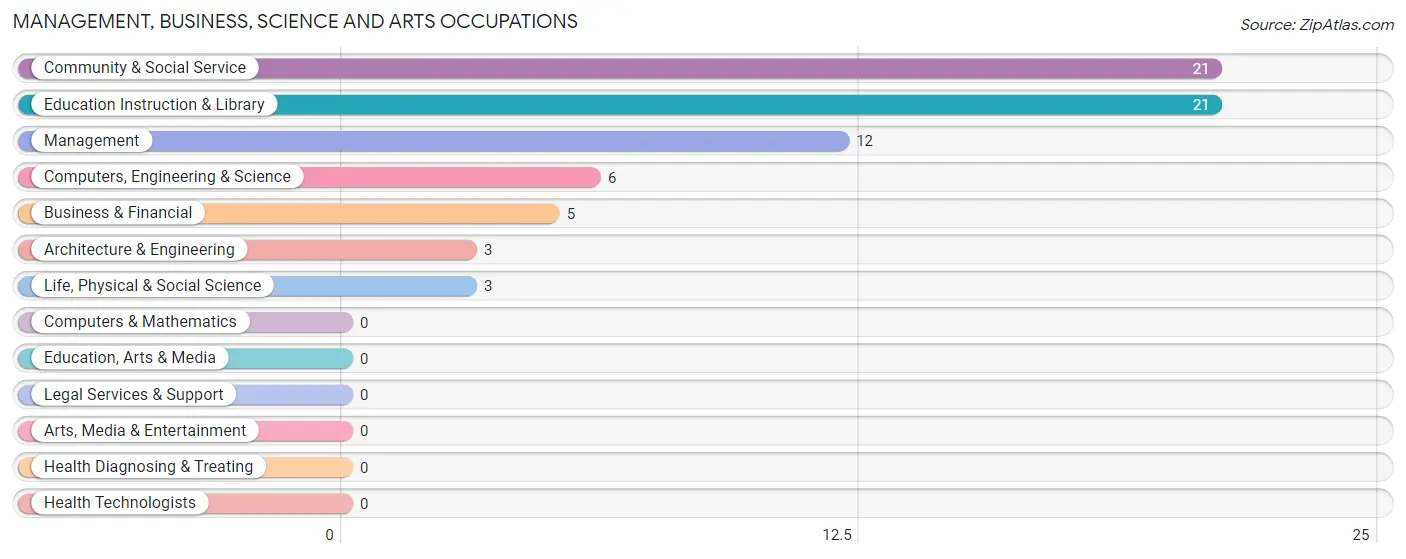
Management, Business, Science and Arts Occupations
The most common Management, Business, Science and Arts occupations in Wainwright are Community & Social Service (21 | 7.1%), Education Instruction & Library (21 | 7.1%), Management (12 | 4.0%), Computers, Engineering & Science (6 | 2.0%), and Business & Financial (5 | 1.7%).
Management, Business, Science and Arts Occupations by Sex
Within the Management, Business, Science and Arts occupations in Wainwright, the most male-oriented occupations are Management (16.7%), Community & Social Service (4.8%), and Education Instruction & Library (4.8%), while the most female-oriented occupations are Business & Financial (100.0%), Computers, Engineering & Science (100.0%), and Architecture & Engineering (100.0%).
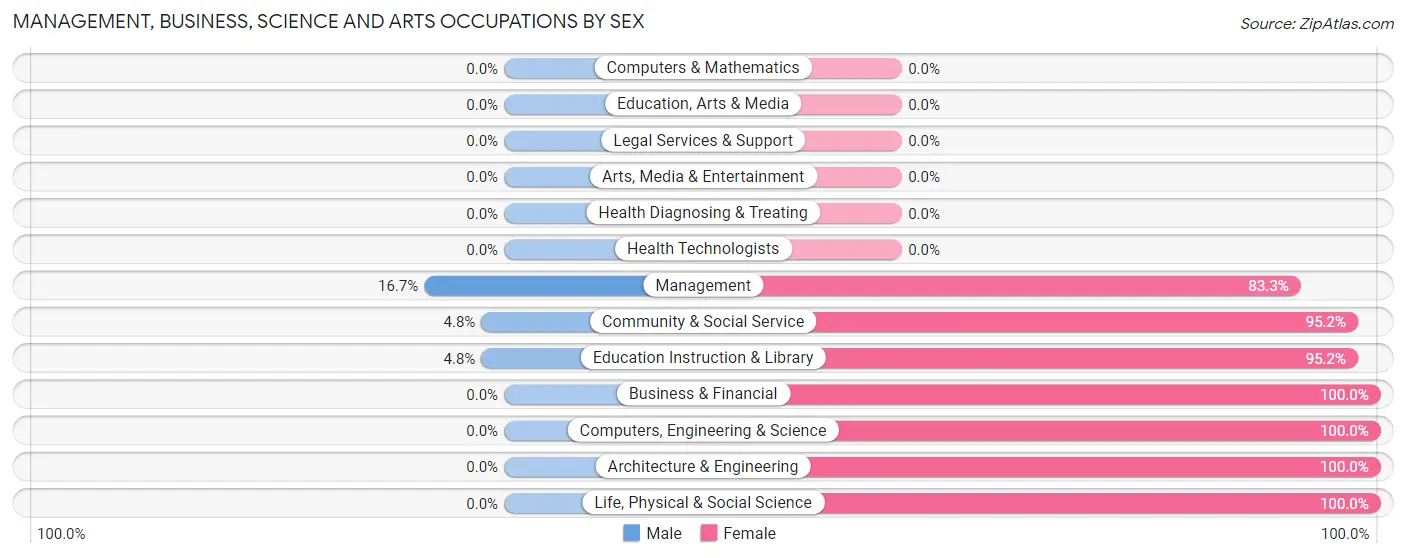
| Occupation | Male | Female |
| Management | 2 (16.7%) | 10 (83.3%) |
| Business & Financial | 0 (0.0%) | 5 (100.0%) |
| Computers, Engineering & Science | 0 (0.0%) | 6 (100.0%) |
| Computers & Mathematics | 0 (0.0%) | 0 (0.0%) |
| Architecture & Engineering | 0 (0.0%) | 3 (100.0%) |
| Life, Physical & Social Science | 0 (0.0%) | 3 (100.0%) |
| Community & Social Service | 1 (4.8%) | 20 (95.2%) |
| Education, Arts & Media | 0 (0.0%) | 0 (0.0%) |
| Legal Services & Support | 0 (0.0%) | 0 (0.0%) |
| Education Instruction & Library | 1 (4.8%) | 20 (95.2%) |
| Arts, Media & Entertainment | 0 (0.0%) | 0 (0.0%) |
| Health Diagnosing & Treating | 0 (0.0%) | 0 (0.0%) |
| Health Technologists | 0 (0.0%) | 0 (0.0%) |
| Total (Category) | 3 (6.8%) | 41 (93.2%) |
| Total (Overall) | 204 (68.7%) | 93 (31.3%) |
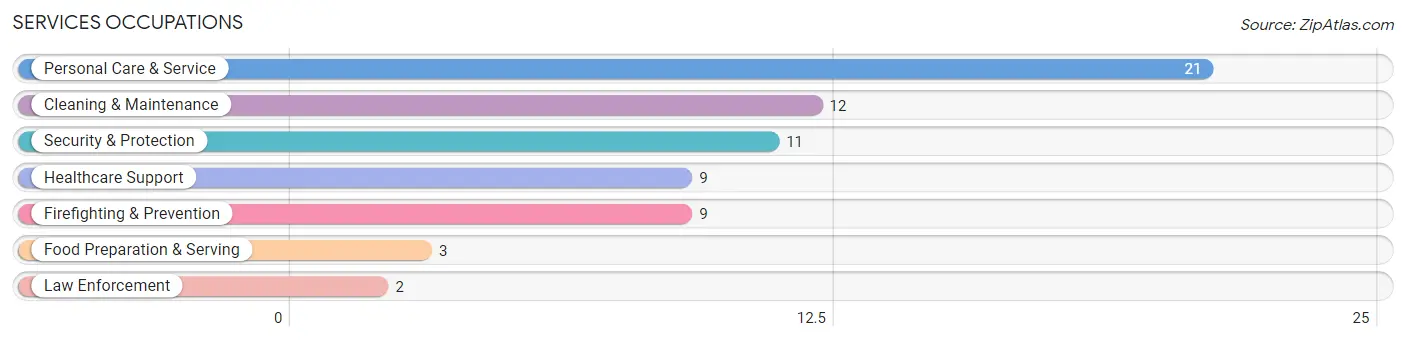
Services Occupations
The most common Services occupations in Wainwright are Personal Care & Service (21 | 7.1%), Cleaning & Maintenance (12 | 4.0%), Security & Protection (11 | 3.7%), Healthcare Support (9 | 3.0%), and Firefighting & Prevention (9 | 3.0%).
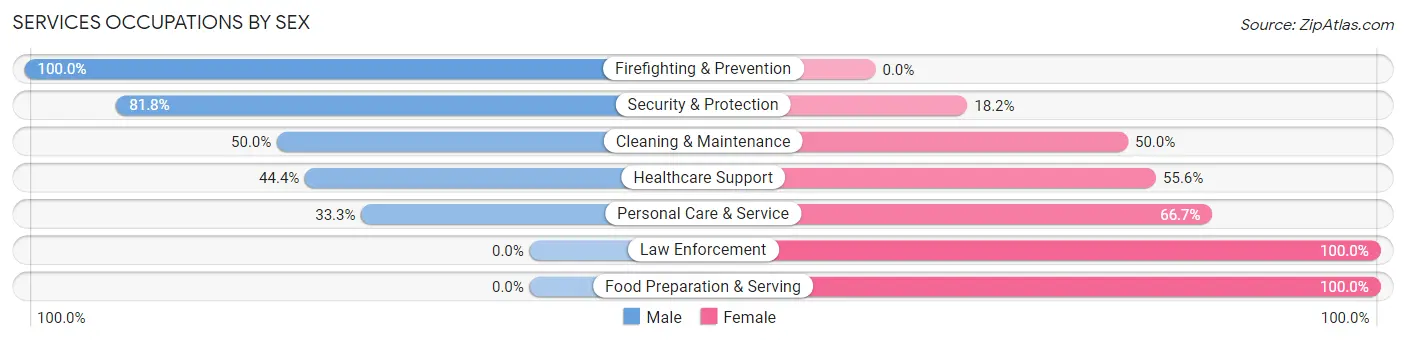
Services Occupations by Sex
Within the Services occupations in Wainwright, the most male-oriented occupations are Firefighting & Prevention (100.0%), Security & Protection (81.8%), and Cleaning & Maintenance (50.0%), while the most female-oriented occupations are Law Enforcement (100.0%), Food Preparation & Serving (100.0%), and Personal Care & Service (66.7%).
| Occupation | Male | Female |
| Healthcare Support | 4 (44.4%) | 5 (55.6%) |
| Security & Protection | 9 (81.8%) | 2 (18.2%) |
| Firefighting & Prevention | 9 (100.0%) | 0 (0.0%) |
| Law Enforcement | 0 (0.0%) | 2 (100.0%) |
| Food Preparation & Serving | 0 (0.0%) | 3 (100.0%) |
| Cleaning & Maintenance | 6 (50.0%) | 6 (50.0%) |
| Personal Care & Service | 7 (33.3%) | 14 (66.7%) |
| Total (Category) | 26 (46.4%) | 30 (53.6%) |
| Total (Overall) | 204 (68.7%) | 93 (31.3%) |
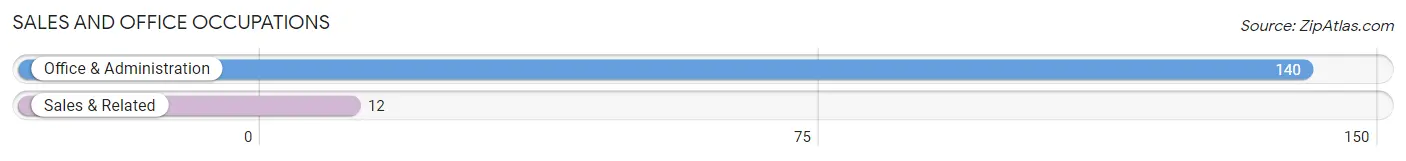
Sales and Office Occupations
The most common Sales and Office occupations in Wainwright are Office & Administration (140 | 47.1%), and Sales & Related (12 | 4.0%).
Sales and Office Occupations by Sex

| Occupation | Male | Female |
| Sales & Related | 6 (50.0%) | 6 (50.0%) |
| Office & Administration | 134 (95.7%) | 6 (4.3%) |
| Total (Category) | 140 (92.1%) | 12 (7.9%) |
| Total (Overall) | 204 (68.7%) | 93 (31.3%) |
Natural Resources, Construction and Maintenance Occupations
The most common Natural Resources, Construction and Maintenance occupations in Wainwright are Installation, Maintenance & Repair (12 | 4.0%), and Construction & Extraction (5 | 1.7%).

Natural Resources, Construction and Maintenance Occupations by Sex

| Occupation | Male | Female |
| Farming, Fishing & Forestry | 0 (0.0%) | 0 (0.0%) |
| Construction & Extraction | 5 (100.0%) | 0 (0.0%) |
| Installation, Maintenance & Repair | 12 (100.0%) | 0 (0.0%) |
| Total (Category) | 17 (100.0%) | 0 (0.0%) |
| Total (Overall) | 204 (68.7%) | 93 (31.3%) |
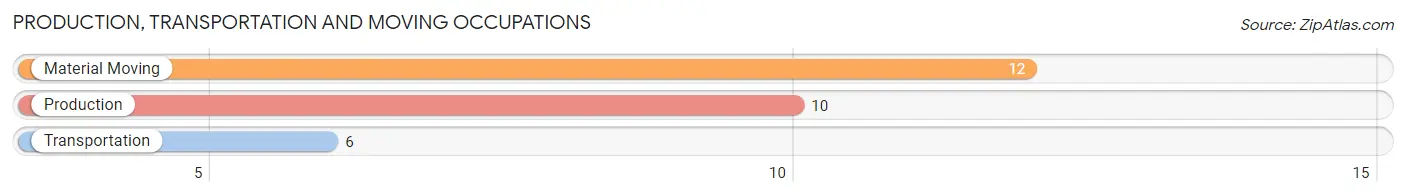
Production, Transportation and Moving Occupations
The most common Production, Transportation and Moving occupations in Wainwright are Material Moving (12 | 4.0%), Production (10 | 3.4%), and Transportation (6 | 2.0%).
Production, Transportation and Moving Occupations by Sex
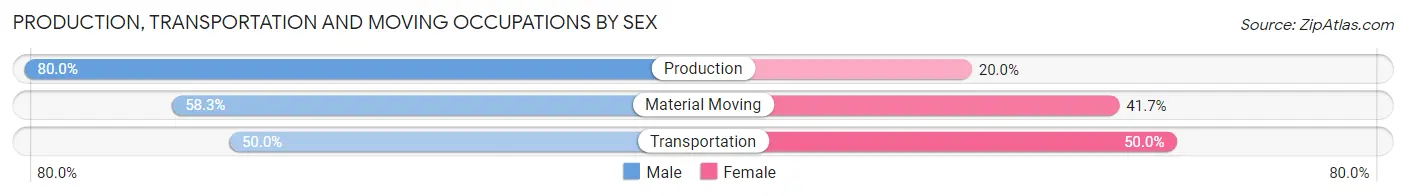
| Occupation | Male | Female |
| Production | 8 (80.0%) | 2 (20.0%) |
| Transportation | 3 (50.0%) | 3 (50.0%) |
| Material Moving | 7 (58.3%) | 5 (41.7%) |
| Total (Category) | 18 (64.3%) | 10 (35.7%) |
| Total (Overall) | 204 (68.7%) | 93 (31.3%) |
Employment Industries by Sex in Wainwright
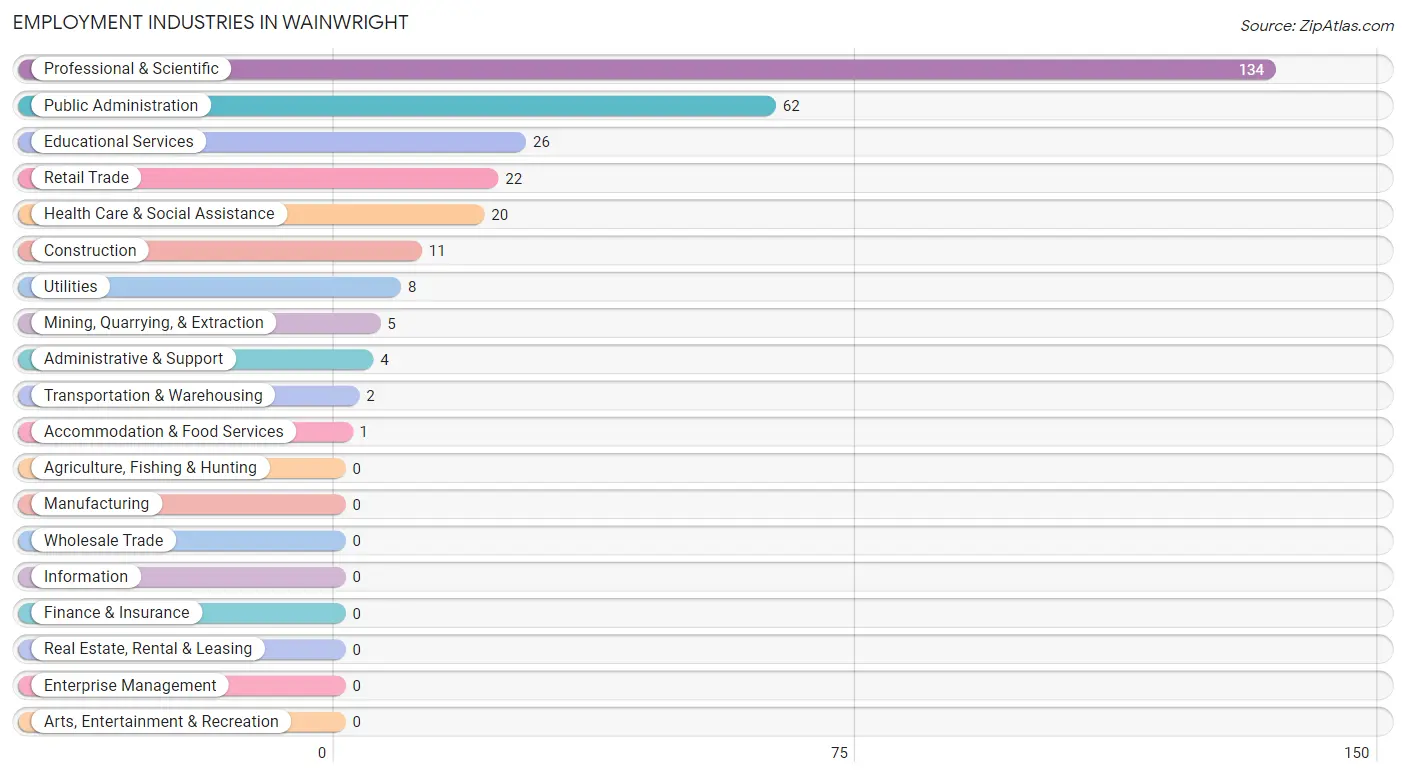
Employment Industries in Wainwright
The major employment industries in Wainwright include Professional & Scientific (134 | 45.1%), Public Administration (62 | 20.9%), Educational Services (26 | 8.7%), Retail Trade (22 | 7.4%), and Health Care & Social Assistance (20 | 6.7%).
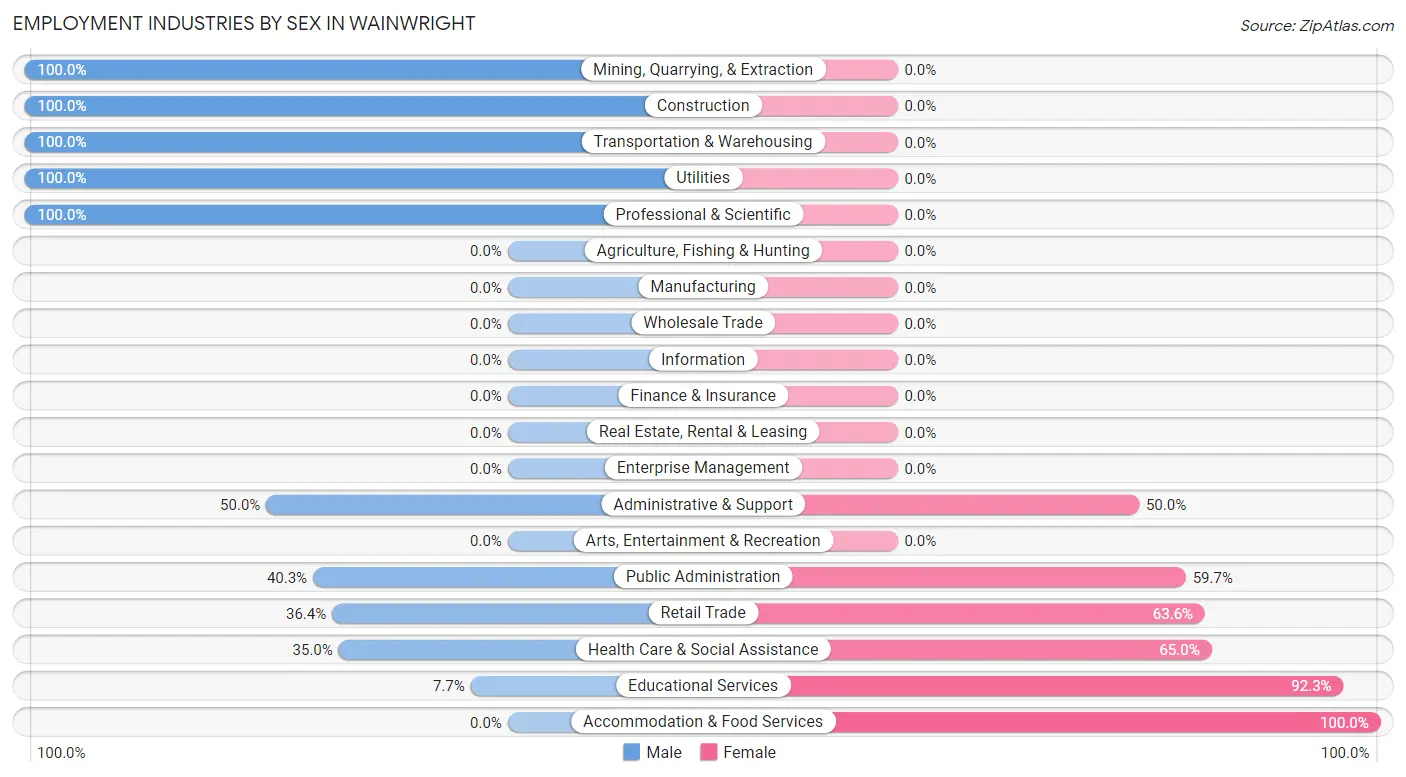
Employment Industries by Sex in Wainwright
The Wainwright industries that see more men than women are Mining, Quarrying, & Extraction (100.0%), Construction (100.0%), and Transportation & Warehousing (100.0%), whereas the industries that tend to have a higher number of women are Accommodation & Food Services (100.0%), Educational Services (92.3%), and Health Care & Social Assistance (65.0%).
| Industry | Male | Female |
| Agriculture, Fishing & Hunting | 0 (0.0%) | 0 (0.0%) |
| Mining, Quarrying, & Extraction | 5 (100.0%) | 0 (0.0%) |
| Construction | 11 (100.0%) | 0 (0.0%) |
| Manufacturing | 0 (0.0%) | 0 (0.0%) |
| Wholesale Trade | 0 (0.0%) | 0 (0.0%) |
| Retail Trade | 8 (36.4%) | 14 (63.6%) |
| Transportation & Warehousing | 2 (100.0%) | 0 (0.0%) |
| Utilities | 8 (100.0%) | 0 (0.0%) |
| Information | 0 (0.0%) | 0 (0.0%) |
| Finance & Insurance | 0 (0.0%) | 0 (0.0%) |
| Real Estate, Rental & Leasing | 0 (0.0%) | 0 (0.0%) |
| Professional & Scientific | 134 (100.0%) | 0 (0.0%) |
| Enterprise Management | 0 (0.0%) | 0 (0.0%) |
| Administrative & Support | 2 (50.0%) | 2 (50.0%) |
| Educational Services | 2 (7.7%) | 24 (92.3%) |
| Health Care & Social Assistance | 7 (35.0%) | 13 (65.0%) |
| Arts, Entertainment & Recreation | 0 (0.0%) | 0 (0.0%) |
| Accommodation & Food Services | 0 (0.0%) | 1 (100.0%) |
| Public Administration | 25 (40.3%) | 37 (59.7%) |
| Total | 204 (68.7%) | 93 (31.3%) |
Education in Wainwright
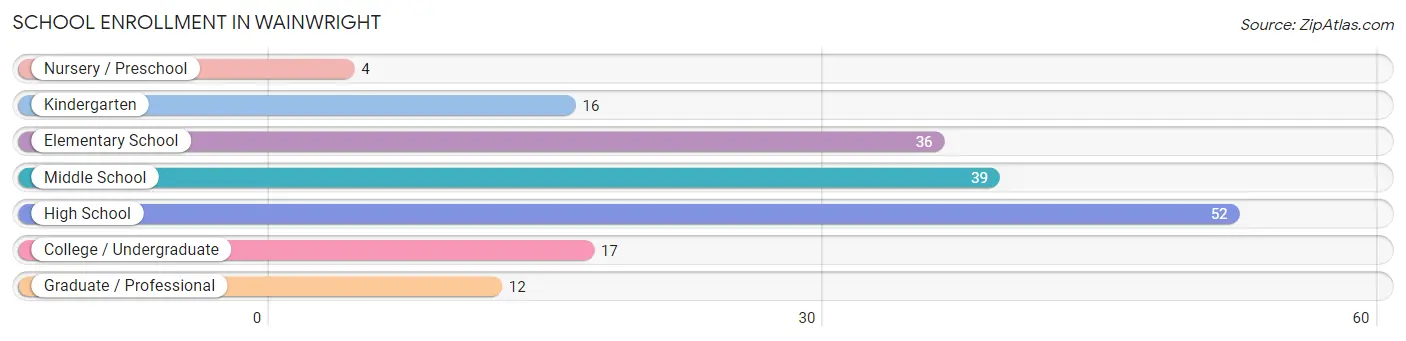
School Enrollment in Wainwright
The most common levels of schooling among the 176 students in Wainwright are high school (52 | 29.5%), middle school (39 | 22.2%), and elementary school (36 | 20.4%).
| School Level | # Students | % Students |
| Nursery / Preschool | 4 | 2.3% |
| Kindergarten | 16 | 9.1% |
| Elementary School | 36 | 20.4% |
| Middle School | 39 | 22.2% |
| High School | 52 | 29.5% |
| College / Undergraduate | 17 | 9.7% |
| Graduate / Professional | 12 | 6.8% |
| Total | 176 | 100.0% |
School Enrollment by Age by Funding Source in Wainwright
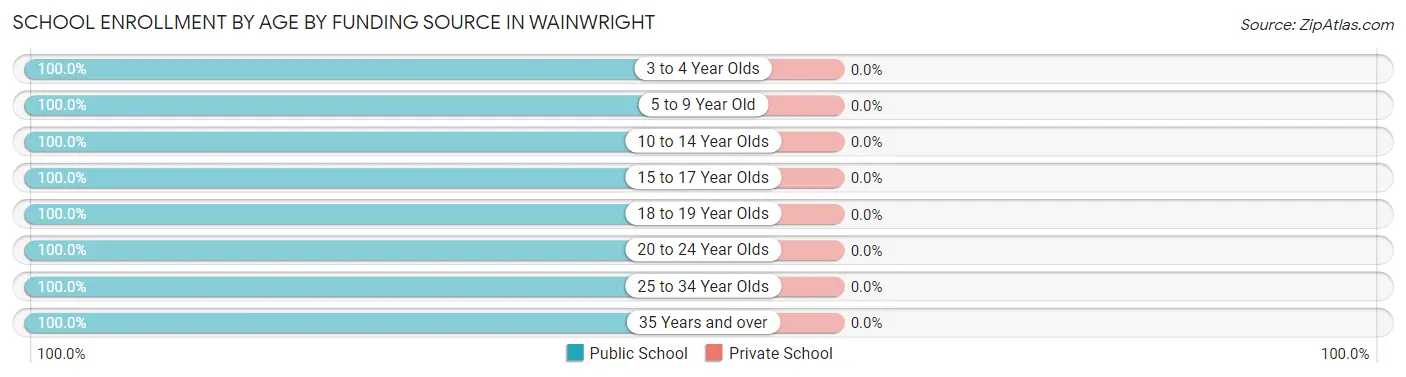
| Age Bracket | Public School | Private School |
| 3 to 4 Year Olds | 4 (100.0%) | 0 (0.0%) |
| 5 to 9 Year Old | 52 (100.0%) | 0 (0.0%) |
| 10 to 14 Year Olds | 51 (100.0%) | 0 (0.0%) |
| 15 to 17 Year Olds | 32 (100.0%) | 0 (0.0%) |
| 18 to 19 Year Olds | 15 (100.0%) | 0 (0.0%) |
| 20 to 24 Year Olds | 4 (100.0%) | 0 (0.0%) |
| 25 to 34 Year Olds | 2 (100.0%) | 0 (0.0%) |
| 35 Years and over | 16 (100.0%) | 0 (0.0%) |
| Total | 176 (100.0%) | 0 (0.0%) |
Educational Attainment by Field of Study in Wainwright
Liberal arts & history (9 | 42.9%), science & technology (4 | 19.1%), education (4 | 19.1%), psychology (1 | 4.8%), and visual & performing arts (1 | 4.8%) are the most common fields of study among 21 individuals in Wainwright who have obtained a bachelor's degree or higher.
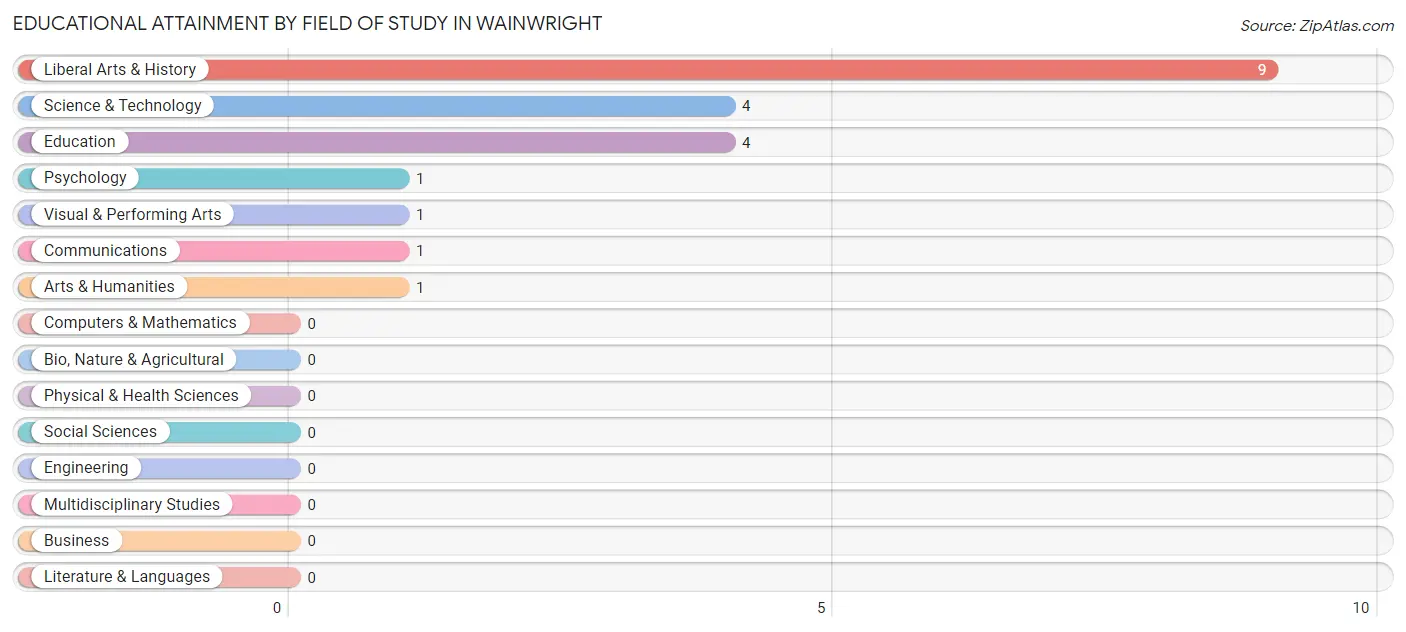
| Field of Study | # Graduates | % Graduates |
| Computers & Mathematics | 0 | 0.0% |
| Bio, Nature & Agricultural | 0 | 0.0% |
| Physical & Health Sciences | 0 | 0.0% |
| Psychology | 1 | 4.8% |
| Social Sciences | 0 | 0.0% |
| Engineering | 0 | 0.0% |
| Multidisciplinary Studies | 0 | 0.0% |
| Science & Technology | 4 | 19.1% |
| Business | 0 | 0.0% |
| Education | 4 | 19.1% |
| Literature & Languages | 0 | 0.0% |
| Liberal Arts & History | 9 | 42.9% |
| Visual & Performing Arts | 1 | 4.8% |
| Communications | 1 | 4.8% |
| Arts & Humanities | 1 | 4.8% |
| Total | 21 | 100.0% |
Transportation & Commute in Wainwright
Vehicle Availability by Sex in Wainwright
The most prevalent vehicle ownership categories in Wainwright are males with no vehicle (36, accounting for 57.1%) and females with no vehicle (47, making up 41.4%).
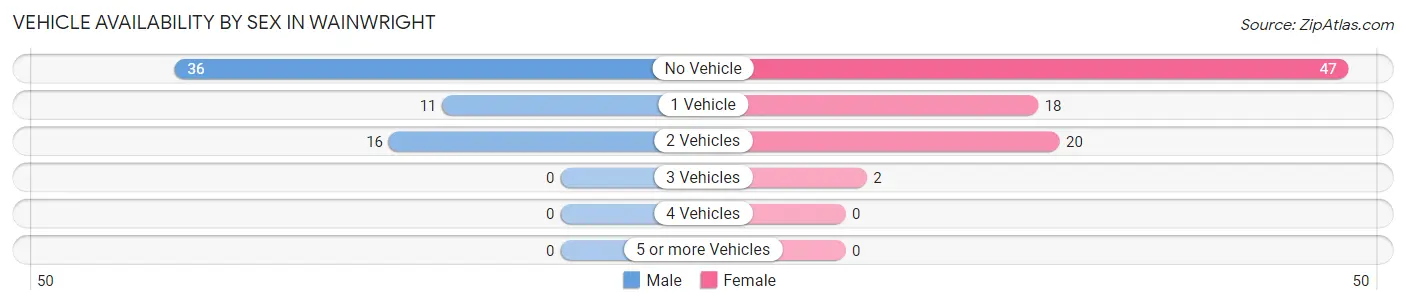
| Vehicles Available | Male | Female |
| No Vehicle | 36 (57.1%) | 47 (54.0%) |
| 1 Vehicle | 11 (17.5%) | 18 (20.7%) |
| 2 Vehicles | 16 (25.4%) | 20 (23.0%) |
| 3 Vehicles | 0 (0.0%) | 2 (2.3%) |
| 4 Vehicles | 0 (0.0%) | 0 (0.0%) |
| 5 or more Vehicles | 0 (0.0%) | 0 (0.0%) |
| Total | 63 (100.0%) | 87 (100.0%) |
Commute Time in Wainwright
The most frequently occuring commute durations in Wainwright are 5 to 9 minutes (201 commuters, 72.0%), less than 5 minutes (54 commuters, 19.4%), and 10 to 14 minutes (14 commuters, 5.0%).
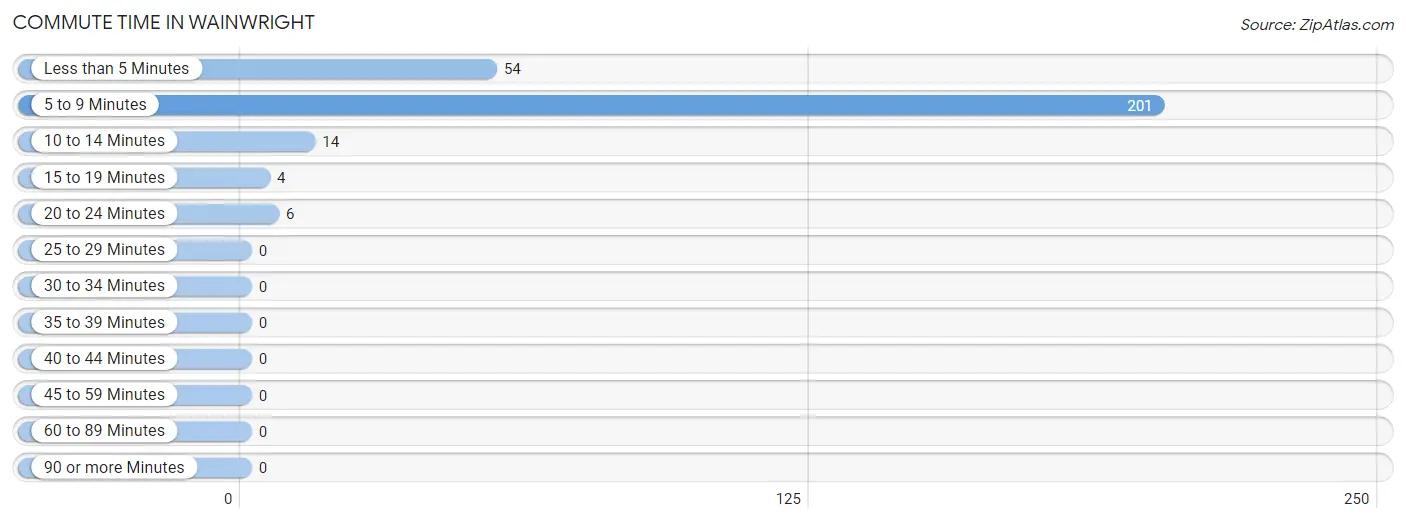
| Commute Time | # Commuters | % Commuters |
| Less than 5 Minutes | 54 | 19.4% |
| 5 to 9 Minutes | 201 | 72.0% |
| 10 to 14 Minutes | 14 | 5.0% |
| 15 to 19 Minutes | 4 | 1.4% |
| 20 to 24 Minutes | 6 | 2.1% |
| 25 to 29 Minutes | 0 | 0.0% |
| 30 to 34 Minutes | 0 | 0.0% |
| 35 to 39 Minutes | 0 | 0.0% |
| 40 to 44 Minutes | 0 | 0.0% |
| 45 to 59 Minutes | 0 | 0.0% |
| 60 to 89 Minutes | 0 | 0.0% |
| 90 or more Minutes | 0 | 0.0% |
Commute Time by Sex in Wainwright
The most common commute times in Wainwright are 5 to 9 minutes (153 commuters, 77.7%) for males and 5 to 9 minutes (48 commuters, 58.5%) for females.
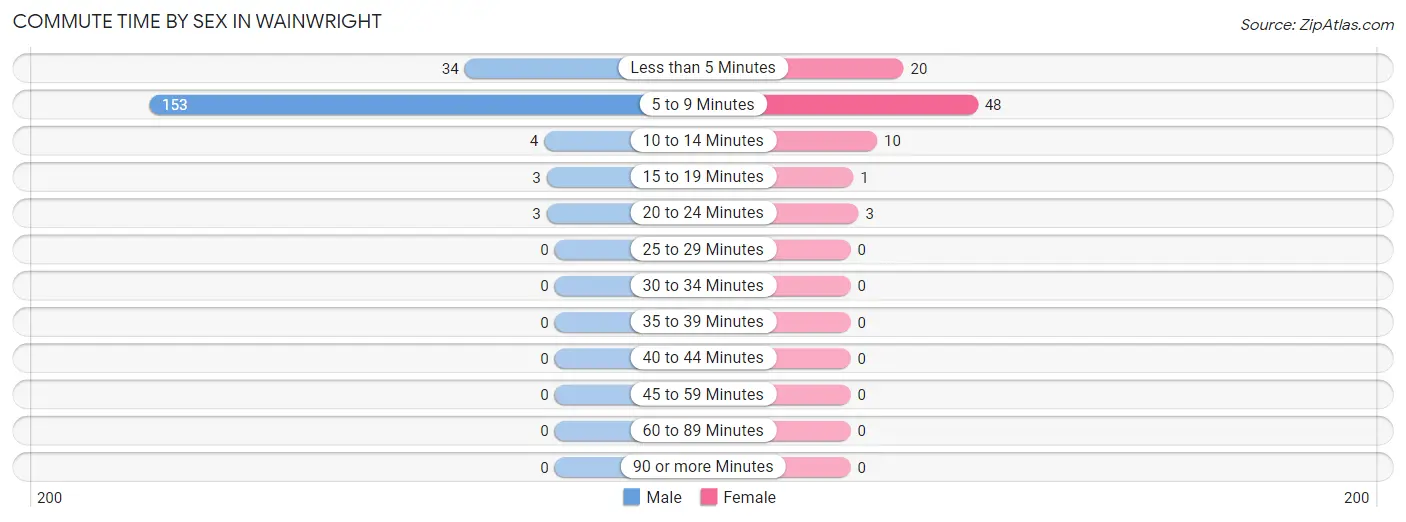
| Commute Time | Male | Female |
| Less than 5 Minutes | 34 (17.3%) | 20 (24.4%) |
| 5 to 9 Minutes | 153 (77.7%) | 48 (58.5%) |
| 10 to 14 Minutes | 4 (2.0%) | 10 (12.2%) |
| 15 to 19 Minutes | 3 (1.5%) | 1 (1.2%) |
| 20 to 24 Minutes | 3 (1.5%) | 3 (3.7%) |
| 25 to 29 Minutes | 0 (0.0%) | 0 (0.0%) |
| 30 to 34 Minutes | 0 (0.0%) | 0 (0.0%) |
| 35 to 39 Minutes | 0 (0.0%) | 0 (0.0%) |
| 40 to 44 Minutes | 0 (0.0%) | 0 (0.0%) |
| 45 to 59 Minutes | 0 (0.0%) | 0 (0.0%) |
| 60 to 89 Minutes | 0 (0.0%) | 0 (0.0%) |
| 90 or more Minutes | 0 (0.0%) | 0 (0.0%) |
Time of Departure to Work by Sex in Wainwright
The most frequent times of departure to work in Wainwright are 5:00 AM to 5:29 AM (134, 68.0%) for males and 8:00 AM to 8:29 AM (21, 25.6%) for females.
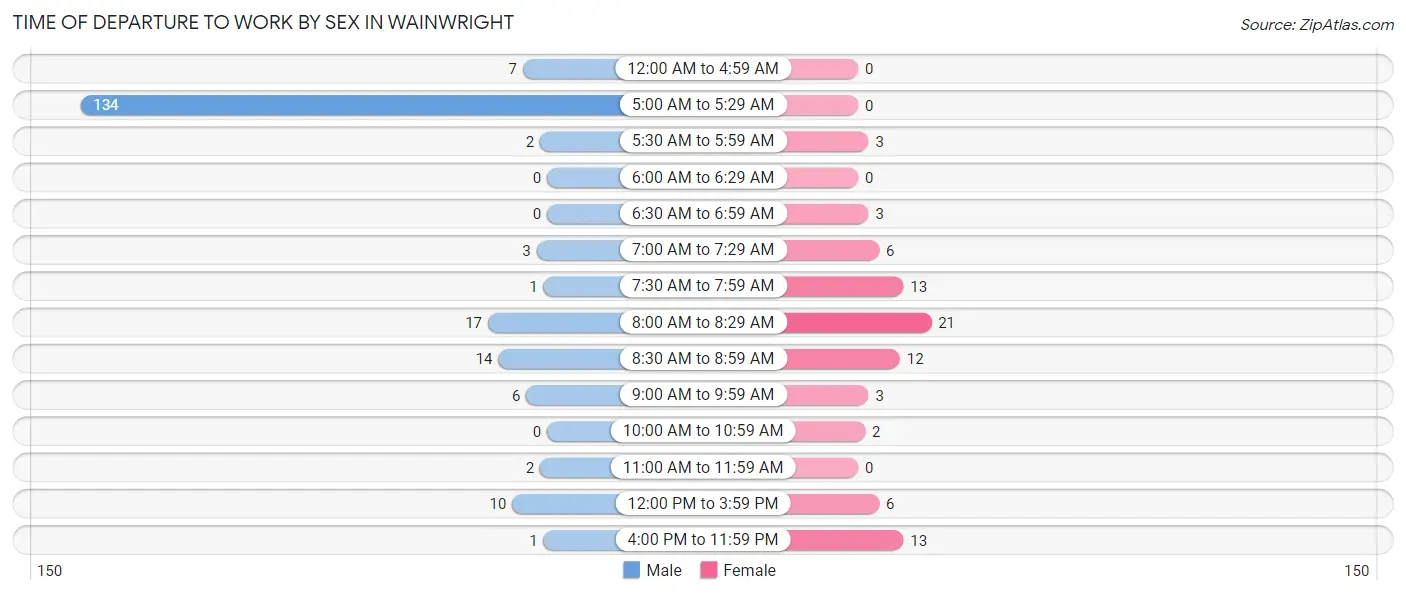
| Time of Departure | Male | Female |
| 12:00 AM to 4:59 AM | 7 (3.5%) | 0 (0.0%) |
| 5:00 AM to 5:29 AM | 134 (68.0%) | 0 (0.0%) |
| 5:30 AM to 5:59 AM | 2 (1.0%) | 3 (3.7%) |
| 6:00 AM to 6:29 AM | 0 (0.0%) | 0 (0.0%) |
| 6:30 AM to 6:59 AM | 0 (0.0%) | 3 (3.7%) |
| 7:00 AM to 7:29 AM | 3 (1.5%) | 6 (7.3%) |
| 7:30 AM to 7:59 AM | 1 (0.5%) | 13 (15.9%) |
| 8:00 AM to 8:29 AM | 17 (8.6%) | 21 (25.6%) |
| 8:30 AM to 8:59 AM | 14 (7.1%) | 12 (14.6%) |
| 9:00 AM to 9:59 AM | 6 (3.0%) | 3 (3.7%) |
| 10:00 AM to 10:59 AM | 0 (0.0%) | 2 (2.4%) |
| 11:00 AM to 11:59 AM | 2 (1.0%) | 0 (0.0%) |
| 12:00 PM to 3:59 PM | 10 (5.1%) | 6 (7.3%) |
| 4:00 PM to 11:59 PM | 1 (0.5%) | 13 (15.9%) |
| Total | 197 (100.0%) | 82 (100.0%) |
Housing Occupancy in Wainwright
Occupancy by Ownership in Wainwright
Of the total 140 dwellings in Wainwright, owner-occupied units account for 92 (65.7%), while renter-occupied units make up 48 (34.3%).
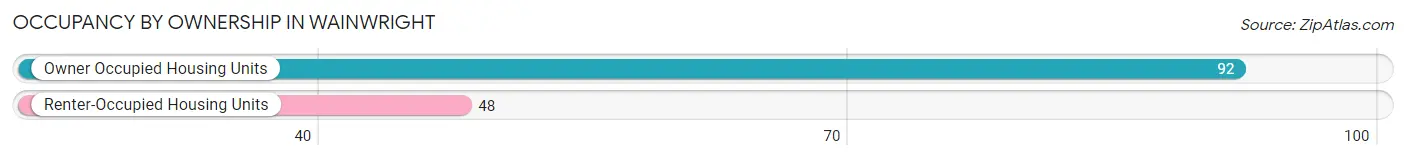
| Occupancy | # Housing Units | % Housing Units |
| Owner Occupied Housing Units | 92 | 65.7% |
| Renter-Occupied Housing Units | 48 | 34.3% |
| Total Occupied Housing Units | 140 | 100.0% |
Occupancy by Household Size in Wainwright
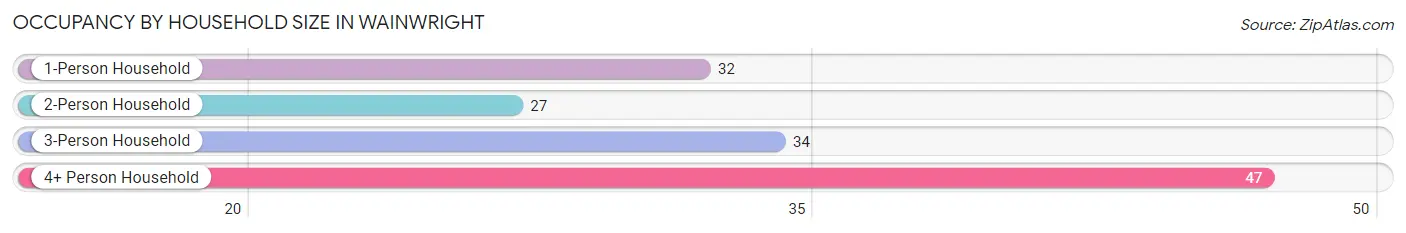
| Household Size | # Housing Units | % Housing Units |
| 1-Person Household | 32 | 22.9% |
| 2-Person Household | 27 | 19.3% |
| 3-Person Household | 34 | 24.3% |
| 4+ Person Household | 47 | 33.6% |
| Total Housing Units | 140 | 100.0% |
Occupancy by Ownership by Household Size in Wainwright
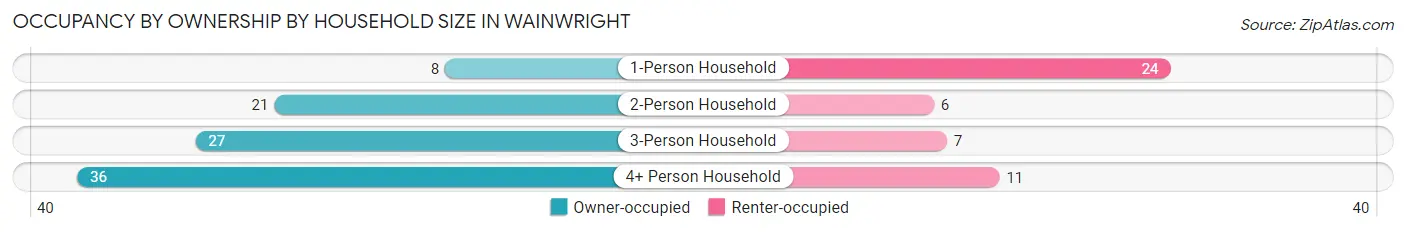
| Household Size | Owner-occupied | Renter-occupied |
| 1-Person Household | 8 (25.0%) | 24 (75.0%) |
| 2-Person Household | 21 (77.8%) | 6 (22.2%) |
| 3-Person Household | 27 (79.4%) | 7 (20.6%) |
| 4+ Person Household | 36 (76.6%) | 11 (23.4%) |
| Total Housing Units | 92 (65.7%) | 48 (34.3%) |
Occupancy by Educational Attainment in Wainwright
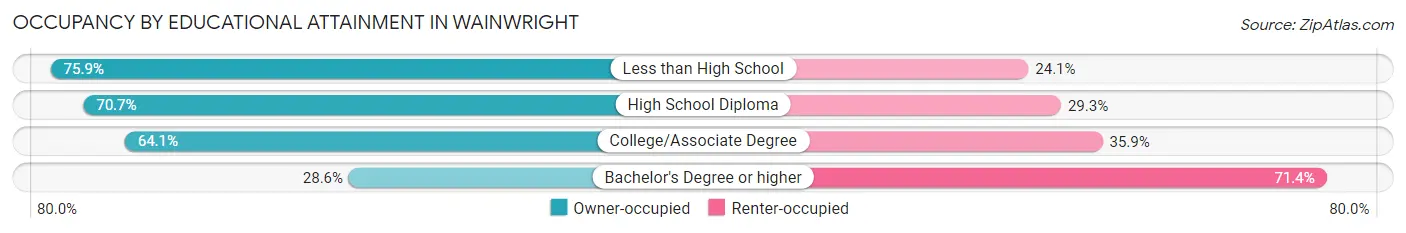
| Household Size | Owner-occupied | Renter-occupied |
| Less than High School | 22 (75.9%) | 7 (24.1%) |
| High School Diploma | 41 (70.7%) | 17 (29.3%) |
| College/Associate Degree | 25 (64.1%) | 14 (35.9%) |
| Bachelor's Degree or higher | 4 (28.6%) | 10 (71.4%) |
Occupancy by Age of Householder in Wainwright
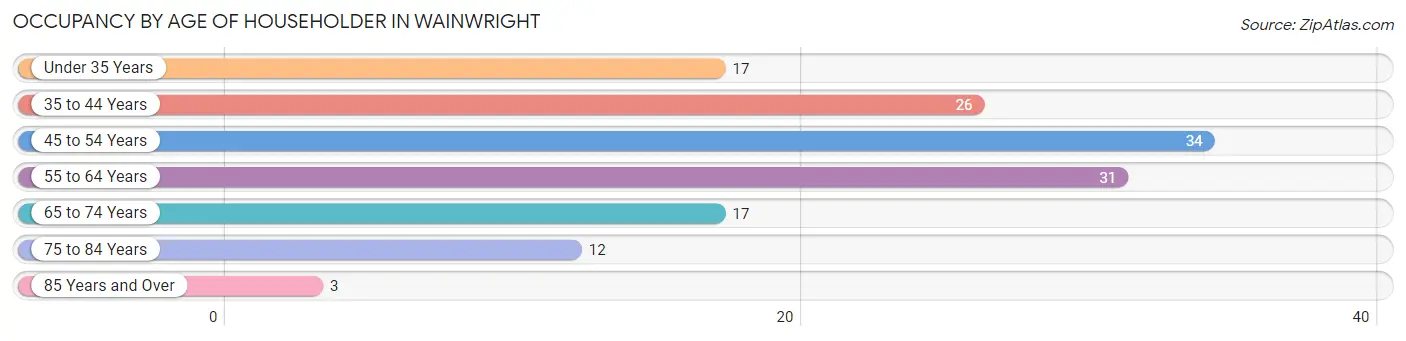
| Age Bracket | # Households | % Households |
| Under 35 Years | 17 | 12.1% |
| 35 to 44 Years | 26 | 18.6% |
| 45 to 54 Years | 34 | 24.3% |
| 55 to 64 Years | 31 | 22.1% |
| 65 to 74 Years | 17 | 12.1% |
| 75 to 84 Years | 12 | 8.6% |
| 85 Years and Over | 3 | 2.1% |
| Total | 140 | 100.0% |
Housing Finances in Wainwright
Median Income by Occupancy in Wainwright
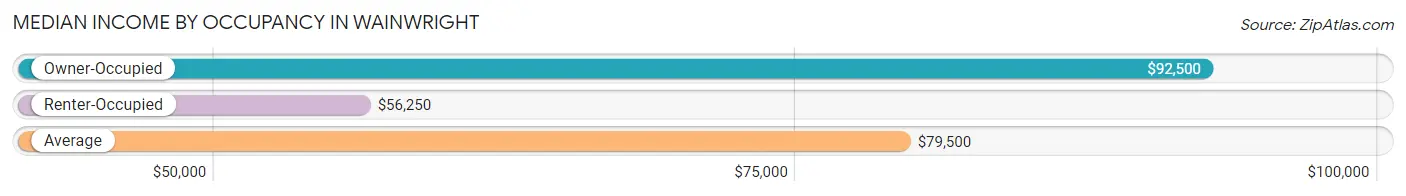
| Occupancy Type | # Households | Median Income |
| Owner-Occupied | 92 (65.7%) | $92,500 |
| Renter-Occupied | 48 (34.3%) | $56,250 |
| Average | 140 (100.0%) | $79,500 |
Occupancy by Householder Income Bracket in Wainwright
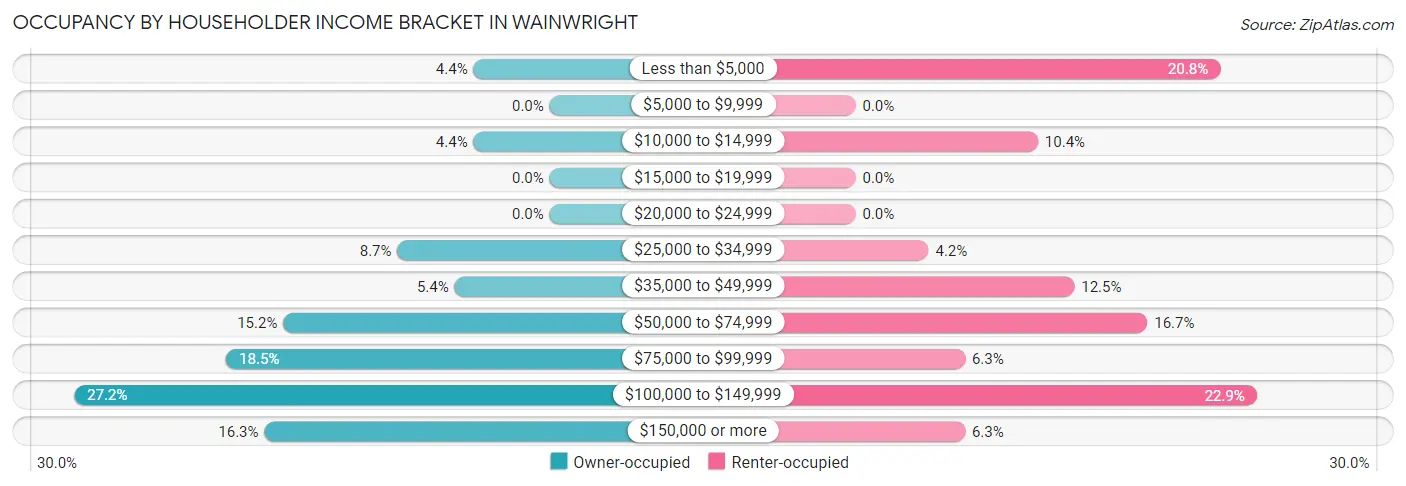
| Income Bracket | Owner-occupied | Renter-occupied |
| Less than $5,000 | 4 (4.3%) | 10 (20.8%) |
| $5,000 to $9,999 | 0 (0.0%) | 0 (0.0%) |
| $10,000 to $14,999 | 4 (4.3%) | 5 (10.4%) |
| $15,000 to $19,999 | 0 (0.0%) | 0 (0.0%) |
| $20,000 to $24,999 | 0 (0.0%) | 0 (0.0%) |
| $25,000 to $34,999 | 8 (8.7%) | 2 (4.2%) |
| $35,000 to $49,999 | 5 (5.4%) | 6 (12.5%) |
| $50,000 to $74,999 | 14 (15.2%) | 8 (16.7%) |
| $75,000 to $99,999 | 17 (18.5%) | 3 (6.2%) |
| $100,000 to $149,999 | 25 (27.2%) | 11 (22.9%) |
| $150,000 or more | 15 (16.3%) | 3 (6.2%) |
| Total | 92 (100.0%) | 48 (100.0%) |
Monthly Housing Cost Tiers in Wainwright
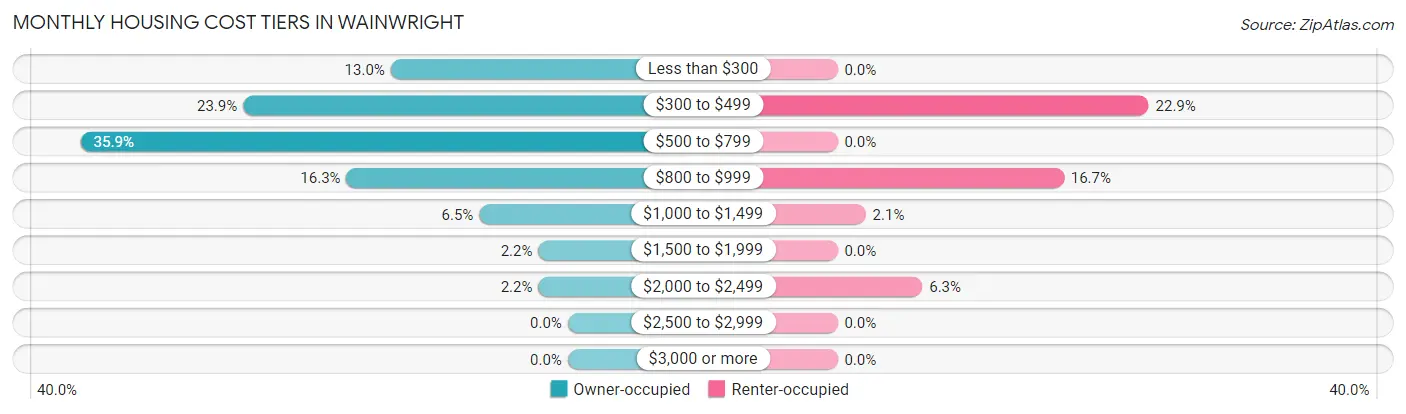
| Monthly Cost | Owner-occupied | Renter-occupied |
| Less than $300 | 12 (13.0%) | 0 (0.0%) |
| $300 to $499 | 22 (23.9%) | 11 (22.9%) |
| $500 to $799 | 33 (35.9%) | 0 (0.0%) |
| $800 to $999 | 15 (16.3%) | 8 (16.7%) |
| $1,000 to $1,499 | 6 (6.5%) | 1 (2.1%) |
| $1,500 to $1,999 | 2 (2.2%) | 0 (0.0%) |
| $2,000 to $2,499 | 2 (2.2%) | 3 (6.2%) |
| $2,500 to $2,999 | 0 (0.0%) | 0 (0.0%) |
| $3,000 or more | 0 (0.0%) | 0 (0.0%) |
| Total | 92 (100.0%) | 48 (100.0%) |
Physical Housing Characteristics in Wainwright
Housing Structures in Wainwright
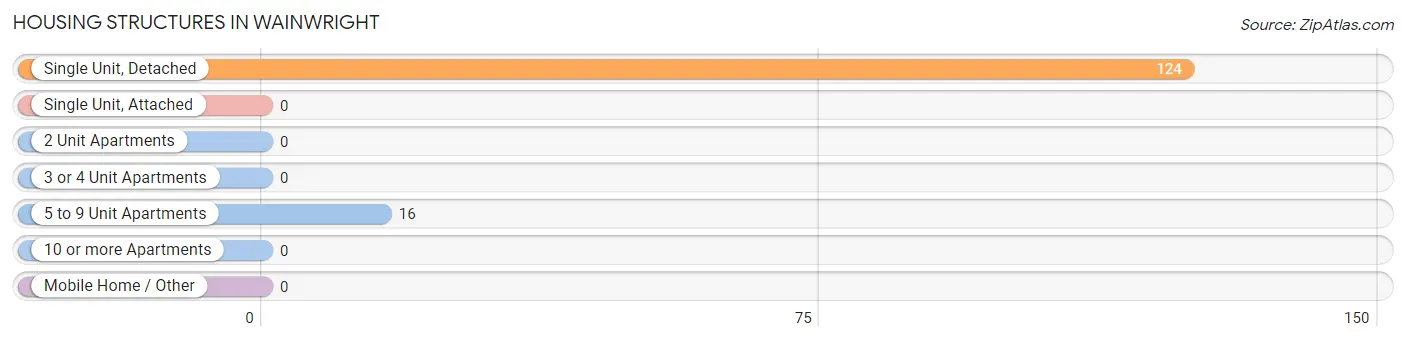
| Structure Type | # Housing Units | % Housing Units |
| Single Unit, Detached | 124 | 88.6% |
| Single Unit, Attached | 0 | 0.0% |
| 2 Unit Apartments | 0 | 0.0% |
| 3 or 4 Unit Apartments | 0 | 0.0% |
| 5 to 9 Unit Apartments | 16 | 11.4% |
| 10 or more Apartments | 0 | 0.0% |
| Mobile Home / Other | 0 | 0.0% |
| Total | 140 | 100.0% |
Housing Structures by Occupancy in Wainwright
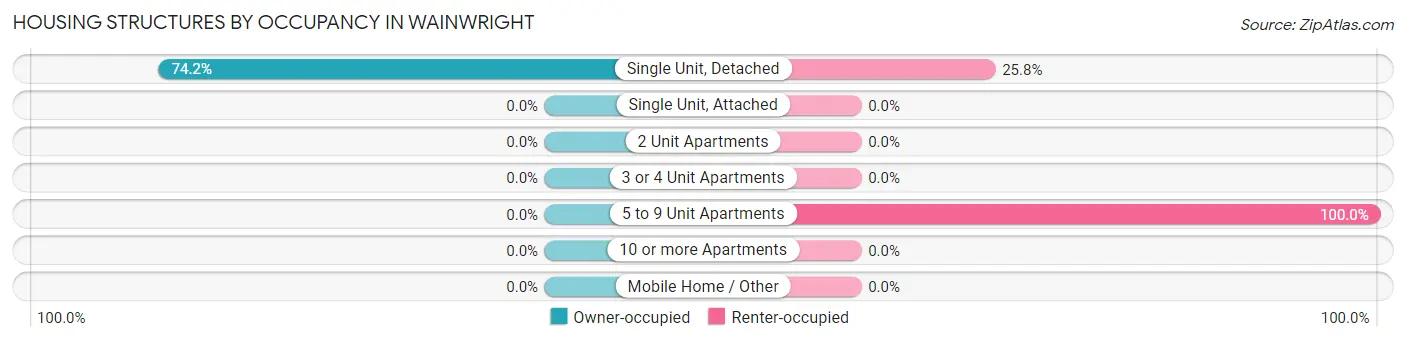
| Structure Type | Owner-occupied | Renter-occupied |
| Single Unit, Detached | 92 (74.2%) | 32 (25.8%) |
| Single Unit, Attached | 0 (0.0%) | 0 (0.0%) |
| 2 Unit Apartments | 0 (0.0%) | 0 (0.0%) |
| 3 or 4 Unit Apartments | 0 (0.0%) | 0 (0.0%) |
| 5 to 9 Unit Apartments | 0 (0.0%) | 16 (100.0%) |
| 10 or more Apartments | 0 (0.0%) | 0 (0.0%) |
| Mobile Home / Other | 0 (0.0%) | 0 (0.0%) |
| Total | 92 (65.7%) | 48 (34.3%) |
Housing Structures by Number of Rooms in Wainwright
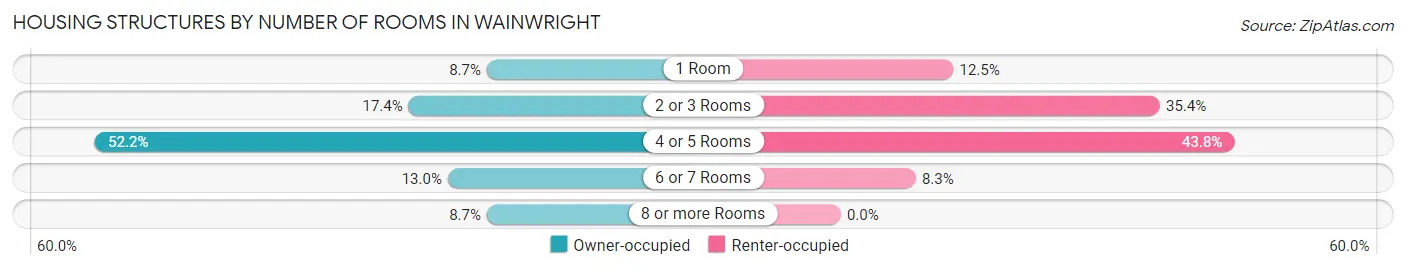
| Number of Rooms | Owner-occupied | Renter-occupied |
| 1 Room | 8 (8.7%) | 6 (12.5%) |
| 2 or 3 Rooms | 16 (17.4%) | 17 (35.4%) |
| 4 or 5 Rooms | 48 (52.2%) | 21 (43.8%) |
| 6 or 7 Rooms | 12 (13.0%) | 4 (8.3%) |
| 8 or more Rooms | 8 (8.7%) | 0 (0.0%) |
| Total | 92 (100.0%) | 48 (100.0%) |
Housing Structure by Heating Type in Wainwright
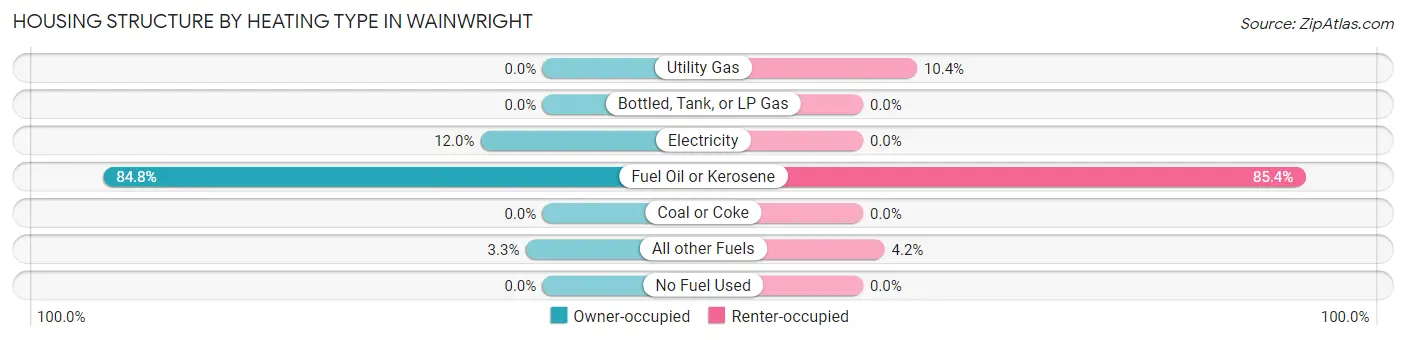
| Heating Type | Owner-occupied | Renter-occupied |
| Utility Gas | 0 (0.0%) | 5 (10.4%) |
| Bottled, Tank, or LP Gas | 0 (0.0%) | 0 (0.0%) |
| Electricity | 11 (12.0%) | 0 (0.0%) |
| Fuel Oil or Kerosene | 78 (84.8%) | 41 (85.4%) |
| Coal or Coke | 0 (0.0%) | 0 (0.0%) |
| All other Fuels | 3 (3.3%) | 2 (4.2%) |
| No Fuel Used | 0 (0.0%) | 0 (0.0%) |
| Total | 92 (100.0%) | 48 (100.0%) |
Household Vehicle Usage in Wainwright
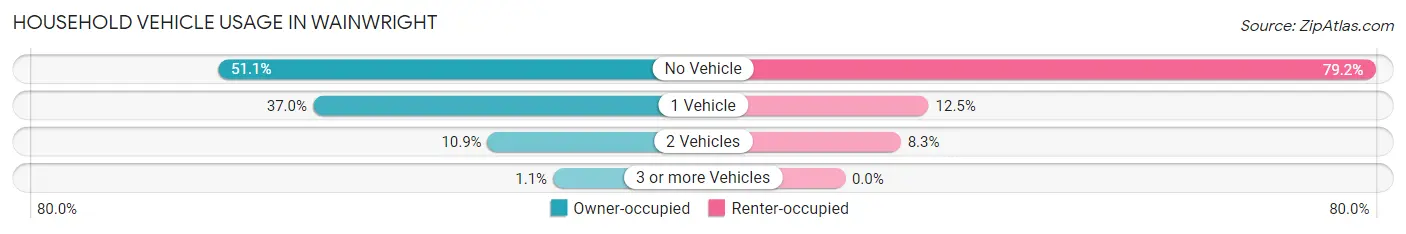
| Vehicles per Household | Owner-occupied | Renter-occupied |
| No Vehicle | 47 (51.1%) | 38 (79.2%) |
| 1 Vehicle | 34 (37.0%) | 6 (12.5%) |
| 2 Vehicles | 10 (10.9%) | 4 (8.3%) |
| 3 or more Vehicles | 1 (1.1%) | 0 (0.0%) |
| Total | 92 (100.0%) | 48 (100.0%) |
Real Estate & Mortgages in Wainwright
Real Estate and Mortgage Overview in Wainwright
| Characteristic | Without Mortgage | With Mortgage |
| Housing Units | 85 | 7 |
| Median Property Value | $99,300 | $0 |
| Median Household Income | $82,188 | $2 |
| Monthly Housing Costs | $585 | $0 |
| Real Estate Taxes | $1,500 | $2 |
Property Value by Mortgage Status in Wainwright
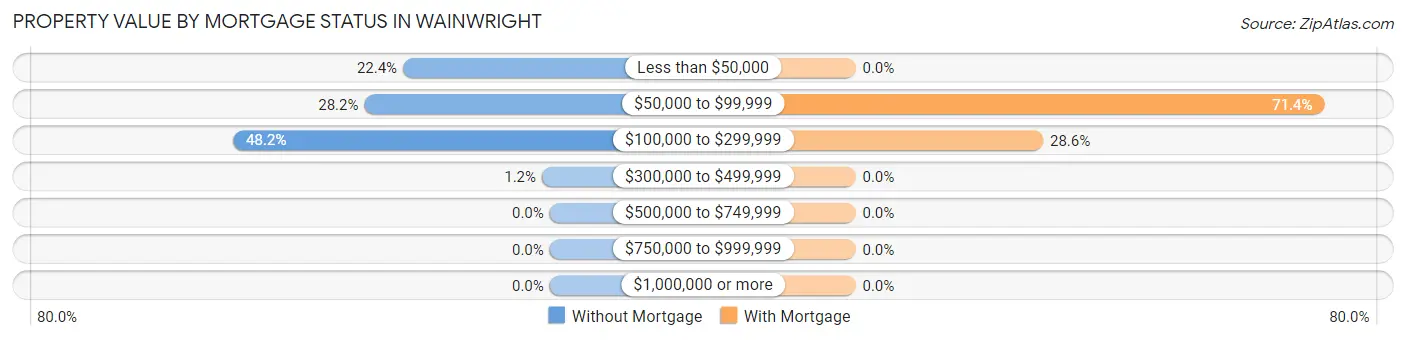
| Property Value | Without Mortgage | With Mortgage |
| Less than $50,000 | 19 (22.4%) | 0 (0.0%) |
| $50,000 to $99,999 | 24 (28.2%) | 5 (71.4%) |
| $100,000 to $299,999 | 41 (48.2%) | 2 (28.6%) |
| $300,000 to $499,999 | 1 (1.2%) | 0 (0.0%) |
| $500,000 to $749,999 | 0 (0.0%) | 0 (0.0%) |
| $750,000 to $999,999 | 0 (0.0%) | 0 (0.0%) |
| $1,000,000 or more | 0 (0.0%) | 0 (0.0%) |
| Total | 85 (100.0%) | 7 (100.0%) |
Household Income by Mortgage Status in Wainwright
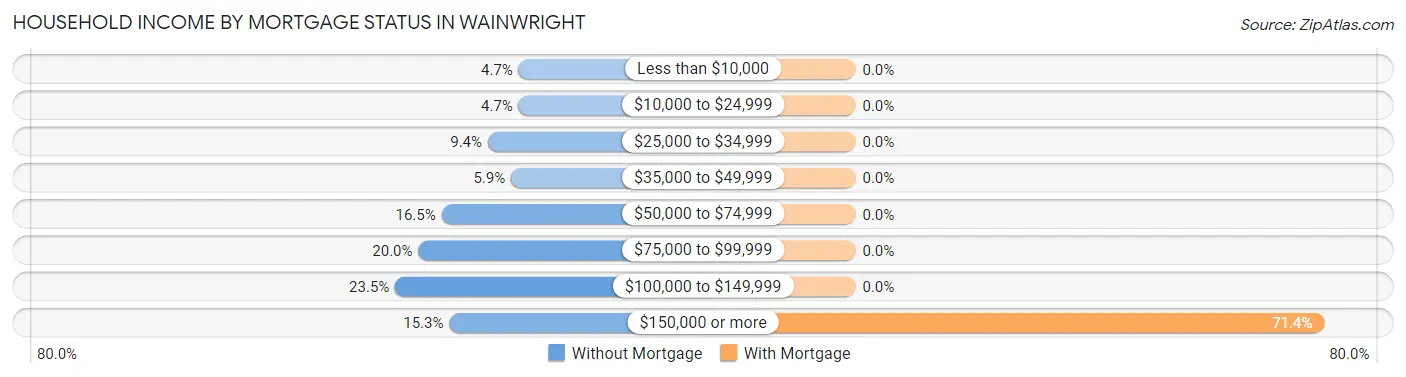
| Household Income | Without Mortgage | With Mortgage |
| Less than $10,000 | 4 (4.7%) | 0 (0.0%) |
| $10,000 to $24,999 | 4 (4.7%) | 0 (0.0%) |
| $25,000 to $34,999 | 8 (9.4%) | 0 (0.0%) |
| $35,000 to $49,999 | 5 (5.9%) | 0 (0.0%) |
| $50,000 to $74,999 | 14 (16.5%) | 0 (0.0%) |
| $75,000 to $99,999 | 17 (20.0%) | 0 (0.0%) |
| $100,000 to $149,999 | 20 (23.5%) | 0 (0.0%) |
| $150,000 or more | 13 (15.3%) | 5 (71.4%) |
| Total | 85 (100.0%) | 7 (100.0%) |
Property Value to Household Income Ratio in Wainwright
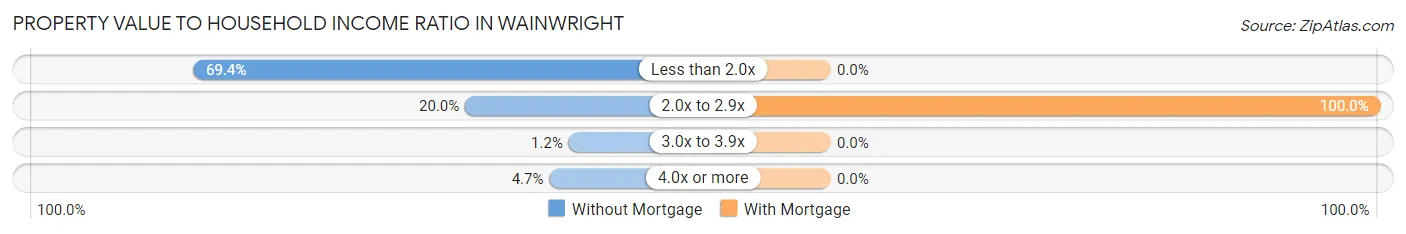
| Value-to-Income Ratio | Without Mortgage | With Mortgage |
| Less than 2.0x | 59 (69.4%) | 0 (0.0%) |
| 2.0x to 2.9x | 17 (20.0%) | 7 (100.0%) |
| 3.0x to 3.9x | 1 (1.2%) | 0 (0.0%) |
| 4.0x or more | 4 (4.7%) | 0 (0.0%) |
| Total | 85 (100.0%) | 7 (100.0%) |
Real Estate Taxes by Mortgage Status in Wainwright
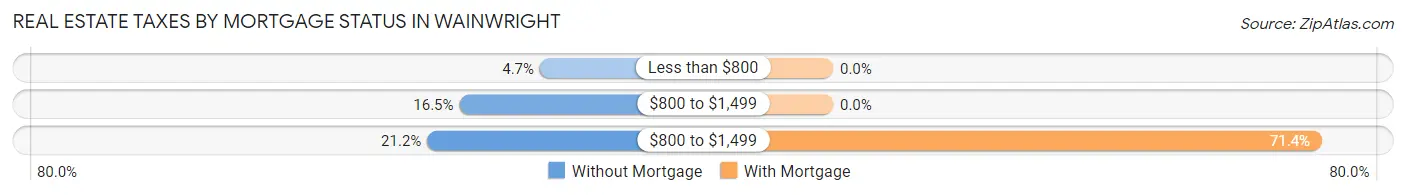
| Property Taxes | Without Mortgage | With Mortgage |
| Less than $800 | 4 (4.7%) | 0 (0.0%) |
| $800 to $1,499 | 14 (16.5%) | 0 (0.0%) |
| $800 to $1,499 | 18 (21.2%) | 5 (71.4%) |
| Total | 85 (100.0%) | 7 (100.0%) |
Health & Disability in Wainwright
Health Insurance Coverage by Age in Wainwright
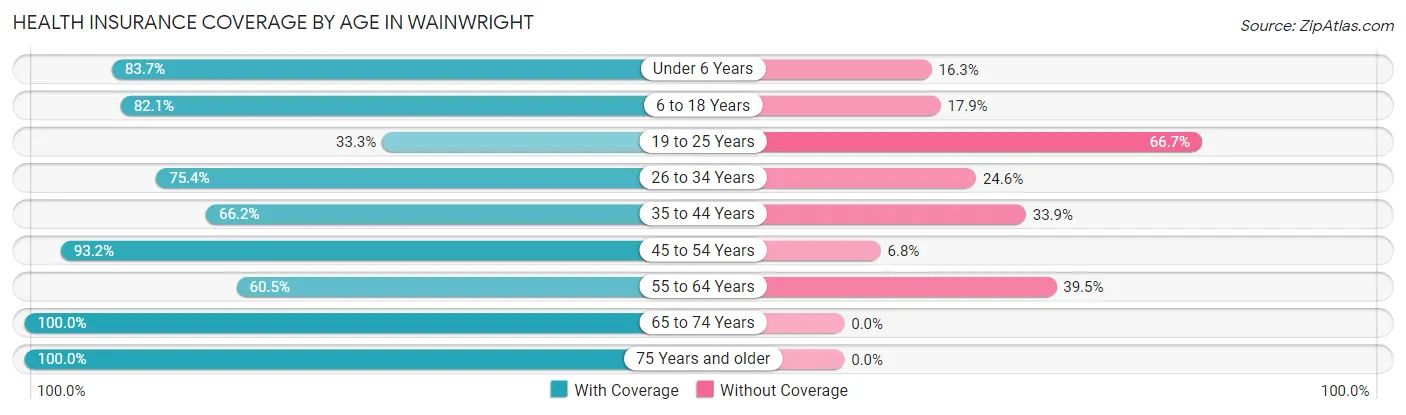
| Age Bracket | With Coverage | Without Coverage |
| Under 6 Years | 36 (83.7%) | 7 (16.3%) |
| 6 to 18 Years | 119 (82.1%) | 26 (17.9%) |
| 19 to 25 Years | 9 (33.3%) | 18 (66.7%) |
| 26 to 34 Years | 43 (75.4%) | 14 (24.6%) |
| 35 to 44 Years | 43 (66.1%) | 22 (33.9%) |
| 45 to 54 Years | 179 (93.2%) | 13 (6.8%) |
| 55 to 64 Years | 26 (60.5%) | 17 (39.5%) |
| 65 to 74 Years | 31 (100.0%) | 0 (0.0%) |
| 75 Years and older | 18 (100.0%) | 0 (0.0%) |
| Total | 504 (81.2%) | 117 (18.8%) |
Health Insurance Coverage by Citizenship Status in Wainwright

| Citizenship Status | With Coverage | Without Coverage |
| Native Born | 36 (83.7%) | 7 (16.3%) |
| Foreign Born, Citizen | 119 (82.1%) | 26 (17.9%) |
| Foreign Born, not a Citizen | 9 (33.3%) | 18 (66.7%) |
Health Insurance Coverage by Household Income in Wainwright
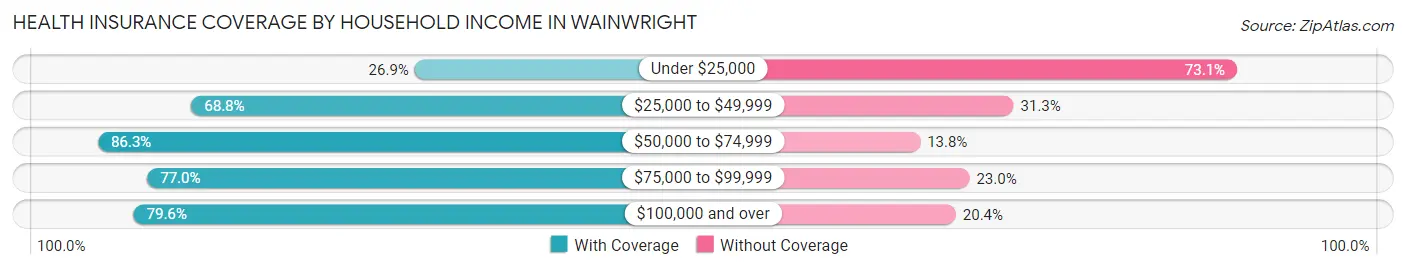
| Household Income | With Coverage | Without Coverage |
| Under $25,000 | 7 (26.9%) | 19 (73.1%) |
| $25,000 to $49,999 | 44 (68.8%) | 20 (31.2%) |
| $50,000 to $74,999 | 69 (86.3%) | 11 (13.8%) |
| $75,000 to $99,999 | 67 (77.0%) | 20 (23.0%) |
| $100,000 and over | 183 (79.6%) | 47 (20.4%) |
Public vs Private Health Insurance Coverage by Age in Wainwright
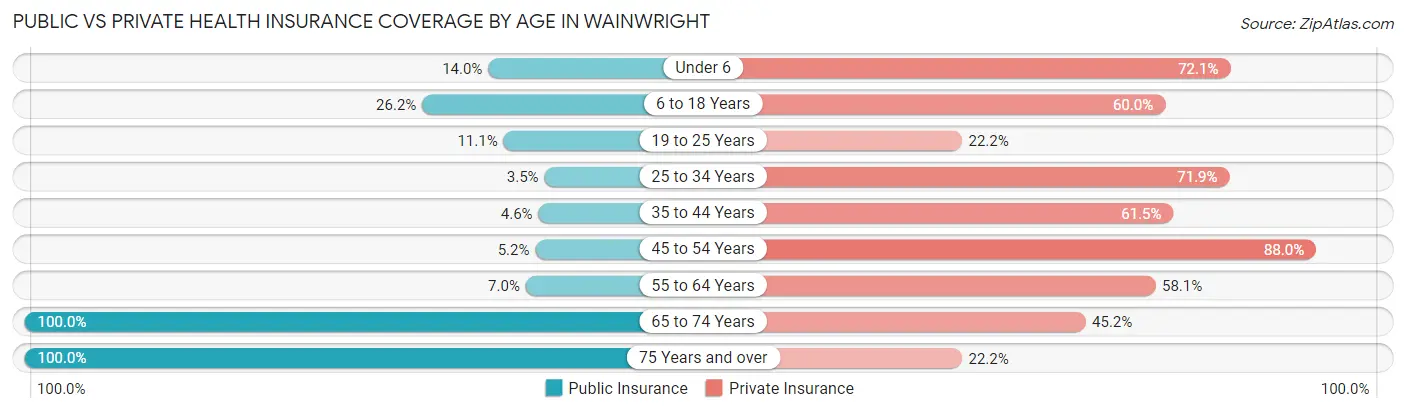
| Age Bracket | Public Insurance | Private Insurance |
| Under 6 | 6 (14.0%) | 31 (72.1%) |
| 6 to 18 Years | 38 (26.2%) | 87 (60.0%) |
| 19 to 25 Years | 3 (11.1%) | 6 (22.2%) |
| 25 to 34 Years | 2 (3.5%) | 41 (71.9%) |
| 35 to 44 Years | 3 (4.6%) | 40 (61.5%) |
| 45 to 54 Years | 10 (5.2%) | 169 (88.0%) |
| 55 to 64 Years | 3 (7.0%) | 25 (58.1%) |
| 65 to 74 Years | 31 (100.0%) | 14 (45.2%) |
| 75 Years and over | 18 (100.0%) | 4 (22.2%) |
| Total | 114 (18.4%) | 417 (67.1%) |
Disability Status by Sex by Age in Wainwright
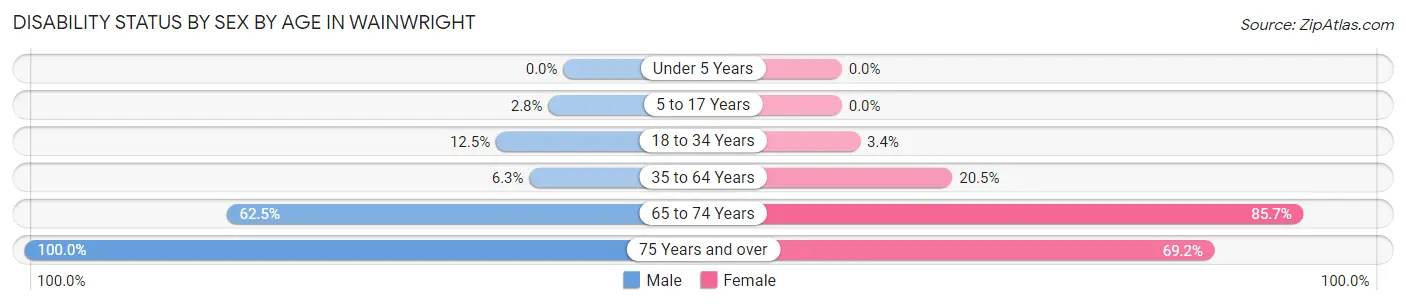
| Age Bracket | Male | Female |
| Under 5 Years | 0 (0.0%) | 0 (0.0%) |
| 5 to 17 Years | 2 (2.8%) | 0 (0.0%) |
| 18 to 34 Years | 5 (12.5%) | 2 (3.4%) |
| 35 to 64 Years | 14 (6.3%) | 16 (20.5%) |
| 65 to 74 Years | 15 (62.5%) | 6 (85.7%) |
| 75 Years and over | 5 (100.0%) | 9 (69.2%) |
Disability Class by Sex by Age in Wainwright
Disability Class: Hearing Difficulty
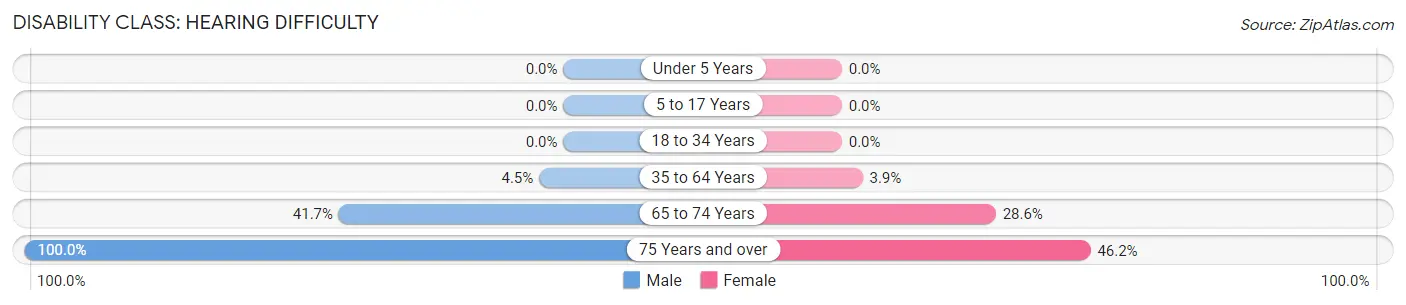
| Age Bracket | Male | Female |
| Under 5 Years | 0 (0.0%) | 0 (0.0%) |
| 5 to 17 Years | 0 (0.0%) | 0 (0.0%) |
| 18 to 34 Years | 0 (0.0%) | 0 (0.0%) |
| 35 to 64 Years | 10 (4.5%) | 3 (3.8%) |
| 65 to 74 Years | 10 (41.7%) | 2 (28.6%) |
| 75 Years and over | 5 (100.0%) | 6 (46.2%) |
Disability Class: Vision Difficulty
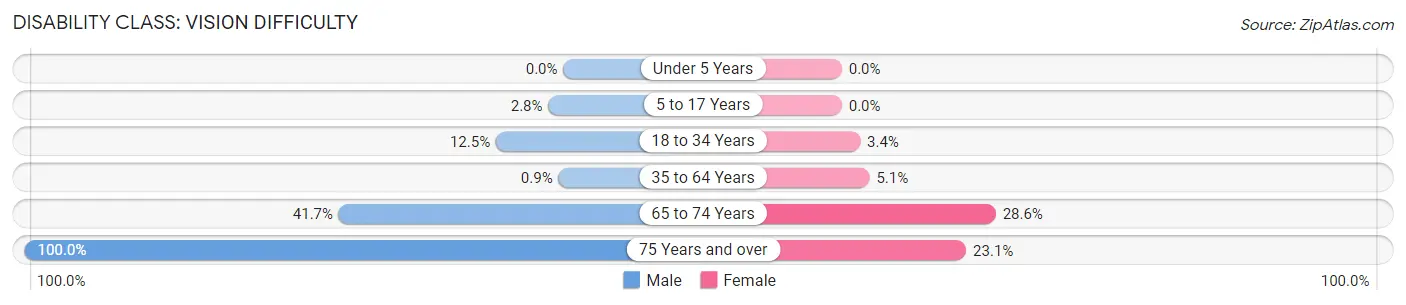
| Age Bracket | Male | Female |
| Under 5 Years | 0 (0.0%) | 0 (0.0%) |
| 5 to 17 Years | 2 (2.8%) | 0 (0.0%) |
| 18 to 34 Years | 5 (12.5%) | 2 (3.4%) |
| 35 to 64 Years | 2 (0.9%) | 4 (5.1%) |
| 65 to 74 Years | 10 (41.7%) | 2 (28.6%) |
| 75 Years and over | 5 (100.0%) | 3 (23.1%) |
Disability Class: Cognitive Difficulty

| Age Bracket | Male | Female |
| 5 to 17 Years | 0 (0.0%) | 0 (0.0%) |
| 18 to 34 Years | 0 (0.0%) | 0 (0.0%) |
| 35 to 64 Years | 2 (0.9%) | 1 (1.3%) |
| 65 to 74 Years | 0 (0.0%) | 6 (85.7%) |
| 75 Years and over | 0 (0.0%) | 6 (46.2%) |
Disability Class: Ambulatory Difficulty
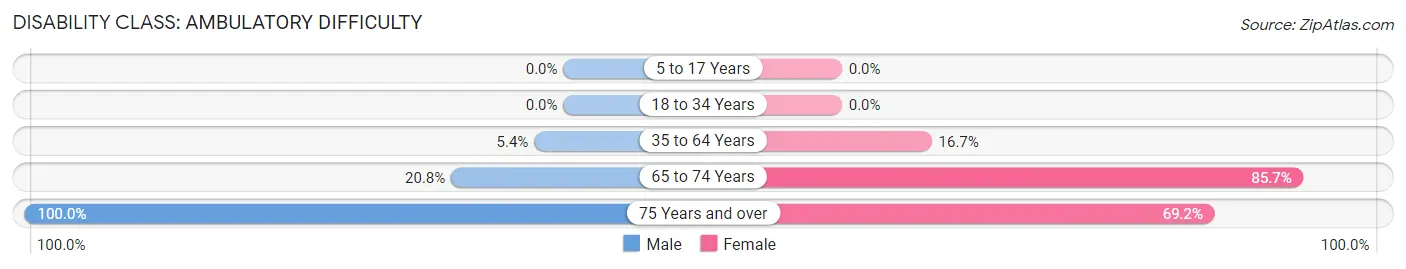
| Age Bracket | Male | Female |
| 5 to 17 Years | 0 (0.0%) | 0 (0.0%) |
| 18 to 34 Years | 0 (0.0%) | 0 (0.0%) |
| 35 to 64 Years | 12 (5.4%) | 13 (16.7%) |
| 65 to 74 Years | 5 (20.8%) | 6 (85.7%) |
| 75 Years and over | 5 (100.0%) | 9 (69.2%) |
Disability Class: Self-Care Difficulty
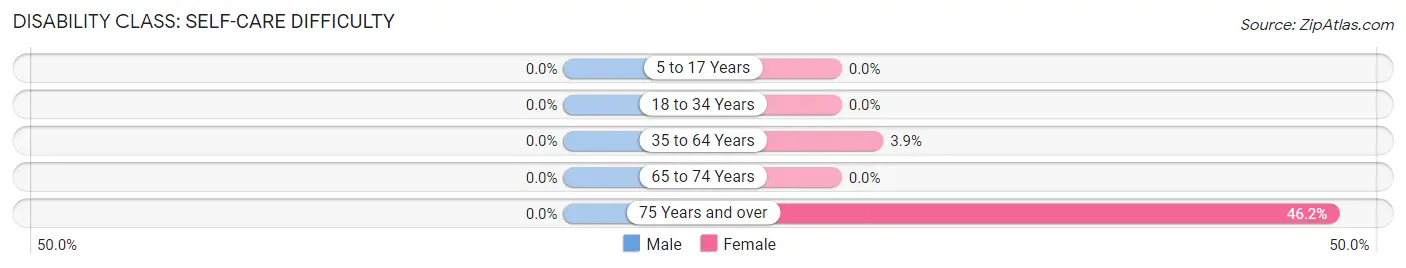
| Age Bracket | Male | Female |
| 5 to 17 Years | 0 (0.0%) | 0 (0.0%) |
| 18 to 34 Years | 0 (0.0%) | 0 (0.0%) |
| 35 to 64 Years | 0 (0.0%) | 3 (3.8%) |
| 65 to 74 Years | 0 (0.0%) | 0 (0.0%) |
| 75 Years and over | 0 (0.0%) | 6 (46.2%) |
Technology Access in Wainwright
Computing Device Access in Wainwright
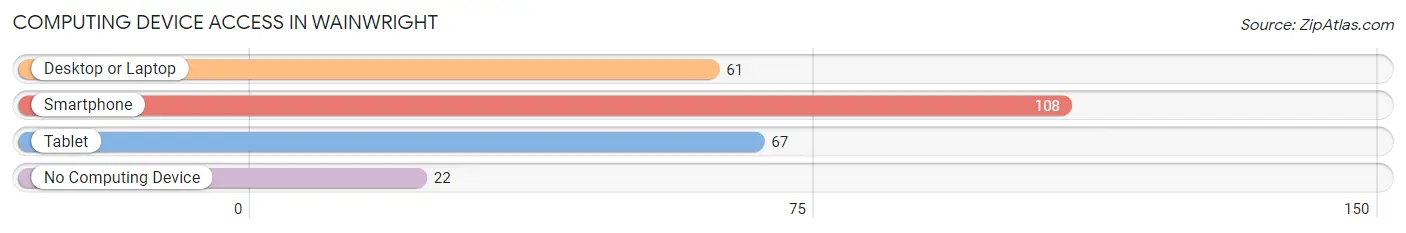
| Device Type | # Households | % Households |
| Desktop or Laptop | 61 | 43.6% |
| Smartphone | 108 | 77.1% |
| Tablet | 67 | 47.9% |
| No Computing Device | 22 | 15.7% |
| Total | 140 | 100.0% |
Internet Access in Wainwright
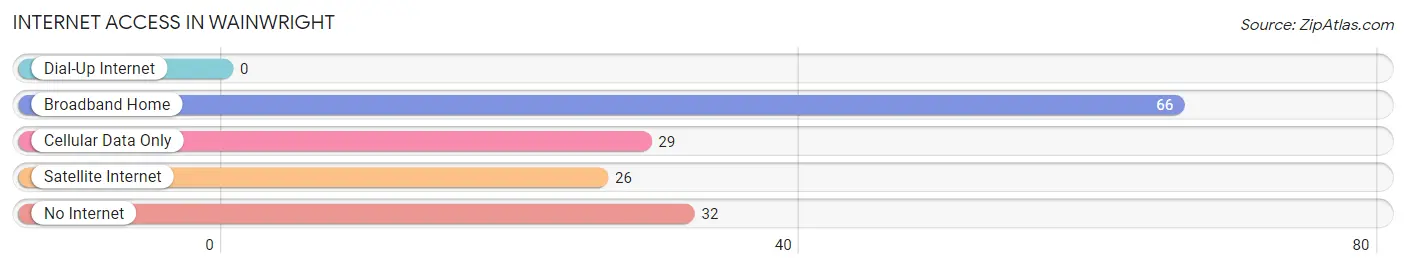
| Internet Type | # Households | % Households |
| Dial-Up Internet | 0 | 0.0% |
| Broadband Home | 66 | 47.1% |
| Cellular Data Only | 29 | 20.7% |
| Satellite Internet | 26 | 18.6% |
| No Internet | 32 | 22.9% |
| Total | 140 | 100.0% |
Wainwright Summary
Wainwright, Alaska is a small city located in the North Slope Borough of Alaska. It is situated on the Chukchi Sea coast, approximately 25 miles east of Barrow, the largest city in the North Slope Borough. Wainwright is the second largest city in the borough, with a population of approximately 1,000 people.
History
The area that is now Wainwright has been inhabited by the Inupiat people for thousands of years. The first recorded contact with Europeans was in 1778, when the British explorer Captain James Cook visited the area. In 1826, the Russian-American Company established a trading post in the area, which was later abandoned in 1867.
In 1881, the United States purchased Alaska from Russia, and the area was incorporated into the newly formed Alaska Territory. In the early 1900s, the area was settled by whalers and fur traders, and in 1915, the first school was established in Wainwright.
In the 1950s, the United States military began to build a radar station in Wainwright, which was completed in 1957. The station was used to monitor Soviet missile tests during the Cold War. In the 1970s, the military began to reduce its presence in the area, and the station was closed in 1975.
Geography
Wainwright is located on the Chukchi Sea coast, approximately 25 miles east of Barrow. The city is situated on a small peninsula, surrounded by the Chukchi Sea to the north and the Wainwright Lagoon to the south. The terrain is mostly flat, with some low hills in the area. The climate is subarctic, with cold winters and mild summers.
Economy
The economy of Wainwright is largely based on subsistence hunting and fishing. The city is home to several fish processing plants, which provide employment for many of the residents. The city also has a small tourism industry, with visitors coming to experience the unique culture and wildlife of the area.
The city is also home to a military base, which provides employment for many of the residents. The base is used for training exercises and is also home to a radar station.
Demographics
As of the 2010 census, Wainwright had a population of 1,000 people. The racial makeup of the city was 95.2% Native American, 2.2% White, 0.7% Asian, and 1.9% from other races. The median household income was $45,000, and the median age was 33.
Conclusion
Wainwright, Alaska is a small city located in the North Slope Borough of Alaska. It has a population of approximately 1,000 people, and the economy is largely based on subsistence hunting and fishing. The city is also home to a military base, which provides employment for many of the residents. The city has a unique culture and wildlife, and is a popular destination for tourists.
Common Questions
What is Per Capita Income in Wainwright?
Per Capita income in Wainwright is $68,028.
What is the Median Family Income in Wainwright?
Median Family Income in Wainwright is $90,833.
What is the Median Household income in Wainwright?
Median Household Income in Wainwright is $79,500.
What is Inequality or Gini Index in Wainwright?
Inequality or Gini Index in Wainwright is 0.42.
What is the Total Population of Wainwright?
Total Population of Wainwright is 621.
What is the Total Male Population of Wainwright?
Total Male Population of Wainwright is 373.
What is the Total Female Population of Wainwright?
Total Female Population of Wainwright is 248.
What is the Ratio of Males per 100 Females in Wainwright?
There are 150.40 Males per 100 Females in Wainwright.
What is the Ratio of Females per 100 Males in Wainwright?
There are 66.49 Females per 100 Males in Wainwright.
What is the Median Population Age in Wainwright?
Median Population Age in Wainwright is 40.8 Years.
What is the Average Family Size in Wainwright
Average Family Size in Wainwright is 3.9 People.
What is the Average Household Size in Wainwright
Average Household Size in Wainwright is 3.5 People.
How Large is the Labor Force in Wainwright?
There are 323 People in the Labor Forcein in Wainwright.
What is the Percentage of People in the Labor Force in Wainwright?
69.0% of People are in the Labor Force in Wainwright.
What is the Unemployment Rate in Wainwright?
Unemployment Rate in Wainwright is 8.0%.