Silver Springs, AK Map & Demographics
Silver Springs Map
Silver Springs Overview
$67,402
PER CAPITA INCOME
$125,938
AVG FAMILY INCOME
$125,938
AVG HOUSEHOLD INCOME
33.4%
WAGE / INCOME GAP [ % ]
66.6¢/ $1
WAGE / INCOME GAP [ $ ]
0.35
INEQUALITY / GINI INDEX
106
TOTAL POPULATION
64
MALE POPULATION
42
FEMALE POPULATION
152.38
MALES / 100 FEMALES
65.62
FEMALES / 100 MALES
55.8
MEDIAN AGE
2.4
AVG FAMILY SIZE
2.4
AVG HOUSEHOLD SIZE
67
LABOR FORCE [ PEOPLE ]
70.5%
PERCENT IN LABOR FORCE
Income in Silver Springs
Income Overview in Silver Springs
Per Capita Income in Silver Springs is $67,402, while median incomes of families and households are $125,938 and $125,938 respectively.
| Characteristic | Number | Measure |
| Per Capita Income | 106 | $67,402 |
| Median Family Income | 45 | $125,938 |
| Mean Family Income | 45 | $141,860 |
| Median Household Income | 45 | $125,938 |
| Mean Household Income | 45 | $141,860 |
| Income Deficit | 45 | $0 |
| Wage / Income Gap (%) | 106 | 33.43% |
| Wage / Income Gap ($) | 106 | 66.57¢ per $1 |
| Gini / Inequality Index | 106 | 0.35 |
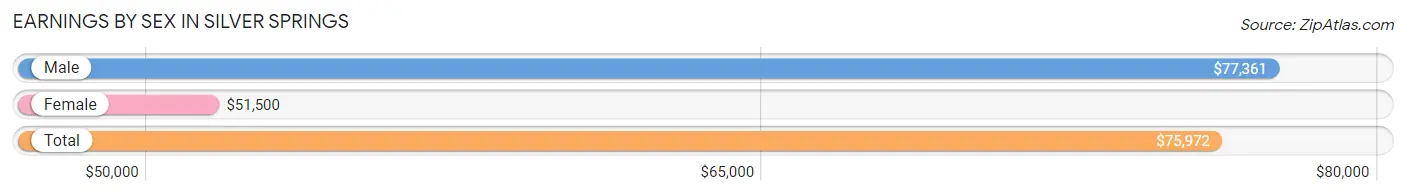
Earnings by Sex in Silver Springs
Average Earnings in Silver Springs are $75,972, $77,361 for men and $51,500 for women, a difference of 33.4%.
| Sex | Number | Average Earnings |
| Male | 47 (70.2%) | $77,361 |
| Female | 20 (29.8%) | $51,500 |
| Total | 67 (100.0%) | $75,972 |
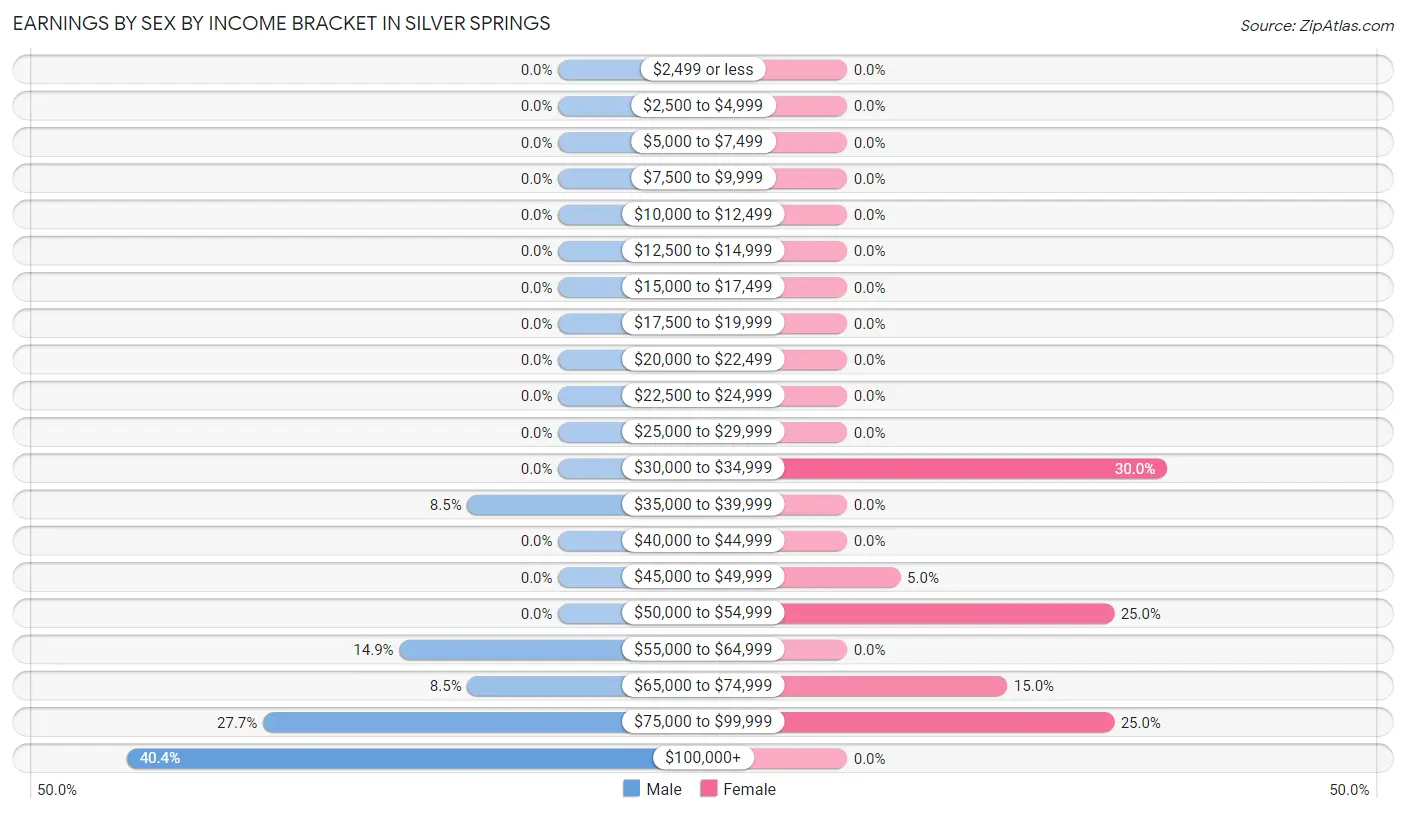
Earnings by Sex by Income Bracket in Silver Springs
The most common earnings brackets in Silver Springs are $100,000+ for men (19 | 40.4%) and $30,000 to $34,999 for women (6 | 30.0%).
| Income | Male | Female |
| $2,499 or less | 0 (0.0%) | 0 (0.0%) |
| $2,500 to $4,999 | 0 (0.0%) | 0 (0.0%) |
| $5,000 to $7,499 | 0 (0.0%) | 0 (0.0%) |
| $7,500 to $9,999 | 0 (0.0%) | 0 (0.0%) |
| $10,000 to $12,499 | 0 (0.0%) | 0 (0.0%) |
| $12,500 to $14,999 | 0 (0.0%) | 0 (0.0%) |
| $15,000 to $17,499 | 0 (0.0%) | 0 (0.0%) |
| $17,500 to $19,999 | 0 (0.0%) | 0 (0.0%) |
| $20,000 to $22,499 | 0 (0.0%) | 0 (0.0%) |
| $22,500 to $24,999 | 0 (0.0%) | 0 (0.0%) |
| $25,000 to $29,999 | 0 (0.0%) | 0 (0.0%) |
| $30,000 to $34,999 | 0 (0.0%) | 6 (30.0%) |
| $35,000 to $39,999 | 4 (8.5%) | 0 (0.0%) |
| $40,000 to $44,999 | 0 (0.0%) | 0 (0.0%) |
| $45,000 to $49,999 | 0 (0.0%) | 1 (5.0%) |
| $50,000 to $54,999 | 0 (0.0%) | 5 (25.0%) |
| $55,000 to $64,999 | 7 (14.9%) | 0 (0.0%) |
| $65,000 to $74,999 | 4 (8.5%) | 3 (15.0%) |
| $75,000 to $99,999 | 13 (27.7%) | 5 (25.0%) |
| $100,000+ | 19 (40.4%) | 0 (0.0%) |
| Total | 47 (100.0%) | 20 (100.0%) |
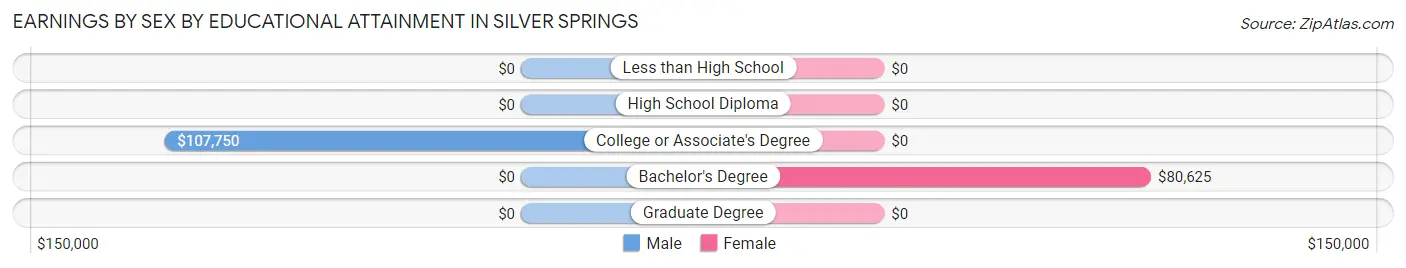
Earnings by Sex by Educational Attainment in Silver Springs
Average earnings in Silver Springs are $85,938 for men and $68,333 for women, a difference of 20.5%. Men with an educational attainment of college or associate's degree enjoy the highest average annual earnings of $107,750, while those with college or associate's degree education earn the least with $107,750. Women with an educational attainment of bachelor's degree earn the most with the average annual earnings of $80,625, while those with bachelor's degree education have the smallest earnings of $80,625.
| Educational Attainment | Male Income | Female Income |
| Less than High School | - | - |
| High School Diploma | - | - |
| College or Associate's Degree | $107,750 | $0 |
| Bachelor's Degree | - | - |
| Graduate Degree | - | - |
| Total | $85,938 | $68,333 |
Family Income in Silver Springs
Family Income Brackets in Silver Springs
According to the Silver Springs family income data, there are 13 families falling into the $100,000 to $149,999 income range, which is the most common income bracket and makes up 28.9% of all families.
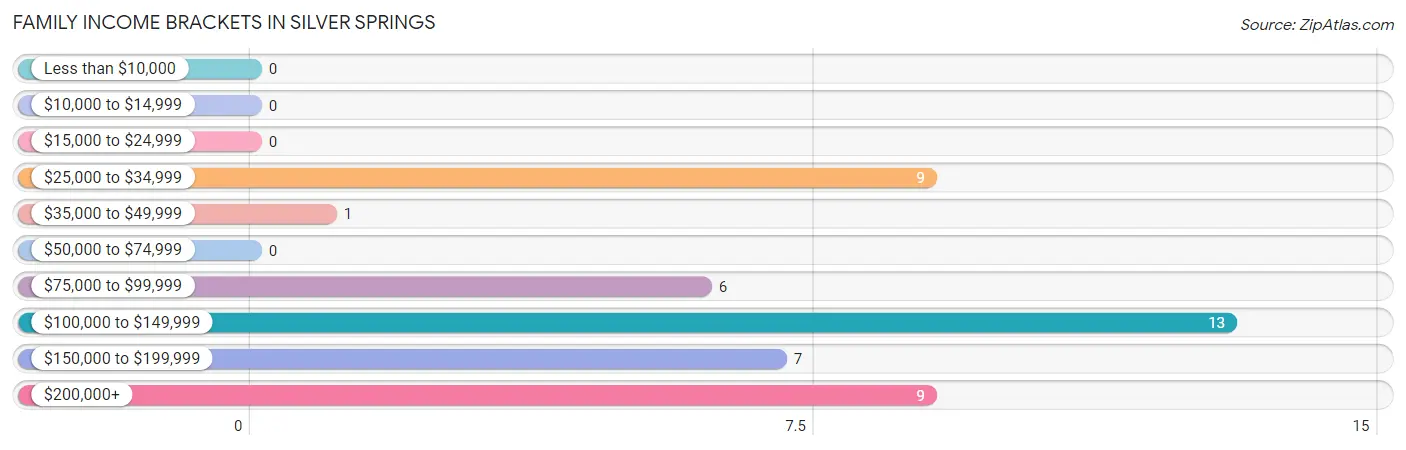
| Income Bracket | # Families | % Families |
| Less than $10,000 | 0 | 0.0% |
| $10,000 to $14,999 | 0 | 0.0% |
| $15,000 to $24,999 | 0 | 0.0% |
| $25,000 to $34,999 | 9 | 20.0% |
| $35,000 to $49,999 | 1 | 2.2% |
| $50,000 to $74,999 | 0 | 0.0% |
| $75,000 to $99,999 | 6 | 13.3% |
| $100,000 to $149,999 | 13 | 28.9% |
| $150,000 to $199,999 | 7 | 15.6% |
| $200,000+ | 9 | 20.0% |
Family Income by Famaliy Size in Silver Springs
2-person families (35 | 77.8%) account for the highest median family income in Silver Springs with $125,938 per family, while 2-person families (35 | 77.8%) have the highest median income of $62,969 per family member.
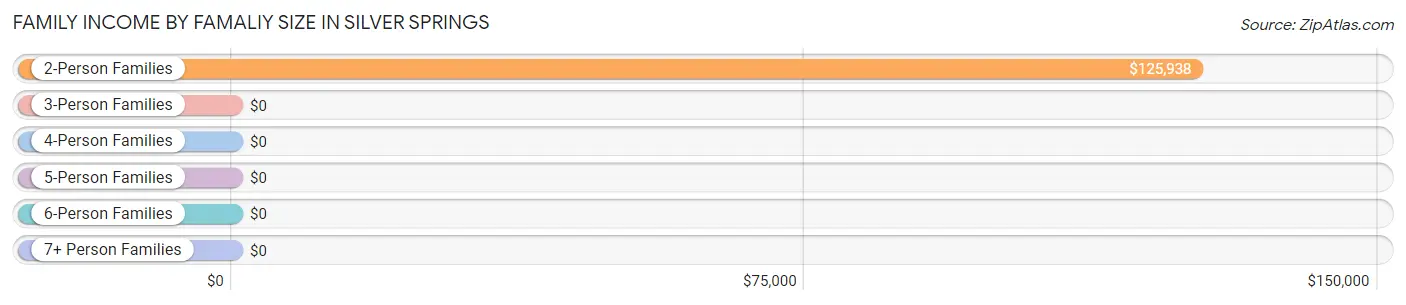
| Income Bracket | # Families | Median Income |
| 2-Person Families | 35 (77.8%) | $125,938 |
| 3-Person Families | 5 (11.1%) | $0 |
| 4-Person Families | 5 (11.1%) | $0 |
| 5-Person Families | 0 (0.0%) | $0 |
| 6-Person Families | 0 (0.0%) | $0 |
| 7+ Person Families | 0 (0.0%) | $0 |
| Total | 45 (100.0%) | $125,938 |
Family Income by Number of Earners in Silver Springs
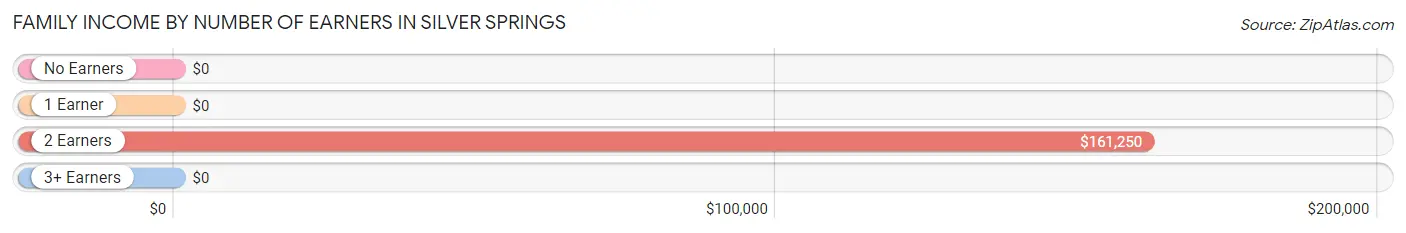
| Number of Earners | # Families | Median Income |
| No Earners | 5 (11.1%) | $0 |
| 1 Earner | 19 (42.2%) | $0 |
| 2 Earners | 21 (46.7%) | $161,250 |
| 3+ Earners | 0 (0.0%) | $0 |
| Total | 45 (100.0%) | $125,938 |
Household Income in Silver Springs
Household Income Brackets in Silver Springs
With 13 households falling in the category, the $100,000 to $149,999 income range is the most frequent in Silver Springs, accounting for 28.9% of all households.
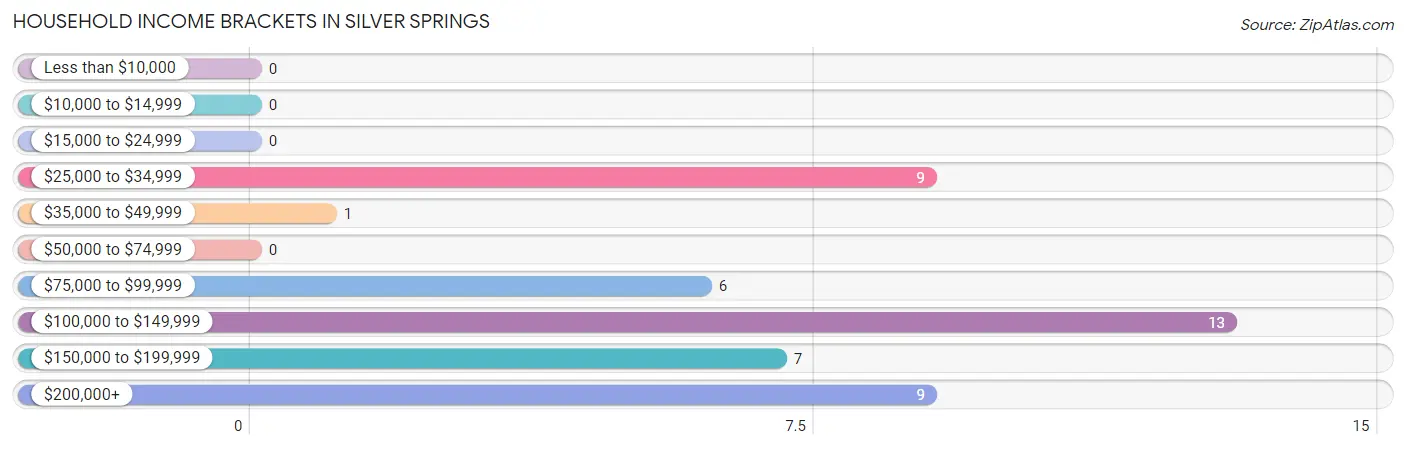
| Income Bracket | # Households | % Households |
| Less than $10,000 | 0 | 0.0% |
| $10,000 to $14,999 | 0 | 0.0% |
| $15,000 to $24,999 | 0 | 0.0% |
| $25,000 to $34,999 | 9 | 20.0% |
| $35,000 to $49,999 | 1 | 2.2% |
| $50,000 to $74,999 | 0 | 0.0% |
| $75,000 to $99,999 | 6 | 13.3% |
| $100,000 to $149,999 | 13 | 28.9% |
| $150,000 to $199,999 | 7 | 15.6% |
| $200,000+ | 9 | 20.0% |
Household Income by Householder Age in Silver Springs
The median household income in Silver Springs is $125,938, with the highest median household income of $160,417 found in the 45 to 64 years age bracket for the primary householder. A total of 31 households (68.9%) fall into this category. Meanwhile, the 15 to 24 years age bracket for the primary householder has the lowest median household income of $0, with 6 households (13.3%) in this group.
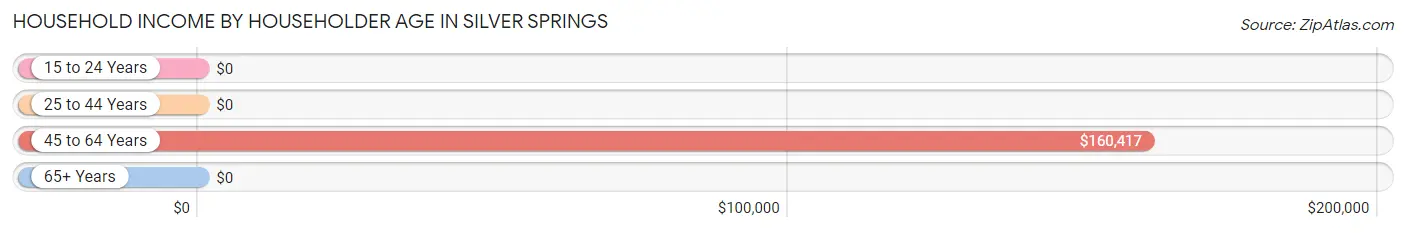
| Income Bracket | # Households | Median Income |
| 15 to 24 Years | 6 (13.3%) | $0 |
| 25 to 44 Years | 6 (13.3%) | $0 |
| 45 to 64 Years | 31 (68.9%) | $160,417 |
| 65+ Years | 2 (4.4%) | $0 |
| Total | 45 (100.0%) | $125,938 |
Poverty in Silver Springs
Income Below Poverty by Sex and Age in Silver Springs
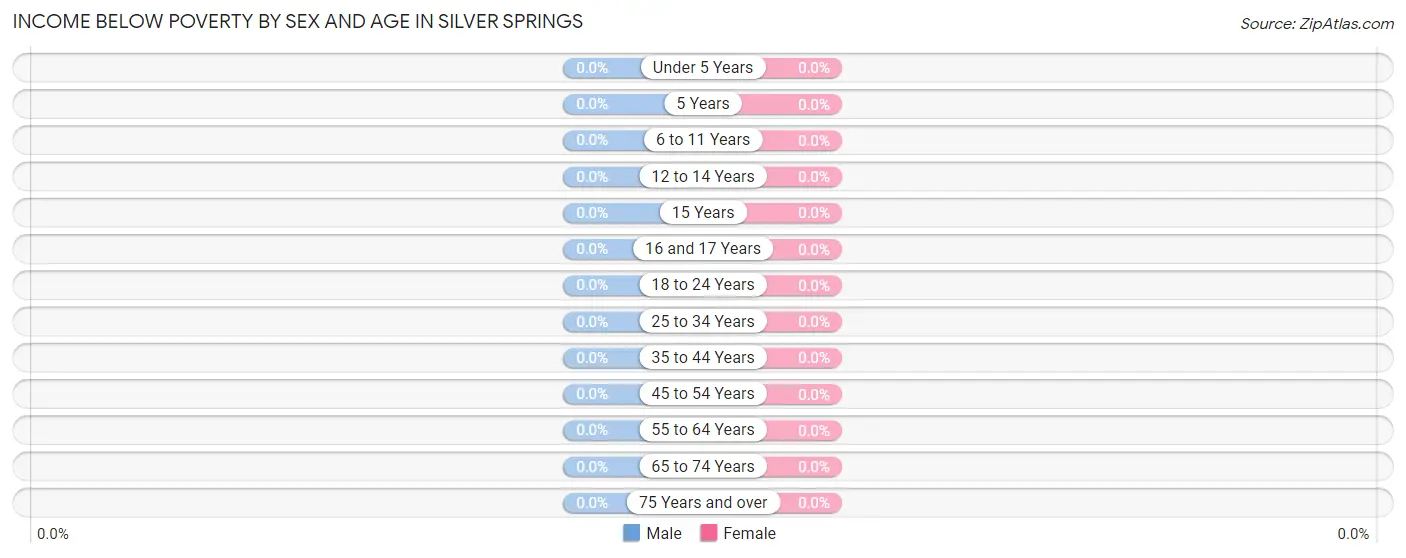
| Age Bracket | Male | Female |
| Under 5 Years | 0 (0.0%) | 0 (0.0%) |
| 5 Years | 0 (0.0%) | 0 (0.0%) |
| 6 to 11 Years | 0 (0.0%) | 0 (0.0%) |
| 12 to 14 Years | 0 (0.0%) | 0 (0.0%) |
| 15 Years | 0 (0.0%) | 0 (0.0%) |
| 16 and 17 Years | 0 (0.0%) | 0 (0.0%) |
| 18 to 24 Years | 0 (0.0%) | 0 (0.0%) |
| 25 to 34 Years | 0 (0.0%) | 0 (0.0%) |
| 35 to 44 Years | 0 (0.0%) | 0 (0.0%) |
| 45 to 54 Years | 0 (0.0%) | 0 (0.0%) |
| 55 to 64 Years | 0 (0.0%) | 0 (0.0%) |
| 65 to 74 Years | 0 (0.0%) | 0 (0.0%) |
| 75 Years and over | 0 (0.0%) | 0 (0.0%) |
| Total | 0 (0.0%) | 0 (0.0%) |
Income Above Poverty by Sex and Age in Silver Springs
According to the poverty statistics in Silver Springs, males aged under 5 years and females aged under 5 years are the age groups that are most secure financially, with 100.0% of males and 100.0% of females in these age groups living above the poverty line.
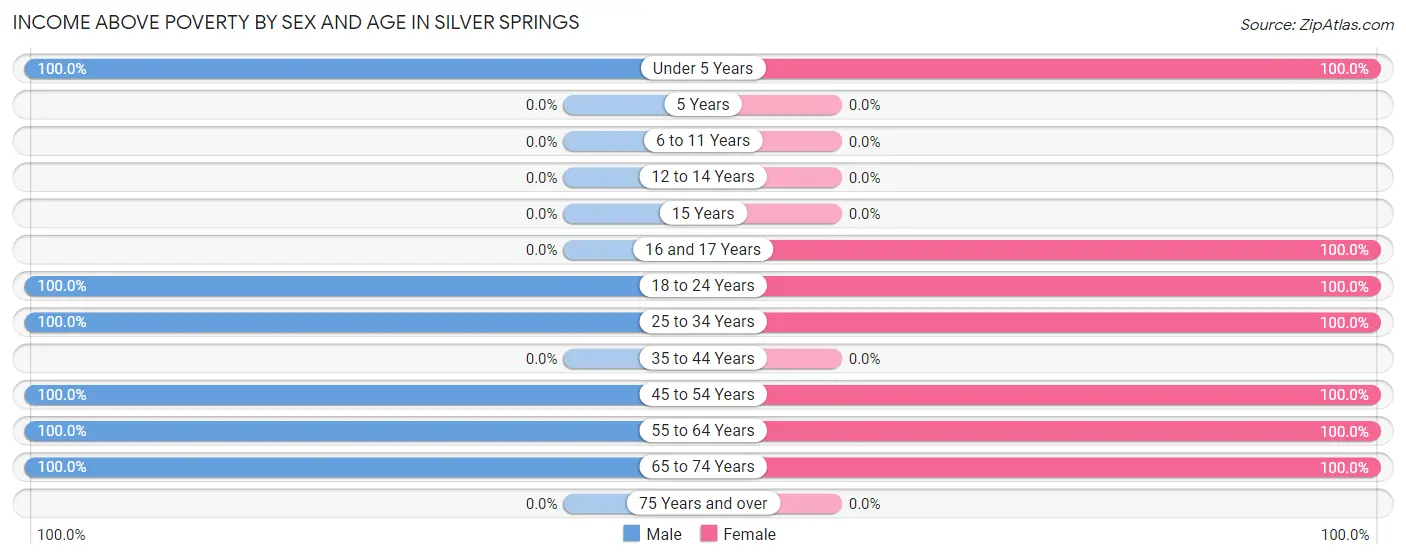
| Age Bracket | Male | Female |
| Under 5 Years | 5 (100.0%) | 6 (100.0%) |
| 5 Years | 0 (0.0%) | 0 (0.0%) |
| 6 to 11 Years | 0 (0.0%) | 0 (0.0%) |
| 12 to 14 Years | 0 (0.0%) | 0 (0.0%) |
| 15 Years | 0 (0.0%) | 0 (0.0%) |
| 16 and 17 Years | 0 (0.0%) | 2 (100.0%) |
| 18 to 24 Years | 4 (100.0%) | 6 (100.0%) |
| 25 to 34 Years | 9 (100.0%) | 6 (100.0%) |
| 35 to 44 Years | 0 (0.0%) | 0 (0.0%) |
| 45 to 54 Years | 5 (100.0%) | 7 (100.0%) |
| 55 to 64 Years | 37 (100.0%) | 13 (100.0%) |
| 65 to 74 Years | 4 (100.0%) | 2 (100.0%) |
| 75 Years and over | 0 (0.0%) | 0 (0.0%) |
| Total | 64 (100.0%) | 42 (100.0%) |
Income Below Poverty Among Married-Couple Families in Silver Springs
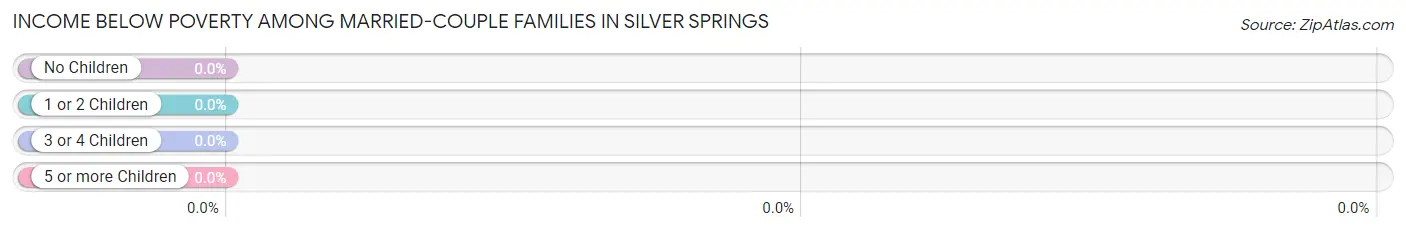
| Children | Above Poverty | Below Poverty |
| No Children | 24 (100.0%) | 0 (0.0%) |
| 1 or 2 Children | 10 (100.0%) | 0 (0.0%) |
| 3 or 4 Children | 0 (0.0%) | 0 (0.0%) |
| 5 or more Children | 0 (0.0%) | 0 (0.0%) |
| Total | 34 (100.0%) | 0 (0.0%) |
Income Below Poverty Among Single-Parent Households in Silver Springs
| Children | Single Father | Single Mother |
| No Children | 0 (0.0%) | 0 (0.0%) |
| 1 or 2 Children | 0 (0.0%) | 0 (0.0%) |
| 3 or 4 Children | 0 (0.0%) | 0 (0.0%) |
| 5 or more Children | 0 (0.0%) | 0 (0.0%) |
| Total | 0 (0.0%) | 0 (0.0%) |
Income Below Poverty Among Married-Couple vs Single-Parent Households in Silver Springs
| Children | Married-Couple Families | Single-Parent Households |
| No Children | 0 (0.0%) | 0 (0.0%) |
| 1 or 2 Children | 0 (0.0%) | 0 (0.0%) |
| 3 or 4 Children | 0 (0.0%) | 0 (0.0%) |
| 5 or more Children | 0 (0.0%) | 0 (0.0%) |
| Total | 0 (0.0%) | 0 (0.0%) |
Race in Silver Springs
The most populous races in Silver Springs are White / Caucasian (96 | 90.6%), and Two or more Races (10 | 9.4%).
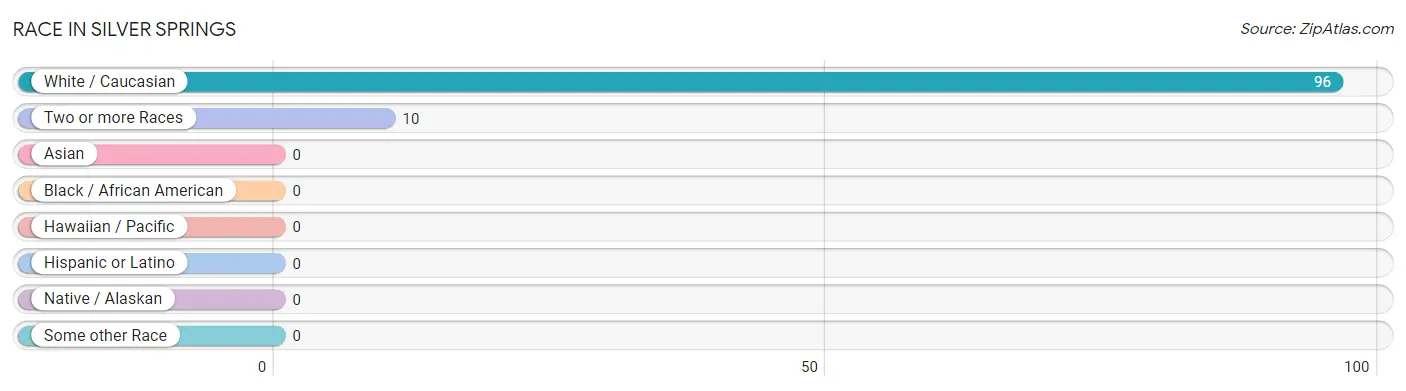
| Race | # Population | % Population |
| Asian | 0 | 0.0% |
| Black / African American | 0 | 0.0% |
| Hawaiian / Pacific | 0 | 0.0% |
| Hispanic or Latino | 0 | 0.0% |
| Native / Alaskan | 0 | 0.0% |
| White / Caucasian | 96 | 90.6% |
| Two or more Races | 10 | 9.4% |
| Some other Race | 0 | 0.0% |
| Total | 106 | 100.0% |
Ancestry in Silver Springs
The most populous ancestries reported in Silver Springs are German (42 | 39.6%), Irish (13 | 12.3%), Polish (11 | 10.4%), Cherokee (10 | 9.4%), and Scandinavian (7 | 6.6%), together accounting for 78.3% of all Silver Springs residents.
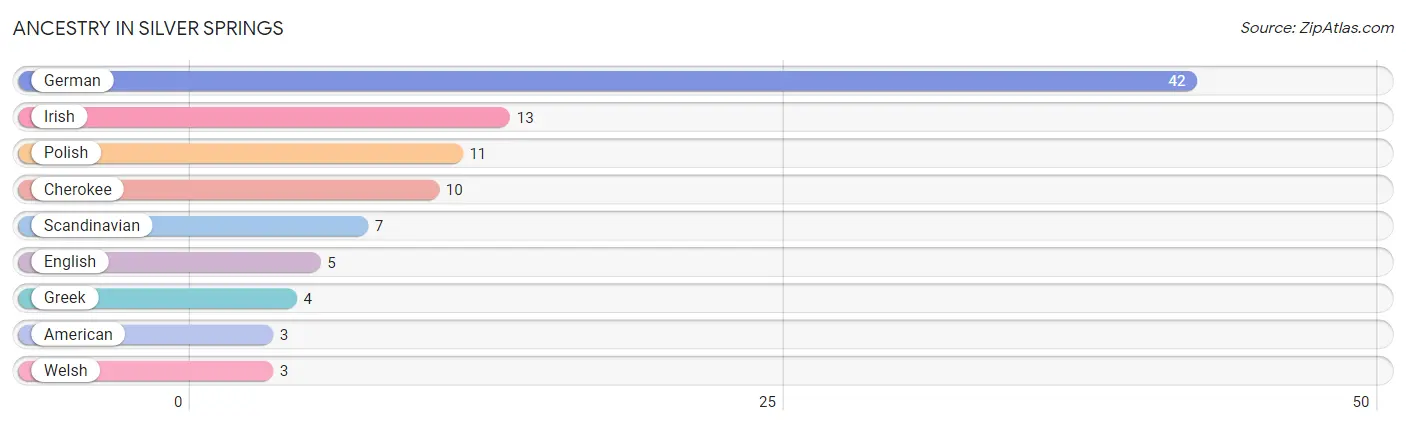
| Ancestry | # Population | % Population |
| American | 3 | 2.8% |
| Cherokee | 10 | 9.4% |
| English | 5 | 4.7% |
| German | 42 | 39.6% |
| Greek | 4 | 3.8% |
| Irish | 13 | 12.3% |
| Polish | 11 | 10.4% |
| Scandinavian | 7 | 6.6% |
| Welsh | 3 | 2.8% | View All 9 Rows |
Immigrants in Silver Springs

| Immigration Origin | # Population | % Population | View All 0 Rows |
Sex and Age in Silver Springs
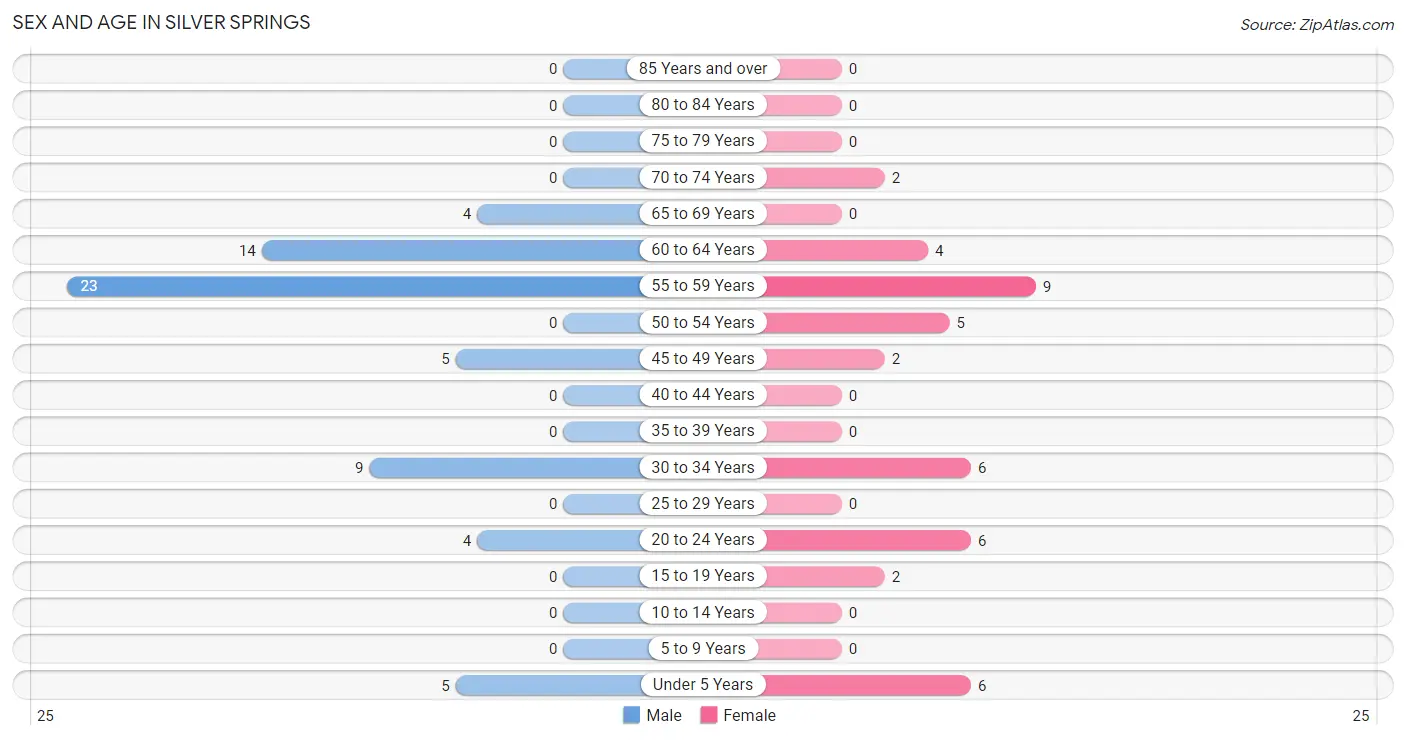
Sex and Age in Silver Springs
The most populous age groups in Silver Springs are 55 to 59 Years (23 | 35.9%) for men and 55 to 59 Years (9 | 21.4%) for women.
| Age Bracket | Male | Female |
| Under 5 Years | 5 (7.8%) | 6 (14.3%) |
| 5 to 9 Years | 0 (0.0%) | 0 (0.0%) |
| 10 to 14 Years | 0 (0.0%) | 0 (0.0%) |
| 15 to 19 Years | 0 (0.0%) | 2 (4.8%) |
| 20 to 24 Years | 4 (6.2%) | 6 (14.3%) |
| 25 to 29 Years | 0 (0.0%) | 0 (0.0%) |
| 30 to 34 Years | 9 (14.1%) | 6 (14.3%) |
| 35 to 39 Years | 0 (0.0%) | 0 (0.0%) |
| 40 to 44 Years | 0 (0.0%) | 0 (0.0%) |
| 45 to 49 Years | 5 (7.8%) | 2 (4.8%) |
| 50 to 54 Years | 0 (0.0%) | 5 (11.9%) |
| 55 to 59 Years | 23 (35.9%) | 9 (21.4%) |
| 60 to 64 Years | 14 (21.9%) | 4 (9.5%) |
| 65 to 69 Years | 4 (6.2%) | 0 (0.0%) |
| 70 to 74 Years | 0 (0.0%) | 2 (4.8%) |
| 75 to 79 Years | 0 (0.0%) | 0 (0.0%) |
| 80 to 84 Years | 0 (0.0%) | 0 (0.0%) |
| 85 Years and over | 0 (0.0%) | 0 (0.0%) |
| Total | 64 (100.0%) | 42 (100.0%) |
Families and Households in Silver Springs
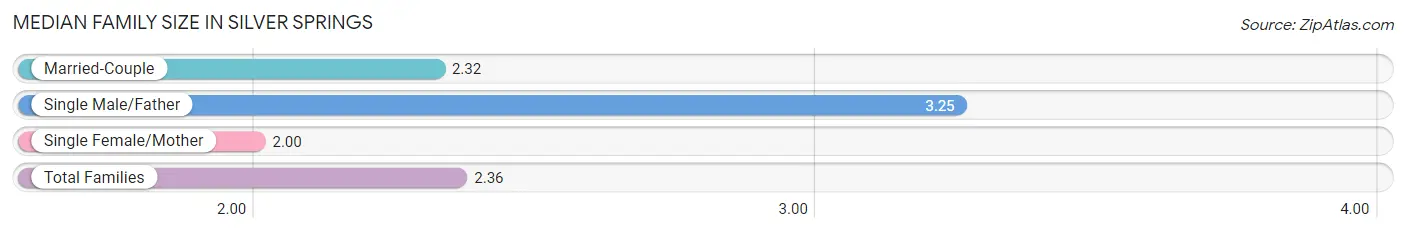
Median Family Size in Silver Springs
The median family size in Silver Springs is 2.36 persons per family, with single male/father families (4 | 8.9%) accounting for the largest median family size of 3.25 persons per family. On the other hand, single female/mother families (7 | 15.6%) represent the smallest median family size with 2.00 persons per family.
| Family Type | # Families | Family Size |
| Married-Couple | 34 (75.6%) | 2.32 |
| Single Male/Father | 4 (8.9%) | 3.25 |
| Single Female/Mother | 7 (15.6%) | 2.00 |
| Total Families | 45 (100.0%) | 2.36 |
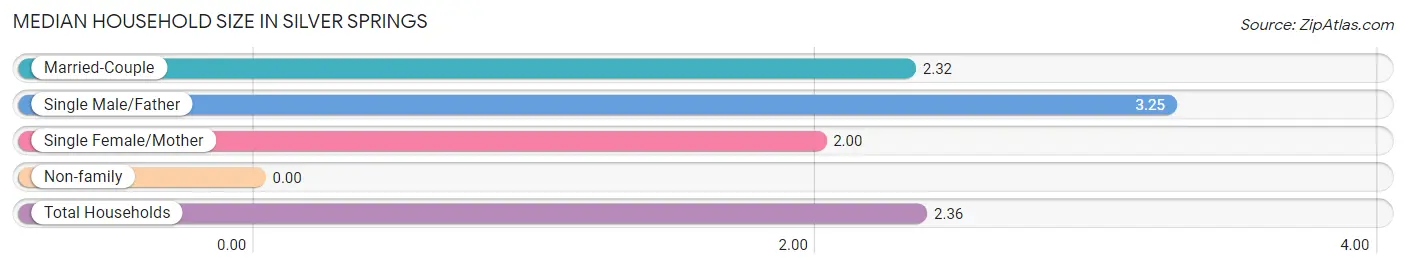
Median Household Size in Silver Springs
| Household Type | # Households | Household Size |
| Married-Couple | 34 (75.6%) | 2.32 |
| Single Male/Father | 4 (8.9%) | 3.25 |
| Single Female/Mother | 7 (15.6%) | 2.00 |
| Non-family | 0 (0.0%) | - |
| Total Households | 45 (100.0%) | 2.36 |
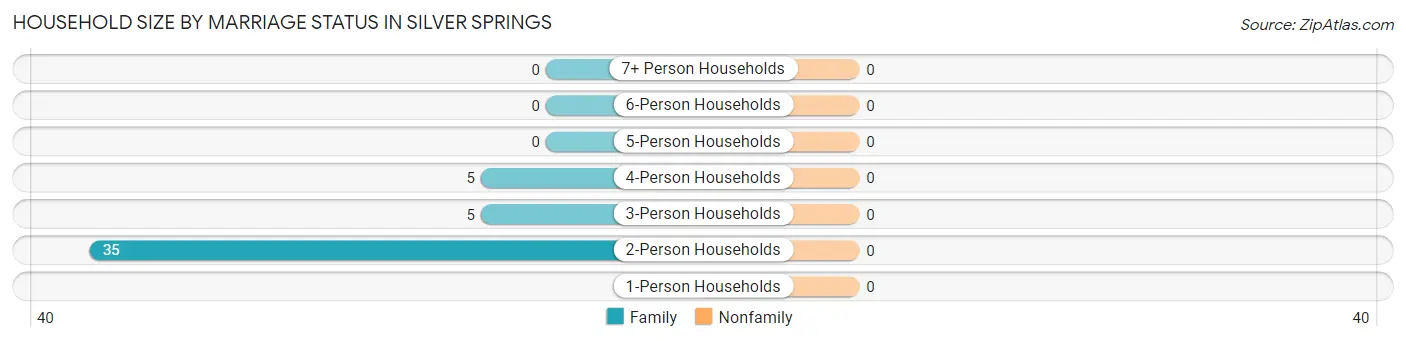
Household Size by Marriage Status in Silver Springs
| Household Size | Family Households | Nonfamily Households |
| 1-Person Households | - | 0 (0.0%) |
| 2-Person Households | 35 (77.8%) | 0 (0.0%) |
| 3-Person Households | 5 (11.1%) | 0 (0.0%) |
| 4-Person Households | 5 (11.1%) | 0 (0.0%) |
| 5-Person Households | 0 (0.0%) | 0 (0.0%) |
| 6-Person Households | 0 (0.0%) | 0 (0.0%) |
| 7+ Person Households | 0 (0.0%) | 0 (0.0%) |
| Total | 45 (100.0%) | 0 (0.0%) |
Female Fertility in Silver Springs
Fertility by Age in Silver Springs
Average fertility rate in Silver Springs is 375.0 births per 1,000 women. Women in the age bracket of 20 to 34 years have the highest fertility rate with 500.0 births per 1,000 women. Women in the age bracket of 20 to 34 years acount for 100.0% of all women with births.
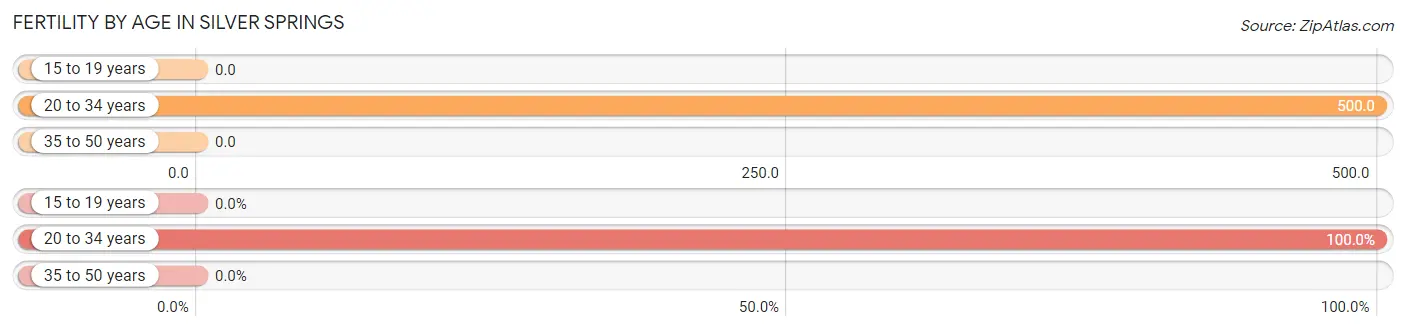
| Age Bracket | Women with Births | Births / 1,000 Women |
| 15 to 19 years | 0 (0.0%) | 0.0 |
| 20 to 34 years | 6 (100.0%) | 500.0 |
| 35 to 50 years | 0 (0.0%) | 0.0 |
| Total | 6 (100.0%) | 375.0 |
Fertility by Age by Marriage Status in Silver Springs
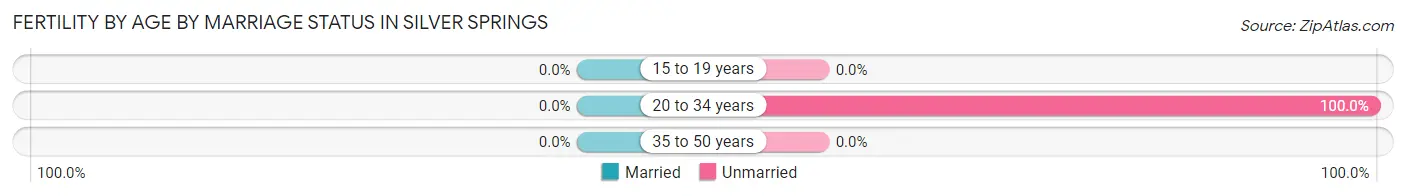
| Age Bracket | Married | Unmarried |
| 15 to 19 years | 0 (0.0%) | 0 (0.0%) |
| 20 to 34 years | 0 (0.0%) | 6 (100.0%) |
| 35 to 50 years | 0 (0.0%) | 0 (0.0%) |
| Total | 0 (0.0%) | 6 (100.0%) |
Fertility by Education in Silver Springs
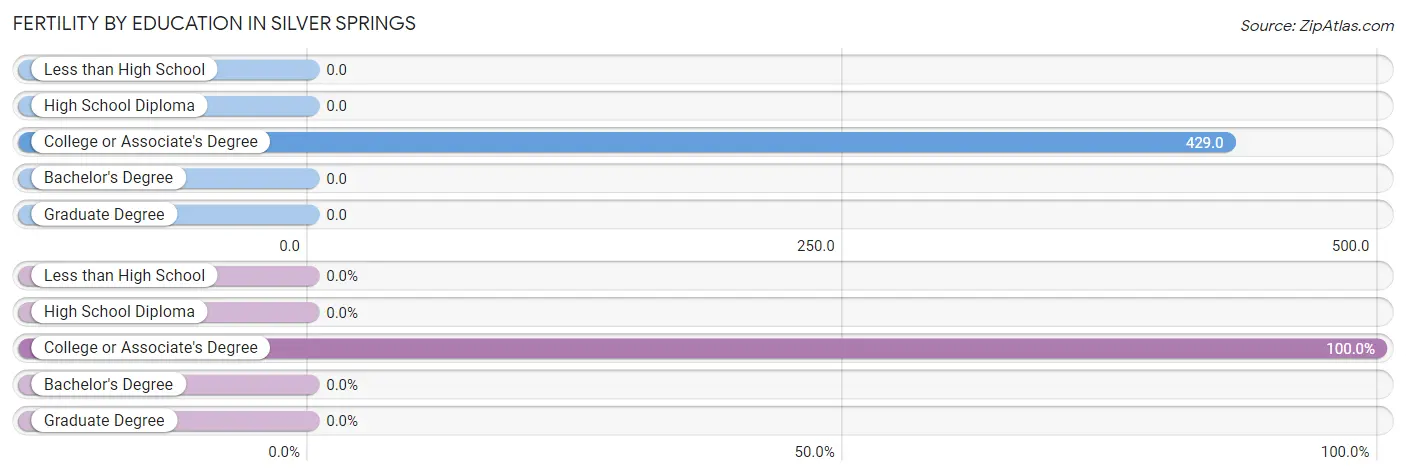
| Educational Attainment | Women with Births | Births / 1,000 Women |
| Less than High School | 0 (0.0%) | 0.0 |
| High School Diploma | 0 (0.0%) | 0.0 |
| College or Associate's Degree | 6 (100.0%) | 429.0 |
| Bachelor's Degree | 0 (0.0%) | 0.0 |
| Graduate Degree | 0 (0.0%) | 0.0 |
| Total | 6 (100.0%) | 375.0 |
Fertility by Education by Marriage Status in Silver Springs
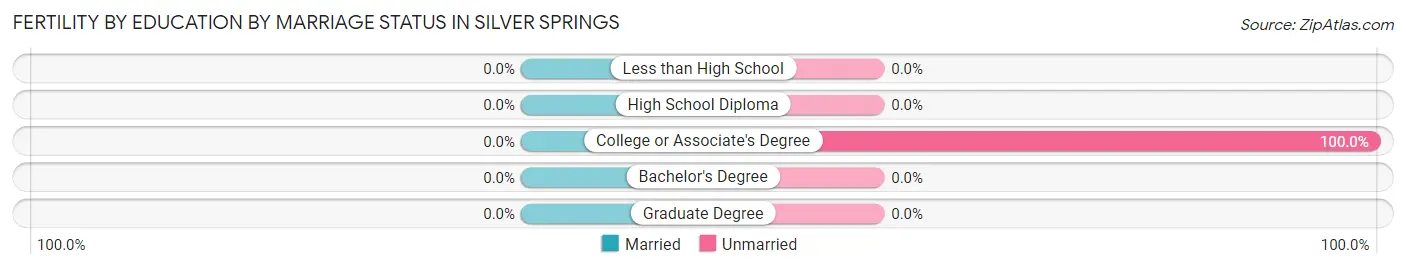
| Educational Attainment | Married | Unmarried |
| Less than High School | 0 (0.0%) | 0 (0.0%) |
| High School Diploma | 0 (0.0%) | 0 (0.0%) |
| College or Associate's Degree | 0 (0.0%) | 6 (100.0%) |
| Bachelor's Degree | 0 (0.0%) | 0 (0.0%) |
| Graduate Degree | 0 (0.0%) | 0 (0.0%) |
| Total | 0 (0.0%) | 6 (100.0%) |
Employment Characteristics in Silver Springs
Employment by Class of Employer in Silver Springs
Among the 63 employed individuals in Silver Springs, not-for-profit organizations (29 | 46.0%), private company employees (19 | 30.2%), and self-employed (incorporated) (5 | 7.9%) make up the most common classes of employment.
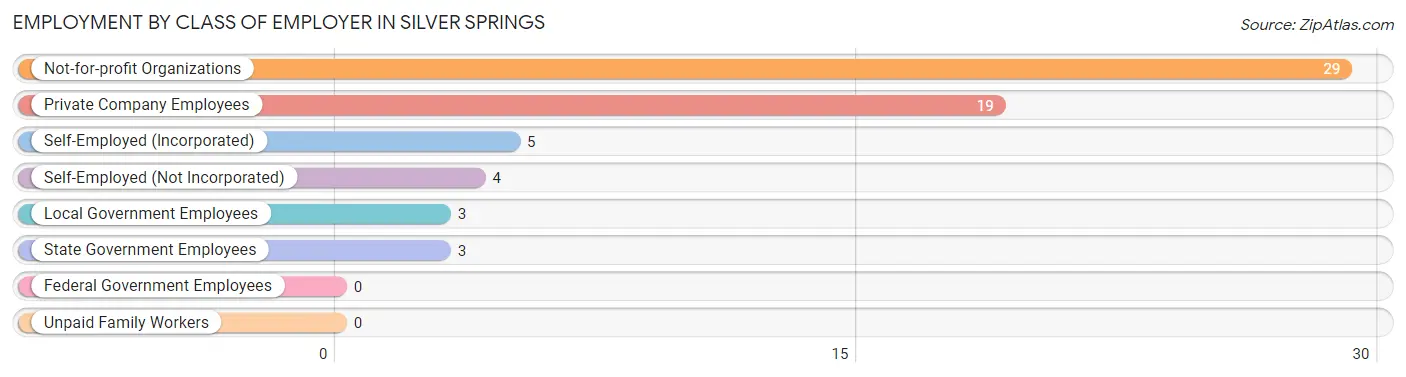
| Employer Class | # Employees | % Employees |
| Private Company Employees | 19 | 30.2% |
| Self-Employed (Incorporated) | 5 | 7.9% |
| Self-Employed (Not Incorporated) | 4 | 6.4% |
| Not-for-profit Organizations | 29 | 46.0% |
| Local Government Employees | 3 | 4.8% |
| State Government Employees | 3 | 4.8% |
| Federal Government Employees | 0 | 0.0% |
| Unpaid Family Workers | 0 | 0.0% |
| Total | 63 | 100.0% |
Employment Status by Age in Silver Springs
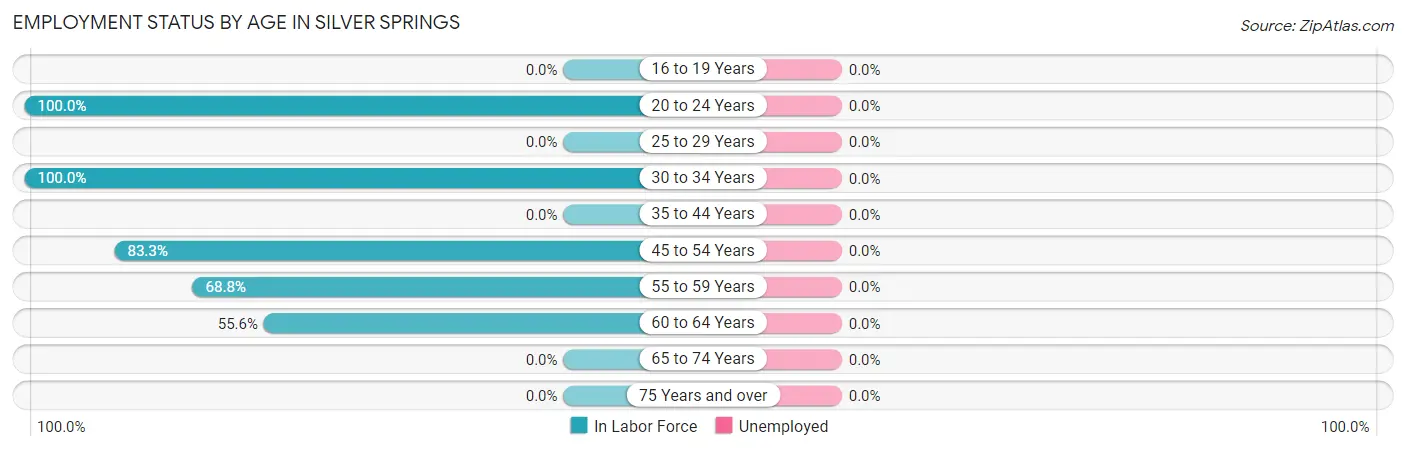
| Age Bracket | In Labor Force | Unemployed |
| 16 to 19 Years | 0 (0.0%) | 0 (0.0%) |
| 20 to 24 Years | 10 (100.0%) | 0 (0.0%) |
| 25 to 29 Years | 0 (0.0%) | 0 (0.0%) |
| 30 to 34 Years | 15 (100.0%) | 0 (0.0%) |
| 35 to 44 Years | 0 (0.0%) | 0 (0.0%) |
| 45 to 54 Years | 10 (83.3%) | 0 (0.0%) |
| 55 to 59 Years | 22 (68.8%) | 0 (0.0%) |
| 60 to 64 Years | 10 (55.6%) | 0 (0.0%) |
| 65 to 74 Years | 0 (0.0%) | 0 (0.0%) |
| 75 Years and over | 0 (0.0%) | 0 (0.0%) |
| Total | 67 (70.5%) | 0 (0.0%) |
Employment Status by Educational Attainment in Silver Springs
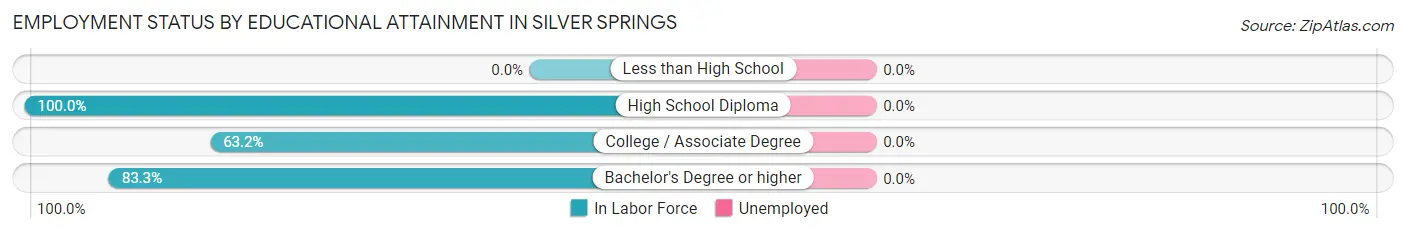
| Educational Attainment | In Labor Force | Unemployed |
| Less than High School | 0 (0.0%) | 0 (0.0%) |
| High School Diploma | 3 (100.0%) | 0 (0.0%) |
| College / Associate Degree | 24 (63.2%) | 0 (0.0%) |
| Bachelor's Degree or higher | 30 (83.3%) | 0 (0.0%) |
| Total | 57 (74.0%) | 0 (0.0%) |
Employment Occupations by Sex in Silver Springs
Management, Business, Science and Arts Occupations
The most common Management, Business, Science and Arts occupations in Silver Springs are Management (19 | 28.4%), Business & Financial (11 | 16.4%), Community & Social Service (8 | 11.9%), Education, Arts & Media (8 | 11.9%), and Health Diagnosing & Treating (5 | 7.5%).
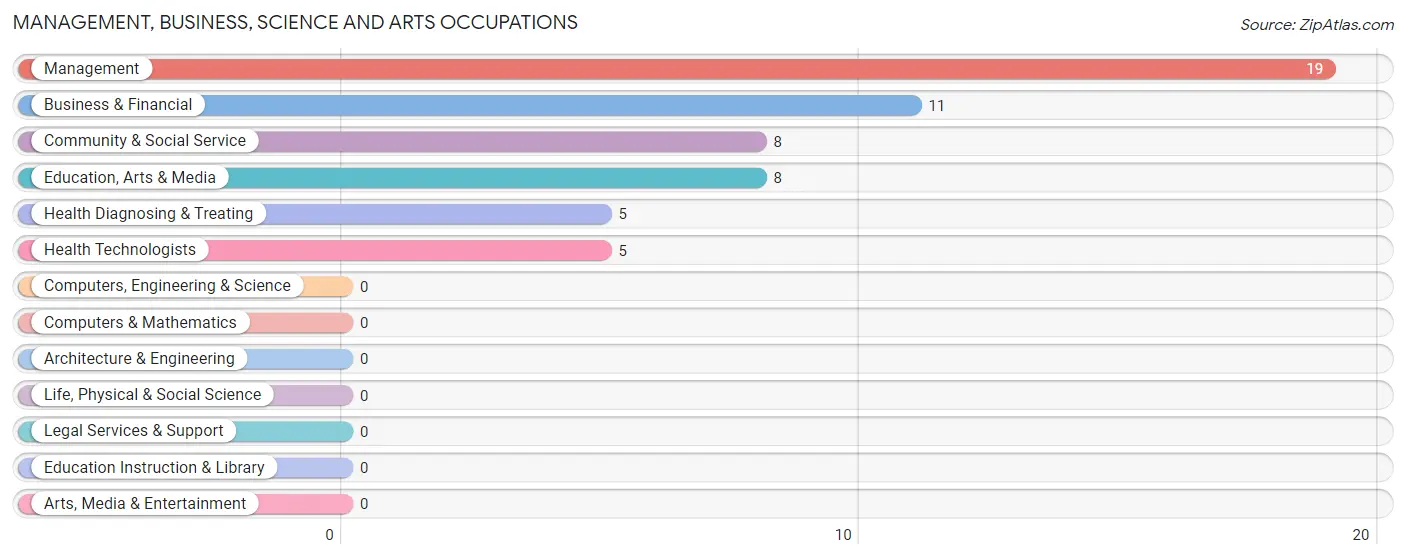
Management, Business, Science and Arts Occupations by Sex
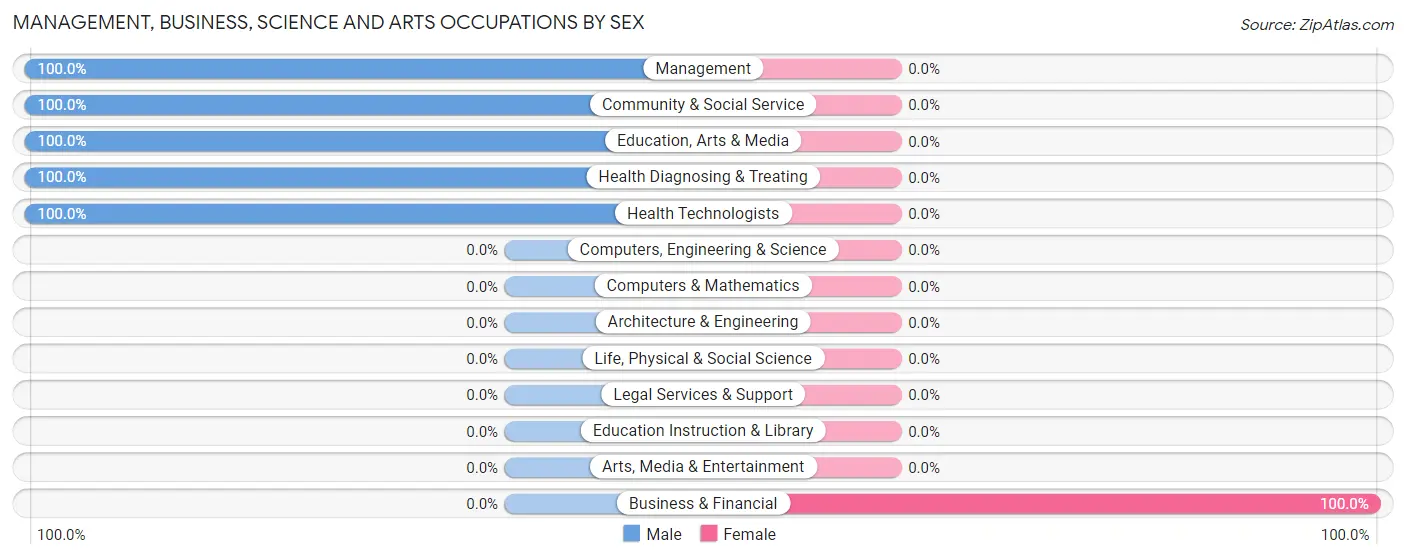
| Occupation | Male | Female |
| Management | 19 (100.0%) | 0 (0.0%) |
| Business & Financial | 0 (0.0%) | 11 (100.0%) |
| Computers, Engineering & Science | 0 (0.0%) | 0 (0.0%) |
| Computers & Mathematics | 0 (0.0%) | 0 (0.0%) |
| Architecture & Engineering | 0 (0.0%) | 0 (0.0%) |
| Life, Physical & Social Science | 0 (0.0%) | 0 (0.0%) |
| Community & Social Service | 8 (100.0%) | 0 (0.0%) |
| Education, Arts & Media | 8 (100.0%) | 0 (0.0%) |
| Legal Services & Support | 0 (0.0%) | 0 (0.0%) |
| Education Instruction & Library | 0 (0.0%) | 0 (0.0%) |
| Arts, Media & Entertainment | 0 (0.0%) | 0 (0.0%) |
| Health Diagnosing & Treating | 5 (100.0%) | 0 (0.0%) |
| Health Technologists | 5 (100.0%) | 0 (0.0%) |
| Total (Category) | 32 (74.4%) | 11 (25.6%) |
| Total (Overall) | 47 (70.2%) | 20 (29.8%) |
Services Occupations
The most common Services occupations in Silver Springs are Healthcare Support (4 | 6.0%), Cleaning & Maintenance (4 | 6.0%), Security & Protection (3 | 4.5%), and Firefighting & Prevention (3 | 4.5%).
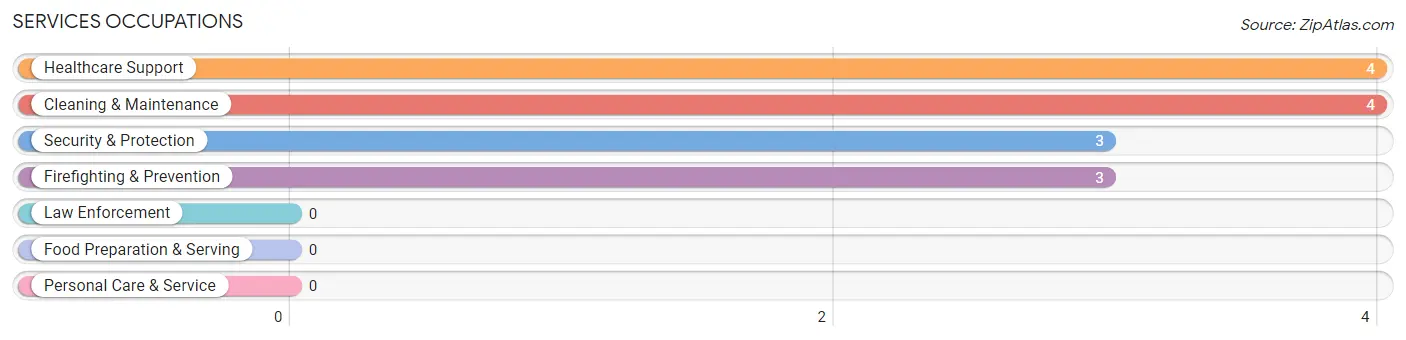
Services Occupations by Sex
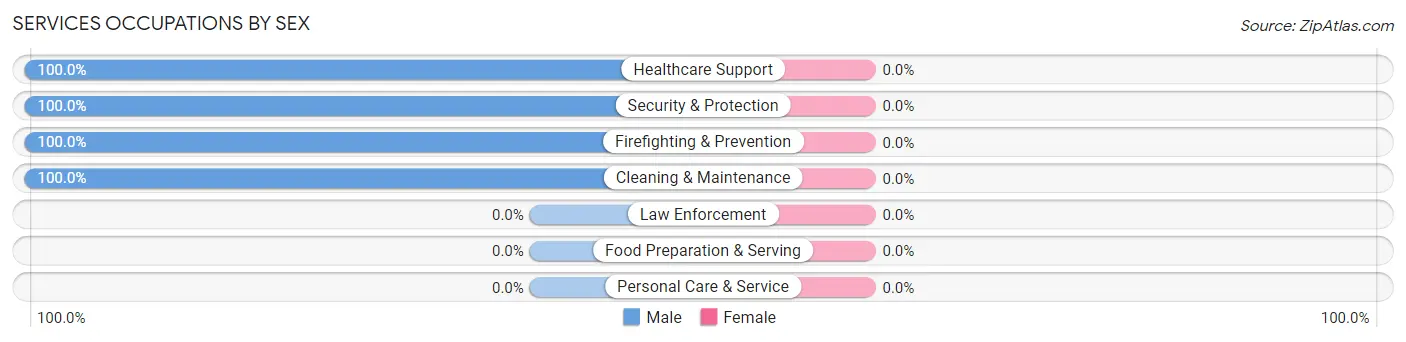
| Occupation | Male | Female |
| Healthcare Support | 4 (100.0%) | 0 (0.0%) |
| Security & Protection | 3 (100.0%) | 0 (0.0%) |
| Firefighting & Prevention | 3 (100.0%) | 0 (0.0%) |
| Law Enforcement | 0 (0.0%) | 0 (0.0%) |
| Food Preparation & Serving | 0 (0.0%) | 0 (0.0%) |
| Cleaning & Maintenance | 4 (100.0%) | 0 (0.0%) |
| Personal Care & Service | 0 (0.0%) | 0 (0.0%) |
| Total (Category) | 11 (100.0%) | 0 (0.0%) |
| Total (Overall) | 47 (70.2%) | 20 (29.8%) |
Sales and Office Occupations
The most common Sales and Office occupations in Silver Springs are Sales & Related (5 | 7.5%), and Office & Administration (4 | 6.0%).
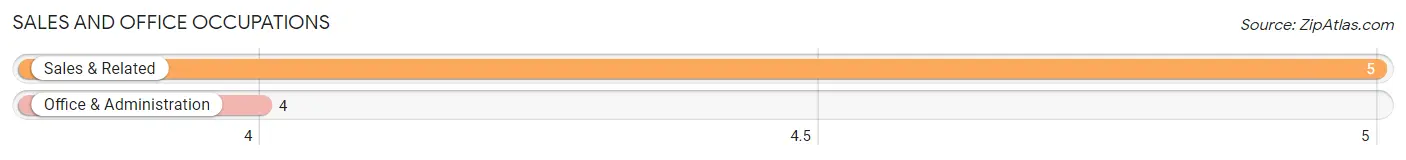
Sales and Office Occupations by Sex
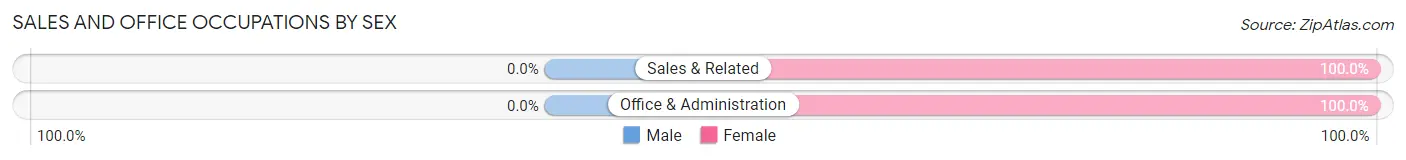
| Occupation | Male | Female |
| Sales & Related | 0 (0.0%) | 5 (100.0%) |
| Office & Administration | 0 (0.0%) | 4 (100.0%) |
| Total (Category) | 0 (0.0%) | 9 (100.0%) |
| Total (Overall) | 47 (70.2%) | 20 (29.8%) |
Natural Resources, Construction and Maintenance Occupations
The most common Natural Resources, Construction and Maintenance occupations in Silver Springs are , and Farming, Fishing & Forestry (4 | 6.0%).
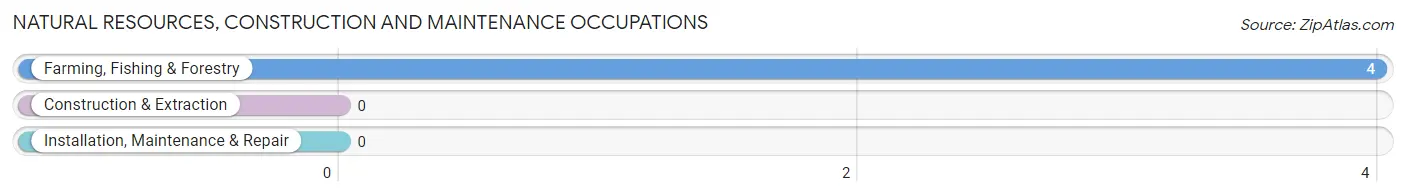
Natural Resources, Construction and Maintenance Occupations by Sex
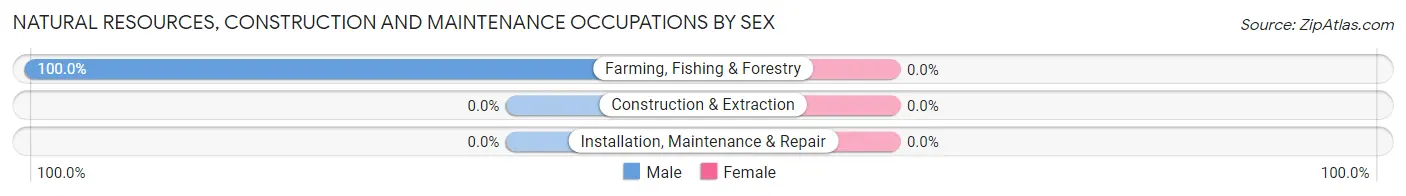
| Occupation | Male | Female |
| Farming, Fishing & Forestry | 4 (100.0%) | 0 (0.0%) |
| Construction & Extraction | 0 (0.0%) | 0 (0.0%) |
| Installation, Maintenance & Repair | 0 (0.0%) | 0 (0.0%) |
| Total (Category) | 4 (100.0%) | 0 (0.0%) |
| Total (Overall) | 47 (70.2%) | 20 (29.8%) |
Production, Transportation and Moving Occupations
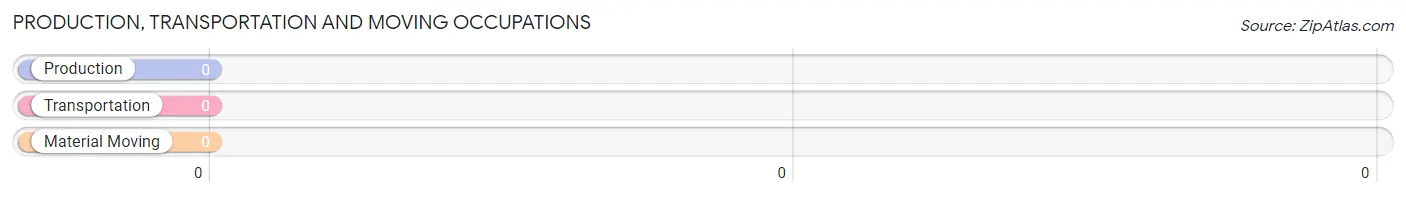
Production, Transportation and Moving Occupations by Sex
| Occupation | Male | Female |
| Production | 0 (0.0%) | 0 (0.0%) |
| Transportation | 0 (0.0%) | 0 (0.0%) |
| Material Moving | 0 (0.0%) | 0 (0.0%) |
| Total (Category) | 0 (0.0%) | 0 (0.0%) |
| Total (Overall) | 47 (70.2%) | 20 (29.8%) |
Employment Industries by Sex in Silver Springs
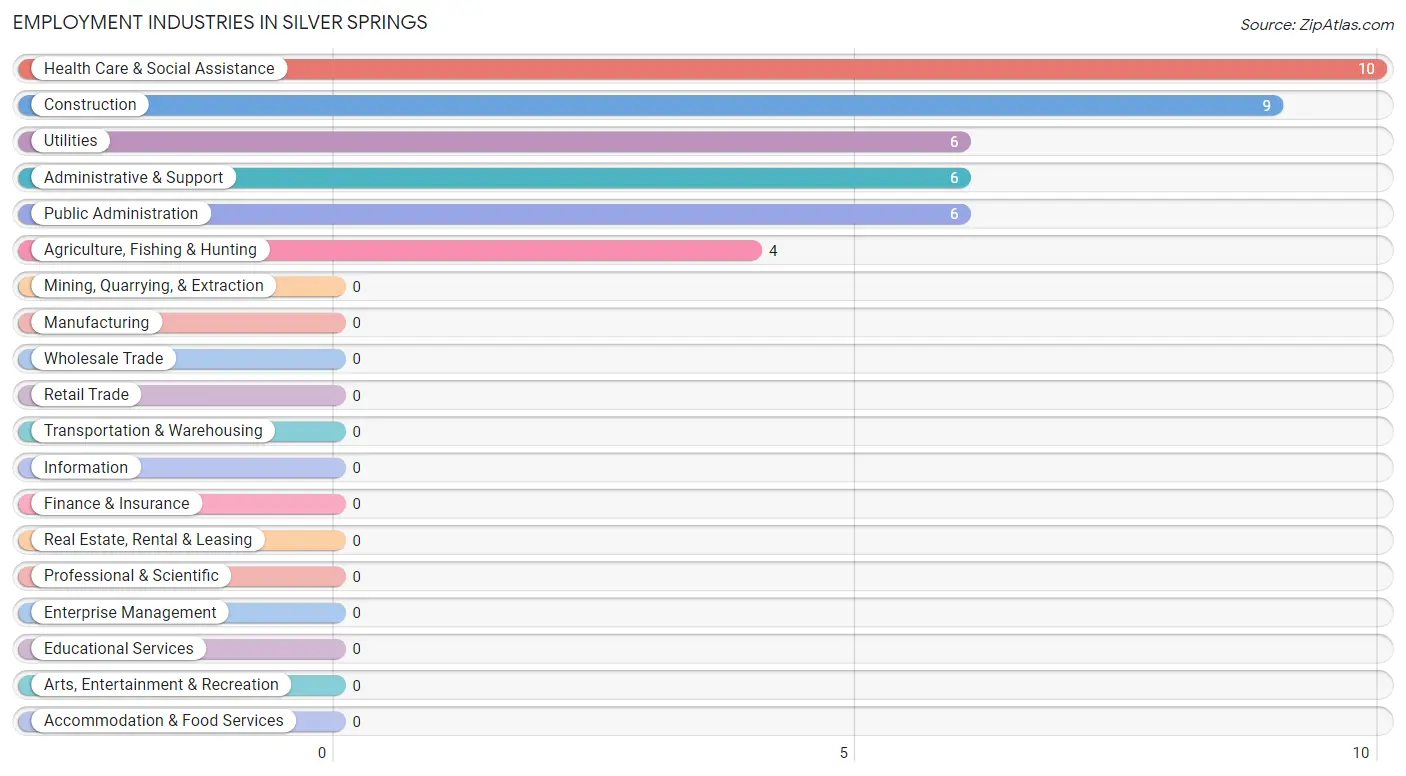
Employment Industries in Silver Springs
The major employment industries in Silver Springs include Health Care & Social Assistance (10 | 14.9%), Construction (9 | 13.4%), Utilities (6 | 9.0%), Administrative & Support (6 | 9.0%), and Public Administration (6 | 9.0%).
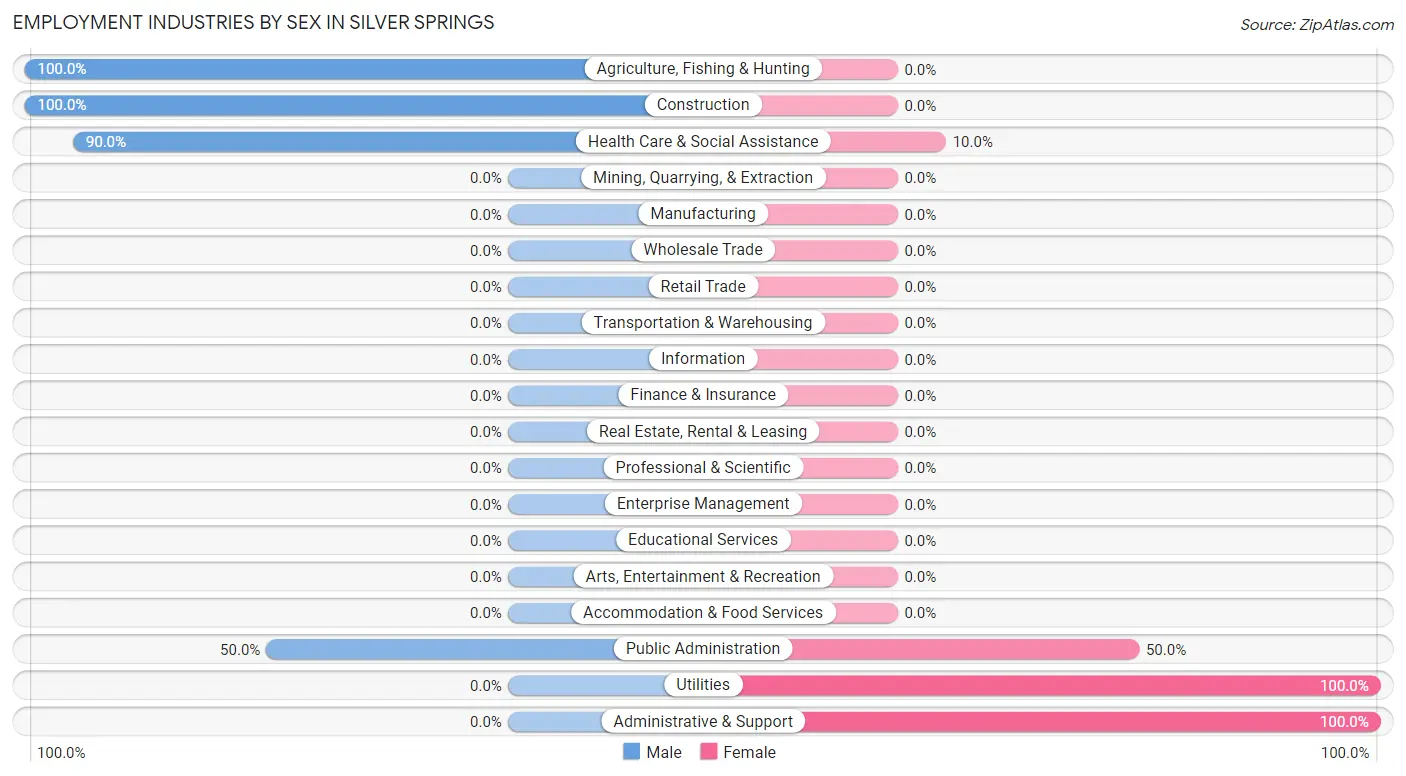
Employment Industries by Sex in Silver Springs
The Silver Springs industries that see more men than women are Agriculture, Fishing & Hunting (100.0%), Construction (100.0%), and Health Care & Social Assistance (90.0%), whereas the industries that tend to have a higher number of women are Utilities (100.0%), Administrative & Support (100.0%), and Public Administration (50.0%).
| Industry | Male | Female |
| Agriculture, Fishing & Hunting | 4 (100.0%) | 0 (0.0%) |
| Mining, Quarrying, & Extraction | 0 (0.0%) | 0 (0.0%) |
| Construction | 9 (100.0%) | 0 (0.0%) |
| Manufacturing | 0 (0.0%) | 0 (0.0%) |
| Wholesale Trade | 0 (0.0%) | 0 (0.0%) |
| Retail Trade | 0 (0.0%) | 0 (0.0%) |
| Transportation & Warehousing | 0 (0.0%) | 0 (0.0%) |
| Utilities | 0 (0.0%) | 6 (100.0%) |
| Information | 0 (0.0%) | 0 (0.0%) |
| Finance & Insurance | 0 (0.0%) | 0 (0.0%) |
| Real Estate, Rental & Leasing | 0 (0.0%) | 0 (0.0%) |
| Professional & Scientific | 0 (0.0%) | 0 (0.0%) |
| Enterprise Management | 0 (0.0%) | 0 (0.0%) |
| Administrative & Support | 0 (0.0%) | 6 (100.0%) |
| Educational Services | 0 (0.0%) | 0 (0.0%) |
| Health Care & Social Assistance | 9 (90.0%) | 1 (10.0%) |
| Arts, Entertainment & Recreation | 0 (0.0%) | 0 (0.0%) |
| Accommodation & Food Services | 0 (0.0%) | 0 (0.0%) |
| Public Administration | 3 (50.0%) | 3 (50.0%) |
| Total | 47 (70.2%) | 20 (29.8%) |
Education in Silver Springs
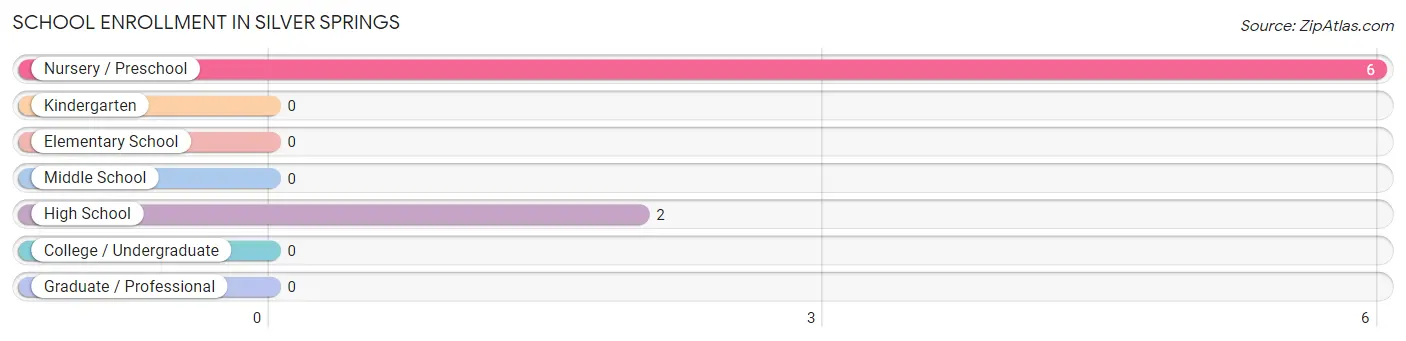
School Enrollment in Silver Springs
The most common levels of schooling among the 8 students in Silver Springs are nursery / preschool (6 | 75.0%), and high school (2 | 25.0%).
| School Level | # Students | % Students |
| Nursery / Preschool | 6 | 75.0% |
| Kindergarten | 0 | 0.0% |
| Elementary School | 0 | 0.0% |
| Middle School | 0 | 0.0% |
| High School | 2 | 25.0% |
| College / Undergraduate | 0 | 0.0% |
| Graduate / Professional | 0 | 0.0% |
| Total | 8 | 100.0% |
School Enrollment by Age by Funding Source in Silver Springs
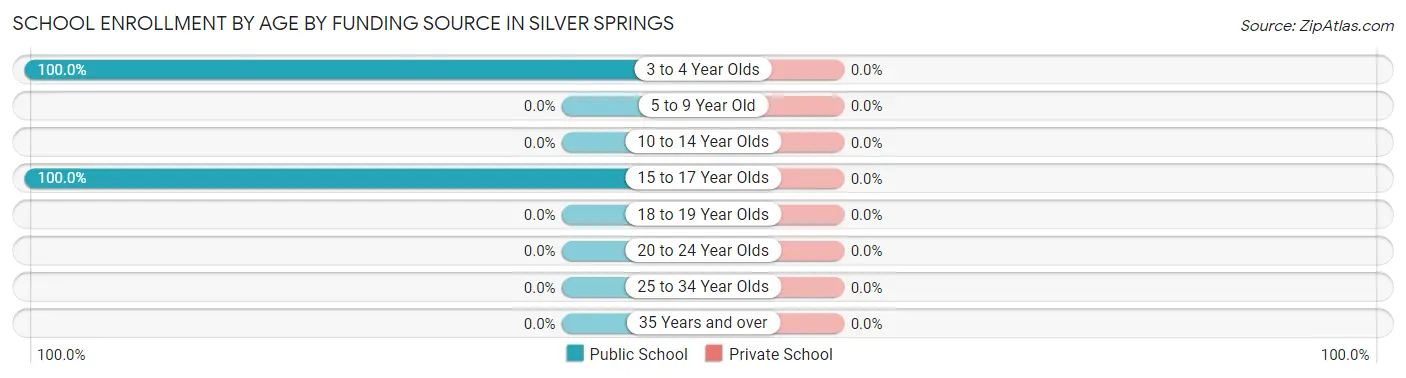
| Age Bracket | Public School | Private School |
| 3 to 4 Year Olds | 6 (100.0%) | 0 (0.0%) |
| 5 to 9 Year Old | 0 (0.0%) | 0 (0.0%) |
| 10 to 14 Year Olds | 0 (0.0%) | 0 (0.0%) |
| 15 to 17 Year Olds | 2 (100.0%) | 0 (0.0%) |
| 18 to 19 Year Olds | 0 (0.0%) | 0 (0.0%) |
| 20 to 24 Year Olds | 0 (0.0%) | 0 (0.0%) |
| 25 to 34 Year Olds | 0 (0.0%) | 0 (0.0%) |
| 35 Years and over | 0 (0.0%) | 0 (0.0%) |
| Total | 8 (100.0%) | 0 (0.0%) |
Educational Attainment by Field of Study in Silver Springs
Education (13 | 30.9%), physical & health sciences (11 | 26.2%), science & technology (9 | 21.4%), business (5 | 11.9%), and bio, nature & agricultural (4 | 9.5%) are the most common fields of study among 42 individuals in Silver Springs who have obtained a bachelor's degree or higher.
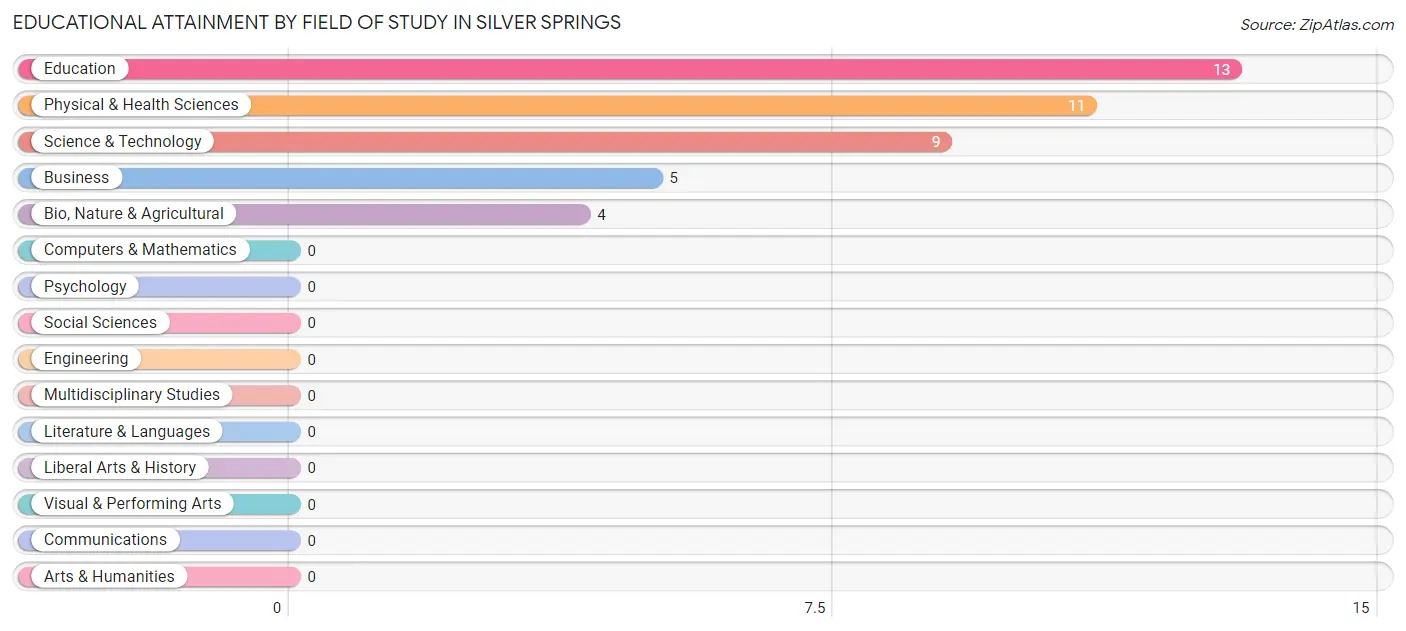
| Field of Study | # Graduates | % Graduates |
| Computers & Mathematics | 0 | 0.0% |
| Bio, Nature & Agricultural | 4 | 9.5% |
| Physical & Health Sciences | 11 | 26.2% |
| Psychology | 0 | 0.0% |
| Social Sciences | 0 | 0.0% |
| Engineering | 0 | 0.0% |
| Multidisciplinary Studies | 0 | 0.0% |
| Science & Technology | 9 | 21.4% |
| Business | 5 | 11.9% |
| Education | 13 | 30.9% |
| Literature & Languages | 0 | 0.0% |
| Liberal Arts & History | 0 | 0.0% |
| Visual & Performing Arts | 0 | 0.0% |
| Communications | 0 | 0.0% |
| Arts & Humanities | 0 | 0.0% |
| Total | 42 | 100.0% |
Transportation & Commute in Silver Springs
Vehicle Availability by Sex in Silver Springs
The most prevalent vehicle ownership categories in Silver Springs are males with 2 vehicles (14, accounting for 32.6%) and females with 2 vehicles (10, making up 70.0%).
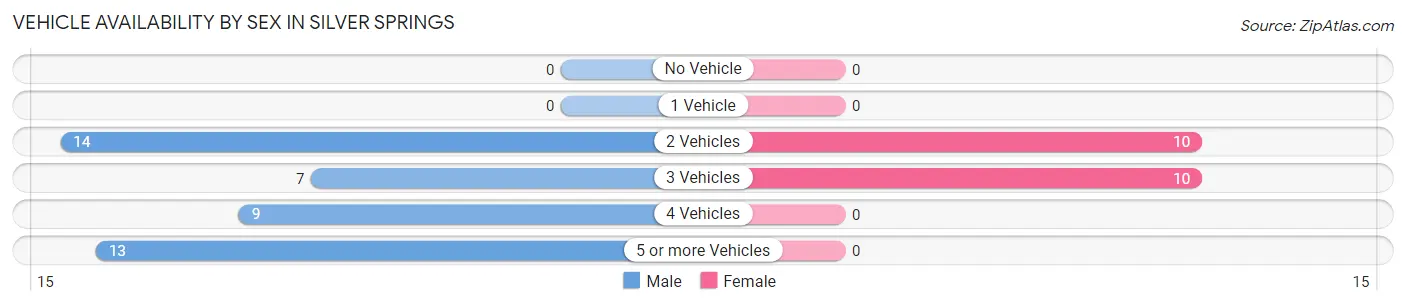
| Vehicles Available | Male | Female |
| No Vehicle | 0 (0.0%) | 0 (0.0%) |
| 1 Vehicle | 0 (0.0%) | 0 (0.0%) |
| 2 Vehicles | 14 (32.6%) | 10 (50.0%) |
| 3 Vehicles | 7 (16.3%) | 10 (50.0%) |
| 4 Vehicles | 9 (20.9%) | 0 (0.0%) |
| 5 or more Vehicles | 13 (30.2%) | 0 (0.0%) |
| Total | 43 (100.0%) | 20 (100.0%) |
Commute Time in Silver Springs
The most frequently occuring commute durations in Silver Springs are 20 to 24 minutes (24 commuters, 38.1%), 15 to 19 minutes (18 commuters, 28.6%), and 90 or more minutes (13 commuters, 20.6%).
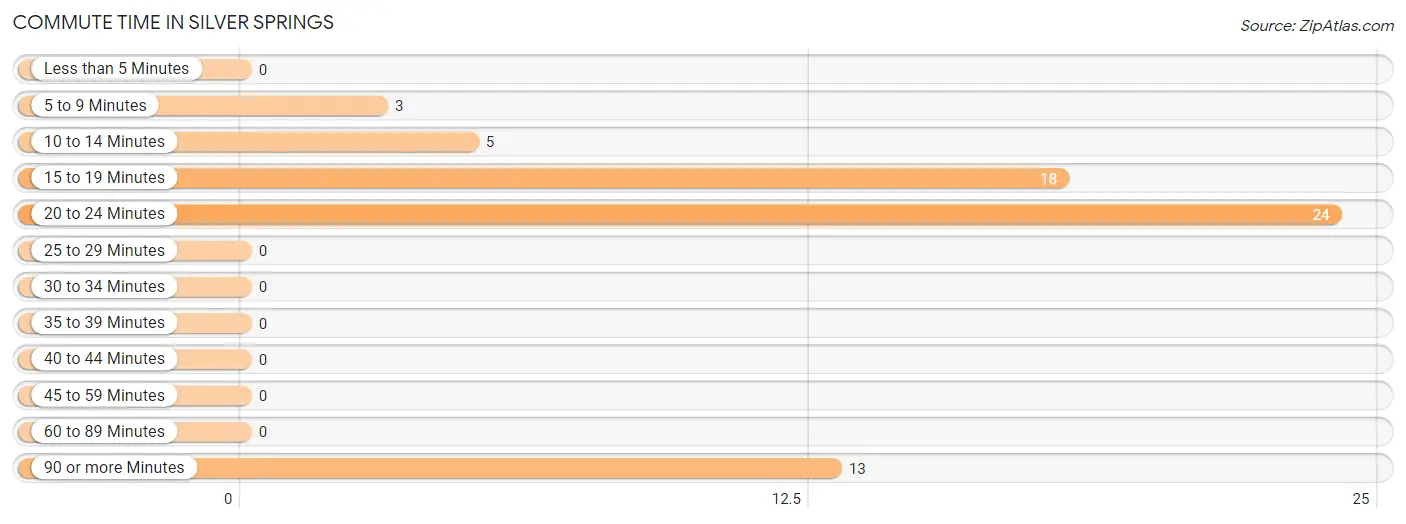
| Commute Time | # Commuters | % Commuters |
| Less than 5 Minutes | 0 | 0.0% |
| 5 to 9 Minutes | 3 | 4.8% |
| 10 to 14 Minutes | 5 | 7.9% |
| 15 to 19 Minutes | 18 | 28.6% |
| 20 to 24 Minutes | 24 | 38.1% |
| 25 to 29 Minutes | 0 | 0.0% |
| 30 to 34 Minutes | 0 | 0.0% |
| 35 to 39 Minutes | 0 | 0.0% |
| 40 to 44 Minutes | 0 | 0.0% |
| 45 to 59 Minutes | 0 | 0.0% |
| 60 to 89 Minutes | 0 | 0.0% |
| 90 or more Minutes | 13 | 20.6% |
Commute Time by Sex in Silver Springs
The most common commute times in Silver Springs are 20 to 24 minutes (17 commuters, 39.5%) for males and 15 to 19 minutes (10 commuters, 50.0%) for females.
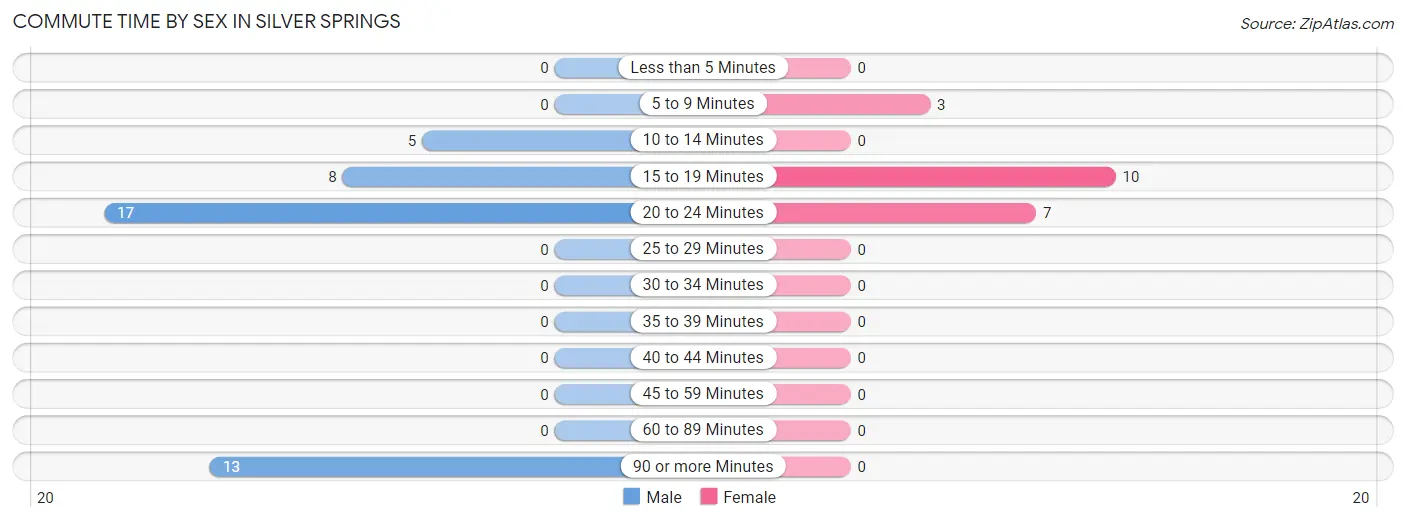
| Commute Time | Male | Female |
| Less than 5 Minutes | 0 (0.0%) | 0 (0.0%) |
| 5 to 9 Minutes | 0 (0.0%) | 3 (15.0%) |
| 10 to 14 Minutes | 5 (11.6%) | 0 (0.0%) |
| 15 to 19 Minutes | 8 (18.6%) | 10 (50.0%) |
| 20 to 24 Minutes | 17 (39.5%) | 7 (35.0%) |
| 25 to 29 Minutes | 0 (0.0%) | 0 (0.0%) |
| 30 to 34 Minutes | 0 (0.0%) | 0 (0.0%) |
| 35 to 39 Minutes | 0 (0.0%) | 0 (0.0%) |
| 40 to 44 Minutes | 0 (0.0%) | 0 (0.0%) |
| 45 to 59 Minutes | 0 (0.0%) | 0 (0.0%) |
| 60 to 89 Minutes | 0 (0.0%) | 0 (0.0%) |
| 90 or more Minutes | 13 (30.2%) | 0 (0.0%) |
Time of Departure to Work by Sex in Silver Springs
The most frequent times of departure to work in Silver Springs are 6:30 AM to 6:59 AM (14, 32.6%) for males and 6:30 AM to 6:59 AM (10, 50.0%) for females.
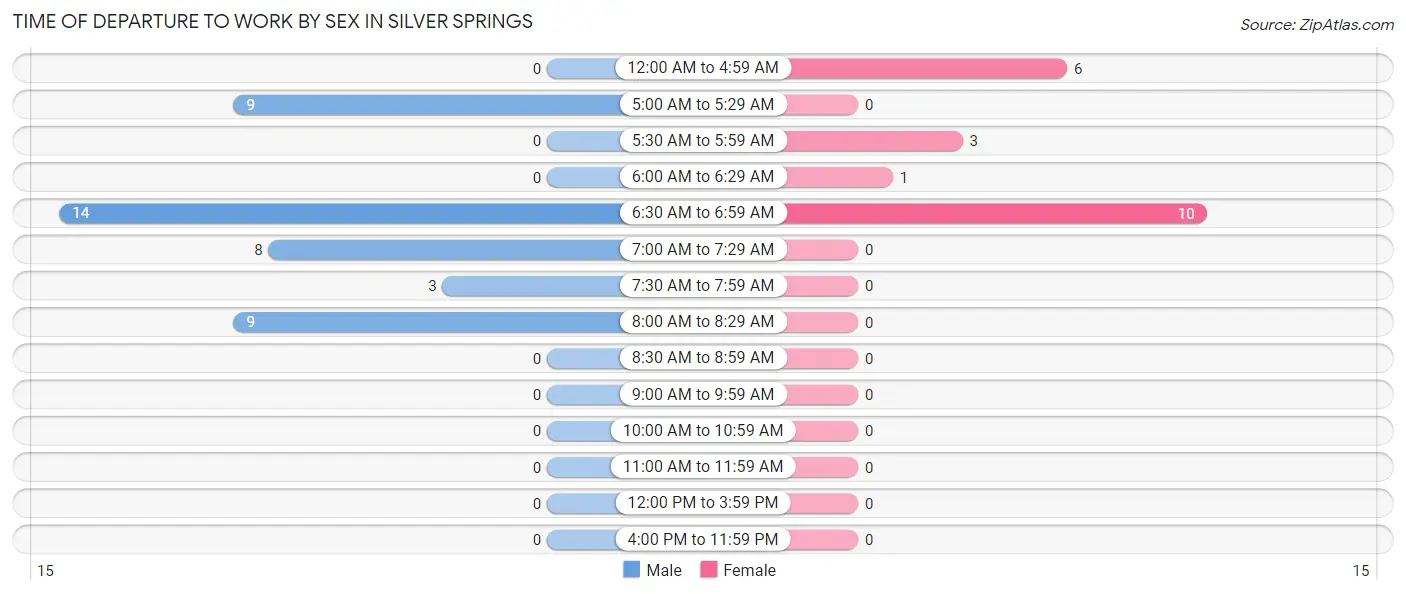
| Time of Departure | Male | Female |
| 12:00 AM to 4:59 AM | 0 (0.0%) | 6 (30.0%) |
| 5:00 AM to 5:29 AM | 9 (20.9%) | 0 (0.0%) |
| 5:30 AM to 5:59 AM | 0 (0.0%) | 3 (15.0%) |
| 6:00 AM to 6:29 AM | 0 (0.0%) | 1 (5.0%) |
| 6:30 AM to 6:59 AM | 14 (32.6%) | 10 (50.0%) |
| 7:00 AM to 7:29 AM | 8 (18.6%) | 0 (0.0%) |
| 7:30 AM to 7:59 AM | 3 (7.0%) | 0 (0.0%) |
| 8:00 AM to 8:29 AM | 9 (20.9%) | 0 (0.0%) |
| 8:30 AM to 8:59 AM | 0 (0.0%) | 0 (0.0%) |
| 9:00 AM to 9:59 AM | 0 (0.0%) | 0 (0.0%) |
| 10:00 AM to 10:59 AM | 0 (0.0%) | 0 (0.0%) |
| 11:00 AM to 11:59 AM | 0 (0.0%) | 0 (0.0%) |
| 12:00 PM to 3:59 PM | 0 (0.0%) | 0 (0.0%) |
| 4:00 PM to 11:59 PM | 0 (0.0%) | 0 (0.0%) |
| Total | 43 (100.0%) | 20 (100.0%) |
Housing Occupancy in Silver Springs
Occupancy by Ownership in Silver Springs
Of the total 45 dwellings in Silver Springs, owner-occupied units account for 45 (100.0%), while renter-occupied units make up 0 (0.0%).
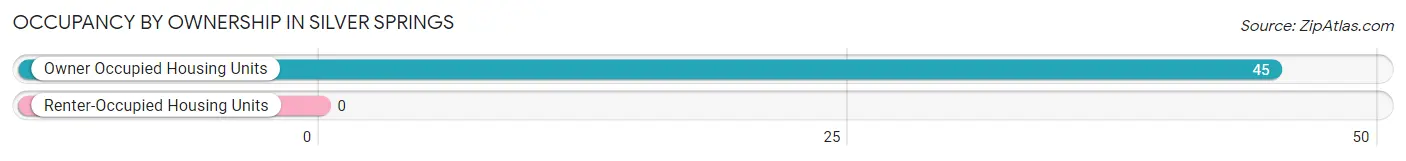
| Occupancy | # Housing Units | % Housing Units |
| Owner Occupied Housing Units | 45 | 100.0% |
| Renter-Occupied Housing Units | 0 | 0.0% |
| Total Occupied Housing Units | 45 | 100.0% |
Occupancy by Household Size in Silver Springs
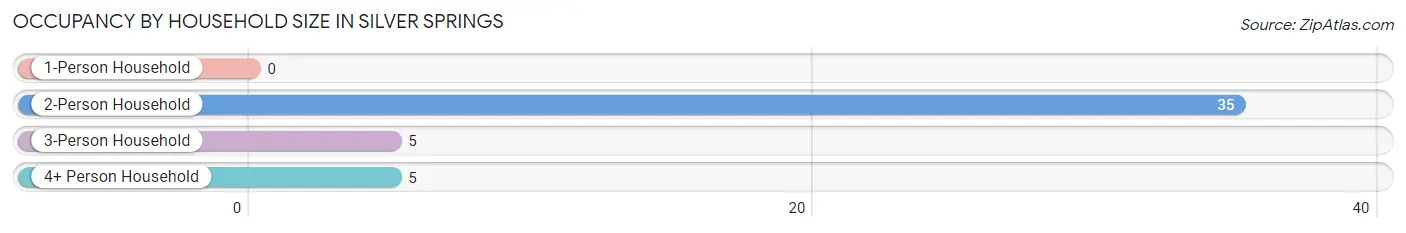
| Household Size | # Housing Units | % Housing Units |
| 1-Person Household | 0 | 0.0% |
| 2-Person Household | 35 | 77.8% |
| 3-Person Household | 5 | 11.1% |
| 4+ Person Household | 5 | 11.1% |
| Total Housing Units | 45 | 100.0% |
Occupancy by Ownership by Household Size in Silver Springs

| Household Size | Owner-occupied | Renter-occupied |
| 1-Person Household | 0 (0.0%) | 0 (0.0%) |
| 2-Person Household | 35 (100.0%) | 0 (0.0%) |
| 3-Person Household | 5 (100.0%) | 0 (0.0%) |
| 4+ Person Household | 5 (100.0%) | 0 (0.0%) |
| Total Housing Units | 45 (100.0%) | 0 (0.0%) |
Occupancy by Educational Attainment in Silver Springs
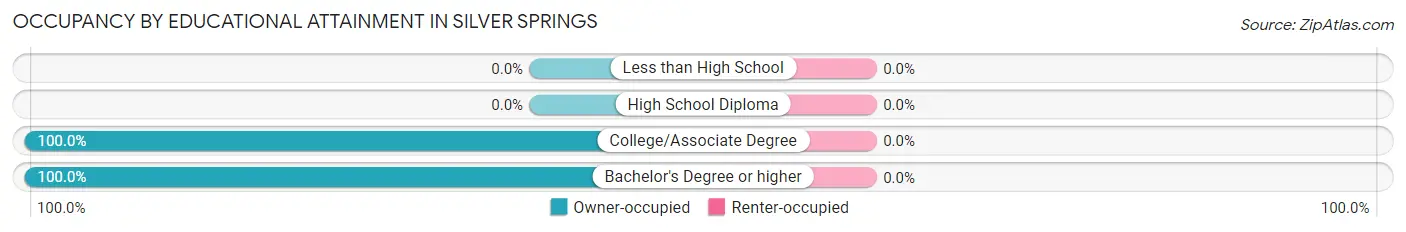
| Household Size | Owner-occupied | Renter-occupied |
| Less than High School | 0 (0.0%) | 0 (0.0%) |
| High School Diploma | 0 (0.0%) | 0 (0.0%) |
| College/Associate Degree | 28 (100.0%) | 0 (0.0%) |
| Bachelor's Degree or higher | 17 (100.0%) | 0 (0.0%) |
Occupancy by Age of Householder in Silver Springs
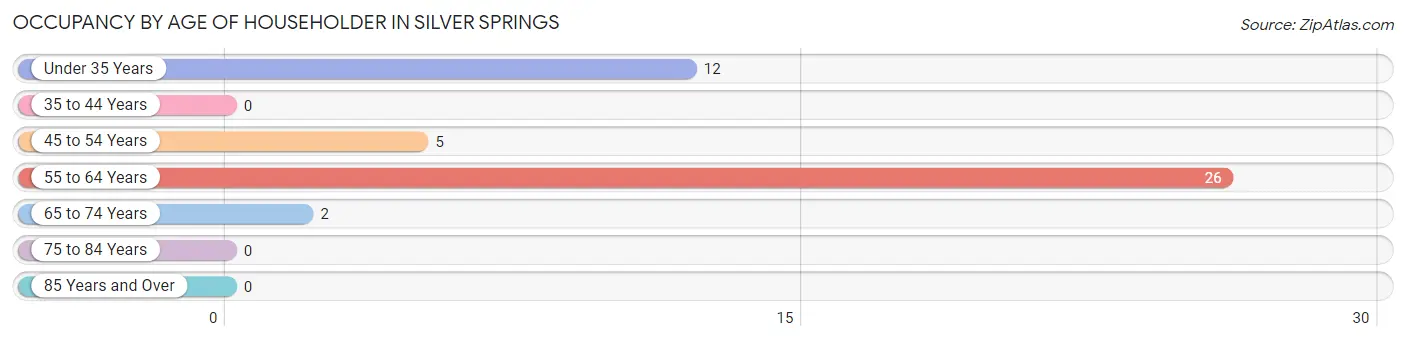
| Age Bracket | # Households | % Households |
| Under 35 Years | 12 | 26.7% |
| 35 to 44 Years | 0 | 0.0% |
| 45 to 54 Years | 5 | 11.1% |
| 55 to 64 Years | 26 | 57.8% |
| 65 to 74 Years | 2 | 4.4% |
| 75 to 84 Years | 0 | 0.0% |
| 85 Years and Over | 0 | 0.0% |
| Total | 45 | 100.0% |
Housing Finances in Silver Springs
Median Income by Occupancy in Silver Springs
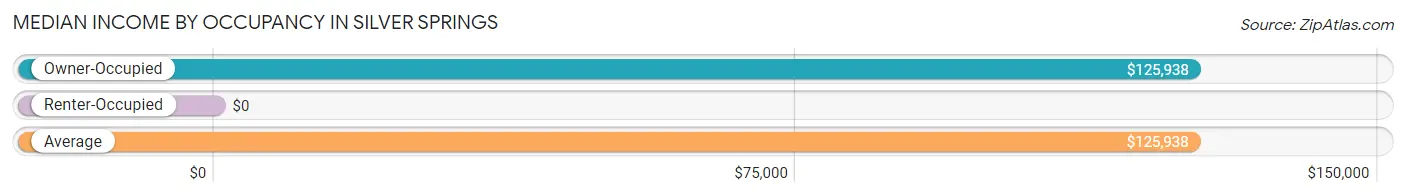
| Occupancy Type | # Households | Median Income |
| Owner-Occupied | 45 (100.0%) | $125,938 |
| Renter-Occupied | 0 (0.0%) | $0 |
| Average | 45 (100.0%) | $125,938 |
Occupancy by Householder Income Bracket in Silver Springs
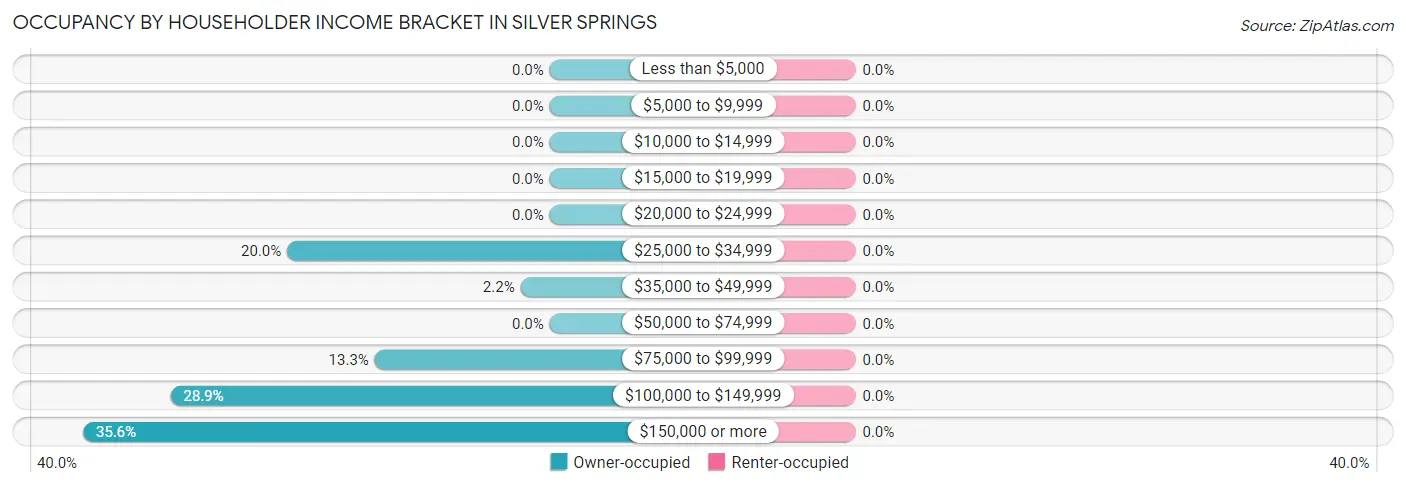
| Income Bracket | Owner-occupied | Renter-occupied |
| Less than $5,000 | 0 (0.0%) | 0 (0.0%) |
| $5,000 to $9,999 | 0 (0.0%) | 0 (0.0%) |
| $10,000 to $14,999 | 0 (0.0%) | 0 (0.0%) |
| $15,000 to $19,999 | 0 (0.0%) | 0 (0.0%) |
| $20,000 to $24,999 | 0 (0.0%) | 0 (0.0%) |
| $25,000 to $34,999 | 9 (20.0%) | 0 (0.0%) |
| $35,000 to $49,999 | 1 (2.2%) | 0 (0.0%) |
| $50,000 to $74,999 | 0 (0.0%) | 0 (0.0%) |
| $75,000 to $99,999 | 6 (13.3%) | 0 (0.0%) |
| $100,000 to $149,999 | 13 (28.9%) | 0 (0.0%) |
| $150,000 or more | 16 (35.6%) | 0 (0.0%) |
| Total | 45 (100.0%) | 0 (0.0%) |
Monthly Housing Cost Tiers in Silver Springs
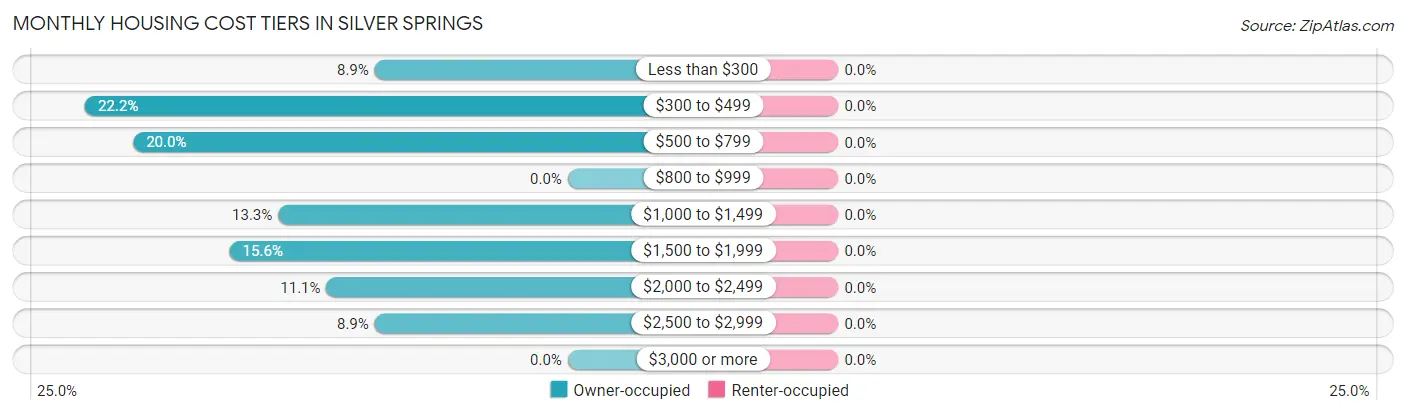
| Monthly Cost | Owner-occupied | Renter-occupied |
| Less than $300 | 4 (8.9%) | 0 (0.0%) |
| $300 to $499 | 10 (22.2%) | 0 (0.0%) |
| $500 to $799 | 9 (20.0%) | 0 (0.0%) |
| $800 to $999 | 0 (0.0%) | 0 (0.0%) |
| $1,000 to $1,499 | 6 (13.3%) | 0 (0.0%) |
| $1,500 to $1,999 | 7 (15.6%) | 0 (0.0%) |
| $2,000 to $2,499 | 5 (11.1%) | 0 (0.0%) |
| $2,500 to $2,999 | 4 (8.9%) | 0 (0.0%) |
| $3,000 or more | 0 (0.0%) | 0 (0.0%) |
| Total | 45 (100.0%) | 0 (0.0%) |
Physical Housing Characteristics in Silver Springs
Housing Structures in Silver Springs
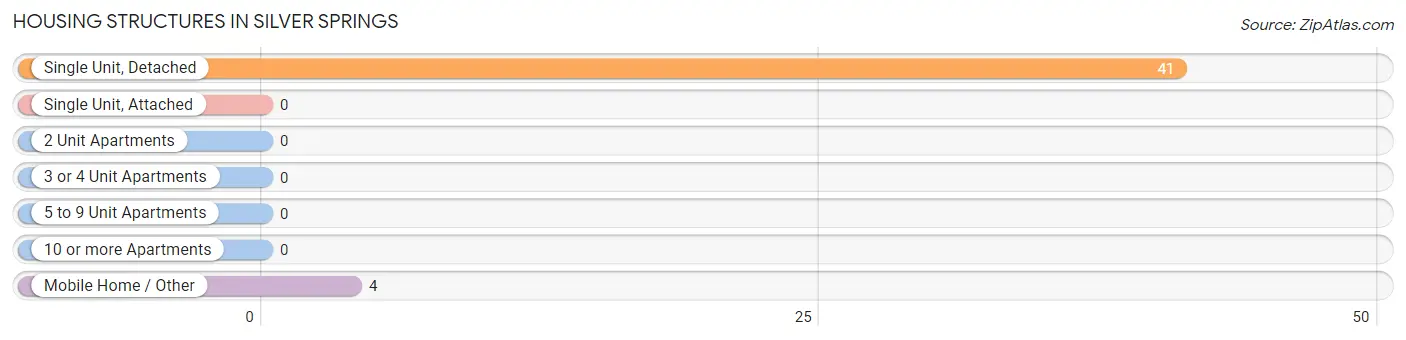
| Structure Type | # Housing Units | % Housing Units |
| Single Unit, Detached | 41 | 91.1% |
| Single Unit, Attached | 0 | 0.0% |
| 2 Unit Apartments | 0 | 0.0% |
| 3 or 4 Unit Apartments | 0 | 0.0% |
| 5 to 9 Unit Apartments | 0 | 0.0% |
| 10 or more Apartments | 0 | 0.0% |
| Mobile Home / Other | 4 | 8.9% |
| Total | 45 | 100.0% |
Housing Structures by Occupancy in Silver Springs
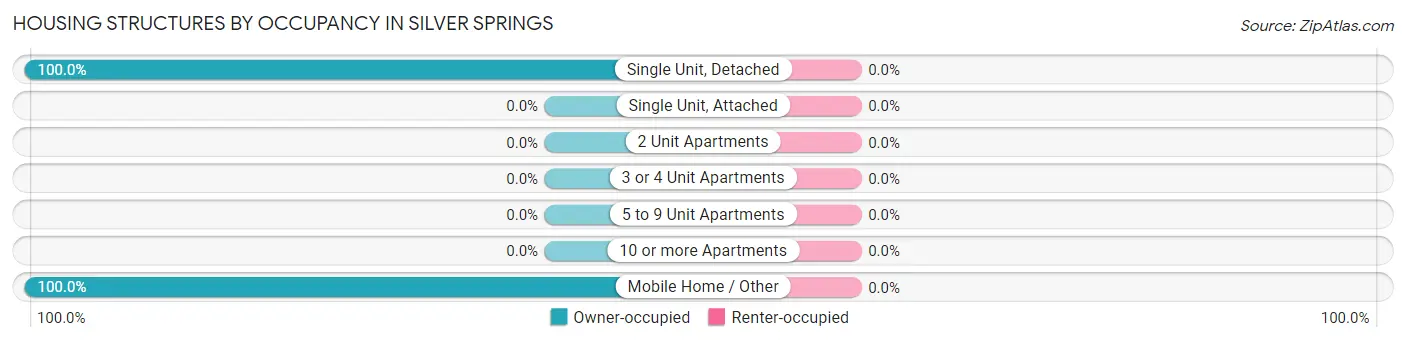
| Structure Type | Owner-occupied | Renter-occupied |
| Single Unit, Detached | 41 (100.0%) | 0 (0.0%) |
| Single Unit, Attached | 0 (0.0%) | 0 (0.0%) |
| 2 Unit Apartments | 0 (0.0%) | 0 (0.0%) |
| 3 or 4 Unit Apartments | 0 (0.0%) | 0 (0.0%) |
| 5 to 9 Unit Apartments | 0 (0.0%) | 0 (0.0%) |
| 10 or more Apartments | 0 (0.0%) | 0 (0.0%) |
| Mobile Home / Other | 4 (100.0%) | 0 (0.0%) |
| Total | 45 (100.0%) | 0 (0.0%) |
Housing Structures by Number of Rooms in Silver Springs
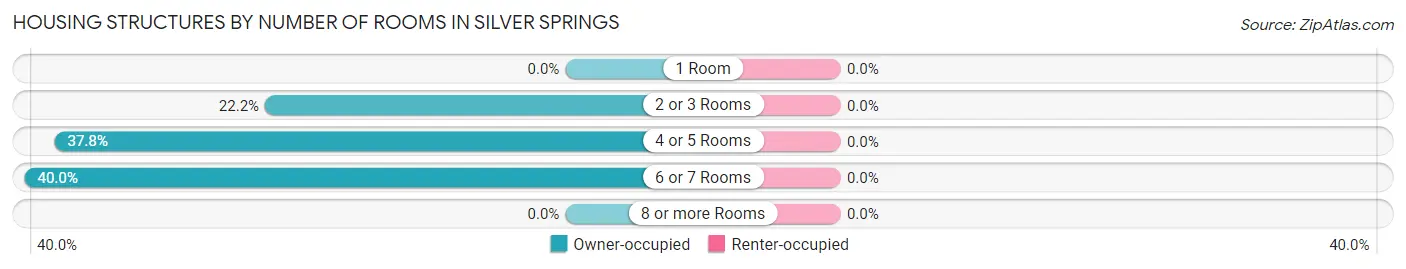
| Number of Rooms | Owner-occupied | Renter-occupied |
| 1 Room | 0 (0.0%) | 0 (0.0%) |
| 2 or 3 Rooms | 10 (22.2%) | 0 (0.0%) |
| 4 or 5 Rooms | 17 (37.8%) | 0 (0.0%) |
| 6 or 7 Rooms | 18 (40.0%) | 0 (0.0%) |
| 8 or more Rooms | 0 (0.0%) | 0 (0.0%) |
| Total | 45 (100.0%) | 0 (0.0%) |
Housing Structure by Heating Type in Silver Springs
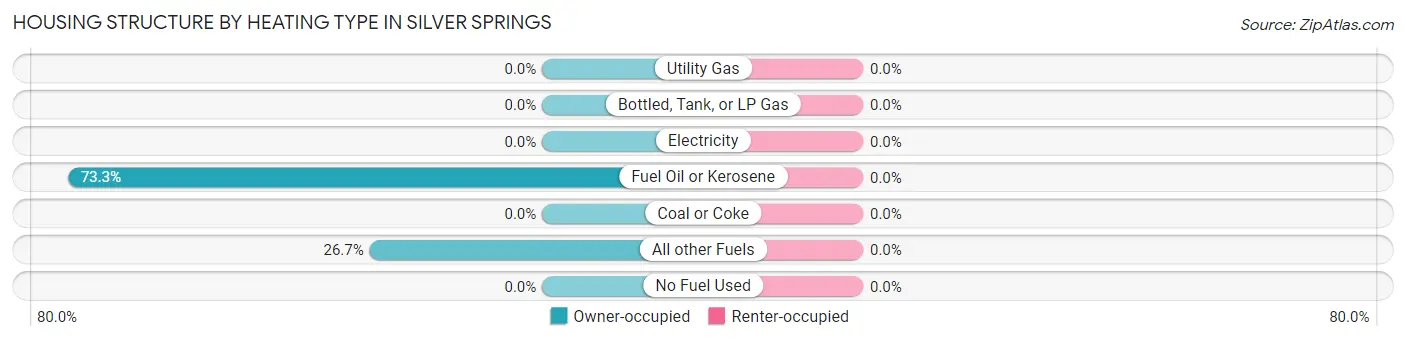
| Heating Type | Owner-occupied | Renter-occupied |
| Utility Gas | 0 (0.0%) | 0 (0.0%) |
| Bottled, Tank, or LP Gas | 0 (0.0%) | 0 (0.0%) |
| Electricity | 0 (0.0%) | 0 (0.0%) |
| Fuel Oil or Kerosene | 33 (73.3%) | 0 (0.0%) |
| Coal or Coke | 0 (0.0%) | 0 (0.0%) |
| All other Fuels | 12 (26.7%) | 0 (0.0%) |
| No Fuel Used | 0 (0.0%) | 0 (0.0%) |
| Total | 45 (100.0%) | 0 (0.0%) |
Household Vehicle Usage in Silver Springs
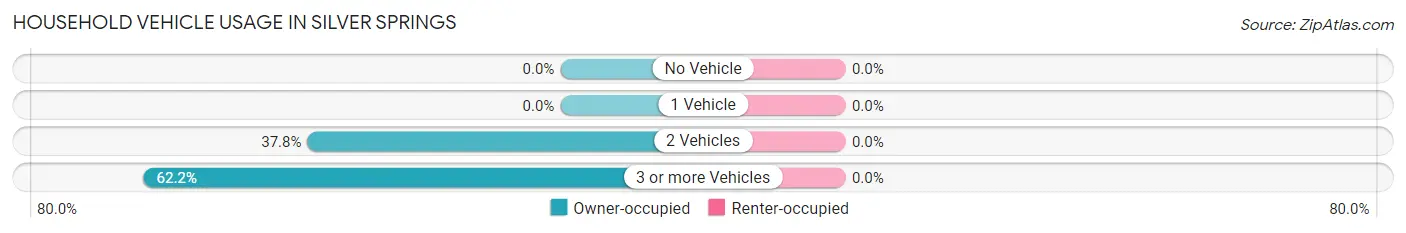
| Vehicles per Household | Owner-occupied | Renter-occupied |
| No Vehicle | 0 (0.0%) | 0 (0.0%) |
| 1 Vehicle | 0 (0.0%) | 0 (0.0%) |
| 2 Vehicles | 17 (37.8%) | 0 (0.0%) |
| 3 or more Vehicles | 28 (62.2%) | 0 (0.0%) |
| Total | 45 (100.0%) | 0 (0.0%) |
Real Estate & Mortgages in Silver Springs
Real Estate and Mortgage Overview in Silver Springs
| Characteristic | Without Mortgage | With Mortgage |
| Housing Units | 17 | 28 |
| Median Property Value | $206,300 | $268,800 |
| Median Household Income | $89,375 | $12 |
| Monthly Housing Costs | $431 | $0 |
| Real Estate Taxes | - | - |
Property Value by Mortgage Status in Silver Springs
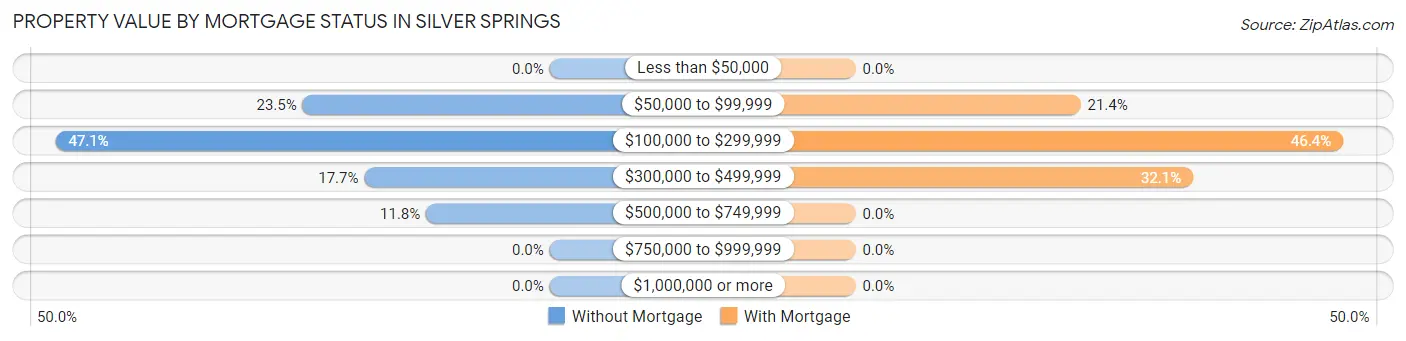
| Property Value | Without Mortgage | With Mortgage |
| Less than $50,000 | 0 (0.0%) | 0 (0.0%) |
| $50,000 to $99,999 | 4 (23.5%) | 6 (21.4%) |
| $100,000 to $299,999 | 8 (47.1%) | 13 (46.4%) |
| $300,000 to $499,999 | 3 (17.6%) | 9 (32.1%) |
| $500,000 to $749,999 | 2 (11.8%) | 0 (0.0%) |
| $750,000 to $999,999 | 0 (0.0%) | 0 (0.0%) |
| $1,000,000 or more | 0 (0.0%) | 0 (0.0%) |
| Total | 17 (100.0%) | 28 (100.0%) |
Household Income by Mortgage Status in Silver Springs
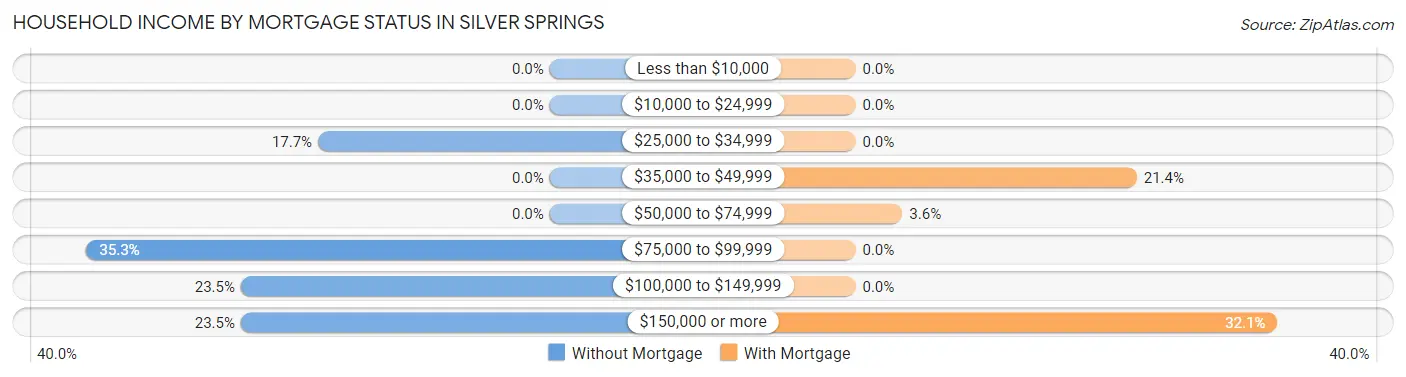
| Household Income | Without Mortgage | With Mortgage |
| Less than $10,000 | 0 (0.0%) | 0 (0.0%) |
| $10,000 to $24,999 | 0 (0.0%) | 0 (0.0%) |
| $25,000 to $34,999 | 3 (17.6%) | 0 (0.0%) |
| $35,000 to $49,999 | 0 (0.0%) | 6 (21.4%) |
| $50,000 to $74,999 | 0 (0.0%) | 1 (3.6%) |
| $75,000 to $99,999 | 6 (35.3%) | 0 (0.0%) |
| $100,000 to $149,999 | 4 (23.5%) | 0 (0.0%) |
| $150,000 or more | 4 (23.5%) | 9 (32.1%) |
| Total | 17 (100.0%) | 28 (100.0%) |
Property Value to Household Income Ratio in Silver Springs
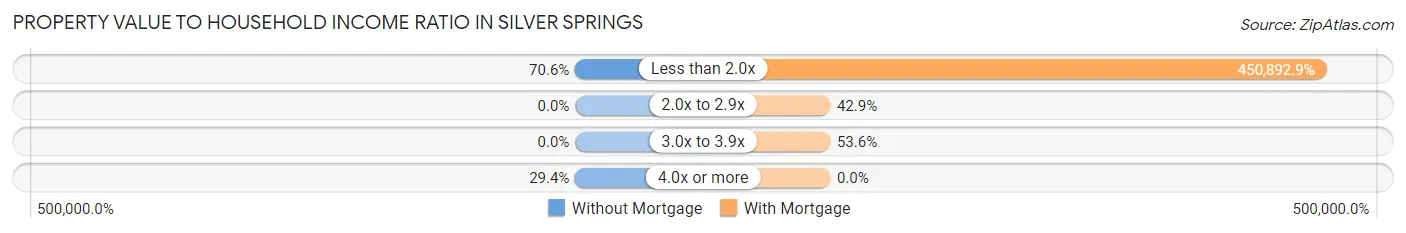
| Value-to-Income Ratio | Without Mortgage | With Mortgage |
| Less than 2.0x | 12 (70.6%) | 126,250 (450,892.9%) |
| 2.0x to 2.9x | 0 (0.0%) | 12 (42.9%) |
| 3.0x to 3.9x | 0 (0.0%) | 15 (53.6%) |
| 4.0x or more | 5 (29.4%) | 0 (0.0%) |
| Total | 17 (100.0%) | 28 (100.0%) |
Real Estate Taxes by Mortgage Status in Silver Springs
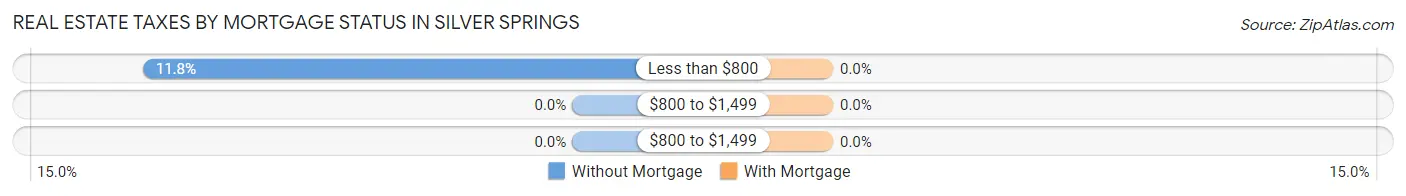
| Property Taxes | Without Mortgage | With Mortgage |
| Less than $800 | 2 (11.8%) | 0 (0.0%) |
| $800 to $1,499 | 0 (0.0%) | 0 (0.0%) |
| $800 to $1,499 | 0 (0.0%) | 0 (0.0%) |
| Total | 17 (100.0%) | 28 (100.0%) |
Health & Disability in Silver Springs
Health Insurance Coverage by Age in Silver Springs
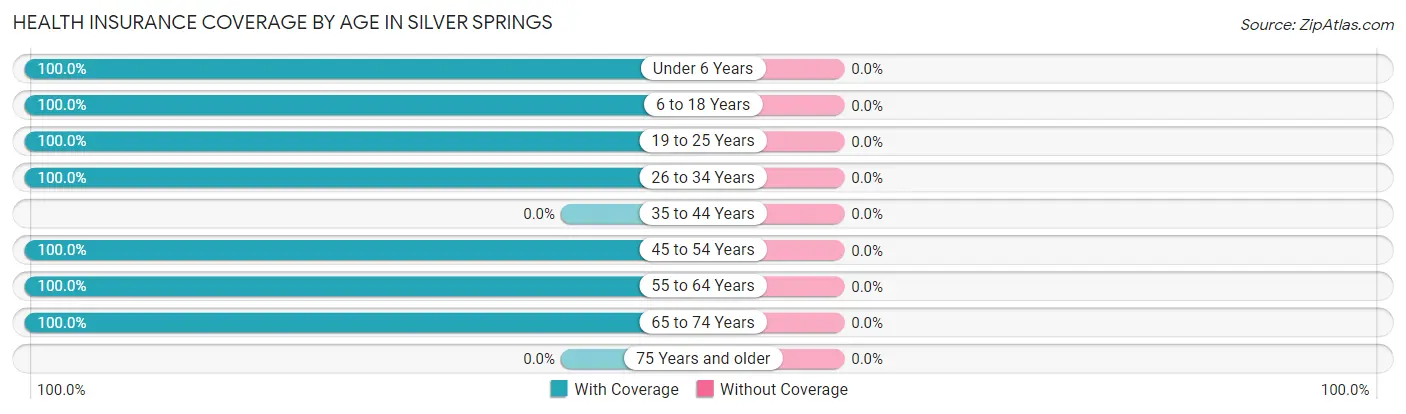
| Age Bracket | With Coverage | Without Coverage |
| Under 6 Years | 11 (100.0%) | 0 (0.0%) |
| 6 to 18 Years | 2 (100.0%) | 0 (0.0%) |
| 19 to 25 Years | 10 (100.0%) | 0 (0.0%) |
| 26 to 34 Years | 15 (100.0%) | 0 (0.0%) |
| 35 to 44 Years | 0 (0.0%) | 0 (0.0%) |
| 45 to 54 Years | 12 (100.0%) | 0 (0.0%) |
| 55 to 64 Years | 50 (100.0%) | 0 (0.0%) |
| 65 to 74 Years | 6 (100.0%) | 0 (0.0%) |
| 75 Years and older | 0 (0.0%) | 0 (0.0%) |
| Total | 106 (100.0%) | 0 (0.0%) |
Health Insurance Coverage by Citizenship Status in Silver Springs
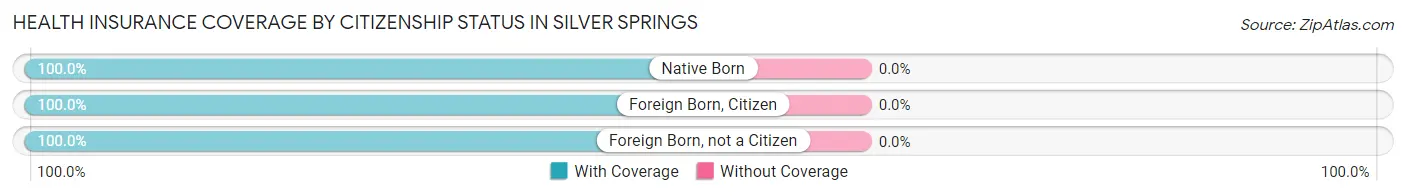
| Citizenship Status | With Coverage | Without Coverage |
| Native Born | 11 (100.0%) | 0 (0.0%) |
| Foreign Born, Citizen | 2 (100.0%) | 0 (0.0%) |
| Foreign Born, not a Citizen | 10 (100.0%) | 0 (0.0%) |
Health Insurance Coverage by Household Income in Silver Springs
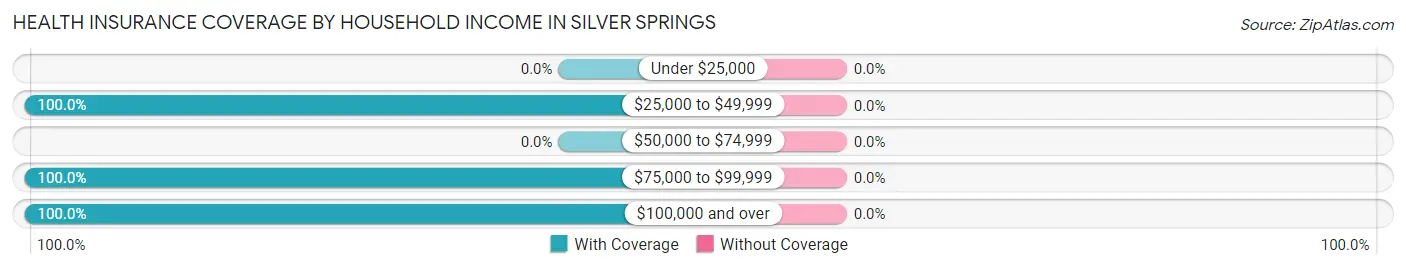
| Household Income | With Coverage | Without Coverage |
| Under $25,000 | 0 (0.0%) | 0 (0.0%) |
| $25,000 to $49,999 | 21 (100.0%) | 0 (0.0%) |
| $50,000 to $74,999 | 0 (0.0%) | 0 (0.0%) |
| $75,000 to $99,999 | 19 (100.0%) | 0 (0.0%) |
| $100,000 and over | 66 (100.0%) | 0 (0.0%) |
Public vs Private Health Insurance Coverage by Age in Silver Springs
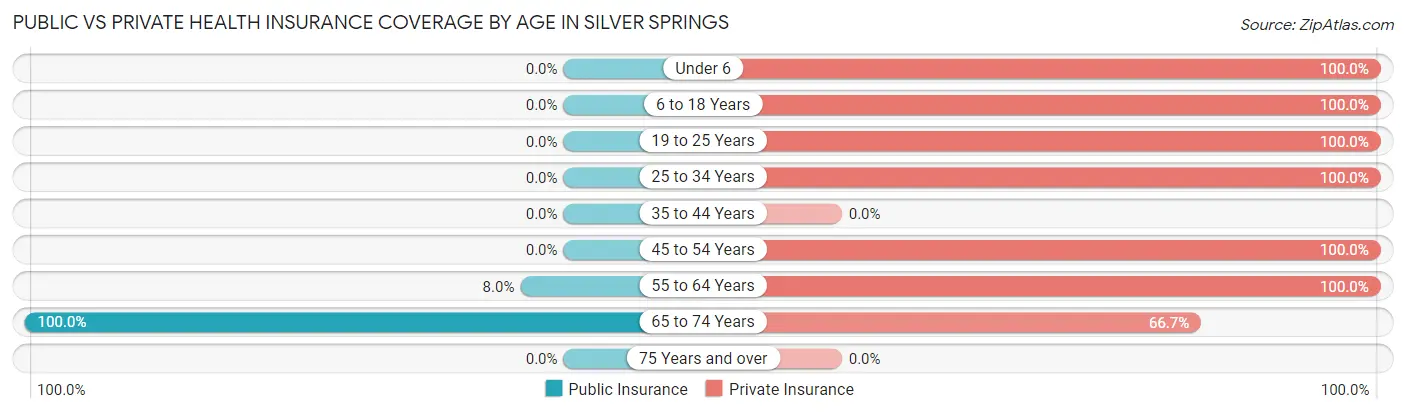
| Age Bracket | Public Insurance | Private Insurance |
| Under 6 | 0 (0.0%) | 11 (100.0%) |
| 6 to 18 Years | 0 (0.0%) | 2 (100.0%) |
| 19 to 25 Years | 0 (0.0%) | 10 (100.0%) |
| 25 to 34 Years | 0 (0.0%) | 15 (100.0%) |
| 35 to 44 Years | 0 (0.0%) | 0 (0.0%) |
| 45 to 54 Years | 0 (0.0%) | 12 (100.0%) |
| 55 to 64 Years | 4 (8.0%) | 50 (100.0%) |
| 65 to 74 Years | 6 (100.0%) | 4 (66.7%) |
| 75 Years and over | 0 (0.0%) | 0 (0.0%) |
| Total | 10 (9.4%) | 104 (98.1%) |
Disability Status by Sex by Age in Silver Springs
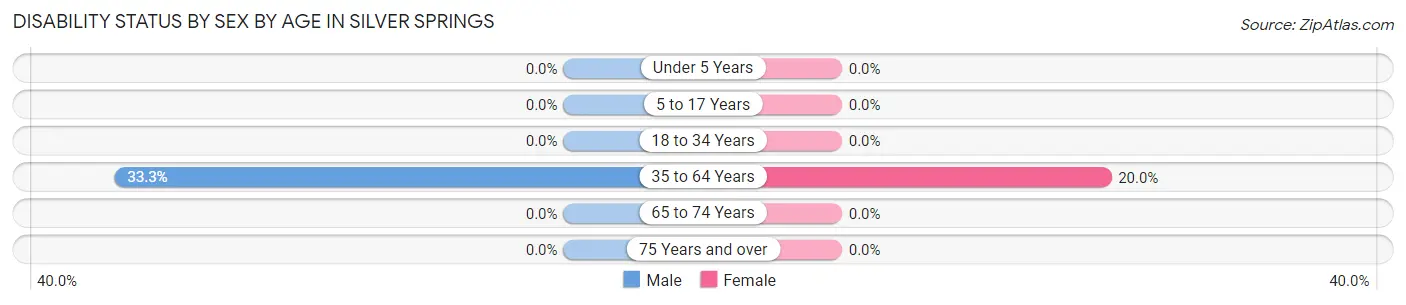
| Age Bracket | Male | Female |
| Under 5 Years | 0 (0.0%) | 0 (0.0%) |
| 5 to 17 Years | 0 (0.0%) | 0 (0.0%) |
| 18 to 34 Years | 0 (0.0%) | 0 (0.0%) |
| 35 to 64 Years | 14 (33.3%) | 4 (20.0%) |
| 65 to 74 Years | 0 (0.0%) | 0 (0.0%) |
| 75 Years and over | 0 (0.0%) | 0 (0.0%) |
Disability Class by Sex by Age in Silver Springs
Disability Class: Hearing Difficulty
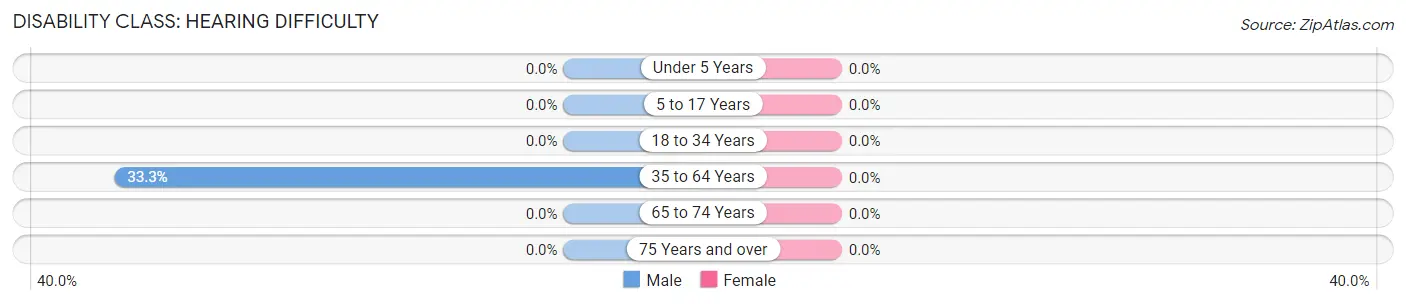
| Age Bracket | Male | Female |
| Under 5 Years | 0 (0.0%) | 0 (0.0%) |
| 5 to 17 Years | 0 (0.0%) | 0 (0.0%) |
| 18 to 34 Years | 0 (0.0%) | 0 (0.0%) |
| 35 to 64 Years | 14 (33.3%) | 0 (0.0%) |
| 65 to 74 Years | 0 (0.0%) | 0 (0.0%) |
| 75 Years and over | 0 (0.0%) | 0 (0.0%) |
Disability Class: Vision Difficulty
| Age Bracket | Male | Female |
| Under 5 Years | 0 (0.0%) | 0 (0.0%) |
| 5 to 17 Years | 0 (0.0%) | 0 (0.0%) |
| 18 to 34 Years | 0 (0.0%) | 0 (0.0%) |
| 35 to 64 Years | 0 (0.0%) | 0 (0.0%) |
| 65 to 74 Years | 0 (0.0%) | 0 (0.0%) |
| 75 Years and over | 0 (0.0%) | 0 (0.0%) |
Disability Class: Cognitive Difficulty
| Age Bracket | Male | Female |
| 5 to 17 Years | 0 (0.0%) | 0 (0.0%) |
| 18 to 34 Years | 0 (0.0%) | 0 (0.0%) |
| 35 to 64 Years | 0 (0.0%) | 4 (20.0%) |
| 65 to 74 Years | 0 (0.0%) | 0 (0.0%) |
| 75 Years and over | 0 (0.0%) | 0 (0.0%) |
Disability Class: Ambulatory Difficulty
| Age Bracket | Male | Female |
| 5 to 17 Years | 0 (0.0%) | 0 (0.0%) |
| 18 to 34 Years | 0 (0.0%) | 0 (0.0%) |
| 35 to 64 Years | 0 (0.0%) | 0 (0.0%) |
| 65 to 74 Years | 0 (0.0%) | 0 (0.0%) |
| 75 Years and over | 0 (0.0%) | 0 (0.0%) |
Disability Class: Self-Care Difficulty
| Age Bracket | Male | Female |
| 5 to 17 Years | 0 (0.0%) | 0 (0.0%) |
| 18 to 34 Years | 0 (0.0%) | 0 (0.0%) |
| 35 to 64 Years | 4 (9.5%) | 0 (0.0%) |
| 65 to 74 Years | 0 (0.0%) | 0 (0.0%) |
| 75 Years and over | 0 (0.0%) | 0 (0.0%) |
Technology Access in Silver Springs
Computing Device Access in Silver Springs
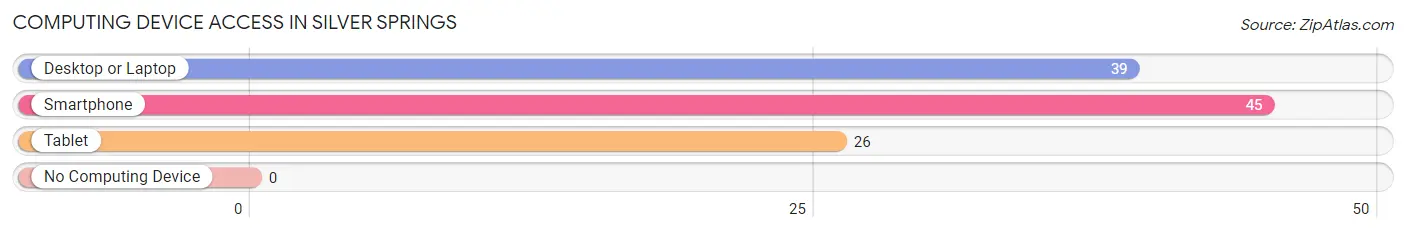
| Device Type | # Households | % Households |
| Desktop or Laptop | 39 | 86.7% |
| Smartphone | 45 | 100.0% |
| Tablet | 26 | 57.8% |
| No Computing Device | 0 | 0.0% |
| Total | 45 | 100.0% |
Internet Access in Silver Springs
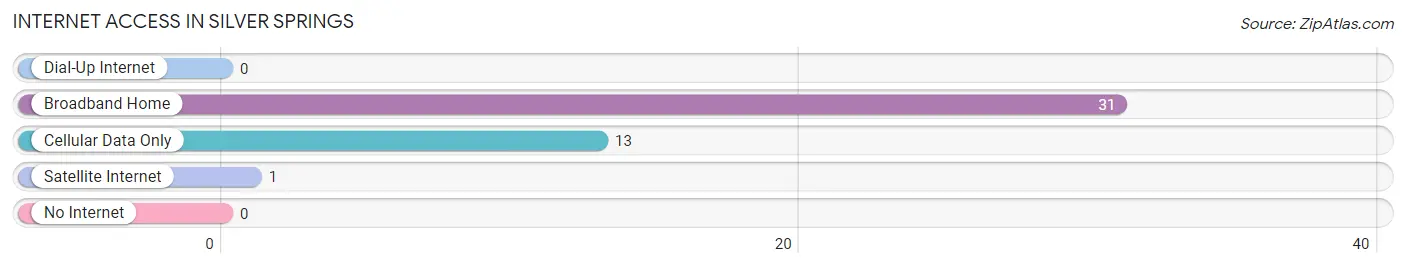
| Internet Type | # Households | % Households |
| Dial-Up Internet | 0 | 0.0% |
| Broadband Home | 31 | 68.9% |
| Cellular Data Only | 13 | 28.9% |
| Satellite Internet | 1 | 2.2% |
| No Internet | 0 | 0.0% |
| Total | 45 | 100.0% |
Silver Springs Summary
Introduction
Silver Springs is a small unincorporated community located in the Matanuska-Susitna Borough of Alaska. It is situated on the banks of the Susitna River, approximately 40 miles northeast of Anchorage. The community is home to a diverse population of approximately 500 people, and is known for its scenic beauty and outdoor recreation opportunities.
History
Silver Springs was first settled in the early 1900s by miners and trappers who were drawn to the area by the abundance of natural resources. The community was originally known as "Silver Springs Station" and was a stop on the Alaska Railroad. In the 1920s, the area was developed as a mining camp, and the population grew to over 500 people.
The community was officially incorporated in 1947, and the name was changed to Silver Springs. The town was home to a variety of businesses, including a general store, a post office, a hotel, and a sawmill. In the 1950s, the population began to decline as the mining industry declined and many of the residents moved away.
Geography
Silver Springs is located in the Matanuska-Susitna Borough of Alaska, approximately 40 miles northeast of Anchorage. The community is situated on the banks of the Susitna River, and is surrounded by the Talkeetna Mountains to the north and the Chugach Mountains to the south. The area is known for its scenic beauty, and is home to a variety of wildlife, including moose, bear, and bald eagles.
Economy
The economy of Silver Springs is largely based on tourism and outdoor recreation. The community is home to a variety of outdoor activities, including fishing, hunting, hiking, and camping. The area is also home to a number of small businesses, including a general store, a post office, and a hotel.
Demographics
As of the 2010 census, the population of Silver Springs was 498. The racial makeup of the community was 95.2% White, 0.6% Native American, 0.2% Asian, 0.2% Pacific Islander, 0.2% from other races, and 3.8% from two or more races. The median household income was $50,000, and the median age was 44.
Conclusion
Silver Springs is a small unincorporated community located in the Matanuska-Susitna Borough of Alaska. It is situated on the banks of the Susitna River, and is known for its scenic beauty and outdoor recreation opportunities. The population of Silver Springs is approximately 500 people, and the economy is largely based on tourism and outdoor recreation. The community is home to a variety of businesses, and is a popular destination for visitors from all over the world.
Common Questions
What is Per Capita Income in Silver Springs?
Per Capita income in Silver Springs is $67,402.
What is the Median Family Income in Silver Springs?
Median Family Income in Silver Springs is $125,938.
What is the Median Household income in Silver Springs?
Median Household Income in Silver Springs is $125,938.
What is Income or Wage Gap in Silver Springs?
Income or Wage Gap in Silver Springs is 33.4%.
Women in Silver Springs earn 66.6 cents for every dollar earned by a man.
What is Inequality or Gini Index in Silver Springs?
Inequality or Gini Index in Silver Springs is 0.35.
What is the Total Population of Silver Springs?
Total Population of Silver Springs is 106.
What is the Total Male Population of Silver Springs?
Total Male Population of Silver Springs is 64.
What is the Total Female Population of Silver Springs?
Total Female Population of Silver Springs is 42.
What is the Ratio of Males per 100 Females in Silver Springs?
There are 152.38 Males per 100 Females in Silver Springs.
What is the Ratio of Females per 100 Males in Silver Springs?
There are 65.62 Females per 100 Males in Silver Springs.
What is the Median Population Age in Silver Springs?
Median Population Age in Silver Springs is 55.8 Years.
What is the Average Family Size in Silver Springs
Average Family Size in Silver Springs is 2.4 People.
What is the Average Household Size in Silver Springs
Average Household Size in Silver Springs is 2.4 People.
How Large is the Labor Force in Silver Springs?
There are 67 People in the Labor Forcein in Silver Springs.
What is the Percentage of People in the Labor Force in Silver Springs?
70.5% of People are in the Labor Force in Silver Springs.