Kongiganak, AK Map & Demographics
Kongiganak Map
Kongiganak Overview
$10,137
PER CAPITA INCOME
$66,250
AVG FAMILY INCOME
$60,938
AVG HOUSEHOLD INCOME
0.33
INEQUALITY / GINI INDEX
353
TOTAL POPULATION
215
MALE POPULATION
138
FEMALE POPULATION
155.80
MALES / 100 FEMALES
64.19
FEMALES / 100 MALES
25.3
MEDIAN AGE
6.1
AVG FAMILY SIZE
5.4
AVG HOUSEHOLD SIZE
114
LABOR FORCE [ PEOPLE ]
50.0%
PERCENT IN LABOR FORCE
21.9%
UNEMPLOYMENT RATE
Kongiganak Area Codes
Income in Kongiganak
Income Overview in Kongiganak
Per Capita Income in Kongiganak is $10,137, while median incomes of families and households are $66,250 and $60,938 respectively.
| Characteristic | Number | Measure |
| Per Capita Income | 353 | $10,137 |
| Median Family Income | 55 | $66,250 |
| Mean Family Income | 55 | $61,120 |
| Median Household Income | 65 | $60,938 |
| Mean Household Income | 65 | $54,552 |
| Income Deficit | 55 | $0 |
| Wage / Income Gap (%) | 353 | 0.00% |
| Wage / Income Gap ($) | 353 | 100.00¢ per $1 |
| Gini / Inequality Index | 353 | 0.33 |
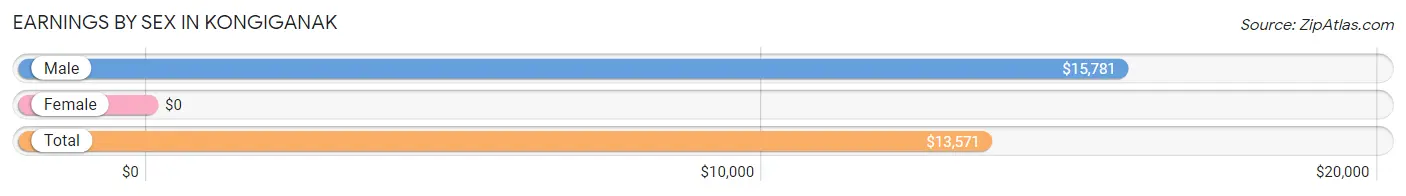
Earnings by Sex in Kongiganak
| Sex | Number | Average Earnings |
| Male | 95 (69.9%) | $15,781 |
| Female | 41 (30.1%) | $0 |
| Total | 136 (100.0%) | $13,571 |
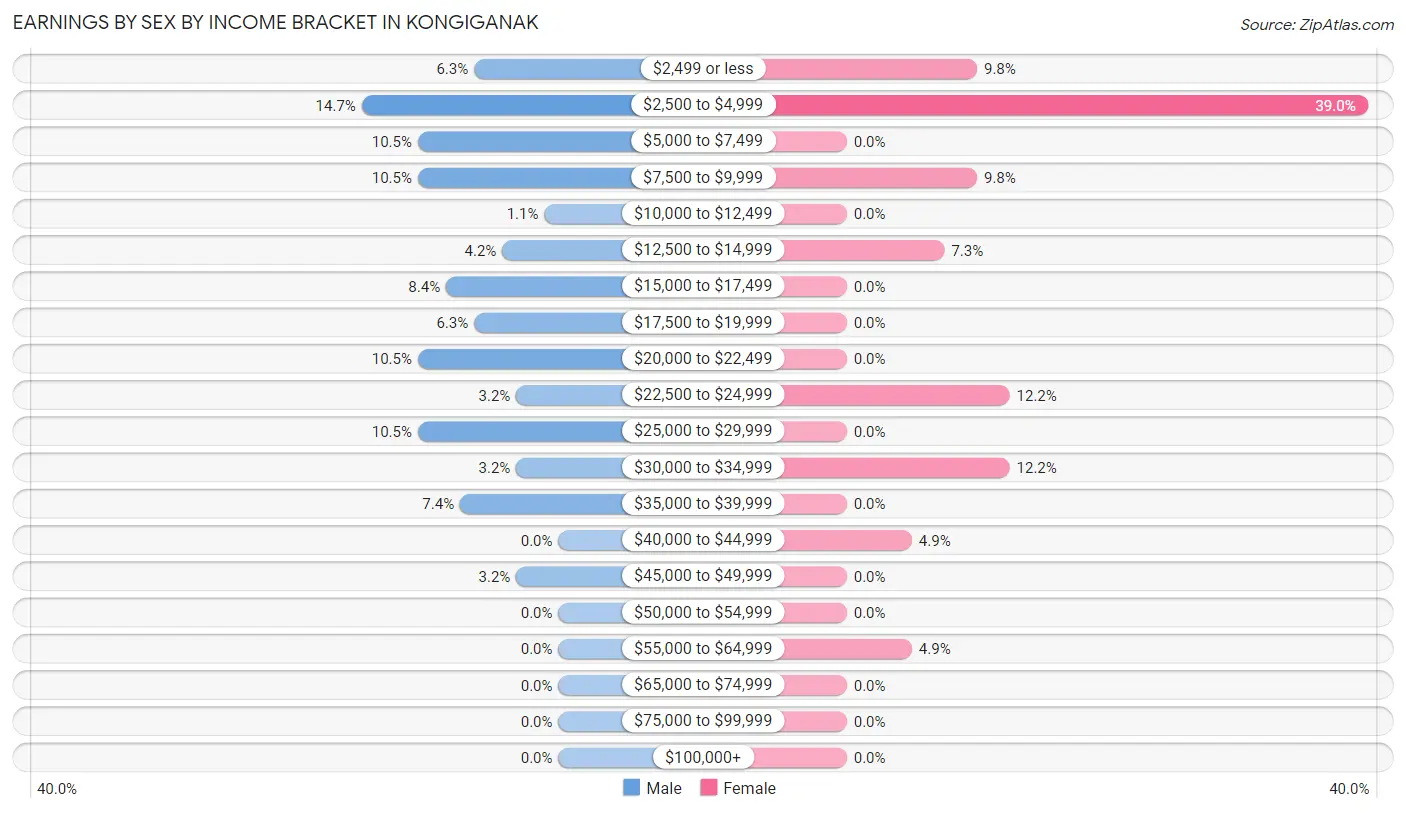
Earnings by Sex by Income Bracket in Kongiganak
The most common earnings brackets in Kongiganak are $2,500 to $4,999 for men (14 | 14.7%) and $2,500 to $4,999 for women (16 | 39.0%).
| Income | Male | Female |
| $2,499 or less | 6 (6.3%) | 4 (9.8%) |
| $2,500 to $4,999 | 14 (14.7%) | 16 (39.0%) |
| $5,000 to $7,499 | 10 (10.5%) | 0 (0.0%) |
| $7,500 to $9,999 | 10 (10.5%) | 4 (9.8%) |
| $10,000 to $12,499 | 1 (1.1%) | 0 (0.0%) |
| $12,500 to $14,999 | 4 (4.2%) | 3 (7.3%) |
| $15,000 to $17,499 | 8 (8.4%) | 0 (0.0%) |
| $17,500 to $19,999 | 6 (6.3%) | 0 (0.0%) |
| $20,000 to $22,499 | 10 (10.5%) | 0 (0.0%) |
| $22,500 to $24,999 | 3 (3.2%) | 5 (12.2%) |
| $25,000 to $29,999 | 10 (10.5%) | 0 (0.0%) |
| $30,000 to $34,999 | 3 (3.2%) | 5 (12.2%) |
| $35,000 to $39,999 | 7 (7.4%) | 0 (0.0%) |
| $40,000 to $44,999 | 0 (0.0%) | 2 (4.9%) |
| $45,000 to $49,999 | 3 (3.2%) | 0 (0.0%) |
| $50,000 to $54,999 | 0 (0.0%) | 0 (0.0%) |
| $55,000 to $64,999 | 0 (0.0%) | 2 (4.9%) |
| $65,000 to $74,999 | 0 (0.0%) | 0 (0.0%) |
| $75,000 to $99,999 | 0 (0.0%) | 0 (0.0%) |
| $100,000+ | 0 (0.0%) | 0 (0.0%) |
| Total | 95 (100.0%) | 41 (100.0%) |
Earnings by Sex by Educational Attainment in Kongiganak

| Educational Attainment | Male Income | Female Income |
| Less than High School | $12,500 | $0 |
| High School Diploma | $17,250 | $9,375 |
| College or Associate's Degree | $26,250 | $40,625 |
| Bachelor's Degree | - | - |
| Graduate Degree | - | - |
| Total | $17,708 | $0 |
Family Income in Kongiganak
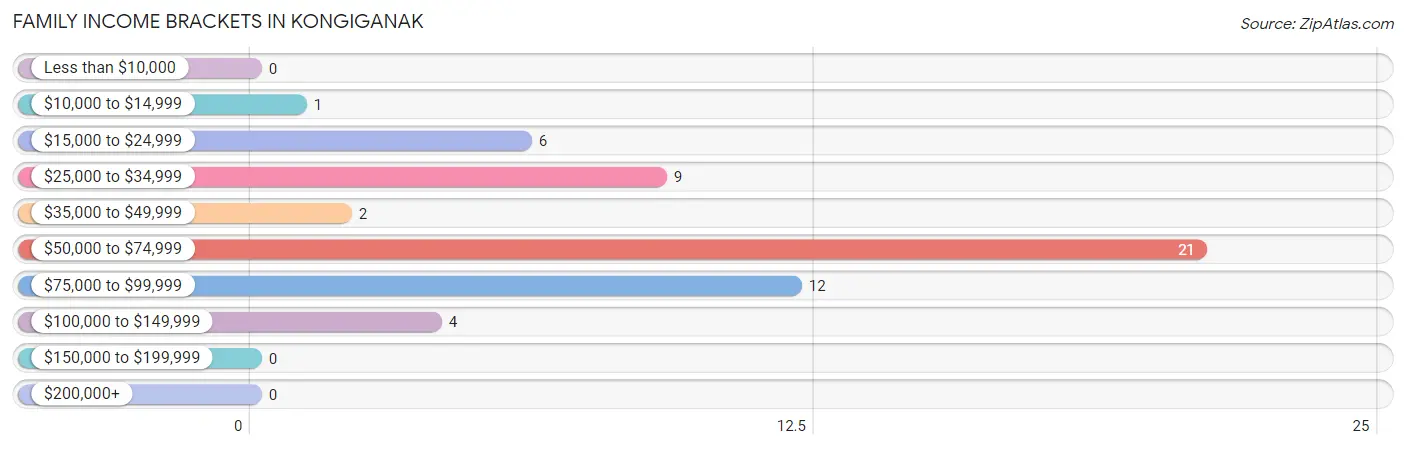
Family Income Brackets in Kongiganak
According to the Kongiganak family income data, there are 21 families falling into the $50,000 to $74,999 income range, which is the most common income bracket and makes up 38.2% of all families.
| Income Bracket | # Families | % Families |
| Less than $10,000 | 0 | 0.0% |
| $10,000 to $14,999 | 1 | 1.8% |
| $15,000 to $24,999 | 6 | 10.9% |
| $25,000 to $34,999 | 9 | 16.4% |
| $35,000 to $49,999 | 2 | 3.6% |
| $50,000 to $74,999 | 21 | 38.2% |
| $75,000 to $99,999 | 12 | 21.8% |
| $100,000 to $149,999 | 4 | 7.3% |
| $150,000 to $199,999 | 0 | 0.0% |
| $200,000+ | 0 | 0.0% |
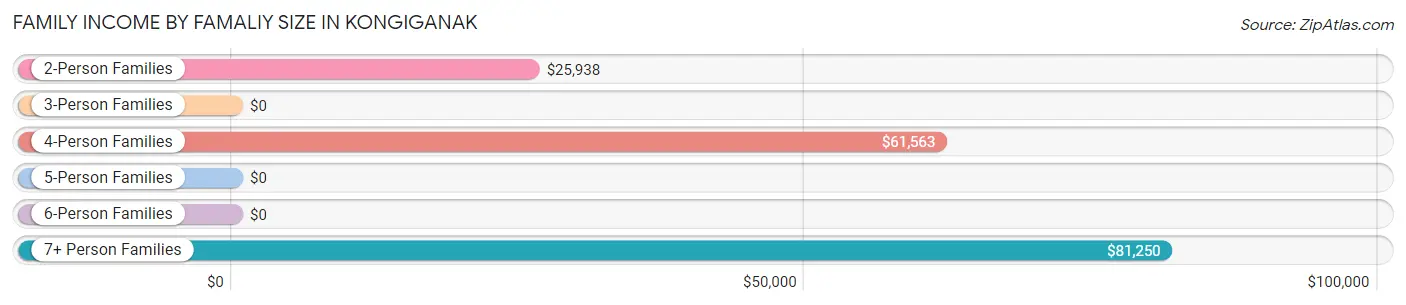
Family Income by Famaliy Size in Kongiganak
7+ person families (20 | 36.4%) account for the highest median family income in Kongiganak with $81,250 per family, while 4-person families (15 | 27.3%) have the highest median income of $15,391 per family member.
| Income Bracket | # Families | Median Income |
| 2-Person Families | 9 (16.4%) | $25,938 |
| 3-Person Families | 0 (0.0%) | $0 |
| 4-Person Families | 15 (27.3%) | $61,563 |
| 5-Person Families | 6 (10.9%) | $0 |
| 6-Person Families | 5 (9.1%) | $0 |
| 7+ Person Families | 20 (36.4%) | $81,250 |
| Total | 55 (100.0%) | $66,250 |
Family Income by Number of Earners in Kongiganak
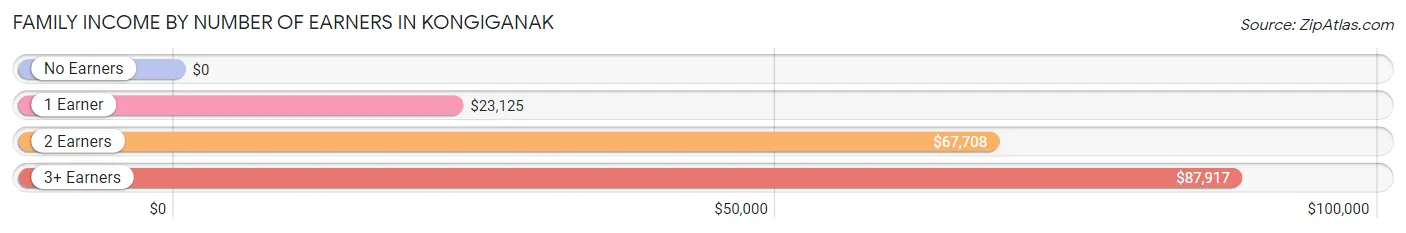
| Number of Earners | # Families | Median Income |
| No Earners | 8 (14.5%) | $0 |
| 1 Earner | 11 (20.0%) | $23,125 |
| 2 Earners | 17 (30.9%) | $67,708 |
| 3+ Earners | 19 (34.5%) | $87,917 |
| Total | 55 (100.0%) | $66,250 |
Household Income in Kongiganak
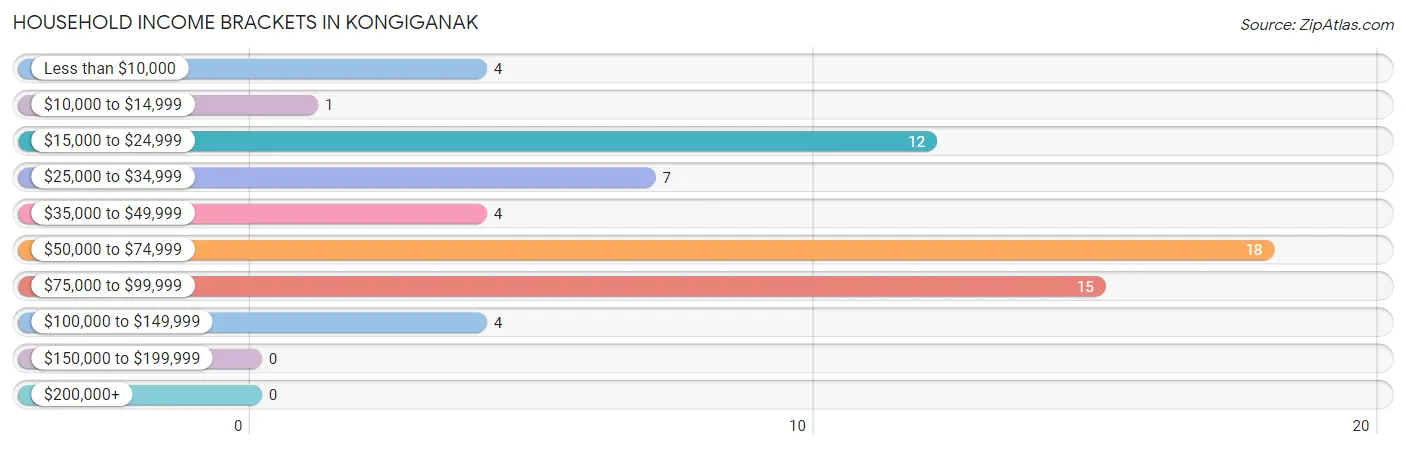
Household Income Brackets in Kongiganak
With 18 households falling in the category, the $50,000 to $74,999 income range is the most frequent in Kongiganak, accounting for 27.7% of all households.
| Income Bracket | # Households | % Households |
| Less than $10,000 | 4 | 6.2% |
| $10,000 to $14,999 | 1 | 1.5% |
| $15,000 to $24,999 | 12 | 18.5% |
| $25,000 to $34,999 | 7 | 10.8% |
| $35,000 to $49,999 | 4 | 6.2% |
| $50,000 to $74,999 | 18 | 27.7% |
| $75,000 to $99,999 | 15 | 23.1% |
| $100,000 to $149,999 | 4 | 6.2% |
| $150,000 to $199,999 | 0 | 0.0% |
| $200,000+ | 0 | 0.0% |
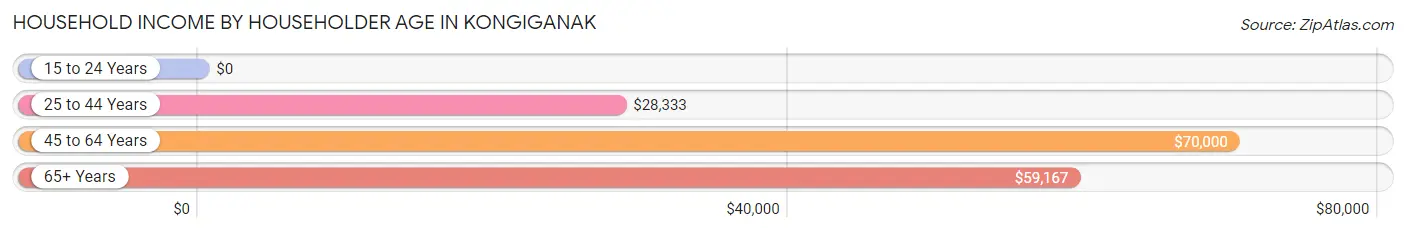
Household Income by Householder Age in Kongiganak
The median household income in Kongiganak is $60,938, with the highest median household income of $70,000 found in the 45 to 64 years age bracket for the primary householder. A total of 38 households (58.5%) fall into this category. Meanwhile, the 15 to 24 years age bracket for the primary householder has the lowest median household income of $0, with 3 households (4.6%) in this group.
| Income Bracket | # Households | Median Income |
| 15 to 24 Years | 3 (4.6%) | $0 |
| 25 to 44 Years | 12 (18.5%) | $28,333 |
| 45 to 64 Years | 38 (58.5%) | $70,000 |
| 65+ Years | 12 (18.5%) | $59,167 |
| Total | 65 (100.0%) | $60,938 |
Poverty in Kongiganak
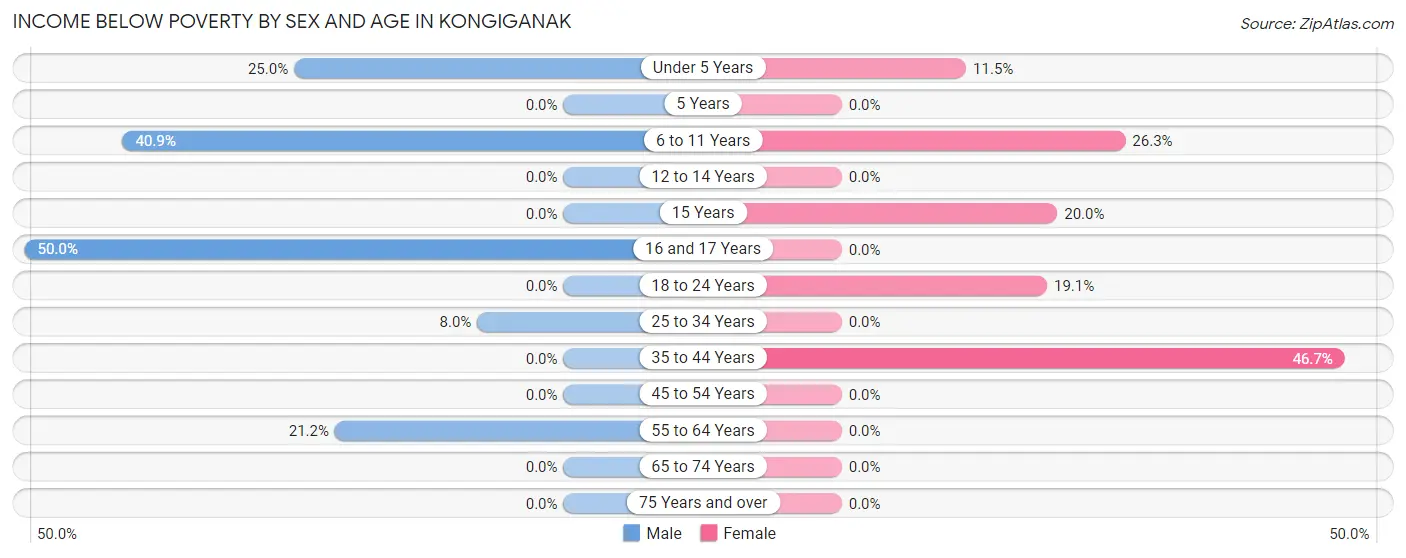
Income Below Poverty by Sex and Age in Kongiganak
With 12.6% poverty level for males and 14.5% for females among the residents of Kongiganak, 16 and 17 year old males and 35 to 44 year old females are the most vulnerable to poverty, with 3 males (50.0%) and 7 females (46.7%) in their respective age groups living below the poverty level.
| Age Bracket | Male | Female |
| Under 5 Years | 4 (25.0%) | 3 (11.5%) |
| 5 Years | 0 (0.0%) | 0 (0.0%) |
| 6 to 11 Years | 9 (40.9%) | 5 (26.3%) |
| 12 to 14 Years | 0 (0.0%) | 0 (0.0%) |
| 15 Years | 0 (0.0%) | 1 (20.0%) |
| 16 and 17 Years | 3 (50.0%) | 0 (0.0%) |
| 18 to 24 Years | 0 (0.0%) | 4 (19.1%) |
| 25 to 34 Years | 4 (8.0%) | 0 (0.0%) |
| 35 to 44 Years | 0 (0.0%) | 7 (46.7%) |
| 45 to 54 Years | 0 (0.0%) | 0 (0.0%) |
| 55 to 64 Years | 7 (21.2%) | 0 (0.0%) |
| 65 to 74 Years | 0 (0.0%) | 0 (0.0%) |
| 75 Years and over | 0 (0.0%) | 0 (0.0%) |
| Total | 27 (12.6%) | 20 (14.5%) |
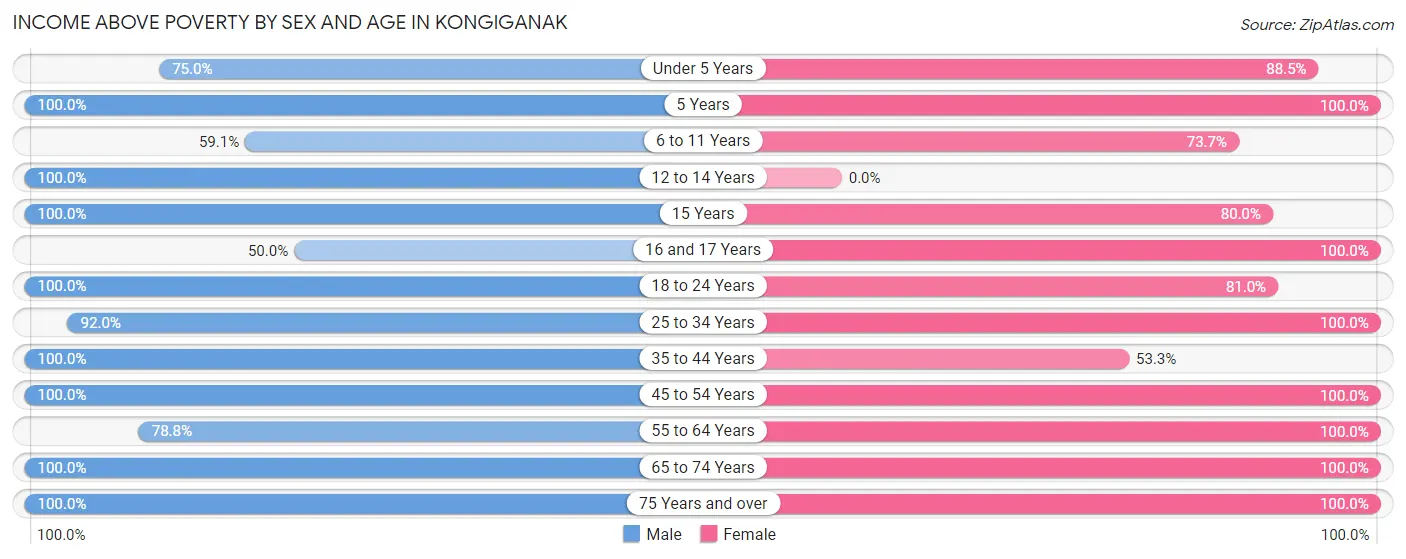
Income Above Poverty by Sex and Age in Kongiganak
According to the poverty statistics in Kongiganak, males aged 5 years and females aged 5 years are the age groups that are most secure financially, with 100.0% of males and 100.0% of females in these age groups living above the poverty line.
| Age Bracket | Male | Female |
| Under 5 Years | 12 (75.0%) | 23 (88.5%) |
| 5 Years | 16 (100.0%) | 4 (100.0%) |
| 6 to 11 Years | 13 (59.1%) | 14 (73.7%) |
| 12 to 14 Years | 13 (100.0%) | 0 (0.0%) |
| 15 Years | 4 (100.0%) | 4 (80.0%) |
| 16 and 17 Years | 3 (50.0%) | 3 (100.0%) |
| 18 to 24 Years | 20 (100.0%) | 17 (80.9%) |
| 25 to 34 Years | 46 (92.0%) | 8 (100.0%) |
| 35 to 44 Years | 16 (100.0%) | 8 (53.3%) |
| 45 to 54 Years | 6 (100.0%) | 11 (100.0%) |
| 55 to 64 Years | 26 (78.8%) | 14 (100.0%) |
| 65 to 74 Years | 7 (100.0%) | 8 (100.0%) |
| 75 Years and over | 6 (100.0%) | 4 (100.0%) |
| Total | 188 (87.4%) | 118 (85.5%) |
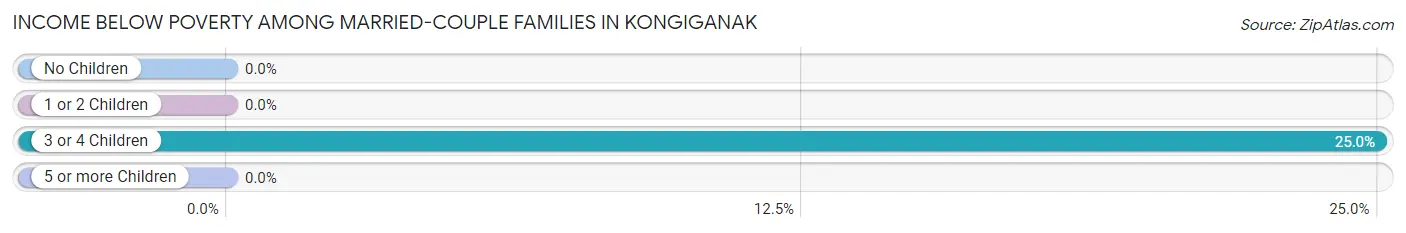
Income Below Poverty Among Married-Couple Families in Kongiganak
The poverty statistics for married-couple families in Kongiganak show that 8.3% or 3 of the total 36 families live below the poverty line. Families with 3 or 4 children have the highest poverty rate of 25.0%, comprising of 3 families. On the other hand, families with no children have the lowest poverty rate of 0.0%, which includes 0 families.
| Children | Above Poverty | Below Poverty |
| No Children | 4 (100.0%) | 0 (0.0%) |
| 1 or 2 Children | 17 (100.0%) | 0 (0.0%) |
| 3 or 4 Children | 9 (75.0%) | 3 (25.0%) |
| 5 or more Children | 3 (100.0%) | 0 (0.0%) |
| Total | 33 (91.7%) | 3 (8.3%) |
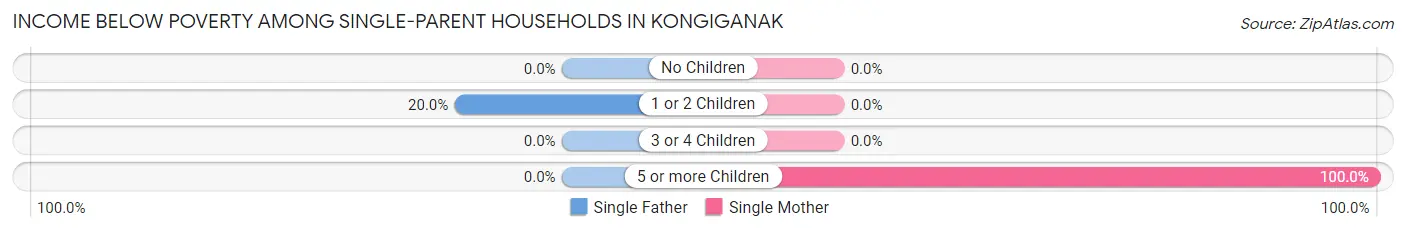
Income Below Poverty Among Single-Parent Households in Kongiganak
According to the poverty data in Kongiganak, 11.1% or 1 single-father households and 40.0% or 4 single-mother households are living below the poverty line. Among single-father households, those with 1 or 2 children have the highest poverty rate, with 1 households (20.0%) experiencing poverty. Likewise, among single-mother households, those with 5 or more children have the highest poverty rate, with 4 households (100.0%) falling below the poverty line.
| Children | Single Father | Single Mother |
| No Children | 0 (0.0%) | 0 (0.0%) |
| 1 or 2 Children | 1 (20.0%) | 0 (0.0%) |
| 3 or 4 Children | 0 (0.0%) | 0 (0.0%) |
| 5 or more Children | 0 (0.0%) | 4 (100.0%) |
| Total | 1 (11.1%) | 4 (40.0%) |
Income Below Poverty Among Married-Couple vs Single-Parent Households in Kongiganak
The poverty data for Kongiganak shows that 3 of the married-couple family households (8.3%) and 5 of the single-parent households (26.3%) are living below the poverty level. Within the married-couple family households, those with 3 or 4 children have the highest poverty rate, with 3 households (25.0%) falling below the poverty line. Among the single-parent households, those with 5 or more children have the highest poverty rate, with 4 household (100.0%) living below poverty.
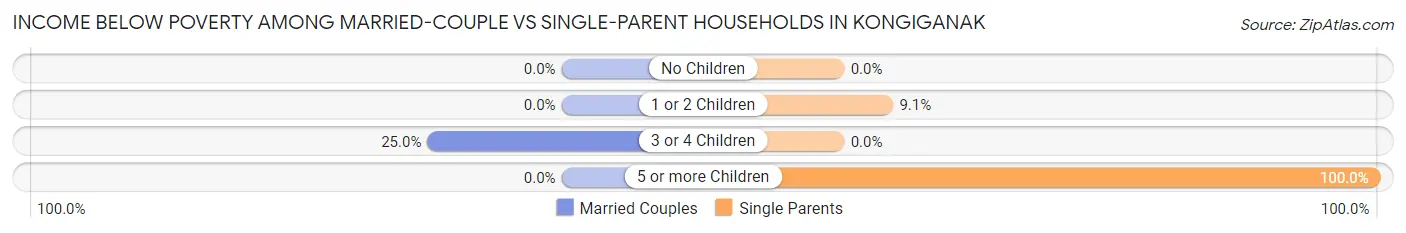
| Children | Married-Couple Families | Single-Parent Households |
| No Children | 0 (0.0%) | 0 (0.0%) |
| 1 or 2 Children | 0 (0.0%) | 1 (9.1%) |
| 3 or 4 Children | 3 (25.0%) | 0 (0.0%) |
| 5 or more Children | 0 (0.0%) | 4 (100.0%) |
| Total | 3 (8.3%) | 5 (26.3%) |
Race in Kongiganak
The most populous races in Kongiganak are Native / Alaskan (348 | 98.6%), and Two or more Races (5 | 1.4%).
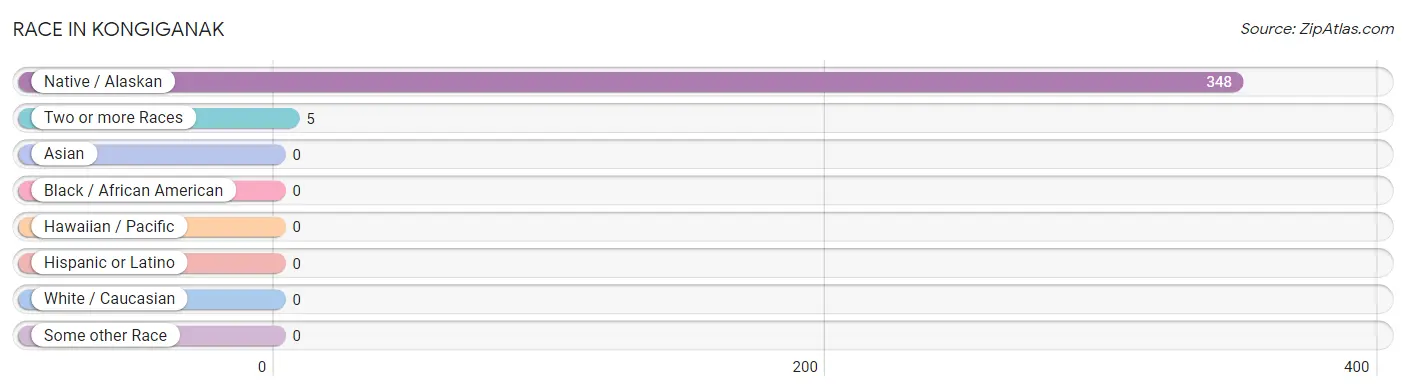
| Race | # Population | % Population |
| Asian | 0 | 0.0% |
| Black / African American | 0 | 0.0% |
| Hawaiian / Pacific | 0 | 0.0% |
| Hispanic or Latino | 0 | 0.0% |
| Native / Alaskan | 348 | 98.6% |
| White / Caucasian | 0 | 0.0% |
| Two or more Races | 5 | 1.4% |
| Some other Race | 0 | 0.0% |
| Total | 353 | 100.0% |
Ancestry in Kongiganak
The most populous ancestries reported in Kongiganak are Yup'ik (351 | 99.4%), and Aleut (2 | 0.6%), together accounting for 100.0% of all Kongiganak residents.
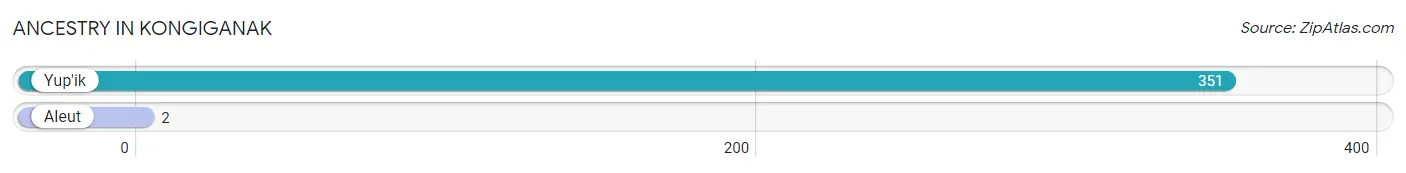
| Ancestry | # Population | % Population |
| Aleut | 2 | 0.6% |
| Yup'ik | 351 | 99.4% | View All 2 Rows |
Immigrants in Kongiganak

| Immigration Origin | # Population | % Population | View All 0 Rows |
Sex and Age in Kongiganak
Sex and Age in Kongiganak
The most populous age groups in Kongiganak are 25 to 29 Years (33 | 15.3%) for men and Under 5 Years (26 | 18.8%) for women.
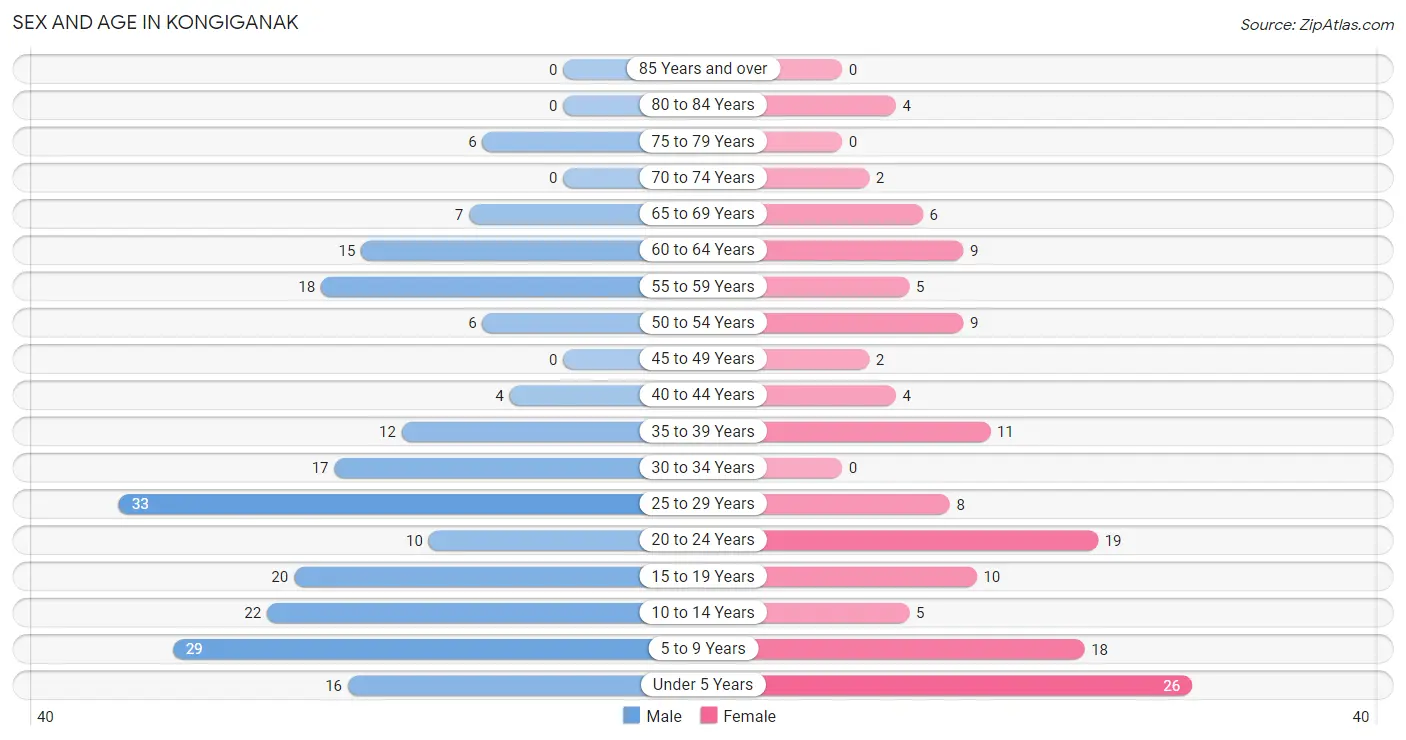
| Age Bracket | Male | Female |
| Under 5 Years | 16 (7.4%) | 26 (18.8%) |
| 5 to 9 Years | 29 (13.5%) | 18 (13.0%) |
| 10 to 14 Years | 22 (10.2%) | 5 (3.6%) |
| 15 to 19 Years | 20 (9.3%) | 10 (7.2%) |
| 20 to 24 Years | 10 (4.6%) | 19 (13.8%) |
| 25 to 29 Years | 33 (15.3%) | 8 (5.8%) |
| 30 to 34 Years | 17 (7.9%) | 0 (0.0%) |
| 35 to 39 Years | 12 (5.6%) | 11 (8.0%) |
| 40 to 44 Years | 4 (1.9%) | 4 (2.9%) |
| 45 to 49 Years | 0 (0.0%) | 2 (1.5%) |
| 50 to 54 Years | 6 (2.8%) | 9 (6.5%) |
| 55 to 59 Years | 18 (8.4%) | 5 (3.6%) |
| 60 to 64 Years | 15 (7.0%) | 9 (6.5%) |
| 65 to 69 Years | 7 (3.3%) | 6 (4.3%) |
| 70 to 74 Years | 0 (0.0%) | 2 (1.5%) |
| 75 to 79 Years | 6 (2.8%) | 0 (0.0%) |
| 80 to 84 Years | 0 (0.0%) | 4 (2.9%) |
| 85 Years and over | 0 (0.0%) | 0 (0.0%) |
| Total | 215 (100.0%) | 138 (100.0%) |
Families and Households in Kongiganak
Median Family Size in Kongiganak
The median family size in Kongiganak is 6.13 persons per family, with married-couple families (36 | 65.4%) accounting for the largest median family size of 7.14 persons per family. On the other hand, single female/mother families (10 | 18.2%) represent the smallest median family size with 4.00 persons per family.
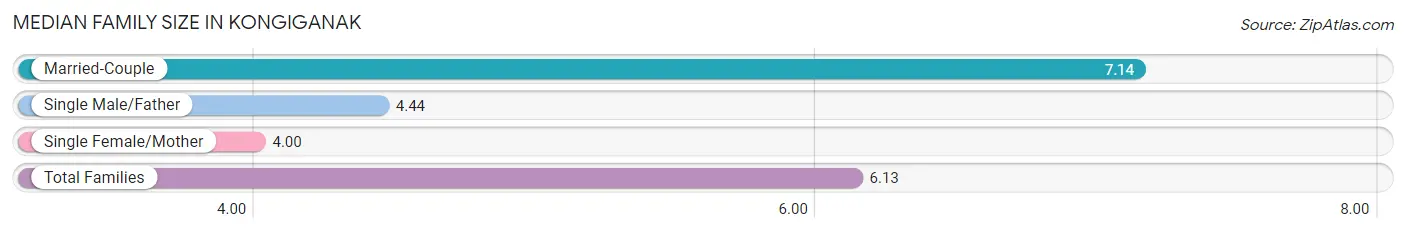
| Family Type | # Families | Family Size |
| Married-Couple | 36 (65.4%) | 7.14 |
| Single Male/Father | 9 (16.4%) | 4.44 |
| Single Female/Mother | 10 (18.2%) | 4.00 |
| Total Families | 55 (100.0%) | 6.13 |
Median Household Size in Kongiganak
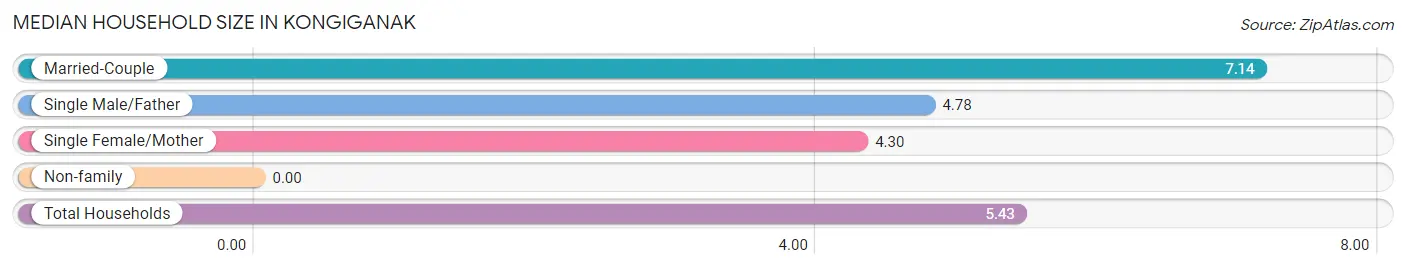
| Household Type | # Households | Household Size |
| Married-Couple | 36 (55.4%) | 7.14 |
| Single Male/Father | 9 (13.9%) | 4.78 |
| Single Female/Mother | 10 (15.4%) | 4.30 |
| Non-family | 10 (15.4%) | - |
| Total Households | 65 (100.0%) | 5.43 |
Household Size by Marriage Status in Kongiganak
Out of a total of 65 households in Kongiganak, 55 (84.6%) are family households, while 10 (15.4%) are nonfamily households. The most numerous type of family households are 7+ person households, comprising 20, and the most common type of nonfamily households are 1-person households, comprising 10.
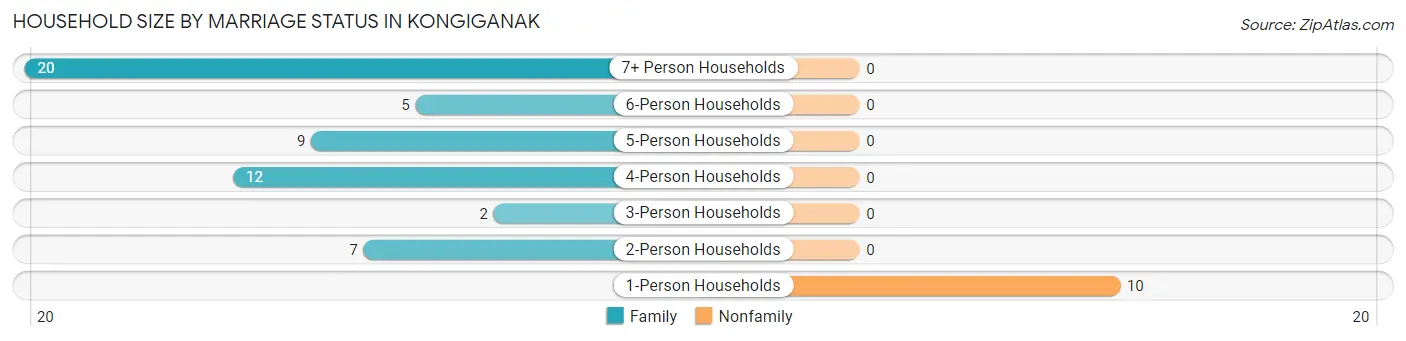
| Household Size | Family Households | Nonfamily Households |
| 1-Person Households | - | 10 (15.4%) |
| 2-Person Households | 7 (10.8%) | 0 (0.0%) |
| 3-Person Households | 2 (3.1%) | 0 (0.0%) |
| 4-Person Households | 12 (18.5%) | 0 (0.0%) |
| 5-Person Households | 9 (13.9%) | 0 (0.0%) |
| 6-Person Households | 5 (7.7%) | 0 (0.0%) |
| 7+ Person Households | 20 (30.8%) | 0 (0.0%) |
| Total | 55 (84.6%) | 10 (15.4%) |
Female Fertility in Kongiganak
Fertility by Age in Kongiganak
Average fertility rate in Kongiganak is 185.0 births per 1,000 women. Women in the age bracket of 35 to 50 years have the highest fertility rate with 353.0 births per 1,000 women. Women in the age bracket of 35 to 50 years acount for 60.0% of all women with births.
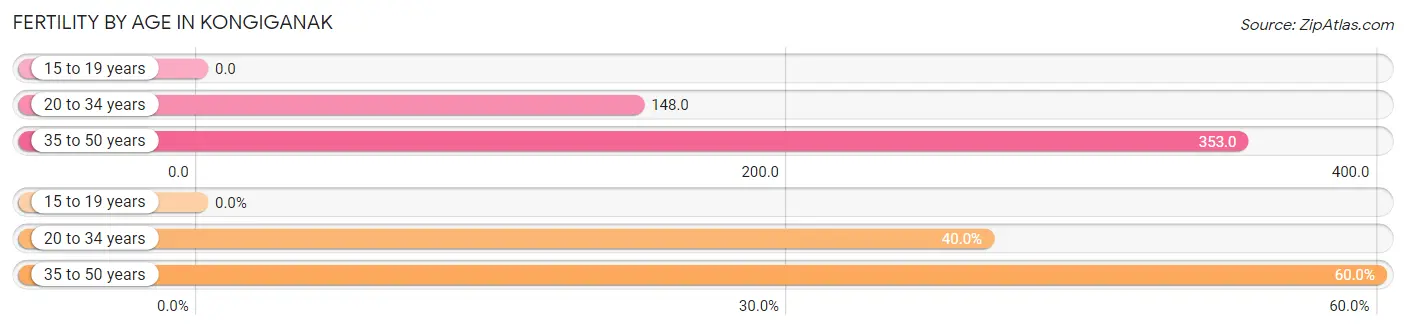
| Age Bracket | Women with Births | Births / 1,000 Women |
| 15 to 19 years | 0 (0.0%) | 0.0 |
| 20 to 34 years | 4 (40.0%) | 148.0 |
| 35 to 50 years | 6 (60.0%) | 353.0 |
| Total | 10 (100.0%) | 185.0 |
Fertility by Age by Marriage Status in Kongiganak
70.0% of women with births (10) in Kongiganak are married. The highest percentage of unmarried women with births falls into 35 to 50 years age bracket with 50.0% of them unmarried at the time of birth, while the lowest percentage of unmarried women with births belong to 20 to 34 years age bracket with 0.0% of them unmarried.
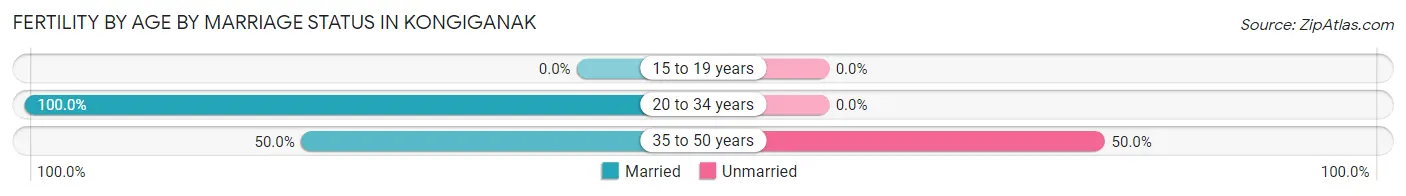
| Age Bracket | Married | Unmarried |
| 15 to 19 years | 0 (0.0%) | 0 (0.0%) |
| 20 to 34 years | 4 (100.0%) | 0 (0.0%) |
| 35 to 50 years | 3 (50.0%) | 3 (50.0%) |
| Total | 7 (70.0%) | 3 (30.0%) |
Fertility by Education in Kongiganak
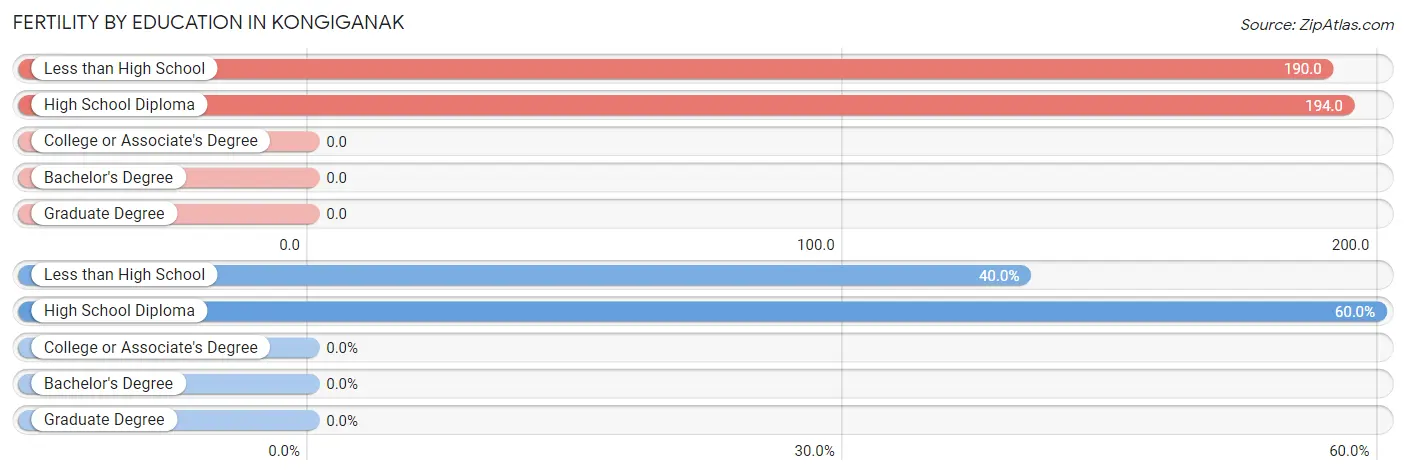
| Educational Attainment | Women with Births | Births / 1,000 Women |
| Less than High School | 4 (40.0%) | 190.0 |
| High School Diploma | 6 (60.0%) | 194.0 |
| College or Associate's Degree | 0 (0.0%) | 0.0 |
| Bachelor's Degree | 0 (0.0%) | 0.0 |
| Graduate Degree | 0 (0.0%) | 0.0 |
| Total | 10 (100.0%) | 185.0 |
Fertility by Education by Marriage Status in Kongiganak
30.0% of women with births in Kongiganak are unmarried. Women with the educational attainment of less than high school are most likely to be married with 100.0% of them married at childbirth, while women with the educational attainment of high school diploma are least likely to be married with 50.0% of them unmarried at childbirth.
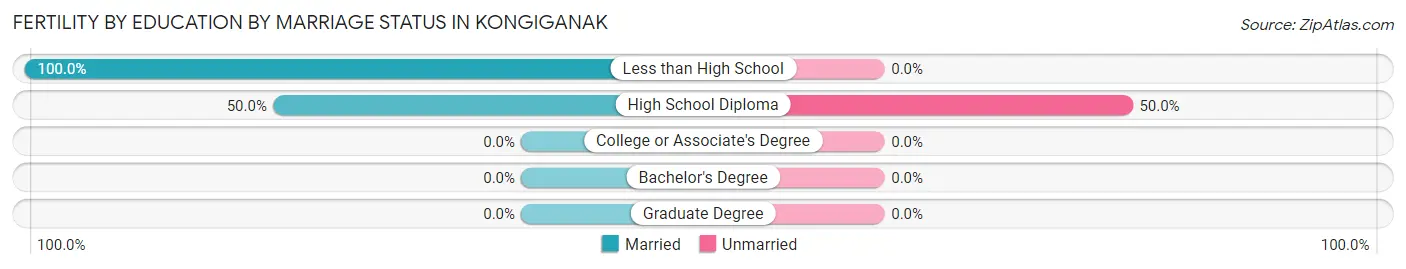
| Educational Attainment | Married | Unmarried |
| Less than High School | 4 (100.0%) | 0 (0.0%) |
| High School Diploma | 3 (50.0%) | 3 (50.0%) |
| College or Associate's Degree | 0 (0.0%) | 0 (0.0%) |
| Bachelor's Degree | 0 (0.0%) | 0 (0.0%) |
| Graduate Degree | 0 (0.0%) | 0 (0.0%) |
| Total | 7 (70.0%) | 3 (30.0%) |
Employment Characteristics in Kongiganak
Employment by Class of Employer in Kongiganak
Among the 89 employed individuals in Kongiganak, local government employees (63 | 70.8%), private company employees (12 | 13.5%), and state government employees (11 | 12.4%) make up the most common classes of employment.
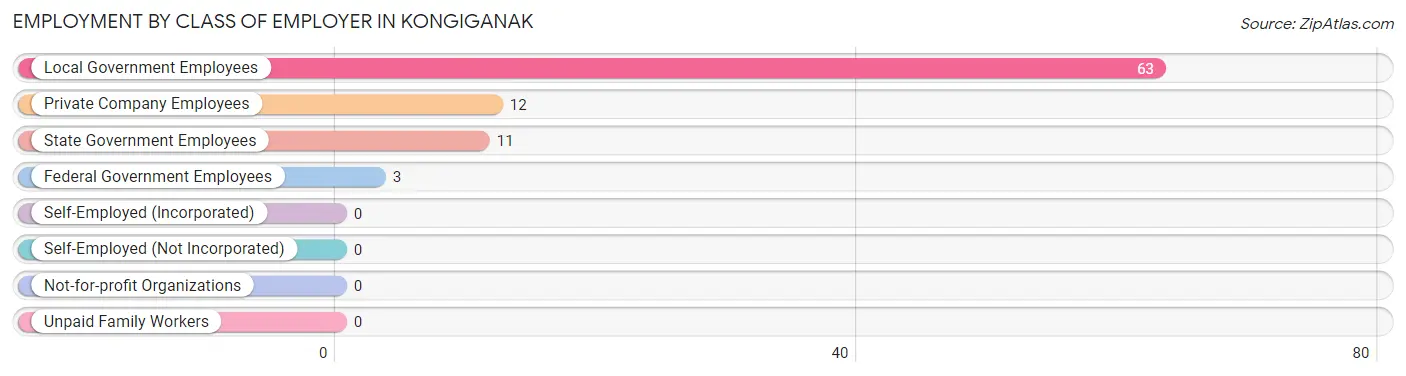
| Employer Class | # Employees | % Employees |
| Private Company Employees | 12 | 13.5% |
| Self-Employed (Incorporated) | 0 | 0.0% |
| Self-Employed (Not Incorporated) | 0 | 0.0% |
| Not-for-profit Organizations | 0 | 0.0% |
| Local Government Employees | 63 | 70.8% |
| State Government Employees | 11 | 12.4% |
| Federal Government Employees | 3 | 3.4% |
| Unpaid Family Workers | 0 | 0.0% |
| Total | 89 | 100.0% |
Employment Status by Age in Kongiganak
According to the labor force statistics for Kongiganak, out of the total population over 16 years of age (228), 50.0% or 114 individuals are in the labor force, with 21.9% or 25 of them unemployed. The age group with the highest labor force participation rate is 45 to 54 years, with 82.4% or 14 individuals in the labor force. Within the labor force, the 16 to 19 years age range has the highest percentage of unemployed individuals, with 100.0% or 3 of them being unemployed.
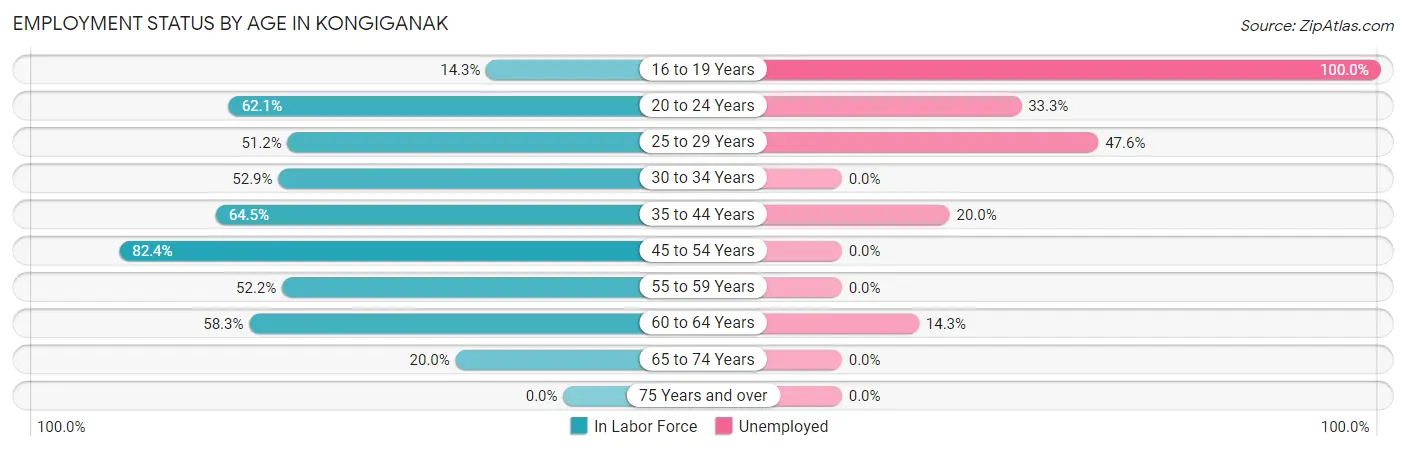
| Age Bracket | In Labor Force | Unemployed |
| 16 to 19 Years | 3 (14.3%) | 3 (100.0%) |
| 20 to 24 Years | 18 (62.1%) | 6 (33.3%) |
| 25 to 29 Years | 21 (51.2%) | 10 (47.6%) |
| 30 to 34 Years | 9 (52.9%) | 0 (0.0%) |
| 35 to 44 Years | 20 (64.5%) | 4 (20.0%) |
| 45 to 54 Years | 14 (82.4%) | 0 (0.0%) |
| 55 to 59 Years | 12 (52.2%) | 0 (0.0%) |
| 60 to 64 Years | 14 (58.3%) | 2 (14.3%) |
| 65 to 74 Years | 3 (20.0%) | 0 (0.0%) |
| 75 Years and over | 0 (0.0%) | 0 (0.0%) |
| Total | 114 (50.0%) | 25 (21.9%) |
Employment Status by Educational Attainment in Kongiganak
According to labor force statistics for Kongiganak, 58.8% of individuals (90) out of the total population between 25 and 64 years of age (153) are in the labor force, with 17.8% or 16 of them being unemployed. The group with the highest labor force participation rate are those with the educational attainment of college / associate degree, with 70.0% or 21 individuals in the labor force. Within the labor force, individuals with less than high school education have the highest percentage of unemployment, with 75.0% or 6 of them being unemployed.
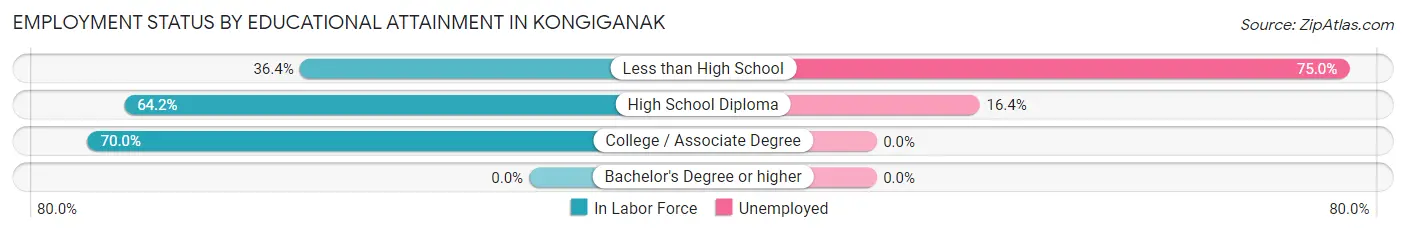
| Educational Attainment | In Labor Force | Unemployed |
| Less than High School | 8 (36.4%) | 16 (75.0%) |
| High School Diploma | 61 (64.2%) | 16 (16.4%) |
| College / Associate Degree | 21 (70.0%) | 0 (0.0%) |
| Bachelor's Degree or higher | 0 (0.0%) | 0 (0.0%) |
| Total | 90 (58.8%) | 27 (17.8%) |
Employment Occupations by Sex in Kongiganak
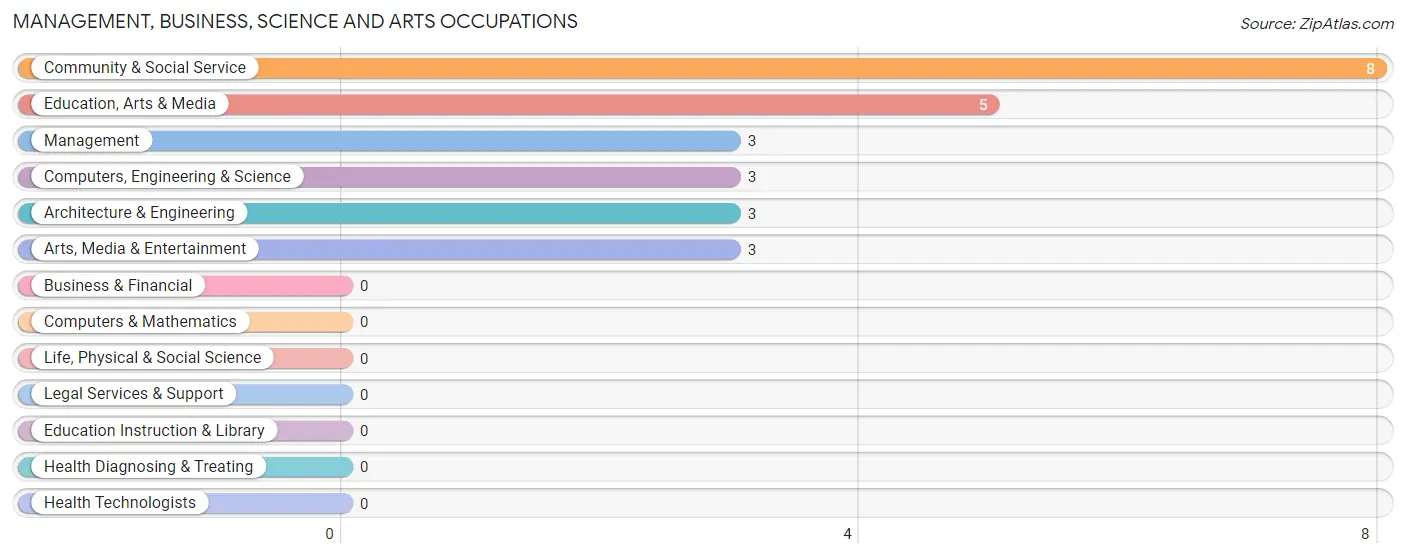
Management, Business, Science and Arts Occupations
The most common Management, Business, Science and Arts occupations in Kongiganak are Community & Social Service (8 | 9.0%), Education, Arts & Media (5 | 5.6%), Management (3 | 3.4%), Computers, Engineering & Science (3 | 3.4%), and Architecture & Engineering (3 | 3.4%).
Management, Business, Science and Arts Occupations by Sex
Within the Management, Business, Science and Arts occupations in Kongiganak, the most male-oriented occupations are Management (100.0%), Computers, Engineering & Science (100.0%), and Architecture & Engineering (100.0%), while the most female-oriented occupations are Education, Arts & Media (100.0%), and Community & Social Service (62.5%).
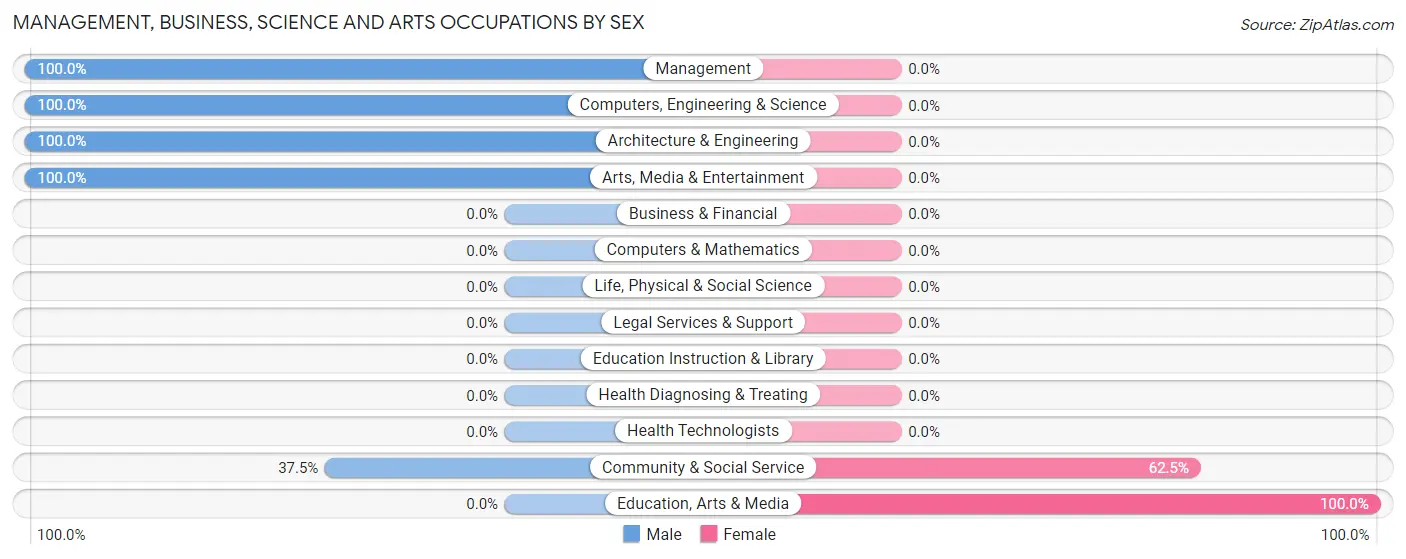
| Occupation | Male | Female |
| Management | 3 (100.0%) | 0 (0.0%) |
| Business & Financial | 0 (0.0%) | 0 (0.0%) |
| Computers, Engineering & Science | 3 (100.0%) | 0 (0.0%) |
| Computers & Mathematics | 0 (0.0%) | 0 (0.0%) |
| Architecture & Engineering | 3 (100.0%) | 0 (0.0%) |
| Life, Physical & Social Science | 0 (0.0%) | 0 (0.0%) |
| Community & Social Service | 3 (37.5%) | 5 (62.5%) |
| Education, Arts & Media | 0 (0.0%) | 5 (100.0%) |
| Legal Services & Support | 0 (0.0%) | 0 (0.0%) |
| Education Instruction & Library | 0 (0.0%) | 0 (0.0%) |
| Arts, Media & Entertainment | 3 (100.0%) | 0 (0.0%) |
| Health Diagnosing & Treating | 0 (0.0%) | 0 (0.0%) |
| Health Technologists | 0 (0.0%) | 0 (0.0%) |
| Total (Category) | 9 (64.3%) | 5 (35.7%) |
| Total (Overall) | 59 (66.3%) | 30 (33.7%) |
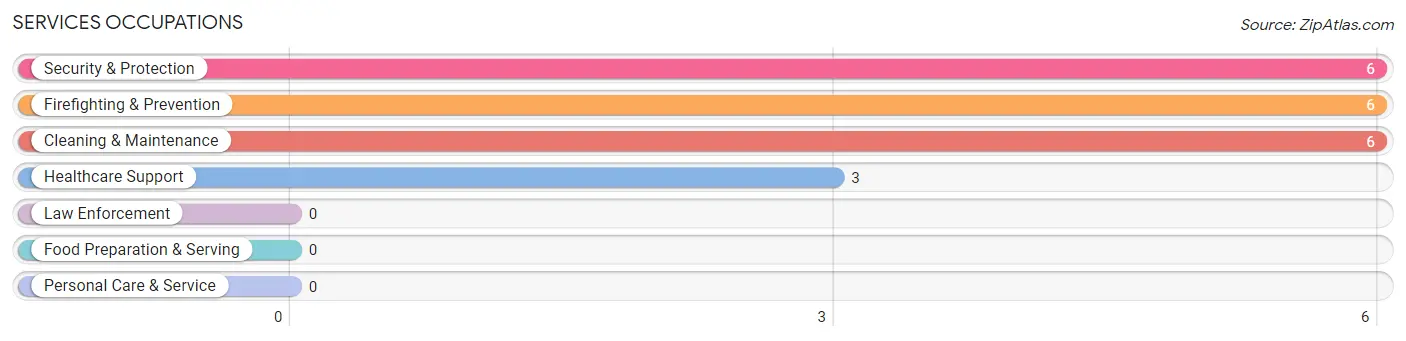
Services Occupations
The most common Services occupations in Kongiganak are Security & Protection (6 | 6.7%), Firefighting & Prevention (6 | 6.7%), Cleaning & Maintenance (6 | 6.7%), and Healthcare Support (3 | 3.4%).
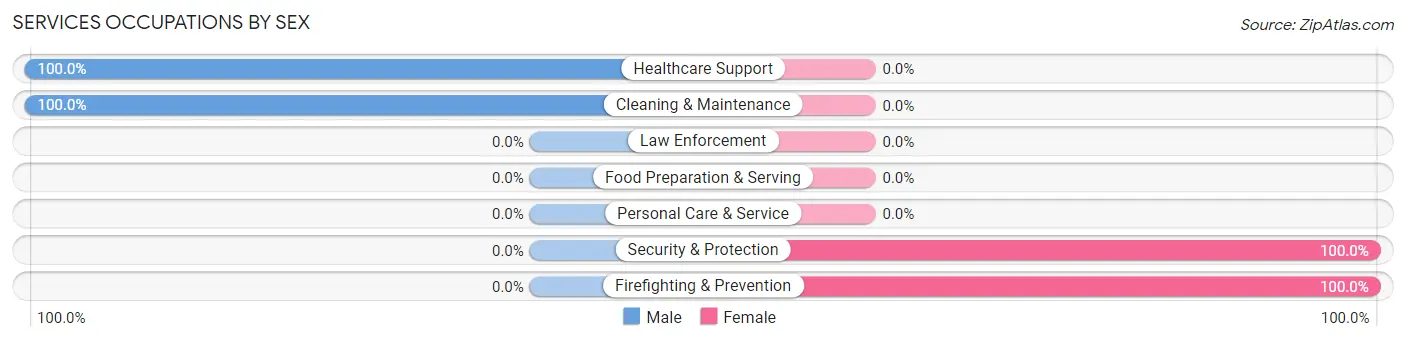
Services Occupations by Sex
Within the Services occupations in Kongiganak, the most male-oriented occupations are Healthcare Support (100.0%), and Cleaning & Maintenance (100.0%), while the most female-oriented occupations are Security & Protection (100.0%), and Firefighting & Prevention (100.0%).
| Occupation | Male | Female |
| Healthcare Support | 3 (100.0%) | 0 (0.0%) |
| Security & Protection | 0 (0.0%) | 6 (100.0%) |
| Firefighting & Prevention | 0 (0.0%) | 6 (100.0%) |
| Law Enforcement | 0 (0.0%) | 0 (0.0%) |
| Food Preparation & Serving | 0 (0.0%) | 0 (0.0%) |
| Cleaning & Maintenance | 6 (100.0%) | 0 (0.0%) |
| Personal Care & Service | 0 (0.0%) | 0 (0.0%) |
| Total (Category) | 9 (60.0%) | 6 (40.0%) |
| Total (Overall) | 59 (66.3%) | 30 (33.7%) |
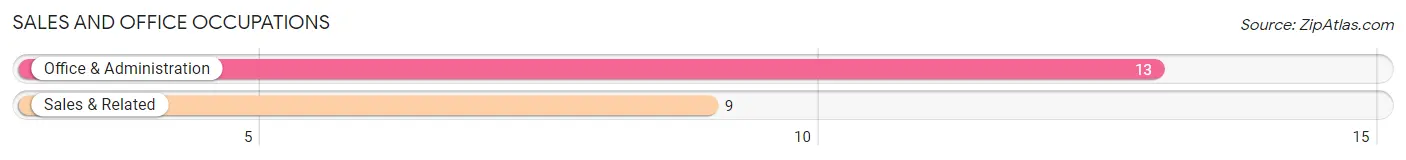
Sales and Office Occupations
The most common Sales and Office occupations in Kongiganak are Office & Administration (13 | 14.6%), and Sales & Related (9 | 10.1%).
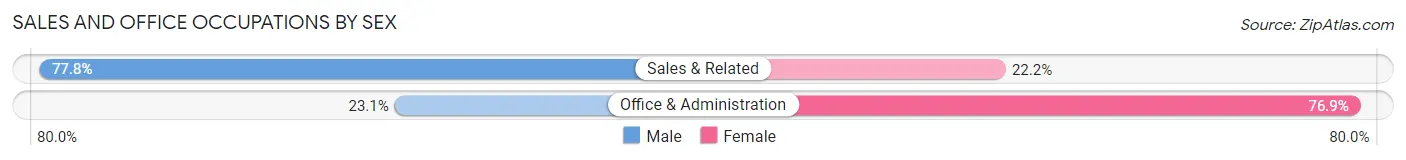
Sales and Office Occupations by Sex
| Occupation | Male | Female |
| Sales & Related | 7 (77.8%) | 2 (22.2%) |
| Office & Administration | 3 (23.1%) | 10 (76.9%) |
| Total (Category) | 10 (45.5%) | 12 (54.5%) |
| Total (Overall) | 59 (66.3%) | 30 (33.7%) |
Natural Resources, Construction and Maintenance Occupations
The most common Natural Resources, Construction and Maintenance occupations in Kongiganak are Construction & Extraction (3 | 3.4%), and Installation, Maintenance & Repair (2 | 2.2%).
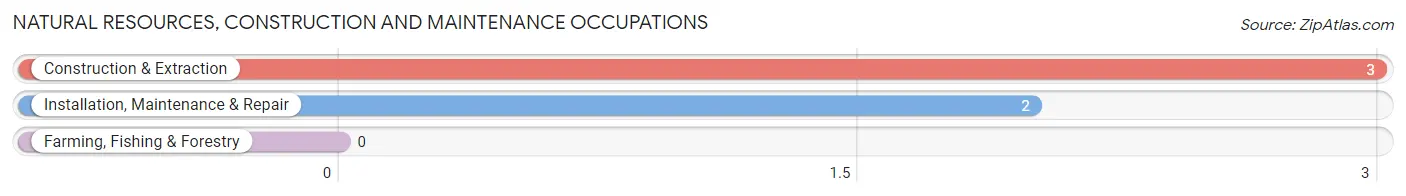
Natural Resources, Construction and Maintenance Occupations by Sex
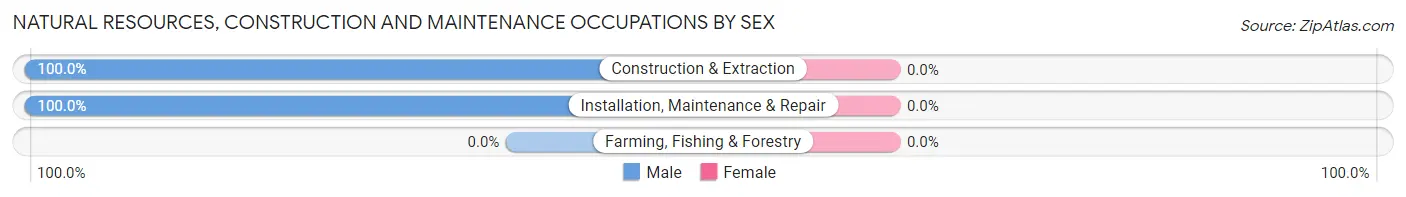
| Occupation | Male | Female |
| Farming, Fishing & Forestry | 0 (0.0%) | 0 (0.0%) |
| Construction & Extraction | 3 (100.0%) | 0 (0.0%) |
| Installation, Maintenance & Repair | 2 (100.0%) | 0 (0.0%) |
| Total (Category) | 5 (100.0%) | 0 (0.0%) |
| Total (Overall) | 59 (66.3%) | 30 (33.7%) |
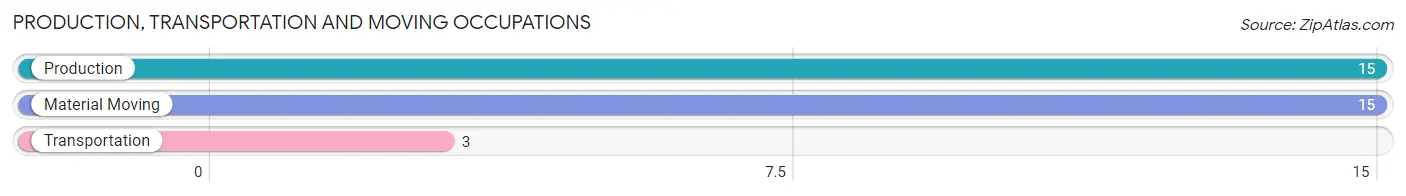
Production, Transportation and Moving Occupations
The most common Production, Transportation and Moving occupations in Kongiganak are Production (15 | 16.9%), Material Moving (15 | 16.9%), and Transportation (3 | 3.4%).
Production, Transportation and Moving Occupations by Sex
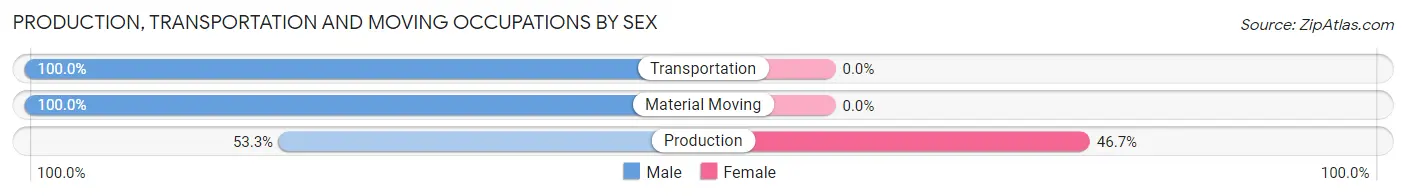
| Occupation | Male | Female |
| Production | 8 (53.3%) | 7 (46.7%) |
| Transportation | 3 (100.0%) | 0 (0.0%) |
| Material Moving | 15 (100.0%) | 0 (0.0%) |
| Total (Category) | 26 (78.8%) | 7 (21.2%) |
| Total (Overall) | 59 (66.3%) | 30 (33.7%) |
Employment Industries by Sex in Kongiganak
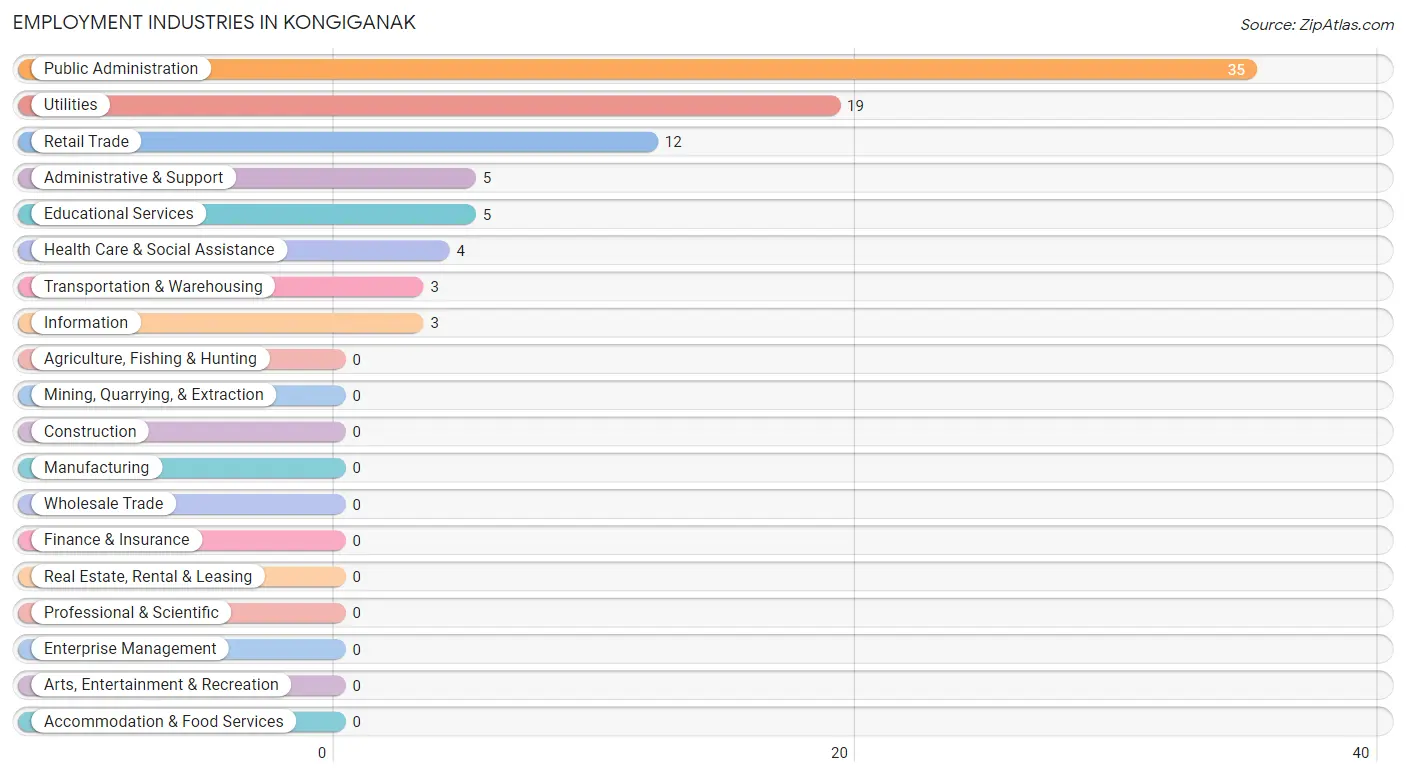
Employment Industries in Kongiganak
The major employment industries in Kongiganak include Public Administration (35 | 39.3%), Utilities (19 | 21.3%), Retail Trade (12 | 13.5%), Administrative & Support (5 | 5.6%), and Educational Services (5 | 5.6%).
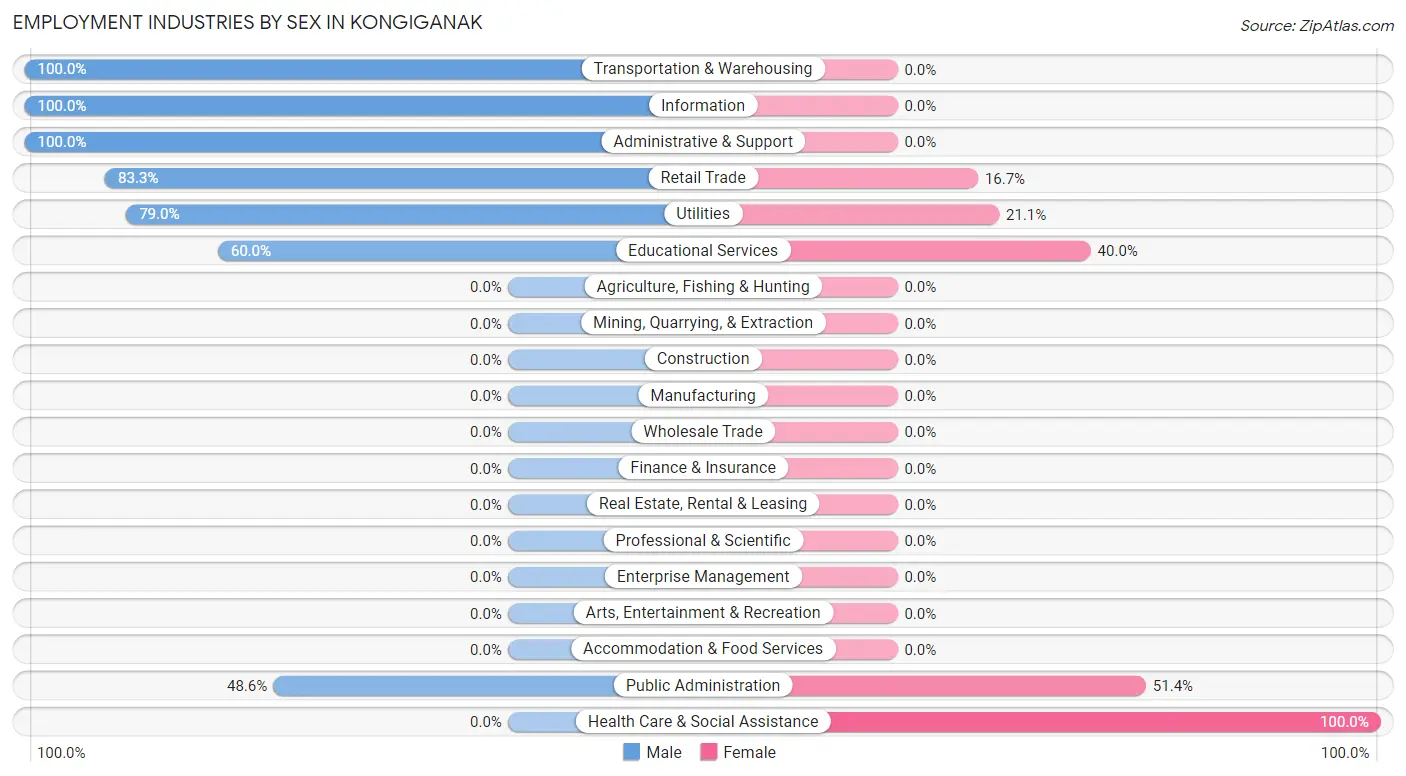
Employment Industries by Sex in Kongiganak
The Kongiganak industries that see more men than women are Transportation & Warehousing (100.0%), Information (100.0%), and Administrative & Support (100.0%), whereas the industries that tend to have a higher number of women are Health Care & Social Assistance (100.0%), Public Administration (51.4%), and Educational Services (40.0%).
| Industry | Male | Female |
| Agriculture, Fishing & Hunting | 0 (0.0%) | 0 (0.0%) |
| Mining, Quarrying, & Extraction | 0 (0.0%) | 0 (0.0%) |
| Construction | 0 (0.0%) | 0 (0.0%) |
| Manufacturing | 0 (0.0%) | 0 (0.0%) |
| Wholesale Trade | 0 (0.0%) | 0 (0.0%) |
| Retail Trade | 10 (83.3%) | 2 (16.7%) |
| Transportation & Warehousing | 3 (100.0%) | 0 (0.0%) |
| Utilities | 15 (78.9%) | 4 (21.0%) |
| Information | 3 (100.0%) | 0 (0.0%) |
| Finance & Insurance | 0 (0.0%) | 0 (0.0%) |
| Real Estate, Rental & Leasing | 0 (0.0%) | 0 (0.0%) |
| Professional & Scientific | 0 (0.0%) | 0 (0.0%) |
| Enterprise Management | 0 (0.0%) | 0 (0.0%) |
| Administrative & Support | 5 (100.0%) | 0 (0.0%) |
| Educational Services | 3 (60.0%) | 2 (40.0%) |
| Health Care & Social Assistance | 0 (0.0%) | 4 (100.0%) |
| Arts, Entertainment & Recreation | 0 (0.0%) | 0 (0.0%) |
| Accommodation & Food Services | 0 (0.0%) | 0 (0.0%) |
| Public Administration | 17 (48.6%) | 18 (51.4%) |
| Total | 59 (66.3%) | 30 (33.7%) |
Education in Kongiganak
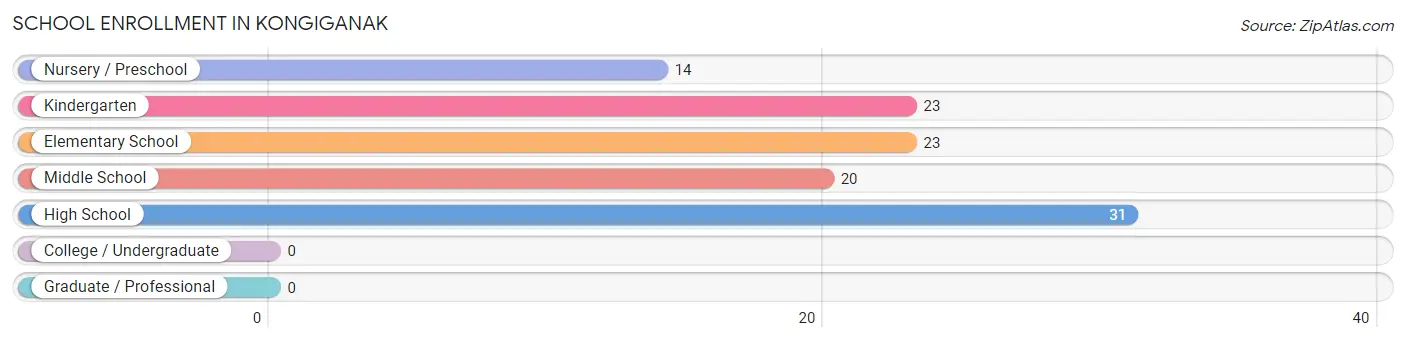
School Enrollment in Kongiganak
The most common levels of schooling among the 111 students in Kongiganak are high school (31 | 27.9%), kindergarten (23 | 20.7%), and elementary school (23 | 20.7%).
| School Level | # Students | % Students |
| Nursery / Preschool | 14 | 12.6% |
| Kindergarten | 23 | 20.7% |
| Elementary School | 23 | 20.7% |
| Middle School | 20 | 18.0% |
| High School | 31 | 27.9% |
| College / Undergraduate | 0 | 0.0% |
| Graduate / Professional | 0 | 0.0% |
| Total | 111 | 100.0% |
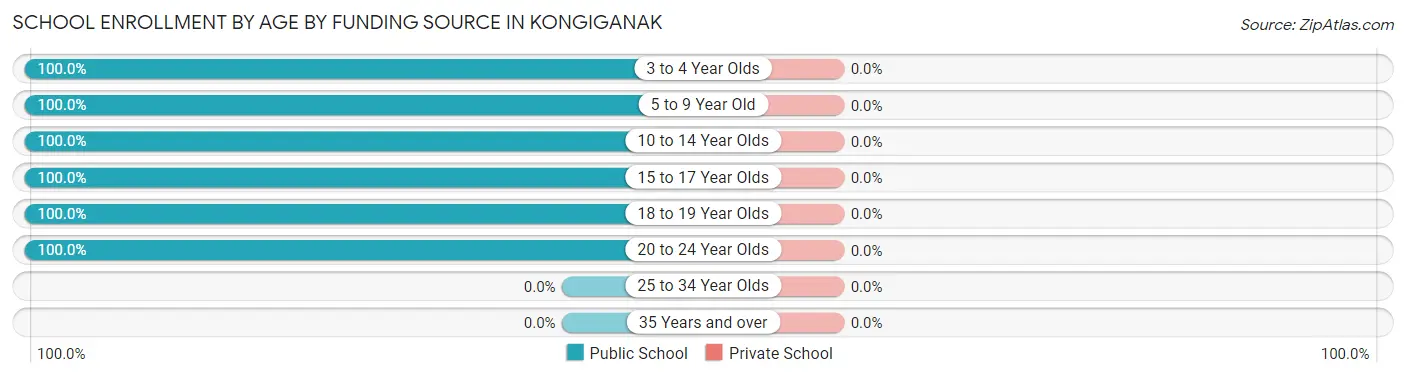
School Enrollment by Age by Funding Source in Kongiganak
| Age Bracket | Public School | Private School |
| 3 to 4 Year Olds | 14 (100.0%) | 0 (0.0%) |
| 5 to 9 Year Old | 42 (100.0%) | 0 (0.0%) |
| 10 to 14 Year Olds | 24 (100.0%) | 0 (0.0%) |
| 15 to 17 Year Olds | 18 (100.0%) | 0 (0.0%) |
| 18 to 19 Year Olds | 9 (100.0%) | 0 (0.0%) |
| 20 to 24 Year Olds | 4 (100.0%) | 0 (0.0%) |
| 25 to 34 Year Olds | 0 (0.0%) | 0 (0.0%) |
| 35 Years and over | 0 (0.0%) | 0 (0.0%) |
| Total | 111 (100.0%) | 0 (0.0%) |
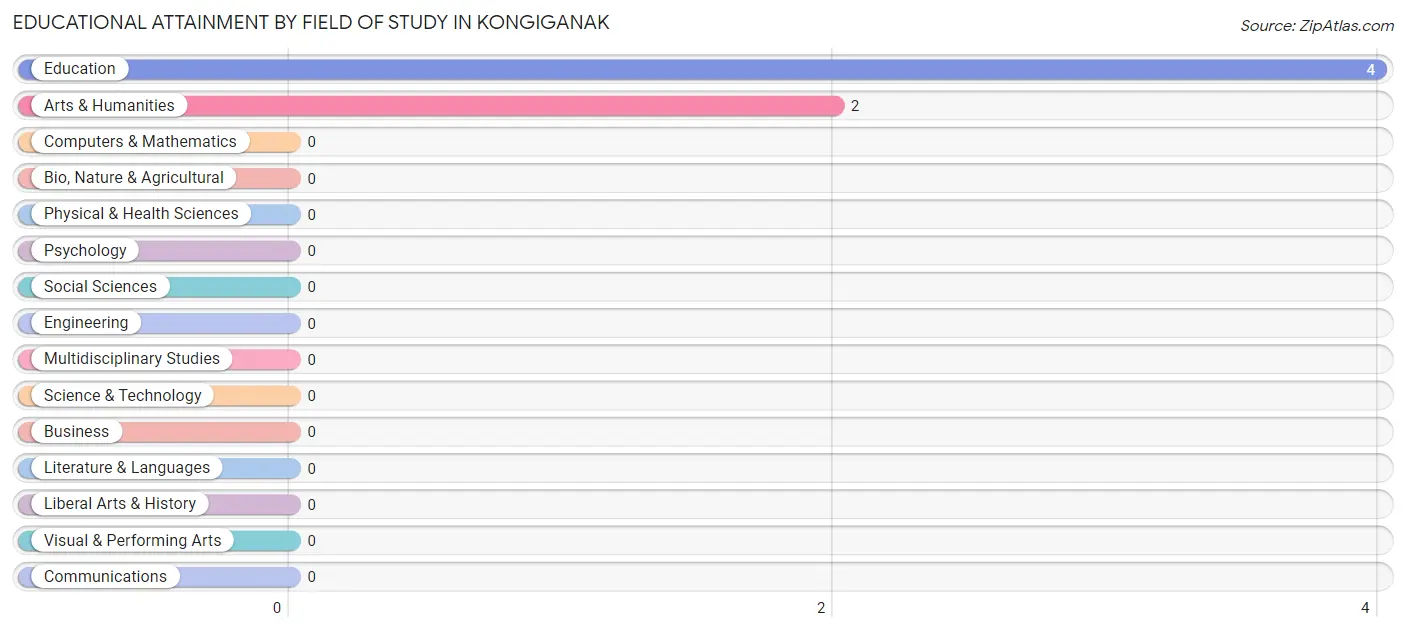
Educational Attainment by Field of Study in Kongiganak
Education (4 | 66.7%), and arts & humanities (2 | 33.3%) are the most common fields of study among 6 individuals in Kongiganak who have obtained a bachelor's degree or higher.
| Field of Study | # Graduates | % Graduates |
| Computers & Mathematics | 0 | 0.0% |
| Bio, Nature & Agricultural | 0 | 0.0% |
| Physical & Health Sciences | 0 | 0.0% |
| Psychology | 0 | 0.0% |
| Social Sciences | 0 | 0.0% |
| Engineering | 0 | 0.0% |
| Multidisciplinary Studies | 0 | 0.0% |
| Science & Technology | 0 | 0.0% |
| Business | 0 | 0.0% |
| Education | 4 | 66.7% |
| Literature & Languages | 0 | 0.0% |
| Liberal Arts & History | 0 | 0.0% |
| Visual & Performing Arts | 0 | 0.0% |
| Communications | 0 | 0.0% |
| Arts & Humanities | 2 | 33.3% |
| Total | 6 | 100.0% |
Transportation & Commute in Kongiganak
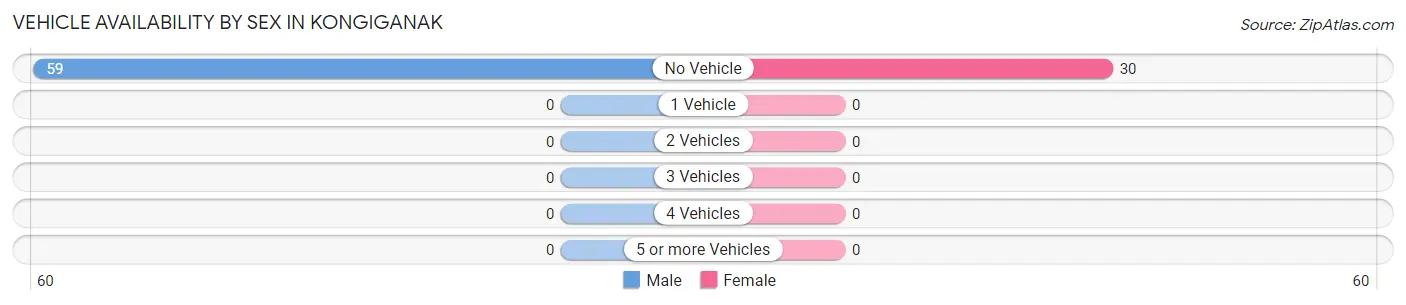
Vehicle Availability by Sex in Kongiganak
The most prevalent vehicle ownership categories in Kongiganak are males with no vehicle (59, accounting for 100.0%) and females with no vehicle (30, making up 196.7%).
| Vehicles Available | Male | Female |
| No Vehicle | 59 (100.0%) | 30 (100.0%) |
| 1 Vehicle | 0 (0.0%) | 0 (0.0%) |
| 2 Vehicles | 0 (0.0%) | 0 (0.0%) |
| 3 Vehicles | 0 (0.0%) | 0 (0.0%) |
| 4 Vehicles | 0 (0.0%) | 0 (0.0%) |
| 5 or more Vehicles | 0 (0.0%) | 0 (0.0%) |
| Total | 59 (100.0%) | 30 (100.0%) |
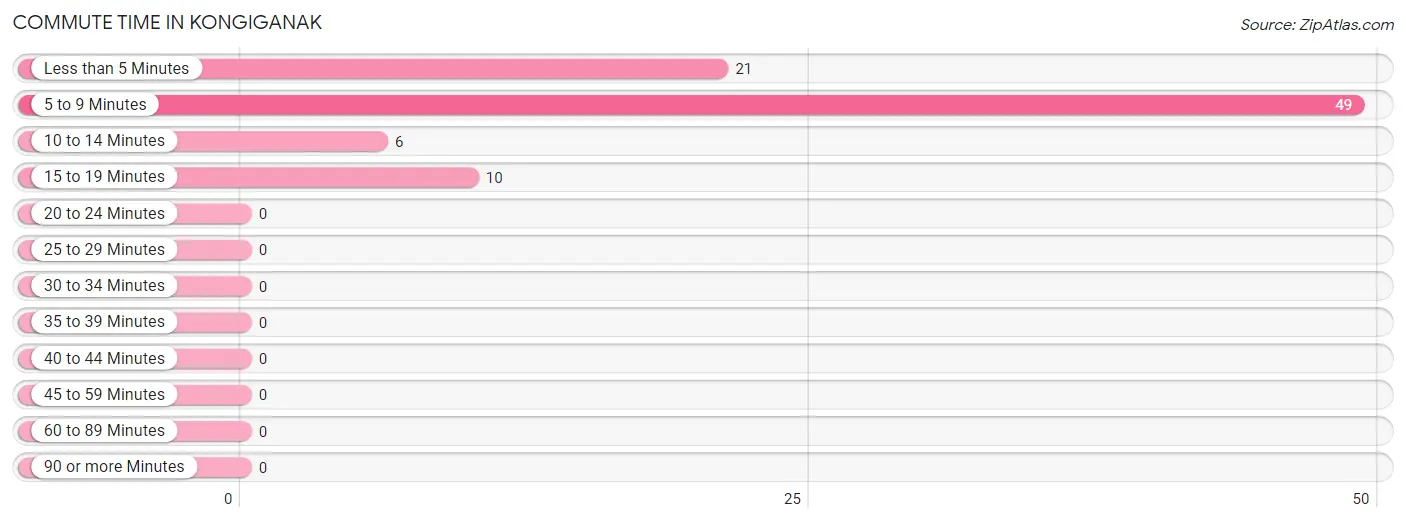
Commute Time in Kongiganak
The most frequently occuring commute durations in Kongiganak are 5 to 9 minutes (49 commuters, 57.0%), less than 5 minutes (21 commuters, 24.4%), and 15 to 19 minutes (10 commuters, 11.6%).
| Commute Time | # Commuters | % Commuters |
| Less than 5 Minutes | 21 | 24.4% |
| 5 to 9 Minutes | 49 | 57.0% |
| 10 to 14 Minutes | 6 | 7.0% |
| 15 to 19 Minutes | 10 | 11.6% |
| 20 to 24 Minutes | 0 | 0.0% |
| 25 to 29 Minutes | 0 | 0.0% |
| 30 to 34 Minutes | 0 | 0.0% |
| 35 to 39 Minutes | 0 | 0.0% |
| 40 to 44 Minutes | 0 | 0.0% |
| 45 to 59 Minutes | 0 | 0.0% |
| 60 to 89 Minutes | 0 | 0.0% |
| 90 or more Minutes | 0 | 0.0% |
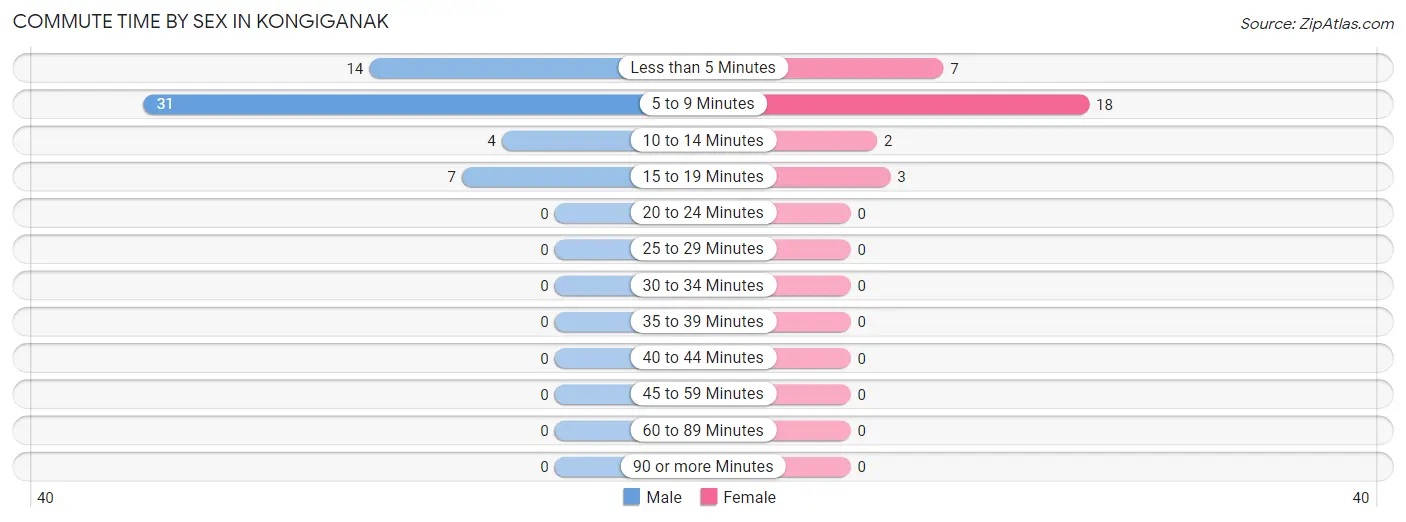
Commute Time by Sex in Kongiganak
The most common commute times in Kongiganak are 5 to 9 minutes (31 commuters, 55.4%) for males and 5 to 9 minutes (18 commuters, 60.0%) for females.
| Commute Time | Male | Female |
| Less than 5 Minutes | 14 (25.0%) | 7 (23.3%) |
| 5 to 9 Minutes | 31 (55.4%) | 18 (60.0%) |
| 10 to 14 Minutes | 4 (7.1%) | 2 (6.7%) |
| 15 to 19 Minutes | 7 (12.5%) | 3 (10.0%) |
| 20 to 24 Minutes | 0 (0.0%) | 0 (0.0%) |
| 25 to 29 Minutes | 0 (0.0%) | 0 (0.0%) |
| 30 to 34 Minutes | 0 (0.0%) | 0 (0.0%) |
| 35 to 39 Minutes | 0 (0.0%) | 0 (0.0%) |
| 40 to 44 Minutes | 0 (0.0%) | 0 (0.0%) |
| 45 to 59 Minutes | 0 (0.0%) | 0 (0.0%) |
| 60 to 89 Minutes | 0 (0.0%) | 0 (0.0%) |
| 90 or more Minutes | 0 (0.0%) | 0 (0.0%) |
Time of Departure to Work by Sex in Kongiganak
The most frequent times of departure to work in Kongiganak are 9:00 AM to 9:59 AM (25, 44.6%) for males and 9:00 AM to 9:59 AM (10, 33.3%) for females.
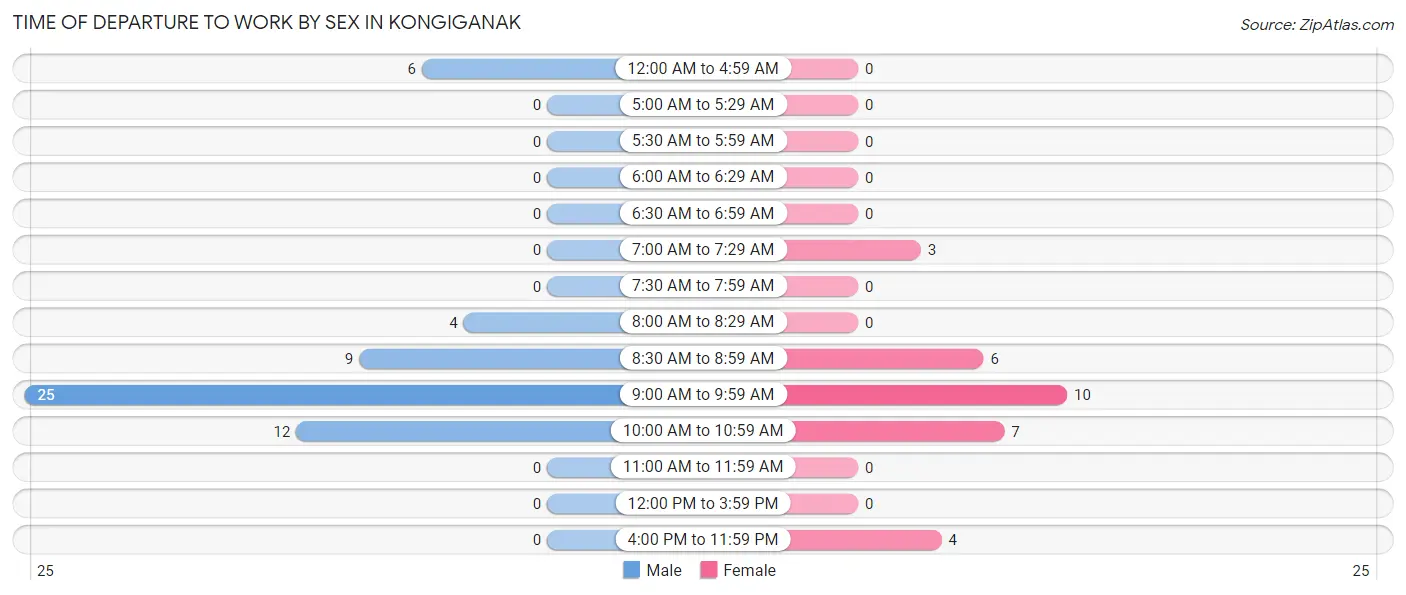
| Time of Departure | Male | Female |
| 12:00 AM to 4:59 AM | 6 (10.7%) | 0 (0.0%) |
| 5:00 AM to 5:29 AM | 0 (0.0%) | 0 (0.0%) |
| 5:30 AM to 5:59 AM | 0 (0.0%) | 0 (0.0%) |
| 6:00 AM to 6:29 AM | 0 (0.0%) | 0 (0.0%) |
| 6:30 AM to 6:59 AM | 0 (0.0%) | 0 (0.0%) |
| 7:00 AM to 7:29 AM | 0 (0.0%) | 3 (10.0%) |
| 7:30 AM to 7:59 AM | 0 (0.0%) | 0 (0.0%) |
| 8:00 AM to 8:29 AM | 4 (7.1%) | 0 (0.0%) |
| 8:30 AM to 8:59 AM | 9 (16.1%) | 6 (20.0%) |
| 9:00 AM to 9:59 AM | 25 (44.6%) | 10 (33.3%) |
| 10:00 AM to 10:59 AM | 12 (21.4%) | 7 (23.3%) |
| 11:00 AM to 11:59 AM | 0 (0.0%) | 0 (0.0%) |
| 12:00 PM to 3:59 PM | 0 (0.0%) | 0 (0.0%) |
| 4:00 PM to 11:59 PM | 0 (0.0%) | 4 (13.3%) |
| Total | 56 (100.0%) | 30 (100.0%) |
Housing Occupancy in Kongiganak
Occupancy by Ownership in Kongiganak
Of the total 65 dwellings in Kongiganak, owner-occupied units account for 46 (70.8%), while renter-occupied units make up 19 (29.2%).
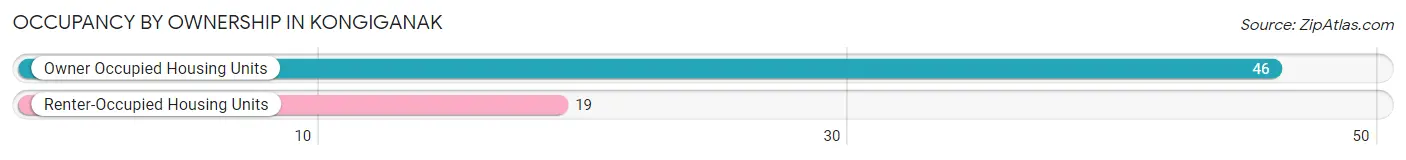
| Occupancy | # Housing Units | % Housing Units |
| Owner Occupied Housing Units | 46 | 70.8% |
| Renter-Occupied Housing Units | 19 | 29.2% |
| Total Occupied Housing Units | 65 | 100.0% |
Occupancy by Household Size in Kongiganak
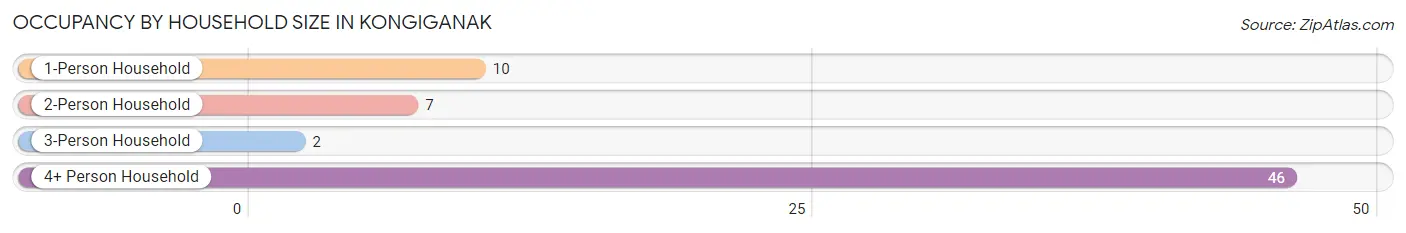
| Household Size | # Housing Units | % Housing Units |
| 1-Person Household | 10 | 15.4% |
| 2-Person Household | 7 | 10.8% |
| 3-Person Household | 2 | 3.1% |
| 4+ Person Household | 46 | 70.8% |
| Total Housing Units | 65 | 100.0% |
Occupancy by Ownership by Household Size in Kongiganak
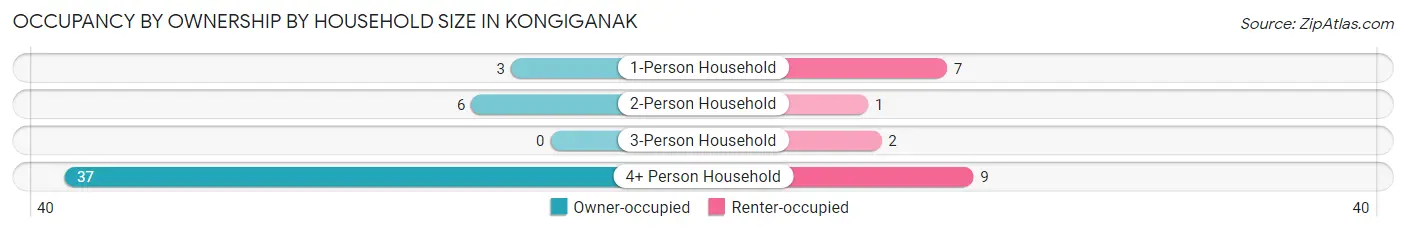
| Household Size | Owner-occupied | Renter-occupied |
| 1-Person Household | 3 (30.0%) | 7 (70.0%) |
| 2-Person Household | 6 (85.7%) | 1 (14.3%) |
| 3-Person Household | 0 (0.0%) | 2 (100.0%) |
| 4+ Person Household | 37 (80.4%) | 9 (19.6%) |
| Total Housing Units | 46 (70.8%) | 19 (29.2%) |
Occupancy by Educational Attainment in Kongiganak
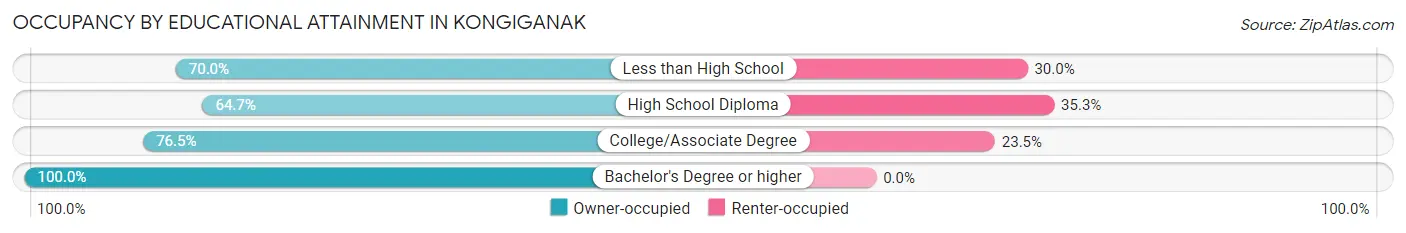
| Household Size | Owner-occupied | Renter-occupied |
| Less than High School | 7 (70.0%) | 3 (30.0%) |
| High School Diploma | 22 (64.7%) | 12 (35.3%) |
| College/Associate Degree | 13 (76.5%) | 4 (23.5%) |
| Bachelor's Degree or higher | 4 (100.0%) | 0 (0.0%) |
Occupancy by Age of Householder in Kongiganak
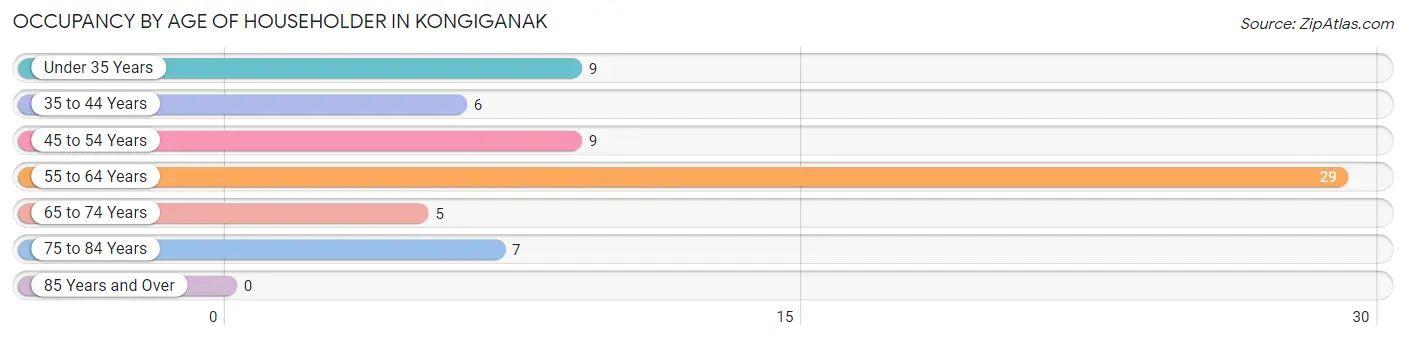
| Age Bracket | # Households | % Households |
| Under 35 Years | 9 | 13.9% |
| 35 to 44 Years | 6 | 9.2% |
| 45 to 54 Years | 9 | 13.9% |
| 55 to 64 Years | 29 | 44.6% |
| 65 to 74 Years | 5 | 7.7% |
| 75 to 84 Years | 7 | 10.8% |
| 85 Years and Over | 0 | 0.0% |
| Total | 65 | 100.0% |
Housing Finances in Kongiganak
Median Income by Occupancy in Kongiganak
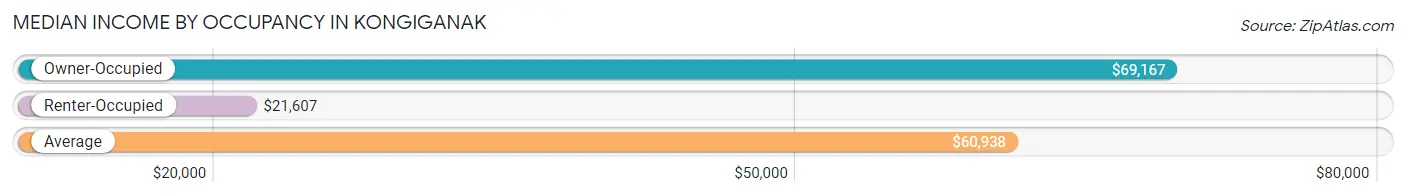
| Occupancy Type | # Households | Median Income |
| Owner-Occupied | 46 (70.8%) | $69,167 |
| Renter-Occupied | 19 (29.2%) | $21,607 |
| Average | 65 (100.0%) | $60,938 |
Occupancy by Householder Income Bracket in Kongiganak
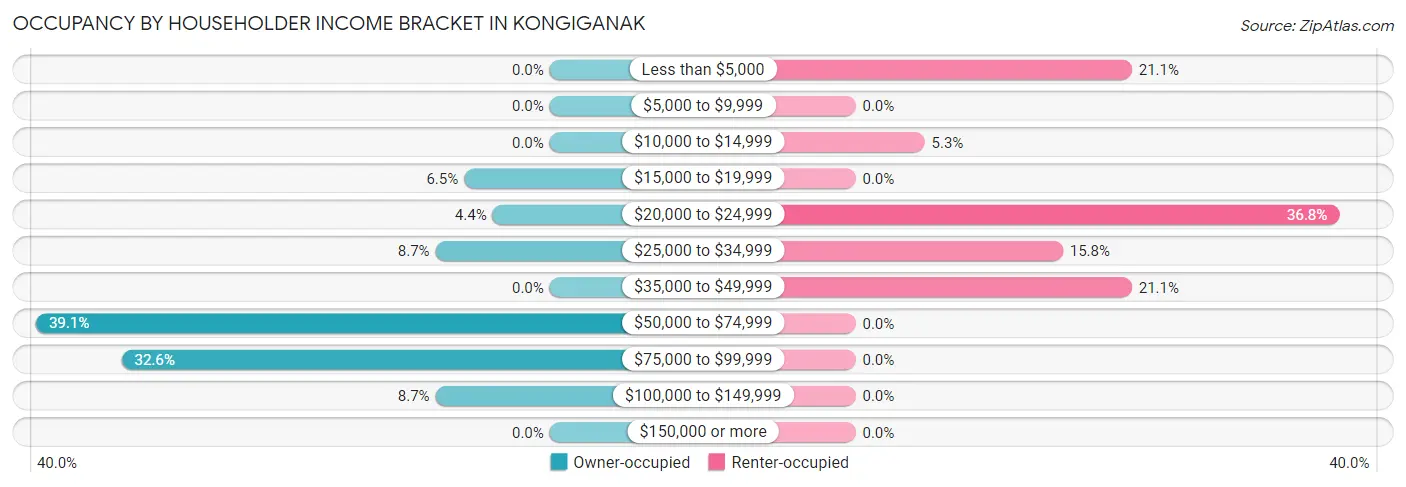
| Income Bracket | Owner-occupied | Renter-occupied |
| Less than $5,000 | 0 (0.0%) | 4 (21.0%) |
| $5,000 to $9,999 | 0 (0.0%) | 0 (0.0%) |
| $10,000 to $14,999 | 0 (0.0%) | 1 (5.3%) |
| $15,000 to $19,999 | 3 (6.5%) | 0 (0.0%) |
| $20,000 to $24,999 | 2 (4.3%) | 7 (36.8%) |
| $25,000 to $34,999 | 4 (8.7%) | 3 (15.8%) |
| $35,000 to $49,999 | 0 (0.0%) | 4 (21.0%) |
| $50,000 to $74,999 | 18 (39.1%) | 0 (0.0%) |
| $75,000 to $99,999 | 15 (32.6%) | 0 (0.0%) |
| $100,000 to $149,999 | 4 (8.7%) | 0 (0.0%) |
| $150,000 or more | 0 (0.0%) | 0 (0.0%) |
| Total | 46 (100.0%) | 19 (100.0%) |
Monthly Housing Cost Tiers in Kongiganak
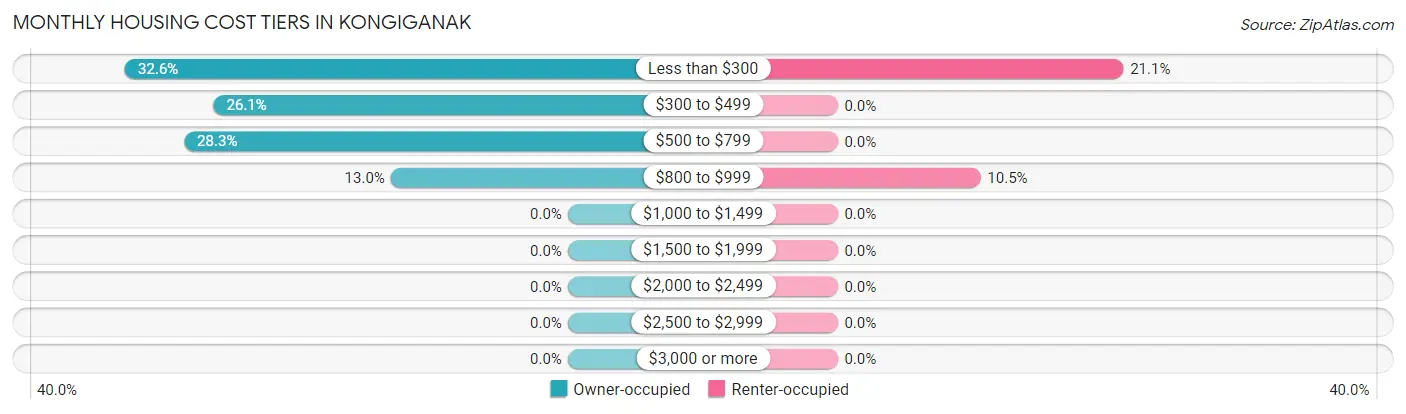
| Monthly Cost | Owner-occupied | Renter-occupied |
| Less than $300 | 15 (32.6%) | 4 (21.0%) |
| $300 to $499 | 12 (26.1%) | 0 (0.0%) |
| $500 to $799 | 13 (28.3%) | 0 (0.0%) |
| $800 to $999 | 6 (13.0%) | 2 (10.5%) |
| $1,000 to $1,499 | 0 (0.0%) | 0 (0.0%) |
| $1,500 to $1,999 | 0 (0.0%) | 0 (0.0%) |
| $2,000 to $2,499 | 0 (0.0%) | 0 (0.0%) |
| $2,500 to $2,999 | 0 (0.0%) | 0 (0.0%) |
| $3,000 or more | 0 (0.0%) | 0 (0.0%) |
| Total | 46 (100.0%) | 19 (100.0%) |
Physical Housing Characteristics in Kongiganak
Housing Structures in Kongiganak
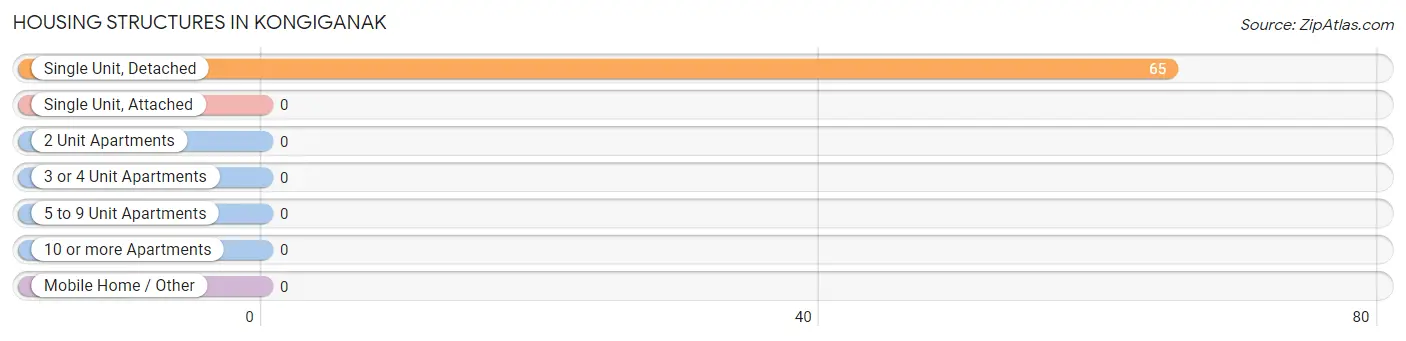
| Structure Type | # Housing Units | % Housing Units |
| Single Unit, Detached | 65 | 100.0% |
| Single Unit, Attached | 0 | 0.0% |
| 2 Unit Apartments | 0 | 0.0% |
| 3 or 4 Unit Apartments | 0 | 0.0% |
| 5 to 9 Unit Apartments | 0 | 0.0% |
| 10 or more Apartments | 0 | 0.0% |
| Mobile Home / Other | 0 | 0.0% |
| Total | 65 | 100.0% |
Housing Structures by Occupancy in Kongiganak
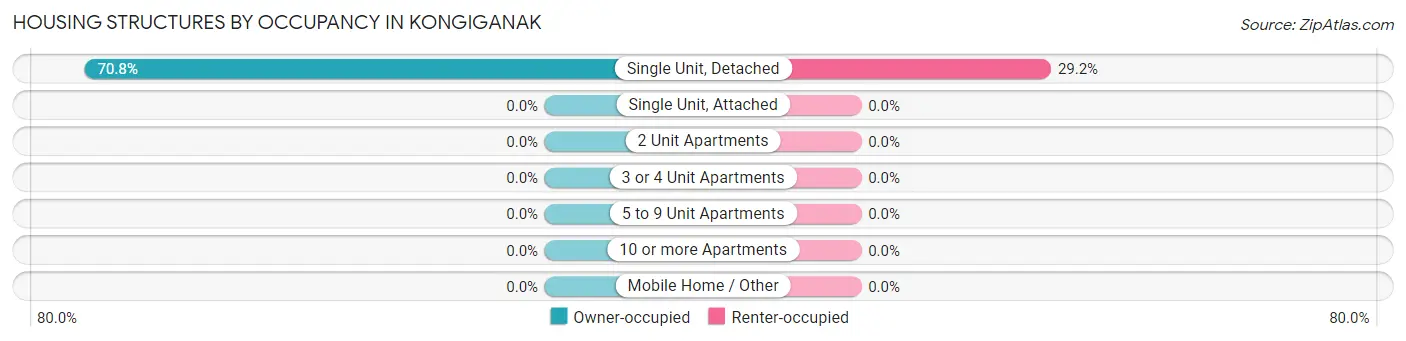
| Structure Type | Owner-occupied | Renter-occupied |
| Single Unit, Detached | 46 (70.8%) | 19 (29.2%) |
| Single Unit, Attached | 0 (0.0%) | 0 (0.0%) |
| 2 Unit Apartments | 0 (0.0%) | 0 (0.0%) |
| 3 or 4 Unit Apartments | 0 (0.0%) | 0 (0.0%) |
| 5 to 9 Unit Apartments | 0 (0.0%) | 0 (0.0%) |
| 10 or more Apartments | 0 (0.0%) | 0 (0.0%) |
| Mobile Home / Other | 0 (0.0%) | 0 (0.0%) |
| Total | 46 (70.8%) | 19 (29.2%) |
Housing Structures by Number of Rooms in Kongiganak
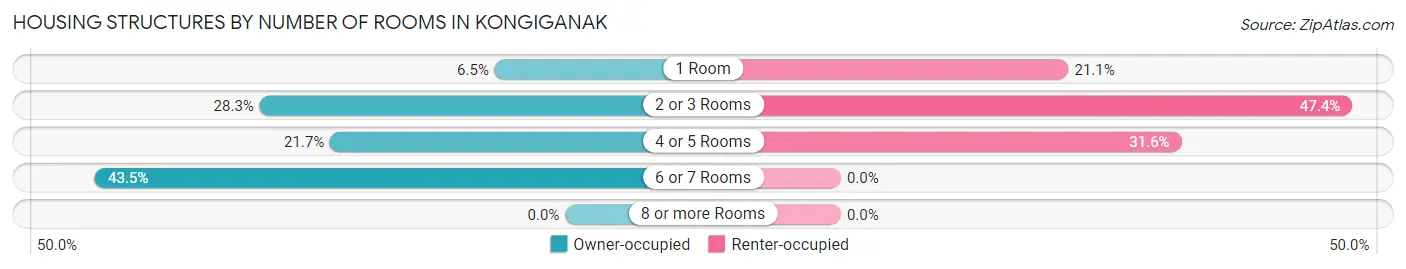
| Number of Rooms | Owner-occupied | Renter-occupied |
| 1 Room | 3 (6.5%) | 4 (21.0%) |
| 2 or 3 Rooms | 13 (28.3%) | 9 (47.4%) |
| 4 or 5 Rooms | 10 (21.7%) | 6 (31.6%) |
| 6 or 7 Rooms | 20 (43.5%) | 0 (0.0%) |
| 8 or more Rooms | 0 (0.0%) | 0 (0.0%) |
| Total | 46 (100.0%) | 19 (100.0%) |
Housing Structure by Heating Type in Kongiganak
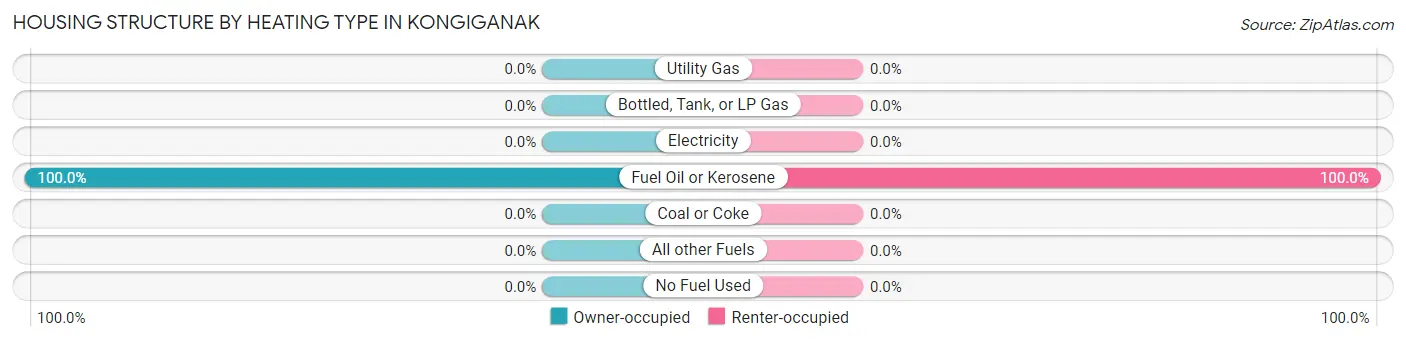
| Heating Type | Owner-occupied | Renter-occupied |
| Utility Gas | 0 (0.0%) | 0 (0.0%) |
| Bottled, Tank, or LP Gas | 0 (0.0%) | 0 (0.0%) |
| Electricity | 0 (0.0%) | 0 (0.0%) |
| Fuel Oil or Kerosene | 46 (100.0%) | 19 (100.0%) |
| Coal or Coke | 0 (0.0%) | 0 (0.0%) |
| All other Fuels | 0 (0.0%) | 0 (0.0%) |
| No Fuel Used | 0 (0.0%) | 0 (0.0%) |
| Total | 46 (100.0%) | 19 (100.0%) |
Household Vehicle Usage in Kongiganak
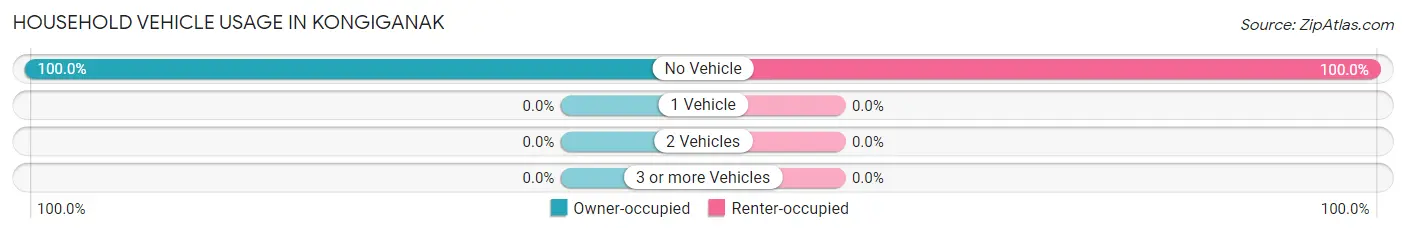
| Vehicles per Household | Owner-occupied | Renter-occupied |
| No Vehicle | 46 (100.0%) | 19 (100.0%) |
| 1 Vehicle | 0 (0.0%) | 0 (0.0%) |
| 2 Vehicles | 0 (0.0%) | 0 (0.0%) |
| 3 or more Vehicles | 0 (0.0%) | 0 (0.0%) |
| Total | 46 (100.0%) | 19 (100.0%) |
Real Estate & Mortgages in Kongiganak
Real Estate and Mortgage Overview in Kongiganak
| Characteristic | Without Mortgage | With Mortgage |
| Housing Units | 22 | 24 |
| Median Property Value | - | - |
| Median Household Income | $61,250 | $0 |
| Monthly Housing Costs | $400 | $0 |
| Real Estate Taxes | - | - |
Property Value by Mortgage Status in Kongiganak
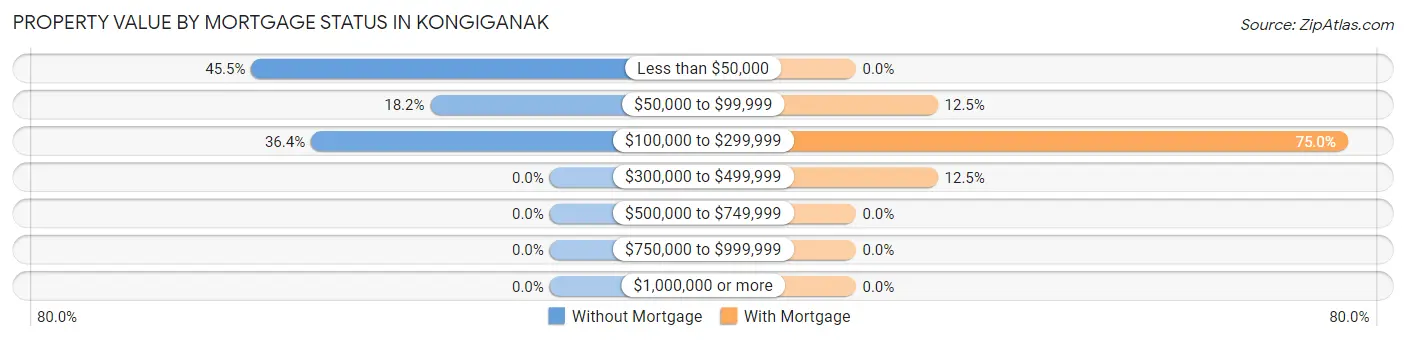
| Property Value | Without Mortgage | With Mortgage |
| Less than $50,000 | 10 (45.5%) | 0 (0.0%) |
| $50,000 to $99,999 | 4 (18.2%) | 3 (12.5%) |
| $100,000 to $299,999 | 8 (36.4%) | 18 (75.0%) |
| $300,000 to $499,999 | 0 (0.0%) | 3 (12.5%) |
| $500,000 to $749,999 | 0 (0.0%) | 0 (0.0%) |
| $750,000 to $999,999 | 0 (0.0%) | 0 (0.0%) |
| $1,000,000 or more | 0 (0.0%) | 0 (0.0%) |
| Total | 22 (100.0%) | 24 (100.0%) |
Household Income by Mortgage Status in Kongiganak
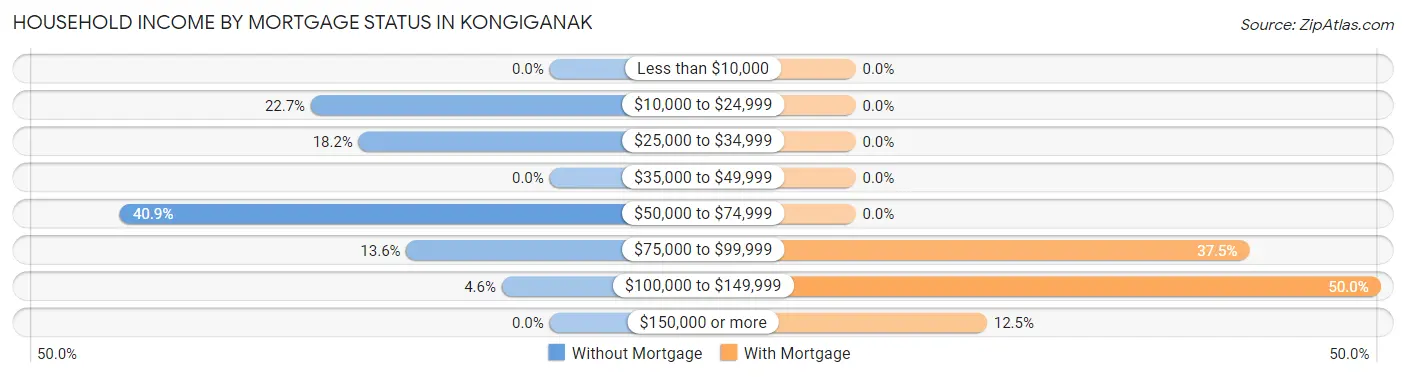
| Household Income | Without Mortgage | With Mortgage |
| Less than $10,000 | 0 (0.0%) | 0 (0.0%) |
| $10,000 to $24,999 | 5 (22.7%) | 0 (0.0%) |
| $25,000 to $34,999 | 4 (18.2%) | 0 (0.0%) |
| $35,000 to $49,999 | 0 (0.0%) | 0 (0.0%) |
| $50,000 to $74,999 | 9 (40.9%) | 0 (0.0%) |
| $75,000 to $99,999 | 3 (13.6%) | 9 (37.5%) |
| $100,000 to $149,999 | 1 (4.5%) | 12 (50.0%) |
| $150,000 or more | 0 (0.0%) | 3 (12.5%) |
| Total | 22 (100.0%) | 24 (100.0%) |
Property Value to Household Income Ratio in Kongiganak
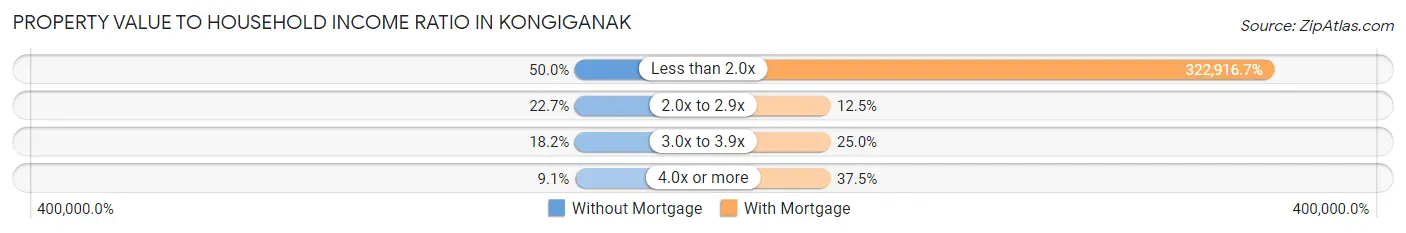
| Value-to-Income Ratio | Without Mortgage | With Mortgage |
| Less than 2.0x | 11 (50.0%) | 77,500 (322,916.7%) |
| 2.0x to 2.9x | 5 (22.7%) | 3 (12.5%) |
| 3.0x to 3.9x | 4 (18.2%) | 6 (25.0%) |
| 4.0x or more | 2 (9.1%) | 9 (37.5%) |
| Total | 22 (100.0%) | 24 (100.0%) |
Real Estate Taxes by Mortgage Status in Kongiganak
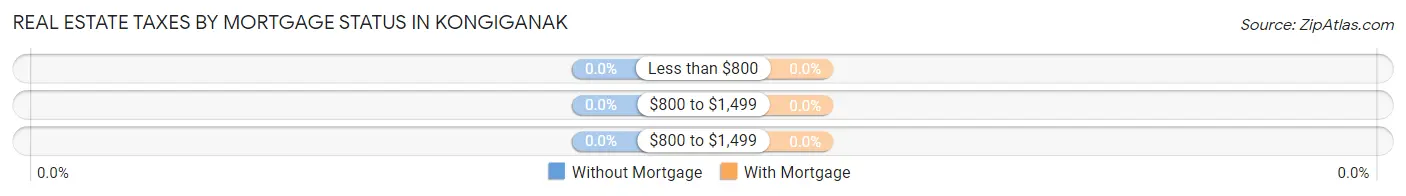
| Property Taxes | Without Mortgage | With Mortgage |
| Less than $800 | 0 (0.0%) | 0 (0.0%) |
| $800 to $1,499 | 0 (0.0%) | 0 (0.0%) |
| $800 to $1,499 | 0 (0.0%) | 0 (0.0%) |
| Total | 22 (100.0%) | 24 (100.0%) |
Health & Disability in Kongiganak
Health Insurance Coverage by Age in Kongiganak
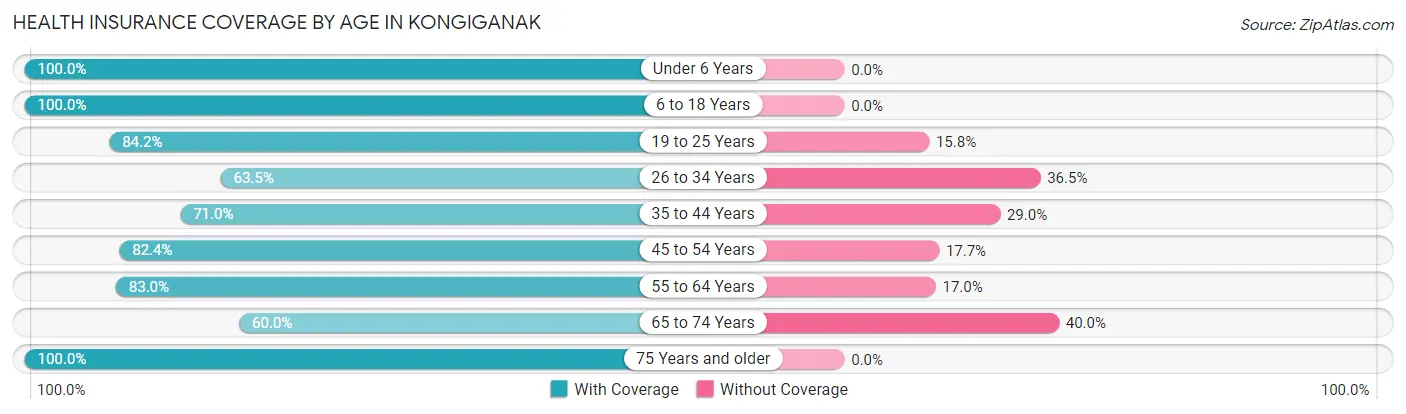
| Age Bracket | With Coverage | Without Coverage |
| Under 6 Years | 62 (100.0%) | 0 (0.0%) |
| 6 to 18 Years | 81 (100.0%) | 0 (0.0%) |
| 19 to 25 Years | 32 (84.2%) | 6 (15.8%) |
| 26 to 34 Years | 33 (63.5%) | 19 (36.5%) |
| 35 to 44 Years | 22 (71.0%) | 9 (29.0%) |
| 45 to 54 Years | 14 (82.4%) | 3 (17.6%) |
| 55 to 64 Years | 39 (83.0%) | 8 (17.0%) |
| 65 to 74 Years | 9 (60.0%) | 6 (40.0%) |
| 75 Years and older | 10 (100.0%) | 0 (0.0%) |
| Total | 302 (85.6%) | 51 (14.4%) |
Health Insurance Coverage by Citizenship Status in Kongiganak
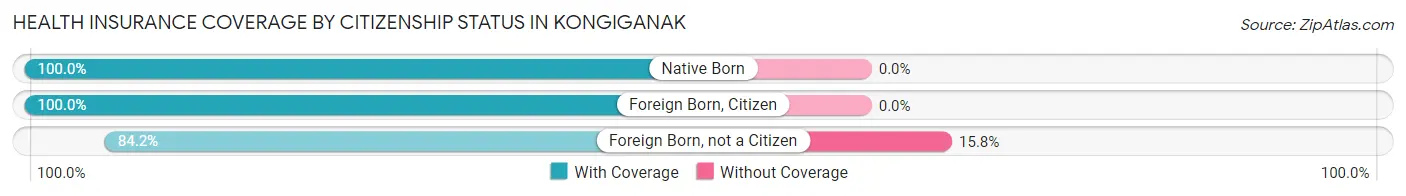
| Citizenship Status | With Coverage | Without Coverage |
| Native Born | 62 (100.0%) | 0 (0.0%) |
| Foreign Born, Citizen | 81 (100.0%) | 0 (0.0%) |
| Foreign Born, not a Citizen | 32 (84.2%) | 6 (15.8%) |
Health Insurance Coverage by Household Income in Kongiganak
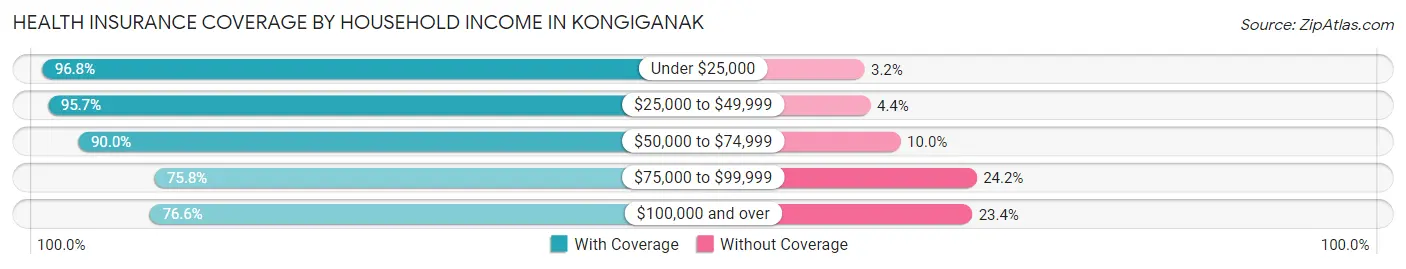
| Household Income | With Coverage | Without Coverage |
| Under $25,000 | 30 (96.8%) | 1 (3.2%) |
| $25,000 to $49,999 | 44 (95.7%) | 2 (4.3%) |
| $50,000 to $74,999 | 117 (90.0%) | 13 (10.0%) |
| $75,000 to $99,999 | 75 (75.8%) | 24 (24.2%) |
| $100,000 and over | 36 (76.6%) | 11 (23.4%) |
Public vs Private Health Insurance Coverage by Age in Kongiganak
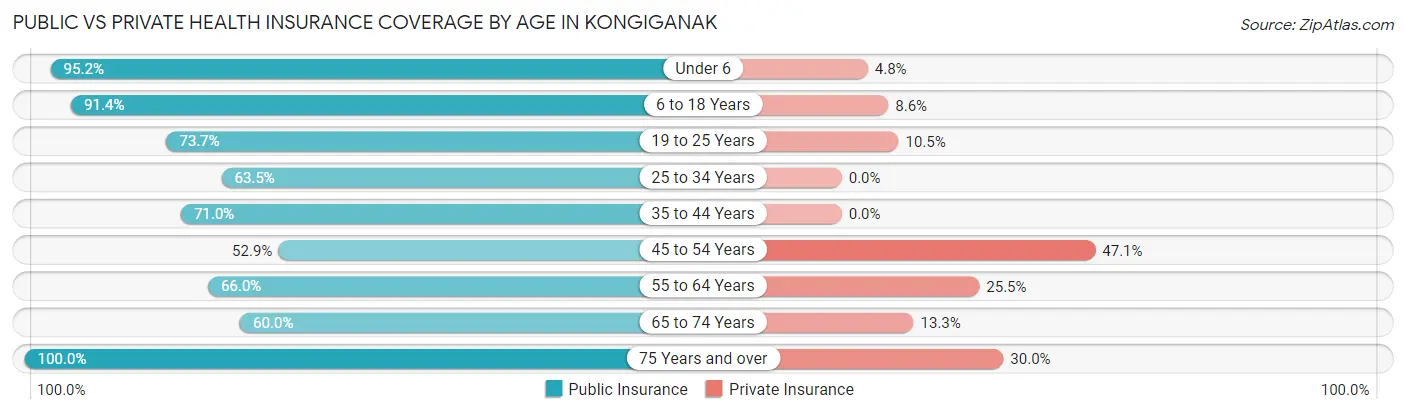
| Age Bracket | Public Insurance | Private Insurance |
| Under 6 | 59 (95.2%) | 3 (4.8%) |
| 6 to 18 Years | 74 (91.4%) | 7 (8.6%) |
| 19 to 25 Years | 28 (73.7%) | 4 (10.5%) |
| 25 to 34 Years | 33 (63.5%) | 0 (0.0%) |
| 35 to 44 Years | 22 (71.0%) | 0 (0.0%) |
| 45 to 54 Years | 9 (52.9%) | 8 (47.1%) |
| 55 to 64 Years | 31 (66.0%) | 12 (25.5%) |
| 65 to 74 Years | 9 (60.0%) | 2 (13.3%) |
| 75 Years and over | 10 (100.0%) | 3 (30.0%) |
| Total | 275 (77.9%) | 39 (11.1%) |
Disability Status by Sex by Age in Kongiganak
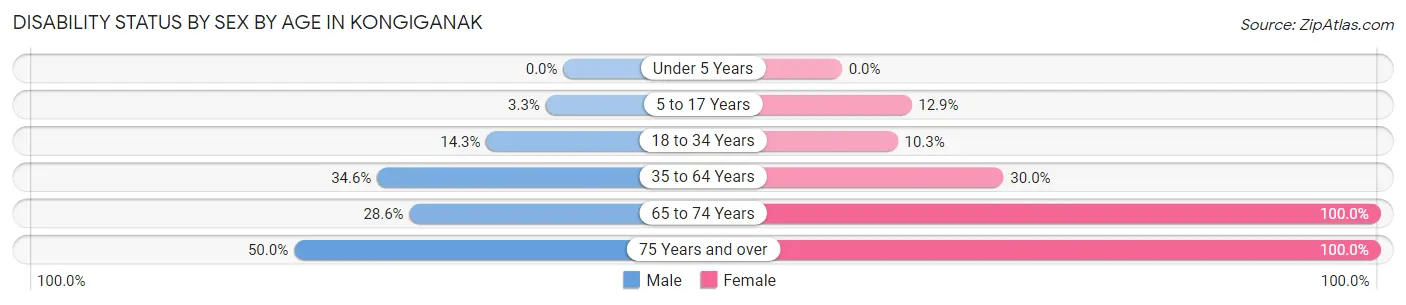
| Age Bracket | Male | Female |
| Under 5 Years | 0 (0.0%) | 0 (0.0%) |
| 5 to 17 Years | 2 (3.3%) | 4 (12.9%) |
| 18 to 34 Years | 10 (14.3%) | 3 (10.3%) |
| 35 to 64 Years | 19 (34.5%) | 12 (30.0%) |
| 65 to 74 Years | 2 (28.6%) | 8 (100.0%) |
| 75 Years and over | 3 (50.0%) | 4 (100.0%) |
Disability Class by Sex by Age in Kongiganak
Disability Class: Hearing Difficulty
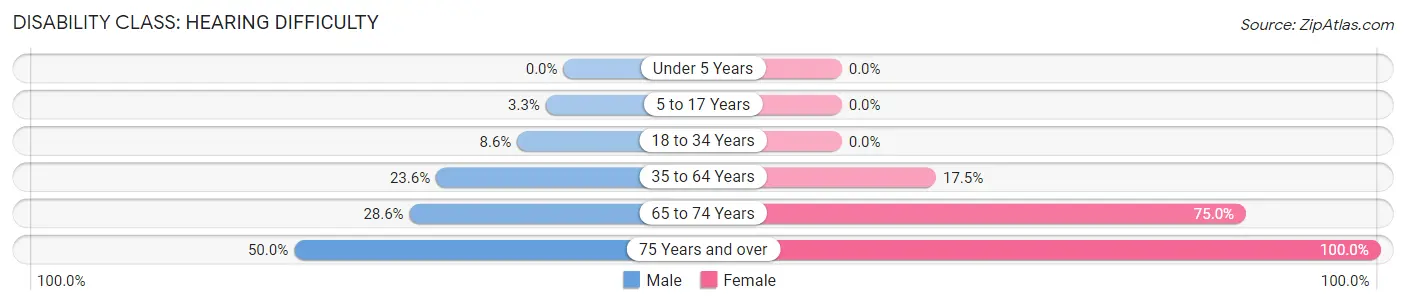
| Age Bracket | Male | Female |
| Under 5 Years | 0 (0.0%) | 0 (0.0%) |
| 5 to 17 Years | 2 (3.3%) | 0 (0.0%) |
| 18 to 34 Years | 6 (8.6%) | 0 (0.0%) |
| 35 to 64 Years | 13 (23.6%) | 7 (17.5%) |
| 65 to 74 Years | 2 (28.6%) | 6 (75.0%) |
| 75 Years and over | 3 (50.0%) | 4 (100.0%) |
Disability Class: Vision Difficulty
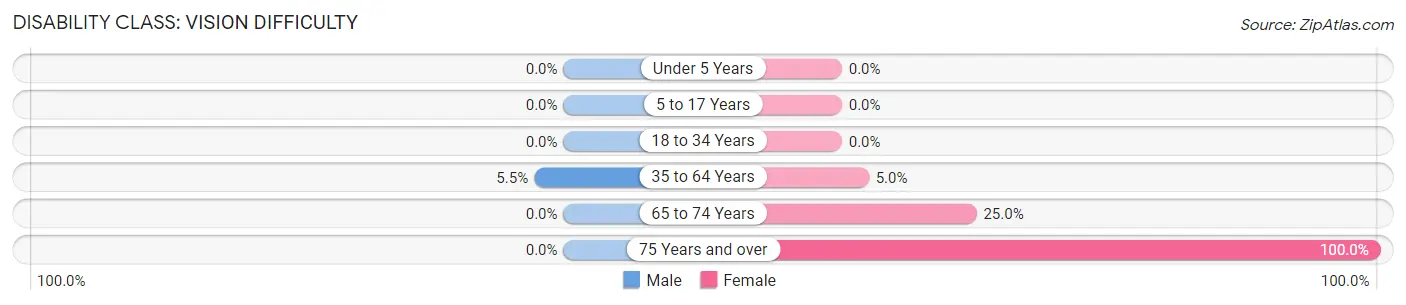
| Age Bracket | Male | Female |
| Under 5 Years | 0 (0.0%) | 0 (0.0%) |
| 5 to 17 Years | 0 (0.0%) | 0 (0.0%) |
| 18 to 34 Years | 0 (0.0%) | 0 (0.0%) |
| 35 to 64 Years | 3 (5.4%) | 2 (5.0%) |
| 65 to 74 Years | 0 (0.0%) | 2 (25.0%) |
| 75 Years and over | 0 (0.0%) | 4 (100.0%) |
Disability Class: Cognitive Difficulty
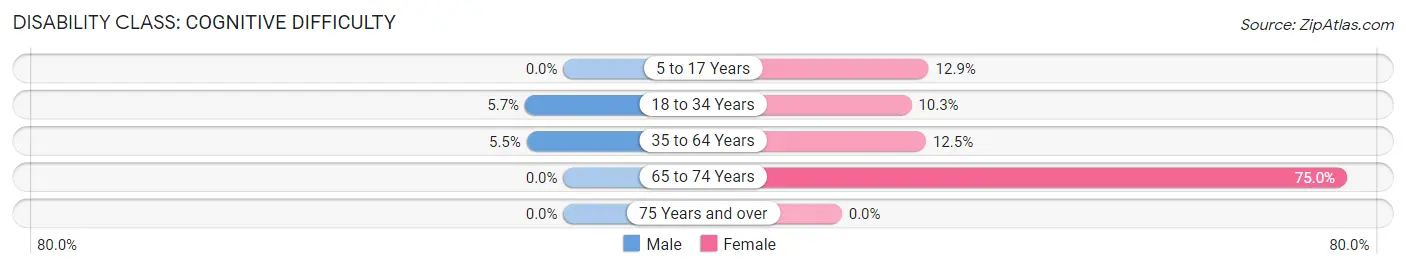
| Age Bracket | Male | Female |
| 5 to 17 Years | 0 (0.0%) | 4 (12.9%) |
| 18 to 34 Years | 4 (5.7%) | 3 (10.3%) |
| 35 to 64 Years | 3 (5.4%) | 5 (12.5%) |
| 65 to 74 Years | 0 (0.0%) | 6 (75.0%) |
| 75 Years and over | 0 (0.0%) | 0 (0.0%) |
Disability Class: Ambulatory Difficulty
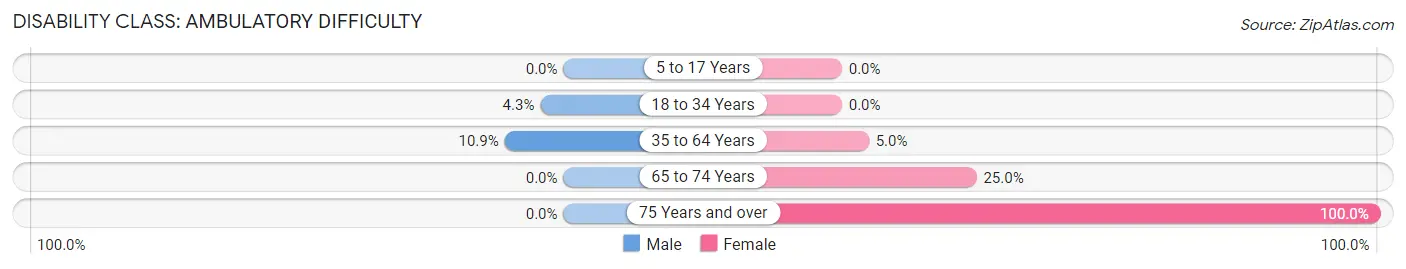
| Age Bracket | Male | Female |
| 5 to 17 Years | 0 (0.0%) | 0 (0.0%) |
| 18 to 34 Years | 3 (4.3%) | 0 (0.0%) |
| 35 to 64 Years | 6 (10.9%) | 2 (5.0%) |
| 65 to 74 Years | 0 (0.0%) | 2 (25.0%) |
| 75 Years and over | 0 (0.0%) | 4 (100.0%) |
Disability Class: Self-Care Difficulty
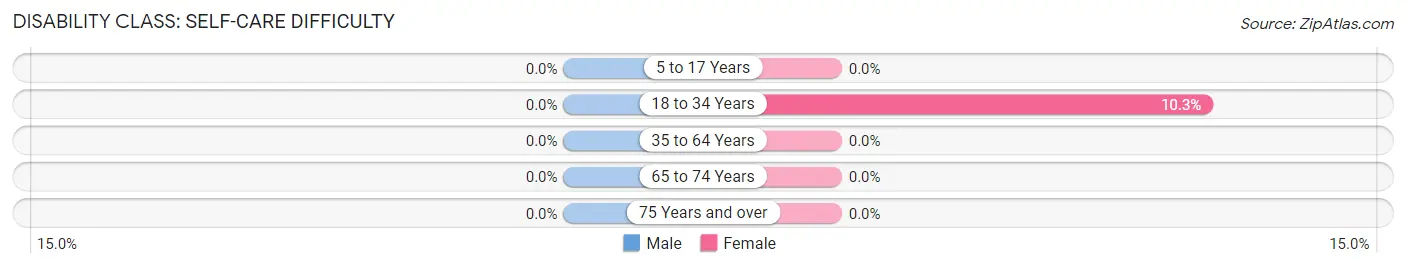
| Age Bracket | Male | Female |
| 5 to 17 Years | 0 (0.0%) | 0 (0.0%) |
| 18 to 34 Years | 0 (0.0%) | 3 (10.3%) |
| 35 to 64 Years | 0 (0.0%) | 0 (0.0%) |
| 65 to 74 Years | 0 (0.0%) | 0 (0.0%) |
| 75 Years and over | 0 (0.0%) | 0 (0.0%) |
Technology Access in Kongiganak
Computing Device Access in Kongiganak
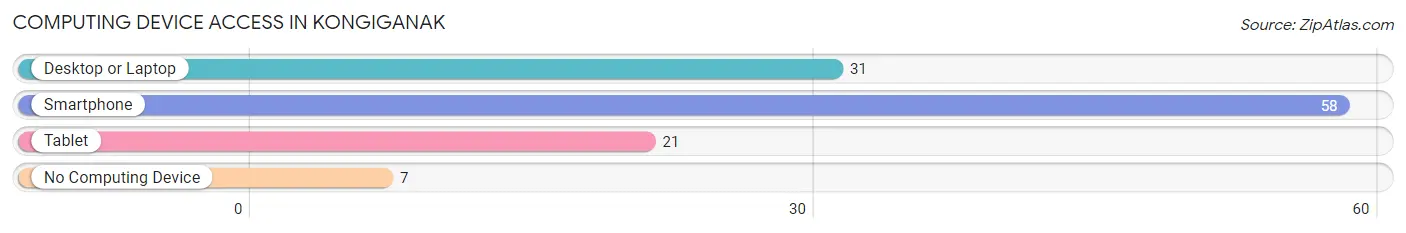
| Device Type | # Households | % Households |
| Desktop or Laptop | 31 | 47.7% |
| Smartphone | 58 | 89.2% |
| Tablet | 21 | 32.3% |
| No Computing Device | 7 | 10.8% |
| Total | 65 | 100.0% |
Internet Access in Kongiganak
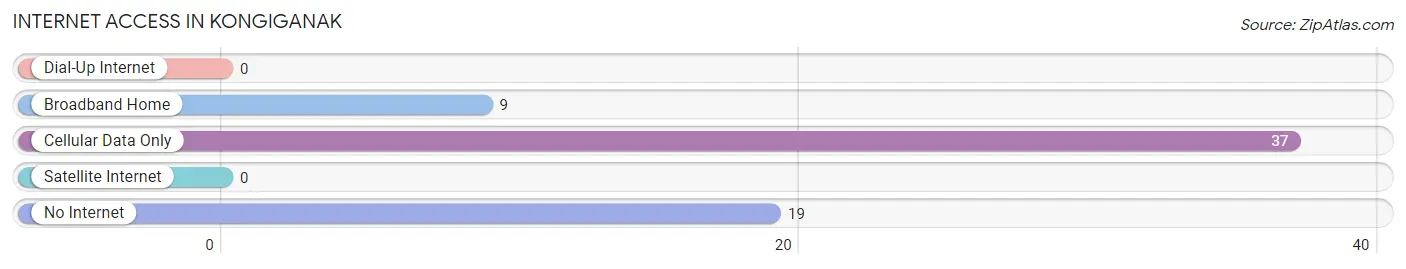
| Internet Type | # Households | % Households |
| Dial-Up Internet | 0 | 0.0% |
| Broadband Home | 9 | 13.9% |
| Cellular Data Only | 37 | 56.9% |
| Satellite Internet | 0 | 0.0% |
| No Internet | 19 | 29.2% |
| Total | 65 | 100.0% |
Kongiganak Summary
Kongiganak is a small village located in the Bethel Census Area of Alaska, United States. It is situated on the north bank of the Kuskokwim River, approximately 40 miles (64 km) east of Bethel. The population of Kongiganak was 517 at the 2010 census, down from 545 in 2000.
Geography
Kongiganak is located at 60°54′17″N 161°45′17″W (60.904722, -161.754722). According to the United States Census Bureau, the village has a total area of 1.2 square miles (3.1 km2), all of it land.
The village lies on the north bank of the Kuskokwim River, approximately 40 miles (64 km) east of Bethel. The Kuskokwim River is a major river in southwestern Alaska, and is the largest tributary of the Yukon River.
Climate
Kongiganak has a subarctic climate (Köppen climate classification Dfc). The average temperature in January is -14.3 °F (-25.7 °C), and in July it is 57.2 °F (14.0 °C). The average annual precipitation is 11.3 inches (286 mm).
Demographics
As of the census of 2000, there were 545 people, 145 households, and 119 families residing in the village. The population density was 454.3 people per square mile (175.7/km2). There were 166 housing units at an average density of 138.7 per square mile (53.5/km2). The racial makeup of the village was 3.48% White, 95.28% Native American, and 1.24% from two or more races.
Economy
Kongiganak's economy is based on subsistence activities such as fishing, hunting, and gathering. The village also has a small commercial fishing industry. The main fish species harvested are salmon, whitefish, and sheefish.
The village also has a small retail sector, with a few stores selling basic goods and services. There is also a post office in the village.
Education
Kongiganak is served by the Lower Kuskokwim School District. The village has one school, Kongiganak School, which serves students in grades K-12.
Transportation
Kongiganak is accessible by air and water. The village has a small airport, Kongiganak Airport, with scheduled flights to Bethel and other nearby villages. The village also has a boat harbor, which is used by commercial fishing boats and other vessels.
Culture
Kongiganak is an Alaska Native village, and the majority of the population is Yup'ik Eskimo. The Yup'ik language is still spoken in the village, and traditional subsistence activities such as fishing, hunting, and gathering are still practiced.
The village also has a traditional dance group, the Kongiganak Dance Group, which performs traditional Yup'ik dances at festivals and other events. The village also has a traditional drum group, the Kongiganak Drum Group, which performs traditional Yup'ik drumming.
Common Questions
What is Per Capita Income in Kongiganak?
Per Capita income in Kongiganak is $10,137.
What is the Median Family Income in Kongiganak?
Median Family Income in Kongiganak is $66,250.
What is the Median Household income in Kongiganak?
Median Household Income in Kongiganak is $60,938.
What is Inequality or Gini Index in Kongiganak?
Inequality or Gini Index in Kongiganak is 0.33.
What is the Total Population of Kongiganak?
Total Population of Kongiganak is 353.
What is the Total Male Population of Kongiganak?
Total Male Population of Kongiganak is 215.
What is the Total Female Population of Kongiganak?
Total Female Population of Kongiganak is 138.
What is the Ratio of Males per 100 Females in Kongiganak?
There are 155.80 Males per 100 Females in Kongiganak.
What is the Ratio of Females per 100 Males in Kongiganak?
There are 64.19 Females per 100 Males in Kongiganak.
What is the Median Population Age in Kongiganak?
Median Population Age in Kongiganak is 25.3 Years.
What is the Average Family Size in Kongiganak
Average Family Size in Kongiganak is 6.1 People.
What is the Average Household Size in Kongiganak
Average Household Size in Kongiganak is 5.4 People.
How Large is the Labor Force in Kongiganak?
There are 114 People in the Labor Forcein in Kongiganak.
What is the Percentage of People in the Labor Force in Kongiganak?
50.0% of People are in the Labor Force in Kongiganak.
What is the Unemployment Rate in Kongiganak?
Unemployment Rate in Kongiganak is 21.9%.