Farm Loop, AK Map & Demographics
Farm Loop Map
Farm Loop Overview
$46,587
PER CAPITA INCOME
$117,422
AVG FAMILY INCOME
$112,683
AVG HOUSEHOLD INCOME
51.4%
WAGE / INCOME GAP [ % ]
48.6¢/ $1
WAGE / INCOME GAP [ $ ]
0.39
INEQUALITY / GINI INDEX
2,561
TOTAL POPULATION
1,284
MALE POPULATION
1,277
FEMALE POPULATION
100.55
MALES / 100 FEMALES
99.45
FEMALES / 100 MALES
40.9
MEDIAN AGE
3.1
AVG FAMILY SIZE
2.7
AVG HOUSEHOLD SIZE
1,371
LABOR FORCE [ PEOPLE ]
67.4%
PERCENT IN LABOR FORCE
7.8%
UNEMPLOYMENT RATE
Income in Farm Loop
Income Overview in Farm Loop
Per Capita Income in Farm Loop is $46,587, while median incomes of families and households are $117,422 and $112,683 respectively.
| Characteristic | Number | Measure |
| Per Capita Income | 2,561 | $46,587 |
| Median Family Income | 731 | $117,422 |
| Mean Family Income | 731 | $139,242 |
| Median Household Income | 944 | $112,683 |
| Mean Household Income | 944 | $126,009 |
| Income Deficit | 731 | $0 |
| Wage / Income Gap (%) | 2,561 | 51.40% |
| Wage / Income Gap ($) | 2,561 | 48.60¢ per $1 |
| Gini / Inequality Index | 2,561 | 0.39 |
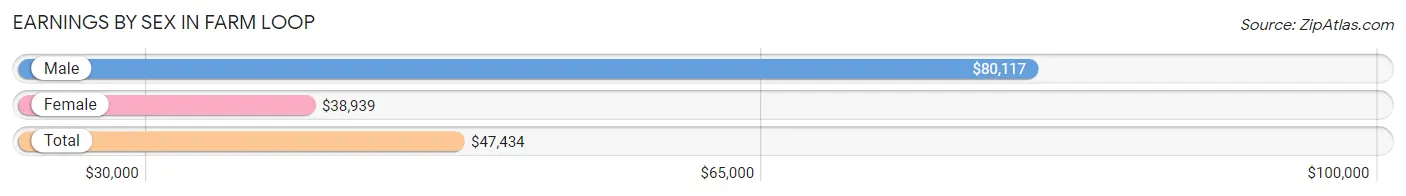
Earnings by Sex in Farm Loop
Average Earnings in Farm Loop are $47,434, $80,117 for men and $38,939 for women, a difference of 51.4%.
| Sex | Number | Average Earnings |
| Male | 723 (49.3%) | $80,117 |
| Female | 742 (50.6%) | $38,939 |
| Total | 1,465 (100.0%) | $47,434 |
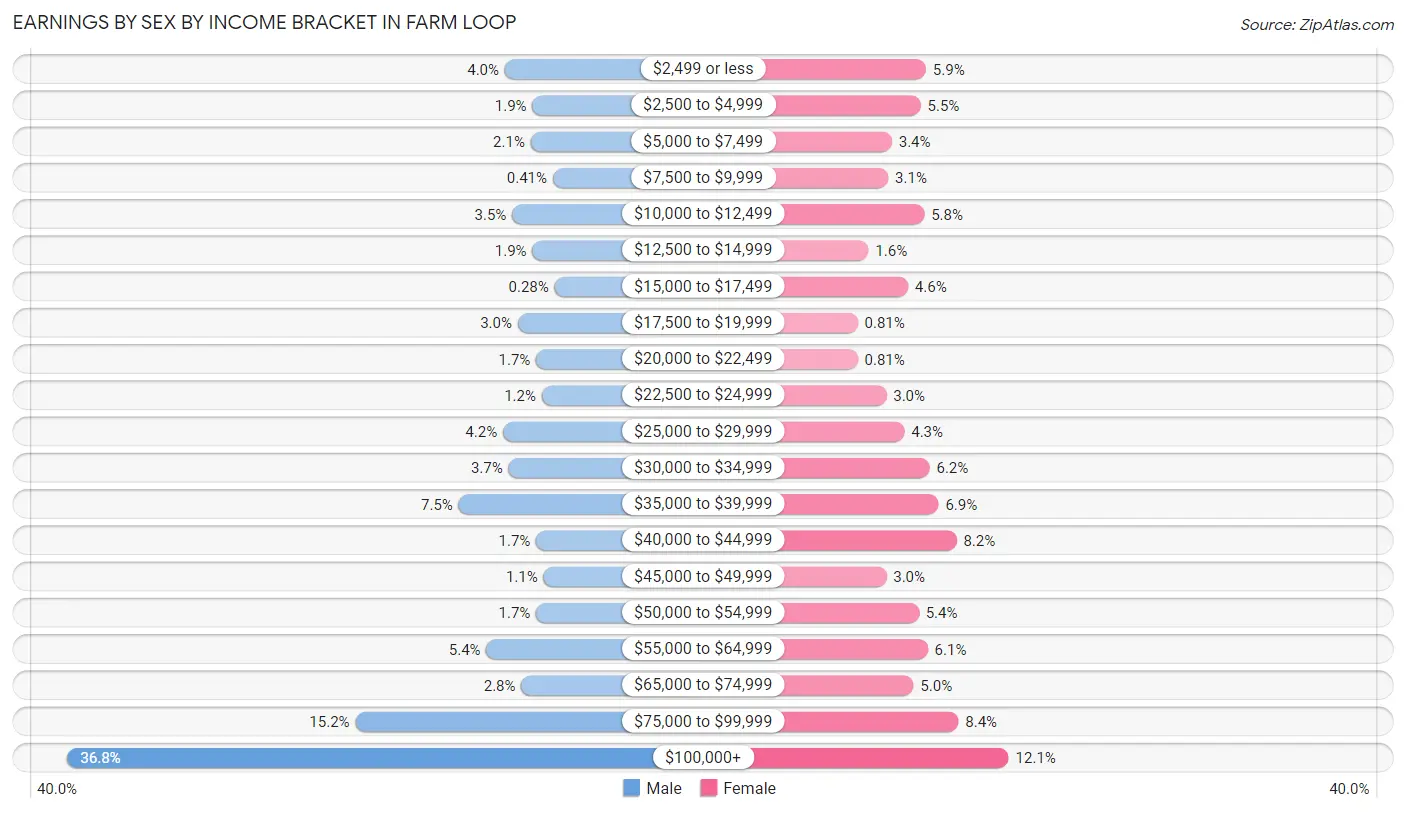
Earnings by Sex by Income Bracket in Farm Loop
The most common earnings brackets in Farm Loop are $100,000+ for men (266 | 36.8%) and $100,000+ for women (90 | 12.1%).
| Income | Male | Female |
| $2,499 or less | 29 (4.0%) | 44 (5.9%) |
| $2,500 to $4,999 | 14 (1.9%) | 41 (5.5%) |
| $5,000 to $7,499 | 15 (2.1%) | 25 (3.4%) |
| $7,500 to $9,999 | 3 (0.4%) | 23 (3.1%) |
| $10,000 to $12,499 | 25 (3.5%) | 43 (5.8%) |
| $12,500 to $14,999 | 14 (1.9%) | 12 (1.6%) |
| $15,000 to $17,499 | 2 (0.3%) | 34 (4.6%) |
| $17,500 to $19,999 | 22 (3.0%) | 6 (0.8%) |
| $20,000 to $22,499 | 12 (1.7%) | 6 (0.8%) |
| $22,500 to $24,999 | 9 (1.2%) | 22 (3.0%) |
| $25,000 to $29,999 | 30 (4.2%) | 32 (4.3%) |
| $30,000 to $34,999 | 27 (3.7%) | 46 (6.2%) |
| $35,000 to $39,999 | 54 (7.5%) | 51 (6.9%) |
| $40,000 to $44,999 | 12 (1.7%) | 61 (8.2%) |
| $45,000 to $49,999 | 8 (1.1%) | 22 (3.0%) |
| $50,000 to $54,999 | 12 (1.7%) | 40 (5.4%) |
| $55,000 to $64,999 | 39 (5.4%) | 45 (6.1%) |
| $65,000 to $74,999 | 20 (2.8%) | 37 (5.0%) |
| $75,000 to $99,999 | 110 (15.2%) | 62 (8.4%) |
| $100,000+ | 266 (36.8%) | 90 (12.1%) |
| Total | 723 (100.0%) | 742 (100.0%) |
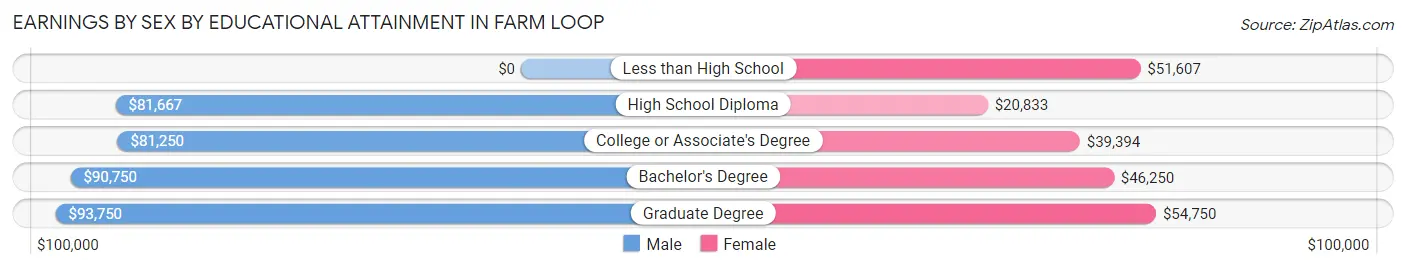
Earnings by Sex by Educational Attainment in Farm Loop
Average earnings in Farm Loop are $82,344 for men and $41,935 for women, a difference of 49.1%. Men with an educational attainment of graduate degree enjoy the highest average annual earnings of $93,750, while those with college or associate's degree education earn the least with $81,250. Women with an educational attainment of graduate degree earn the most with the average annual earnings of $54,750, while those with high school diploma education have the smallest earnings of $20,833.
| Educational Attainment | Male Income | Female Income |
| Less than High School | - | - |
| High School Diploma | $81,667 | $20,833 |
| College or Associate's Degree | $81,250 | $39,394 |
| Bachelor's Degree | $90,750 | $46,250 |
| Graduate Degree | $93,750 | $54,750 |
| Total | $82,344 | $41,935 |
Family Income in Farm Loop
Family Income Brackets in Farm Loop
According to the Farm Loop family income data, there are 190 families falling into the $100,000 to $149,999 income range, which is the most common income bracket and makes up 26.0% of all families. Conversely, the $15,000 to $24,999 income bracket is the least frequent group with only 4 families (0.5%) belonging to this category.
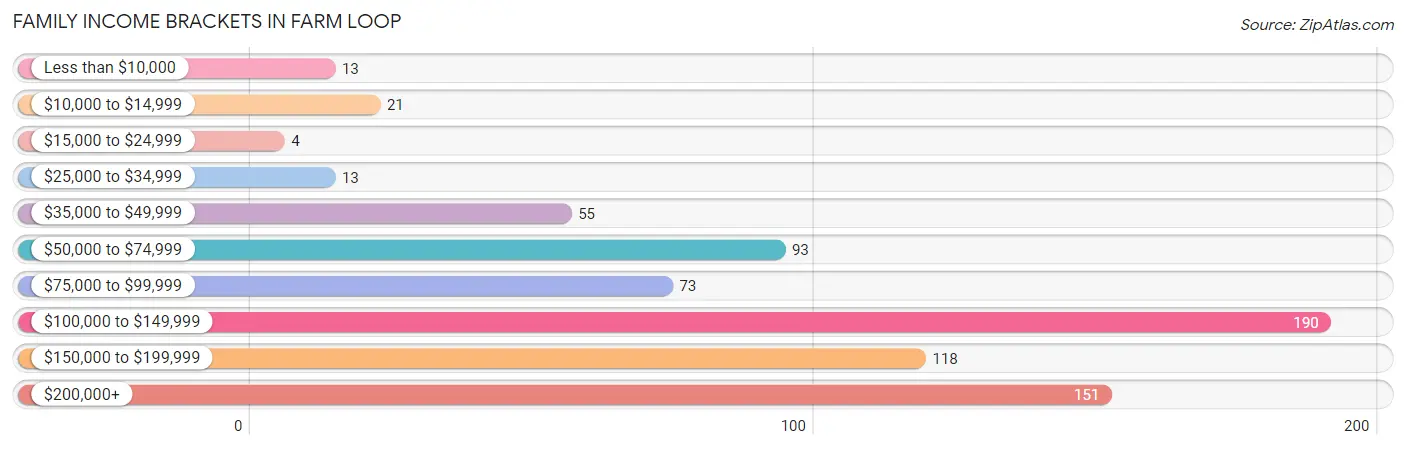
| Income Bracket | # Families | % Families |
| Less than $10,000 | 13 | 1.8% |
| $10,000 to $14,999 | 21 | 2.9% |
| $15,000 to $24,999 | 4 | 0.5% |
| $25,000 to $34,999 | 13 | 1.8% |
| $35,000 to $49,999 | 55 | 7.5% |
| $50,000 to $74,999 | 93 | 12.7% |
| $75,000 to $99,999 | 73 | 10.0% |
| $100,000 to $149,999 | 190 | 26.0% |
| $150,000 to $199,999 | 118 | 16.1% |
| $200,000+ | 151 | 20.7% |
Family Income by Famaliy Size in Farm Loop
6-person families (16 | 2.2%) account for the highest median family income in Farm Loop with $145,000 per family, while 2-person families (343 | 46.9%) have the highest median income of $52,330 per family member.
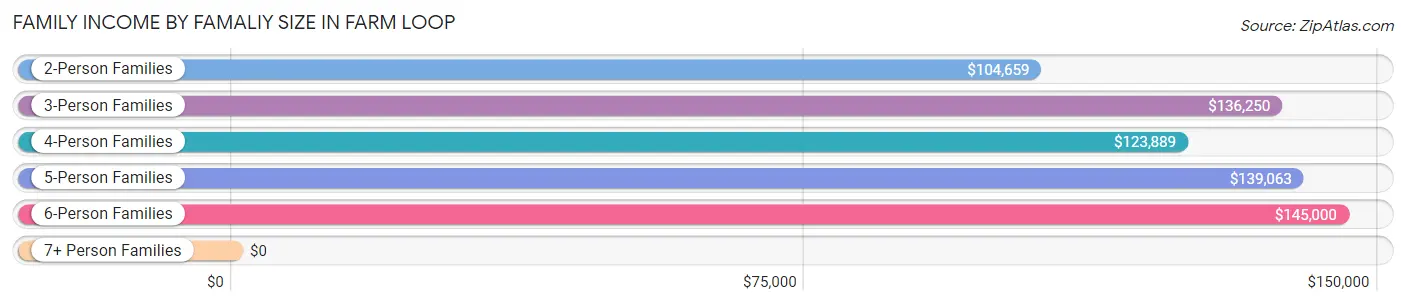
| Income Bracket | # Families | Median Income |
| 2-Person Families | 343 (46.9%) | $104,659 |
| 3-Person Families | 154 (21.1%) | $136,250 |
| 4-Person Families | 124 (17.0%) | $123,889 |
| 5-Person Families | 87 (11.9%) | $139,063 |
| 6-Person Families | 16 (2.2%) | $145,000 |
| 7+ Person Families | 7 (1.0%) | $0 |
| Total | 731 (100.0%) | $117,422 |
Family Income by Number of Earners in Farm Loop
The median family income in Farm Loop is $117,422, with families comprising 3+ earners (94) having the highest median family income of $206,667, while families with no earners (103) have the lowest median family income of $66,563, accounting for 12.9% and 14.1% of families, respectively.
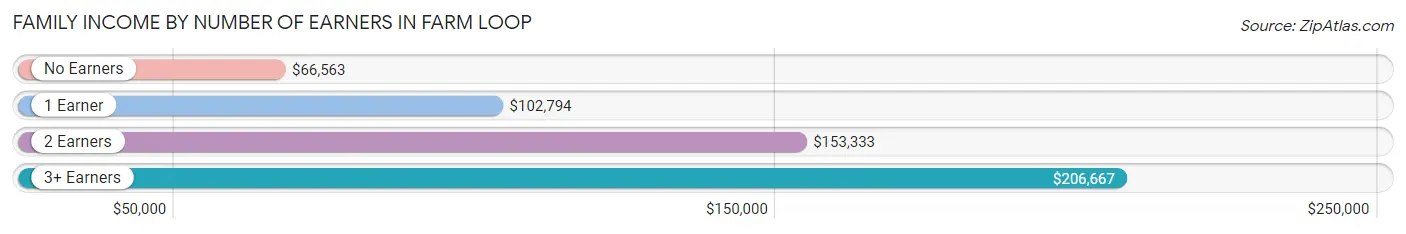
| Number of Earners | # Families | Median Income |
| No Earners | 103 (14.1%) | $66,563 |
| 1 Earner | 174 (23.8%) | $102,794 |
| 2 Earners | 360 (49.2%) | $153,333 |
| 3+ Earners | 94 (12.9%) | $206,667 |
| Total | 731 (100.0%) | $117,422 |
Household Income in Farm Loop
Household Income Brackets in Farm Loop
With 213 households falling in the category, the $100,000 to $149,999 income range is the most frequent in Farm Loop, accounting for 22.6% of all households. In contrast, only 9 households (0.9%) fall into the $15,000 to $24,999 income bracket, making it the least populous group.
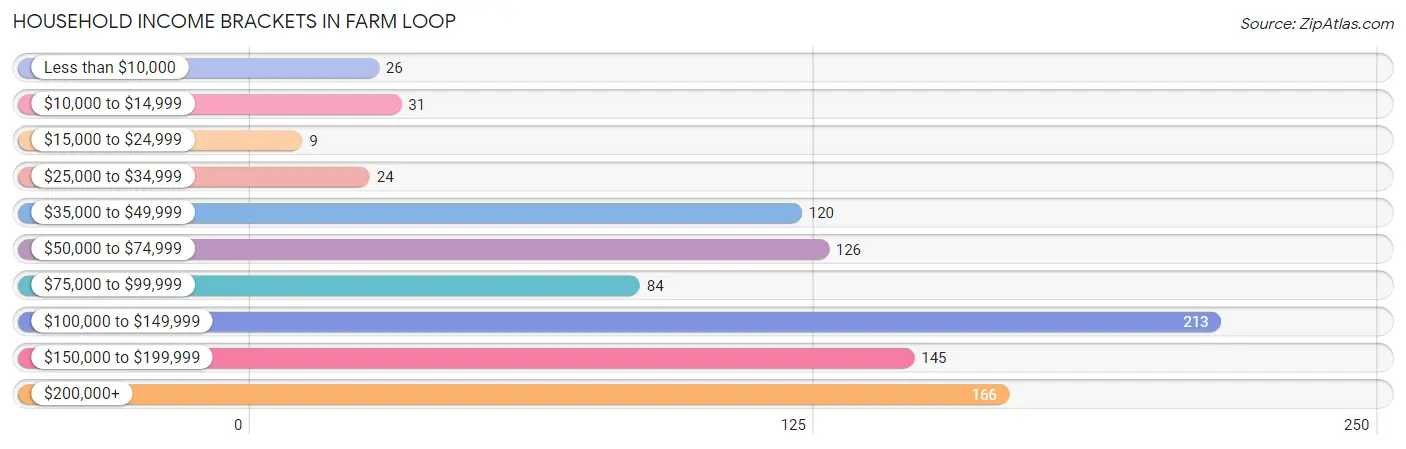
| Income Bracket | # Households | % Households |
| Less than $10,000 | 26 | 2.8% |
| $10,000 to $14,999 | 31 | 3.3% |
| $15,000 to $24,999 | 9 | 1.0% |
| $25,000 to $34,999 | 24 | 2.5% |
| $35,000 to $49,999 | 120 | 12.7% |
| $50,000 to $74,999 | 126 | 13.3% |
| $75,000 to $99,999 | 84 | 8.9% |
| $100,000 to $149,999 | 213 | 22.6% |
| $150,000 to $199,999 | 145 | 15.4% |
| $200,000+ | 166 | 17.6% |
Household Income by Householder Age in Farm Loop
The median household income in Farm Loop is $112,683, with the highest median household income of $156,667 found in the 45 to 64 years age bracket for the primary householder. A total of 348 households (36.9%) fall into this category. Meanwhile, the 15 to 24 years age bracket for the primary householder has the lowest median household income of $0, with 4 households (0.4%) in this group.
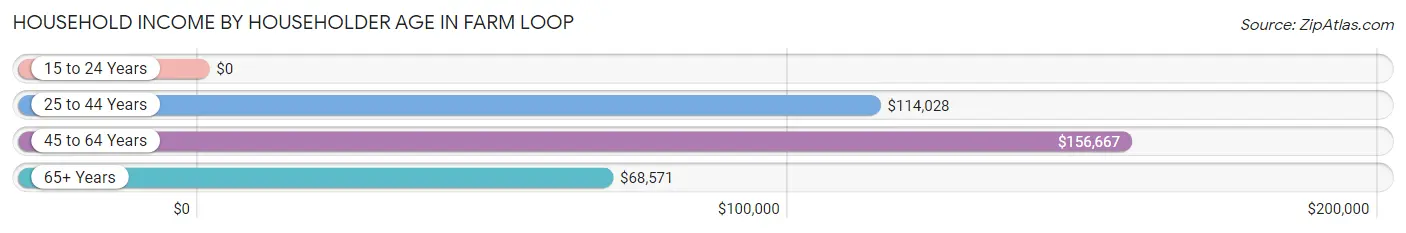
| Income Bracket | # Households | Median Income |
| 15 to 24 Years | 4 (0.4%) | $0 |
| 25 to 44 Years | 332 (35.2%) | $114,028 |
| 45 to 64 Years | 348 (36.9%) | $156,667 |
| 65+ Years | 260 (27.5%) | $68,571 |
| Total | 944 (100.0%) | $112,683 |
Poverty in Farm Loop
Income Below Poverty by Sex and Age in Farm Loop
With 5.5% poverty level for males and 7.8% for females among the residents of Farm Loop, 6 to 11 year old males and 16 and 17 year old females are the most vulnerable to poverty, with 16 males (15.1%) and 9 females (23.1%) in their respective age groups living below the poverty level.
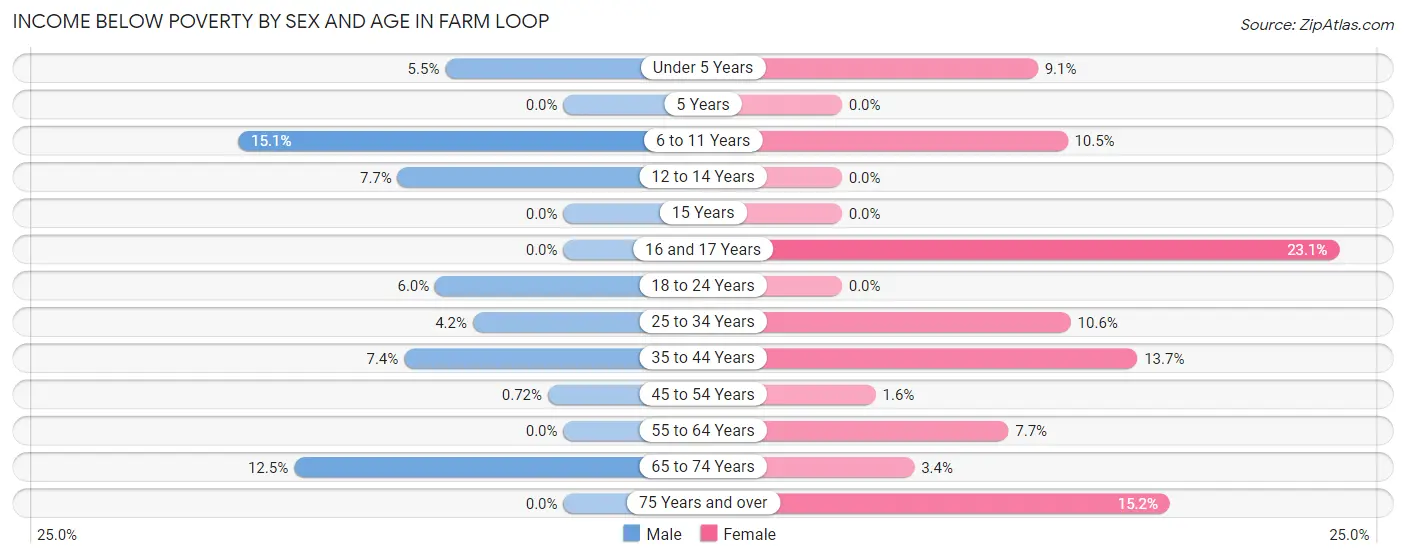
| Age Bracket | Male | Female |
| Under 5 Years | 4 (5.5%) | 7 (9.1%) |
| 5 Years | 0 (0.0%) | 0 (0.0%) |
| 6 to 11 Years | 16 (15.1%) | 9 (10.5%) |
| 12 to 14 Years | 5 (7.7%) | 0 (0.0%) |
| 15 Years | 0 (0.0%) | 0 (0.0%) |
| 16 and 17 Years | 0 (0.0%) | 9 (23.1%) |
| 18 to 24 Years | 5 (5.9%) | 0 (0.0%) |
| 25 to 34 Years | 6 (4.2%) | 17 (10.6%) |
| 35 to 44 Years | 17 (7.4%) | 27 (13.7%) |
| 45 to 54 Years | 1 (0.7%) | 3 (1.6%) |
| 55 to 64 Years | 0 (0.0%) | 14 (7.7%) |
| 65 to 74 Years | 17 (12.5%) | 5 (3.4%) |
| 75 Years and over | 0 (0.0%) | 7 (15.2%) |
| Total | 71 (5.5%) | 98 (7.8%) |
Income Above Poverty by Sex and Age in Farm Loop
According to the poverty statistics in Farm Loop, males aged 5 years and females aged 5 years are the age groups that are most secure financially, with 100.0% of males and 100.0% of females in these age groups living above the poverty line.
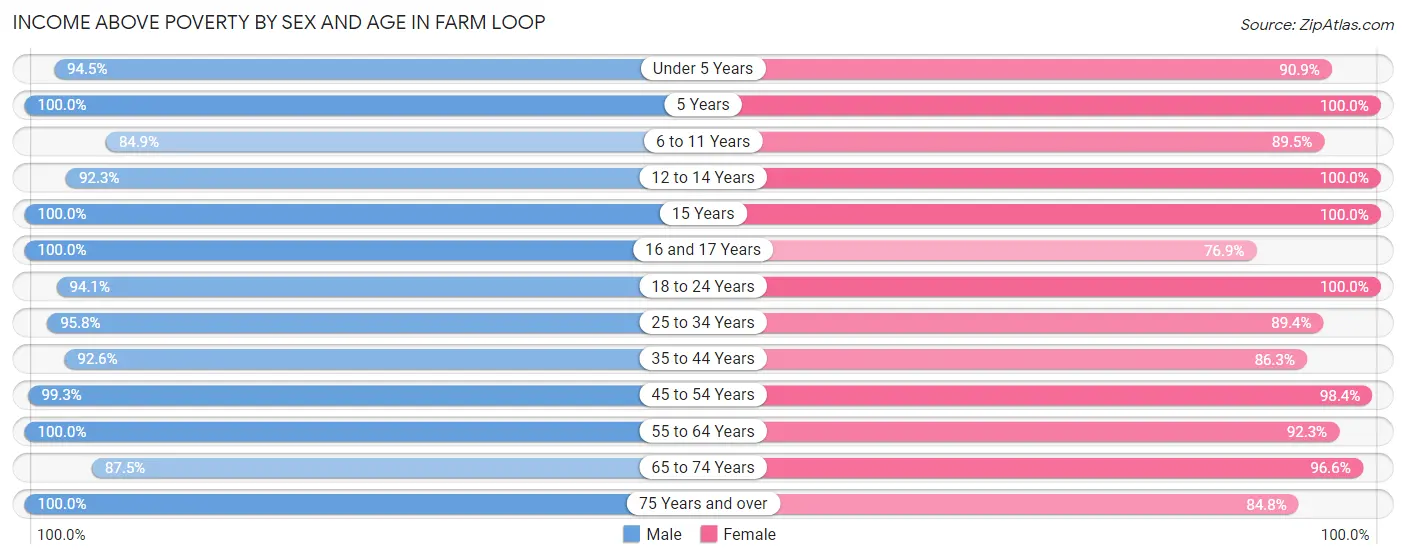
| Age Bracket | Male | Female |
| Under 5 Years | 69 (94.5%) | 70 (90.9%) |
| 5 Years | 12 (100.0%) | 8 (100.0%) |
| 6 to 11 Years | 90 (84.9%) | 77 (89.5%) |
| 12 to 14 Years | 60 (92.3%) | 39 (100.0%) |
| 15 Years | 28 (100.0%) | 19 (100.0%) |
| 16 and 17 Years | 27 (100.0%) | 30 (76.9%) |
| 18 to 24 Years | 79 (94.1%) | 68 (100.0%) |
| 25 to 34 Years | 137 (95.8%) | 143 (89.4%) |
| 35 to 44 Years | 213 (92.6%) | 170 (86.3%) |
| 45 to 54 Years | 138 (99.3%) | 188 (98.4%) |
| 55 to 64 Years | 188 (100.0%) | 167 (92.3%) |
| 65 to 74 Years | 119 (87.5%) | 144 (96.6%) |
| 75 Years and over | 53 (100.0%) | 39 (84.8%) |
| Total | 1,213 (94.5%) | 1,162 (92.2%) |
Income Below Poverty Among Married-Couple Families in Farm Loop
The poverty statistics for married-couple families in Farm Loop show that 2.6% or 16 of the total 621 families live below the poverty line. Families with 1 or 2 children have the highest poverty rate of 9.3%, comprising of 16 families. On the other hand, families with no children have the lowest poverty rate of 0.0%, which includes 0 families.
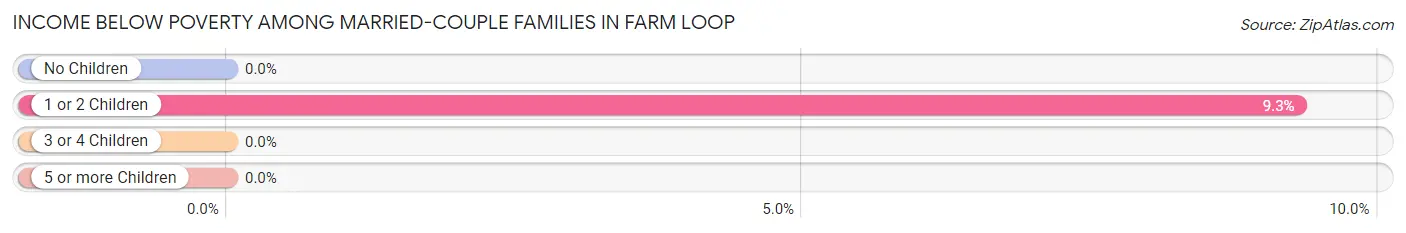
| Children | Above Poverty | Below Poverty |
| No Children | 379 (100.0%) | 0 (0.0%) |
| 1 or 2 Children | 156 (90.7%) | 16 (9.3%) |
| 3 or 4 Children | 67 (100.0%) | 0 (0.0%) |
| 5 or more Children | 3 (100.0%) | 0 (0.0%) |
| Total | 605 (97.4%) | 16 (2.6%) |
Income Below Poverty Among Single-Parent Households in Farm Loop
According to the poverty data in Farm Loop, 31.2% or 5 single-father households and 18.1% or 17 single-mother households are living below the poverty line. Among single-father households, those with 1 or 2 children have the highest poverty rate, with 4 households (80.0%) experiencing poverty. Likewise, among single-mother households, those with 3 or 4 children have the highest poverty rate, with 5 households (23.8%) falling below the poverty line.
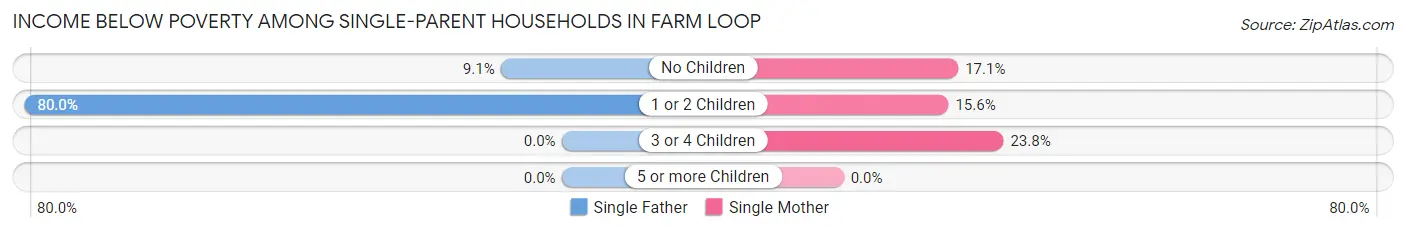
| Children | Single Father | Single Mother |
| No Children | 1 (9.1%) | 7 (17.1%) |
| 1 or 2 Children | 4 (80.0%) | 5 (15.6%) |
| 3 or 4 Children | 0 (0.0%) | 5 (23.8%) |
| 5 or more Children | 0 (0.0%) | 0 (0.0%) |
| Total | 5 (31.2%) | 17 (18.1%) |
Income Below Poverty Among Married-Couple vs Single-Parent Households in Farm Loop
The poverty data for Farm Loop shows that 16 of the married-couple family households (2.6%) and 22 of the single-parent households (20.0%) are living below the poverty level. Within the married-couple family households, those with 1 or 2 children have the highest poverty rate, with 16 households (9.3%) falling below the poverty line. Among the single-parent households, those with 1 or 2 children have the highest poverty rate, with 9 household (24.3%) living below poverty.
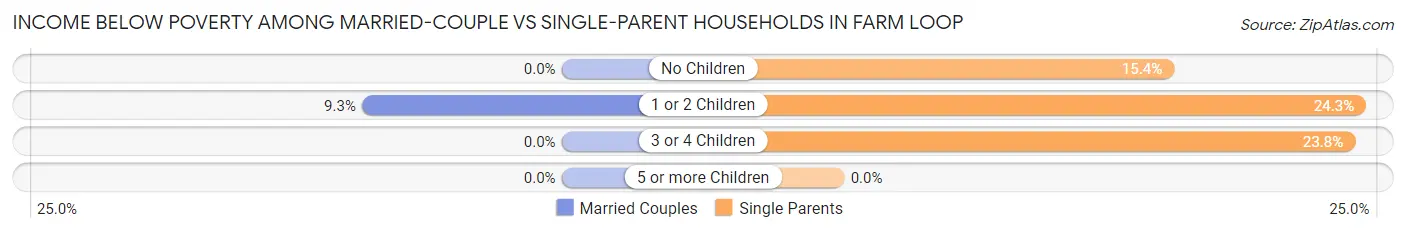
| Children | Married-Couple Families | Single-Parent Households |
| No Children | 0 (0.0%) | 8 (15.4%) |
| 1 or 2 Children | 16 (9.3%) | 9 (24.3%) |
| 3 or 4 Children | 0 (0.0%) | 5 (23.8%) |
| 5 or more Children | 0 (0.0%) | 0 (0.0%) |
| Total | 16 (2.6%) | 22 (20.0%) |
Race in Farm Loop
The most populous races in Farm Loop are White / Caucasian (2,133 | 83.3%), Two or more Races (314 | 12.3%), and Hispanic or Latino (123 | 4.8%).
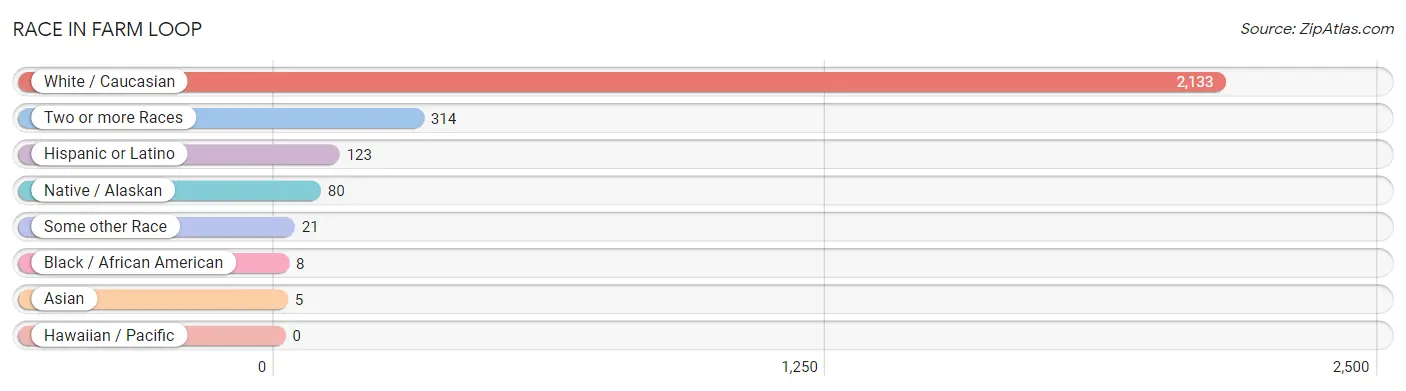
| Race | # Population | % Population |
| Asian | 5 | 0.2% |
| Black / African American | 8 | 0.3% |
| Hawaiian / Pacific | 0 | 0.0% |
| Hispanic or Latino | 123 | 4.8% |
| Native / Alaskan | 80 | 3.1% |
| White / Caucasian | 2,133 | 83.3% |
| Two or more Races | 314 | 12.3% |
| Some other Race | 21 | 0.8% |
| Total | 2,561 | 100.0% |
Ancestry in Farm Loop
The most populous ancestries reported in Farm Loop are German (407 | 15.9%), Irish (314 | 12.3%), English (281 | 11.0%), American (259 | 10.1%), and Norwegian (126 | 4.9%), together accounting for 54.2% of all Farm Loop residents.
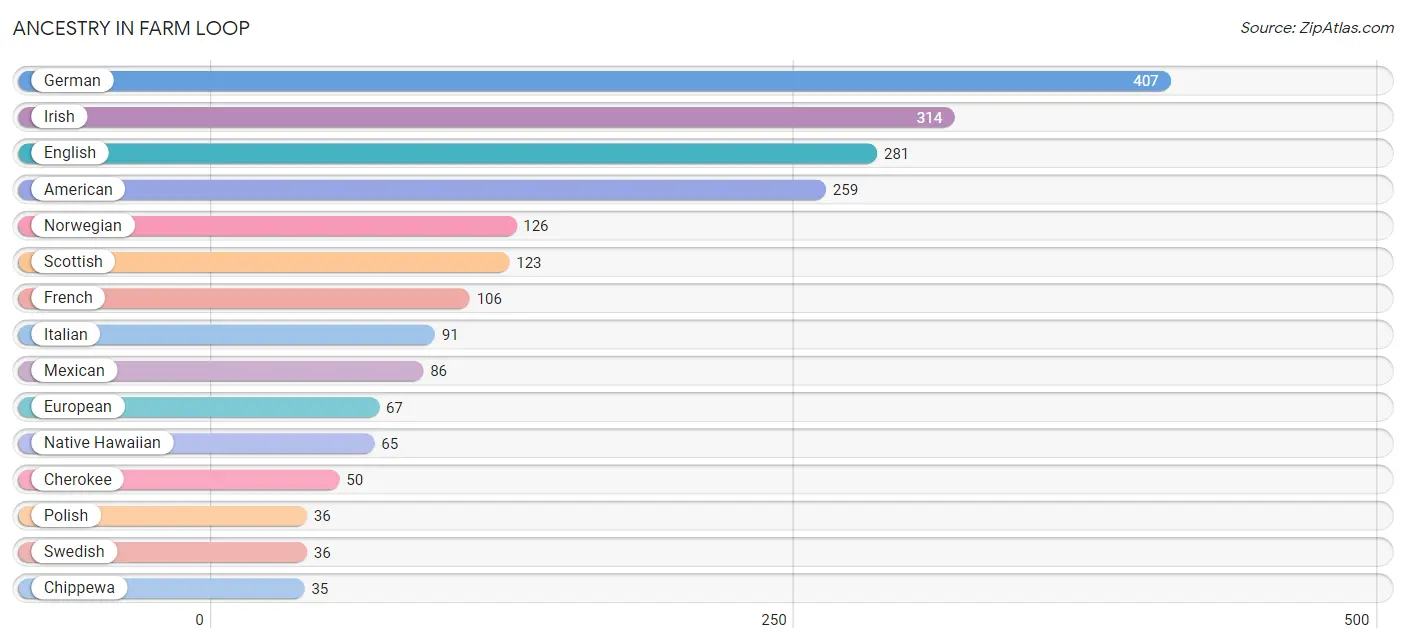
| Ancestry | # Population | % Population |
| Alaska Native | 19 | 0.7% |
| Alaskan Athabascan | 14 | 0.5% |
| Aleut | 30 | 1.2% |
| American | 259 | 10.1% |
| Arab | 5 | 0.2% |
| Austrian | 3 | 0.1% |
| Bhutanese | 22 | 0.9% |
| British | 21 | 0.8% |
| Canadian | 4 | 0.2% |
| Cherokee | 50 | 1.9% |
| Chippewa | 35 | 1.4% |
| Czech | 26 | 1.0% |
| Czechoslovakian | 4 | 0.2% |
| Danish | 3 | 0.1% |
| Dutch | 20 | 0.8% |
| English | 281 | 11.0% |
| European | 67 | 2.6% |
| Finnish | 27 | 1.1% |
| French | 106 | 4.1% |
| French Canadian | 17 | 0.7% |
| German | 407 | 15.9% |
| Greek | 11 | 0.4% |
| Hungarian | 5 | 0.2% |
| Inupiat | 11 | 0.4% |
| Iraqi | 5 | 0.2% |
| Irish | 314 | 12.3% |
| Israeli | 4 | 0.2% |
| Italian | 91 | 3.5% |
| Korean | 34 | 1.3% |
| Lithuanian | 11 | 0.4% |
| Mexican | 86 | 3.4% |
| Native Hawaiian | 65 | 2.5% |
| Navajo | 17 | 0.7% |
| Northern European | 16 | 0.6% |
| Norwegian | 126 | 4.9% |
| Polish | 36 | 1.4% |
| Portuguese | 8 | 0.3% |
| Puerto Rican | 29 | 1.1% |
| Romanian | 4 | 0.2% |
| Russian | 1 | 0.0% |
| Scandinavian | 6 | 0.2% |
| Scotch-Irish | 28 | 1.1% |
| Scottish | 123 | 4.8% |
| Slovak | 7 | 0.3% |
| Spaniard | 4 | 0.2% |
| Swedish | 36 | 1.4% |
| Swiss | 1 | 0.0% |
| Tlingit-Haida | 3 | 0.1% |
| Ukrainian | 19 | 0.7% |
| Ute | 5 | 0.2% |
| Welsh | 15 | 0.6% |
| Yup'ik | 13 | 0.5% | View All 52 Rows |
Immigrants in Farm Loop
The most numerous immigrant groups reported in Farm Loop came from Canada (11 | 0.4%), Europe (10 | 0.4%), Northern Europe (9 | 0.4%), Asia (6 | 0.2%), and Western Asia (6 | 0.2%), together accounting for 1.6% of all Farm Loop residents.
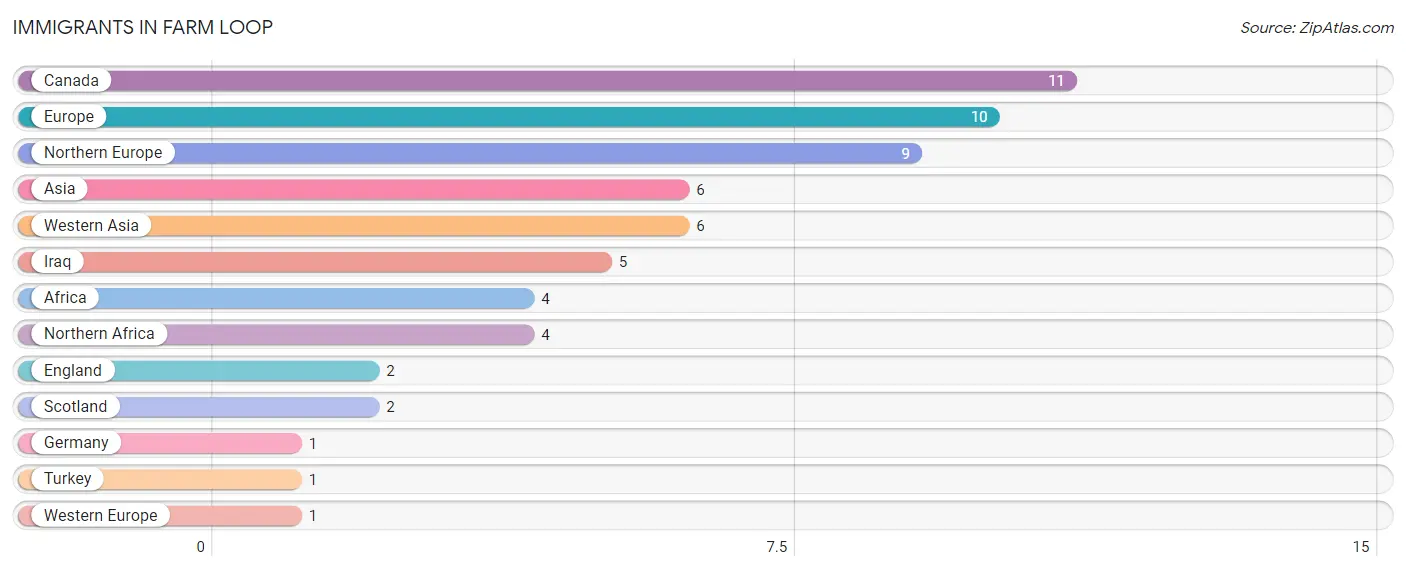
| Immigration Origin | # Population | % Population |
| Africa | 4 | 0.2% |
| Asia | 6 | 0.2% |
| Canada | 11 | 0.4% |
| England | 2 | 0.1% |
| Europe | 10 | 0.4% |
| Germany | 1 | 0.0% |
| Iraq | 5 | 0.2% |
| Northern Africa | 4 | 0.2% |
| Northern Europe | 9 | 0.4% |
| Scotland | 2 | 0.1% |
| Turkey | 1 | 0.0% |
| Western Asia | 6 | 0.2% |
| Western Europe | 1 | 0.0% | View All 13 Rows |
Sex and Age in Farm Loop
Sex and Age in Farm Loop
The most populous age groups in Farm Loop are 40 to 44 Years (138 | 10.7%) for men and 45 to 49 Years (120 | 9.4%) for women.
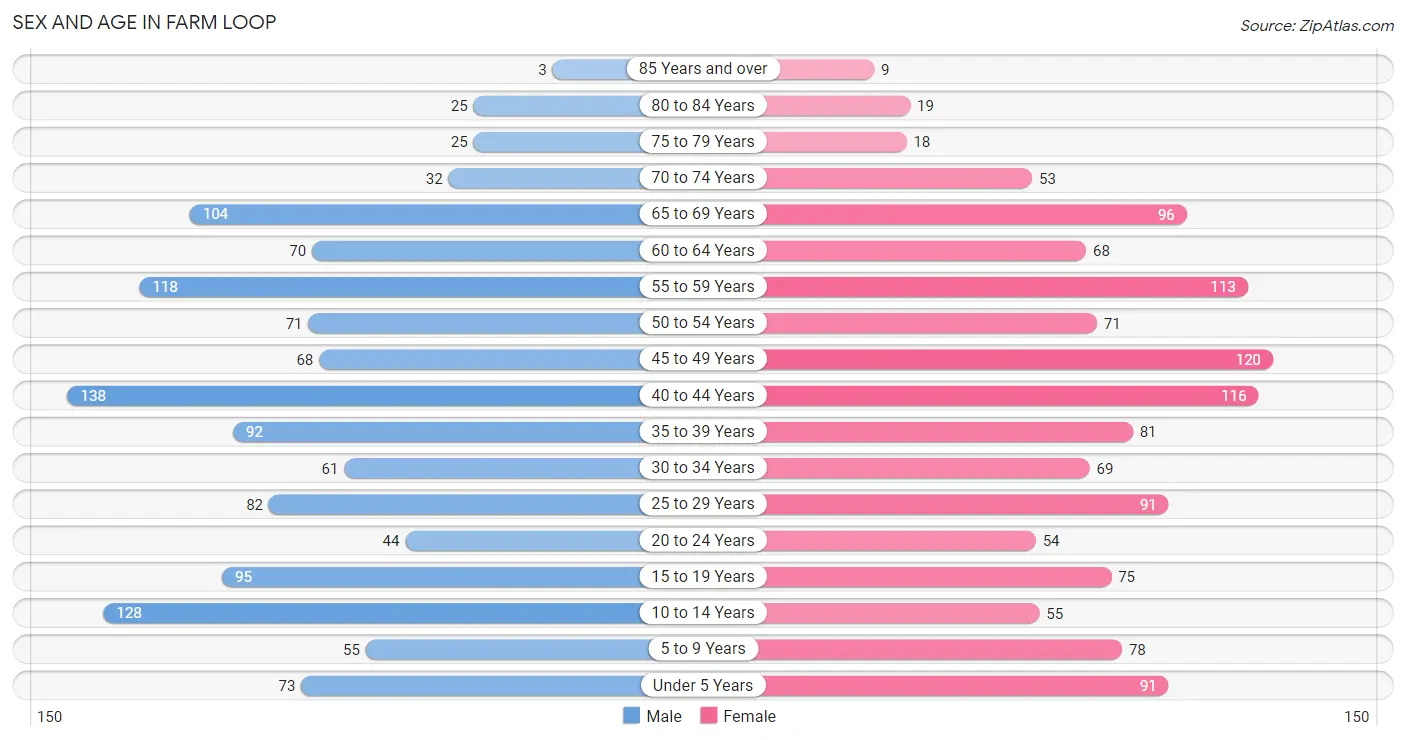
| Age Bracket | Male | Female |
| Under 5 Years | 73 (5.7%) | 91 (7.1%) |
| 5 to 9 Years | 55 (4.3%) | 78 (6.1%) |
| 10 to 14 Years | 128 (10.0%) | 55 (4.3%) |
| 15 to 19 Years | 95 (7.4%) | 75 (5.9%) |
| 20 to 24 Years | 44 (3.4%) | 54 (4.2%) |
| 25 to 29 Years | 82 (6.4%) | 91 (7.1%) |
| 30 to 34 Years | 61 (4.8%) | 69 (5.4%) |
| 35 to 39 Years | 92 (7.2%) | 81 (6.3%) |
| 40 to 44 Years | 138 (10.7%) | 116 (9.1%) |
| 45 to 49 Years | 68 (5.3%) | 120 (9.4%) |
| 50 to 54 Years | 71 (5.5%) | 71 (5.6%) |
| 55 to 59 Years | 118 (9.2%) | 113 (8.8%) |
| 60 to 64 Years | 70 (5.4%) | 68 (5.3%) |
| 65 to 69 Years | 104 (8.1%) | 96 (7.5%) |
| 70 to 74 Years | 32 (2.5%) | 53 (4.2%) |
| 75 to 79 Years | 25 (1.9%) | 18 (1.4%) |
| 80 to 84 Years | 25 (1.9%) | 19 (1.5%) |
| 85 Years and over | 3 (0.2%) | 9 (0.7%) |
| Total | 1,284 (100.0%) | 1,277 (100.0%) |
Families and Households in Farm Loop
Median Family Size in Farm Loop
The median family size in Farm Loop is 3.06 persons per family, with married-couple families (621 | 85.0%) accounting for the largest median family size of 3.11 persons per family. On the other hand, single male/father families (16 | 2.2%) represent the smallest median family size with 2.63 persons per family.
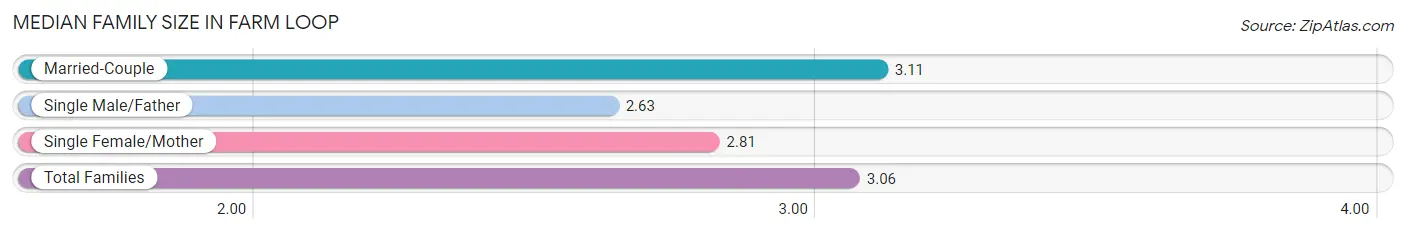
| Family Type | # Families | Family Size |
| Married-Couple | 621 (85.0%) | 3.11 |
| Single Male/Father | 16 (2.2%) | 2.63 |
| Single Female/Mother | 94 (12.9%) | 2.81 |
| Total Families | 731 (100.0%) | 3.06 |
Median Household Size in Farm Loop
The median household size in Farm Loop is 2.71 persons per household, with single male/father households (16 | 1.7%) accounting for the largest median household size of 3.75 persons per household. non-family households (213 | 22.6%) represent the smallest median household size with 1.28 persons per household.
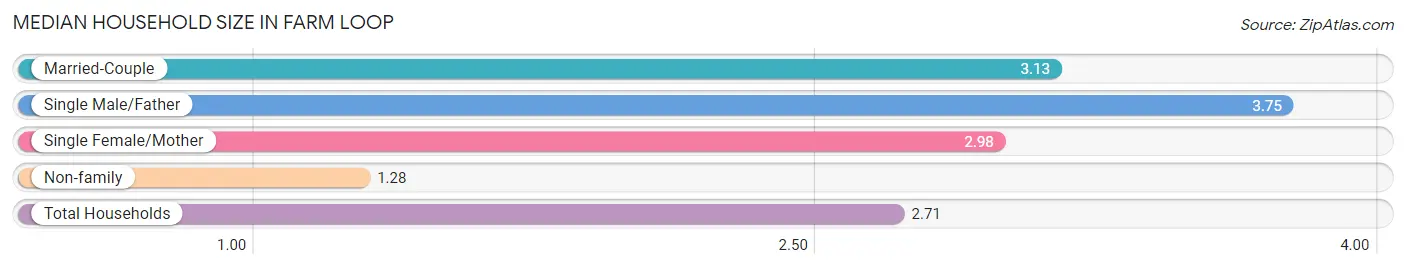
| Household Type | # Households | Household Size |
| Married-Couple | 621 (65.8%) | 3.13 |
| Single Male/Father | 16 (1.7%) | 3.75 |
| Single Female/Mother | 94 (10.0%) | 2.98 |
| Non-family | 213 (22.6%) | 1.28 |
| Total Households | 944 (100.0%) | 2.71 |
Household Size by Marriage Status in Farm Loop
Out of a total of 944 households in Farm Loop, 731 (77.4%) are family households, while 213 (22.6%) are nonfamily households. The most numerous type of family households are 2-person households, comprising 341, and the most common type of nonfamily households are 1-person households, comprising 177.
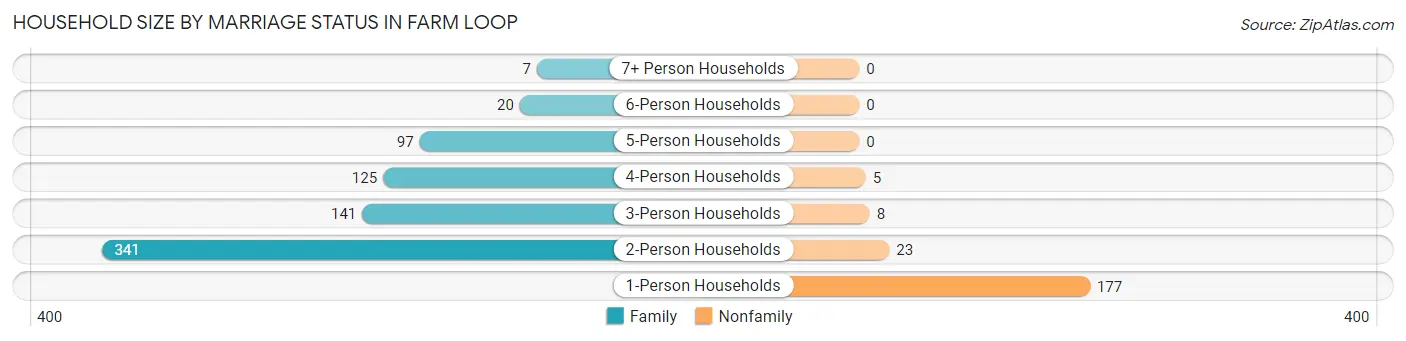
| Household Size | Family Households | Nonfamily Households |
| 1-Person Households | - | 177 (18.8%) |
| 2-Person Households | 341 (36.1%) | 23 (2.4%) |
| 3-Person Households | 141 (14.9%) | 8 (0.9%) |
| 4-Person Households | 125 (13.2%) | 5 (0.5%) |
| 5-Person Households | 97 (10.3%) | 0 (0.0%) |
| 6-Person Households | 20 (2.1%) | 0 (0.0%) |
| 7+ Person Households | 7 (0.7%) | 0 (0.0%) |
| Total | 731 (77.4%) | 213 (22.6%) |
Female Fertility in Farm Loop
Fertility by Age in Farm Loop
Average fertility rate in Farm Loop is 68.0 births per 1,000 women. Women in the age bracket of 20 to 34 years have the highest fertility rate with 121.0 births per 1,000 women. Women in the age bracket of 20 to 34 years acount for 61.9% of all women with births.
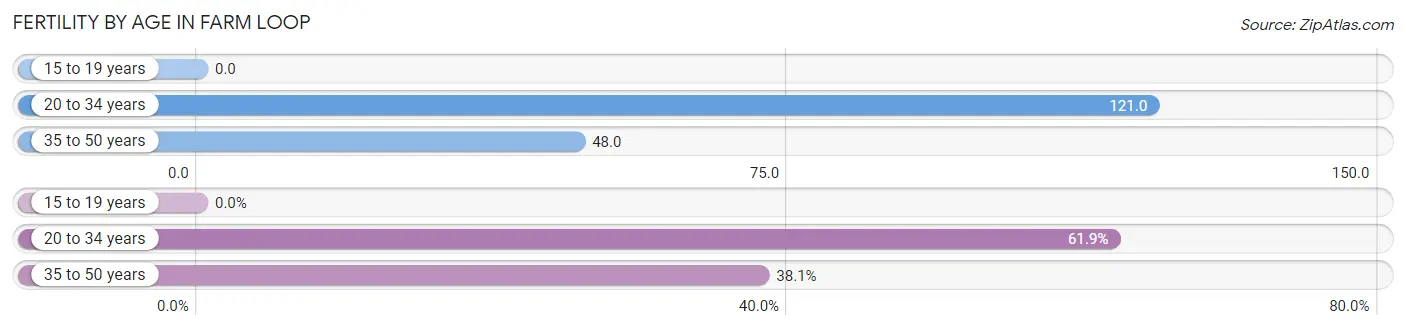
| Age Bracket | Women with Births | Births / 1,000 Women |
| 15 to 19 years | 0 (0.0%) | 0.0 |
| 20 to 34 years | 26 (61.9%) | 121.0 |
| 35 to 50 years | 16 (38.1%) | 48.0 |
| Total | 42 (100.0%) | 68.0 |
Fertility by Age by Marriage Status in Farm Loop
59.5% of women with births (42) in Farm Loop are married. The highest percentage of unmarried women with births falls into 20 to 34 years age bracket with 42.3% of them unmarried at the time of birth, while the lowest percentage of unmarried women with births belong to 35 to 50 years age bracket with 37.5% of them unmarried.
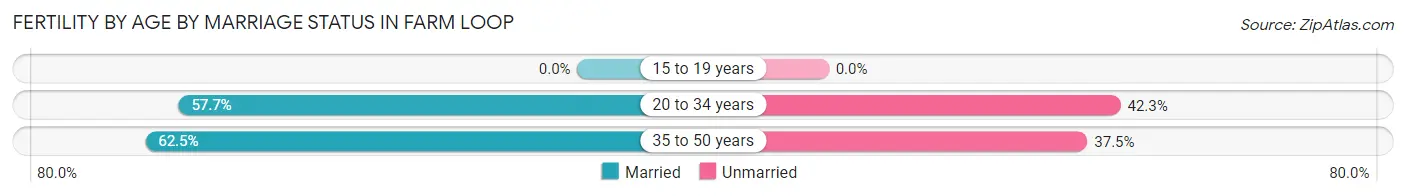
| Age Bracket | Married | Unmarried |
| 15 to 19 years | 0 (0.0%) | 0 (0.0%) |
| 20 to 34 years | 15 (57.7%) | 11 (42.3%) |
| 35 to 50 years | 10 (62.5%) | 6 (37.5%) |
| Total | 25 (59.5%) | 17 (40.5%) |
Fertility by Education in Farm Loop
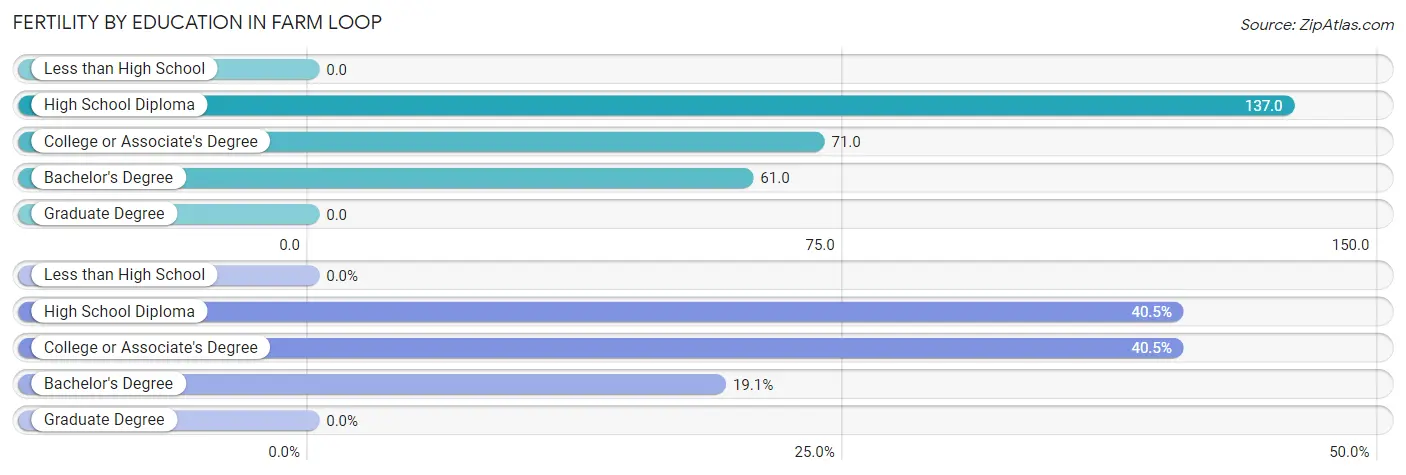
| Educational Attainment | Women with Births | Births / 1,000 Women |
| Less than High School | 0 (0.0%) | 0.0 |
| High School Diploma | 17 (40.5%) | 137.0 |
| College or Associate's Degree | 17 (40.5%) | 71.0 |
| Bachelor's Degree | 8 (19.1%) | 61.0 |
| Graduate Degree | 0 (0.0%) | 0.0 |
| Total | 42 (100.0%) | 68.0 |
Fertility by Education by Marriage Status in Farm Loop
40.5% of women with births in Farm Loop are unmarried. Women with the educational attainment of college or associate's degree are most likely to be married with 100.0% of them married at childbirth, while women with the educational attainment of high school diploma are least likely to be married with 100.0% of them unmarried at childbirth.
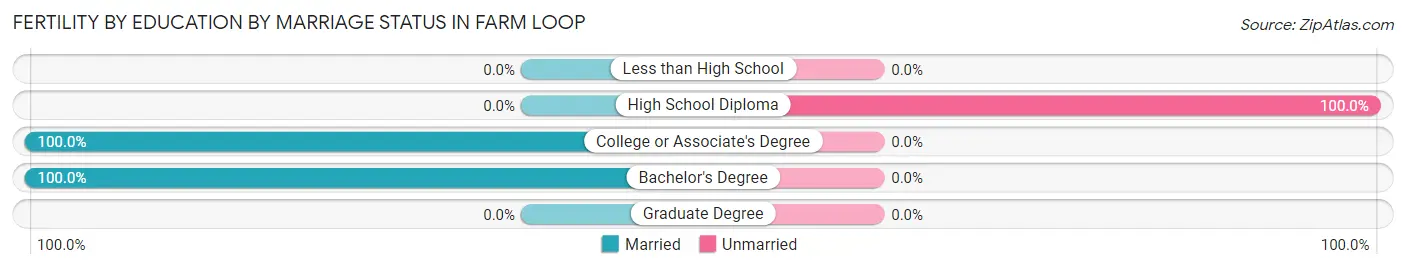
| Educational Attainment | Married | Unmarried |
| Less than High School | 0 (0.0%) | 0 (0.0%) |
| High School Diploma | 0 (0.0%) | 17 (100.0%) |
| College or Associate's Degree | 17 (100.0%) | 0 (0.0%) |
| Bachelor's Degree | 8 (100.0%) | 0 (0.0%) |
| Graduate Degree | 0 (0.0%) | 0 (0.0%) |
| Total | 25 (59.5%) | 17 (40.5%) |
Employment Characteristics in Farm Loop
Employment by Class of Employer in Farm Loop
Among the 1,228 employed individuals in Farm Loop, private company employees (676 | 55.0%), local government employees (141 | 11.5%), and federal government employees (127 | 10.3%) make up the most common classes of employment.
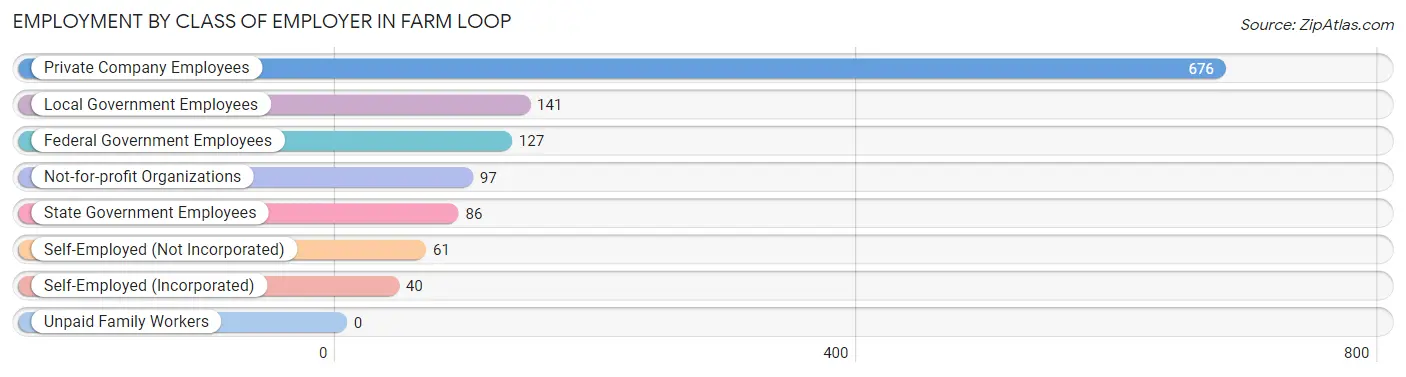
| Employer Class | # Employees | % Employees |
| Private Company Employees | 676 | 55.0% |
| Self-Employed (Incorporated) | 40 | 3.3% |
| Self-Employed (Not Incorporated) | 61 | 5.0% |
| Not-for-profit Organizations | 97 | 7.9% |
| Local Government Employees | 141 | 11.5% |
| State Government Employees | 86 | 7.0% |
| Federal Government Employees | 127 | 10.3% |
| Unpaid Family Workers | 0 | 0.0% |
| Total | 1,228 | 100.0% |
Employment Status by Age in Farm Loop
According to the labor force statistics for Farm Loop, out of the total population over 16 years of age (2,034), 67.4% or 1,371 individuals are in the labor force, with 7.8% or 107 of them unemployed. The age group with the highest labor force participation rate is 30 to 34 years, with 91.5% or 119 individuals in the labor force. Within the labor force, the 16 to 19 years age range has the highest percentage of unemployed individuals, with 28.8% or 23 of them being unemployed.
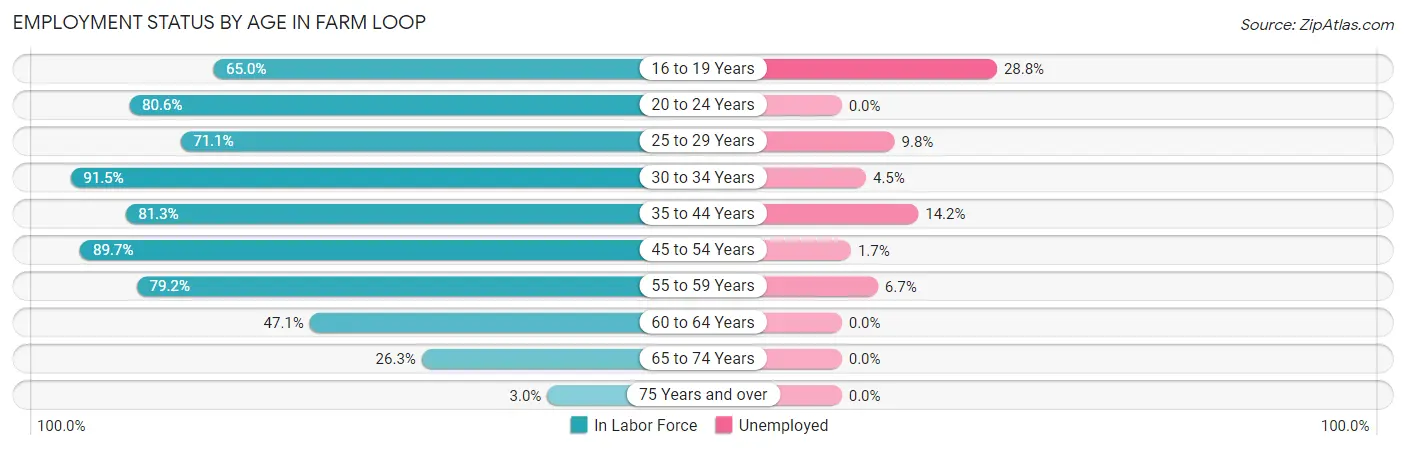
| Age Bracket | In Labor Force | Unemployed |
| 16 to 19 Years | 80 (65.0%) | 23 (28.8%) |
| 20 to 24 Years | 79 (80.6%) | 0 (0.0%) |
| 25 to 29 Years | 123 (71.1%) | 12 (9.8%) |
| 30 to 34 Years | 119 (91.5%) | 5 (4.5%) |
| 35 to 44 Years | 347 (81.3%) | 49 (14.2%) |
| 45 to 54 Years | 296 (89.7%) | 5 (1.7%) |
| 55 to 59 Years | 183 (79.2%) | 12 (6.7%) |
| 60 to 64 Years | 65 (47.1%) | 0 (0.0%) |
| 65 to 74 Years | 75 (26.3%) | 0 (0.0%) |
| 75 Years and over | 3 (3.0%) | 0 (0.0%) |
| Total | 1,371 (67.4%) | 107 (7.8%) |
Employment Status by Educational Attainment in Farm Loop
According to labor force statistics for Farm Loop, 79.3% of individuals (1,133) out of the total population between 25 and 64 years of age (1,429) are in the labor force, with 7.4% or 84 of them being unemployed. The group with the highest labor force participation rate are those with the educational attainment of less than high school, with 92.5% or 49 individuals in the labor force. Within the labor force, individuals with high school diploma education have the highest percentage of unemployment, with 12.8% or 31 of them being unemployed.
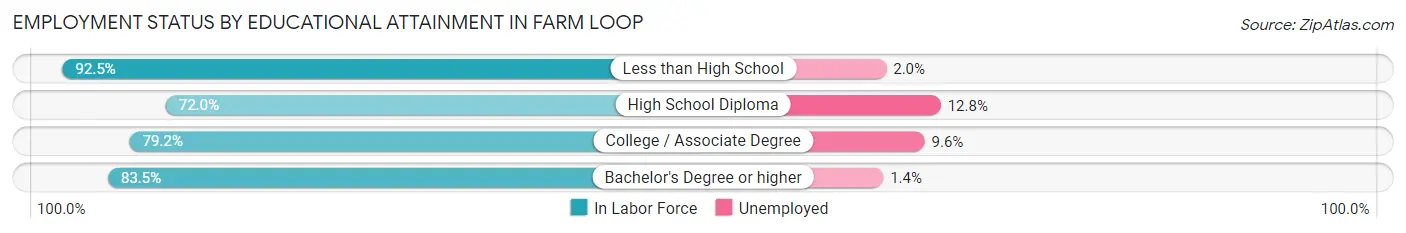
| Educational Attainment | In Labor Force | Unemployed |
| Less than High School | 49 (92.5%) | 1 (2.0%) |
| High School Diploma | 242 (72.0%) | 43 (12.8%) |
| College / Associate Degree | 483 (79.2%) | 59 (9.6%) |
| Bachelor's Degree or higher | 359 (83.5%) | 6 (1.4%) |
| Total | 1,133 (79.3%) | 106 (7.4%) |
Employment Occupations by Sex in Farm Loop
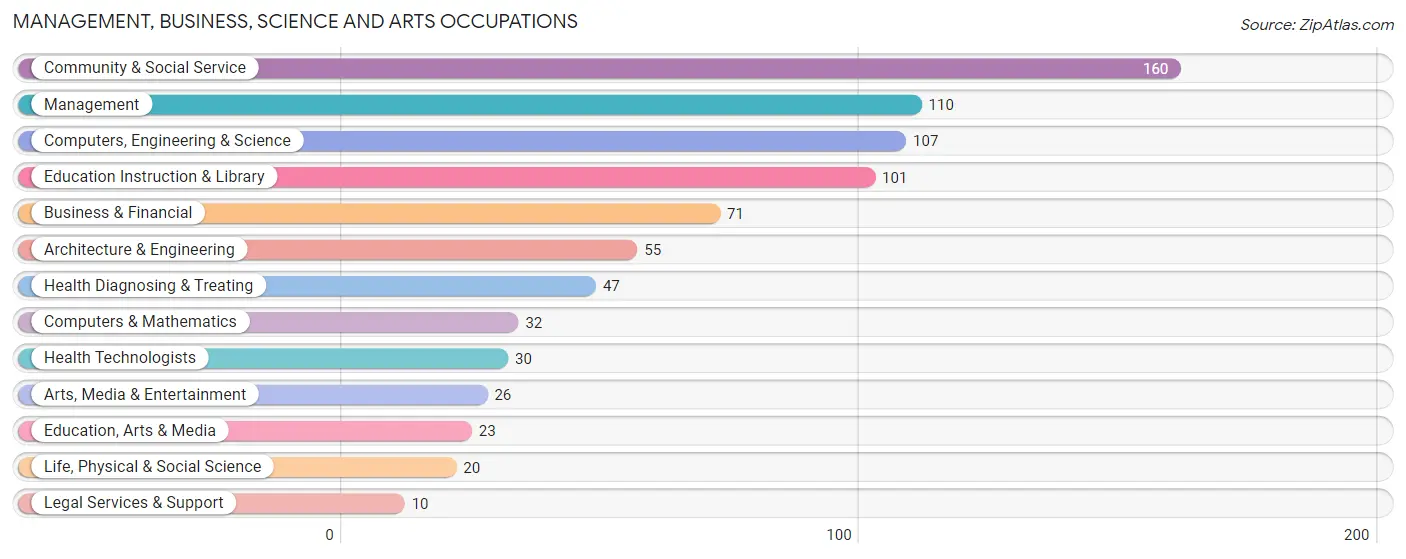
Management, Business, Science and Arts Occupations
The most common Management, Business, Science and Arts occupations in Farm Loop are Community & Social Service (160 | 12.9%), Management (110 | 8.9%), Computers, Engineering & Science (107 | 8.6%), Education Instruction & Library (101 | 8.2%), and Business & Financial (71 | 5.7%).
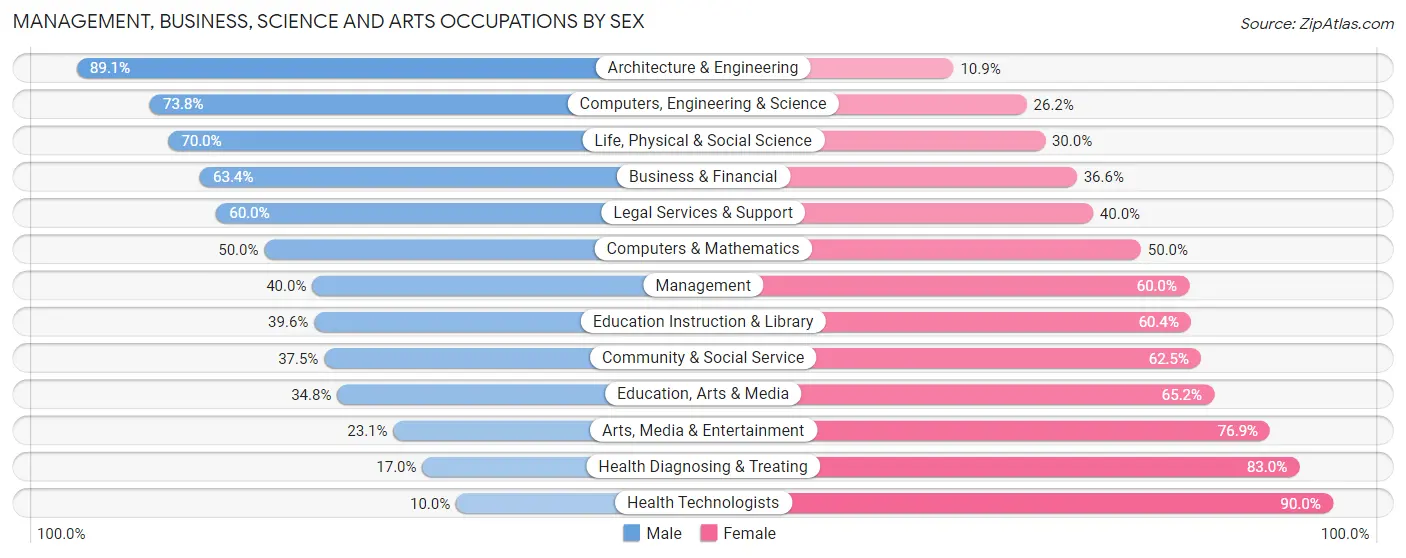
Management, Business, Science and Arts Occupations by Sex
Within the Management, Business, Science and Arts occupations in Farm Loop, the most male-oriented occupations are Architecture & Engineering (89.1%), Computers, Engineering & Science (73.8%), and Life, Physical & Social Science (70.0%), while the most female-oriented occupations are Health Technologists (90.0%), Health Diagnosing & Treating (83.0%), and Arts, Media & Entertainment (76.9%).
| Occupation | Male | Female |
| Management | 44 (40.0%) | 66 (60.0%) |
| Business & Financial | 45 (63.4%) | 26 (36.6%) |
| Computers, Engineering & Science | 79 (73.8%) | 28 (26.2%) |
| Computers & Mathematics | 16 (50.0%) | 16 (50.0%) |
| Architecture & Engineering | 49 (89.1%) | 6 (10.9%) |
| Life, Physical & Social Science | 14 (70.0%) | 6 (30.0%) |
| Community & Social Service | 60 (37.5%) | 100 (62.5%) |
| Education, Arts & Media | 8 (34.8%) | 15 (65.2%) |
| Legal Services & Support | 6 (60.0%) | 4 (40.0%) |
| Education Instruction & Library | 40 (39.6%) | 61 (60.4%) |
| Arts, Media & Entertainment | 6 (23.1%) | 20 (76.9%) |
| Health Diagnosing & Treating | 8 (17.0%) | 39 (83.0%) |
| Health Technologists | 3 (10.0%) | 27 (90.0%) |
| Total (Category) | 236 (47.7%) | 259 (52.3%) |
| Total (Overall) | 590 (47.7%) | 647 (52.3%) |
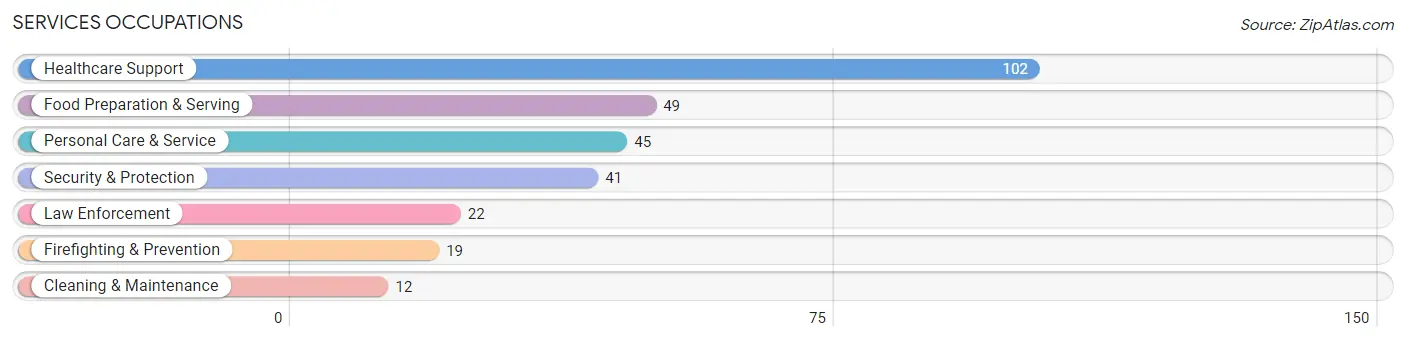
Services Occupations
The most common Services occupations in Farm Loop are Healthcare Support (102 | 8.3%), Food Preparation & Serving (49 | 4.0%), Personal Care & Service (45 | 3.6%), Security & Protection (41 | 3.3%), and Law Enforcement (22 | 1.8%).
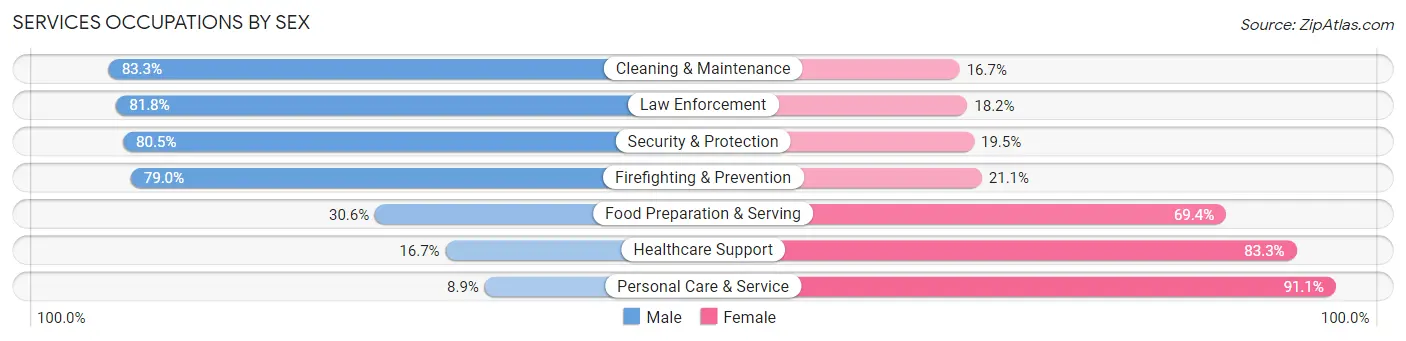
Services Occupations by Sex
Within the Services occupations in Farm Loop, the most male-oriented occupations are Cleaning & Maintenance (83.3%), Law Enforcement (81.8%), and Security & Protection (80.5%), while the most female-oriented occupations are Personal Care & Service (91.1%), Healthcare Support (83.3%), and Food Preparation & Serving (69.4%).
| Occupation | Male | Female |
| Healthcare Support | 17 (16.7%) | 85 (83.3%) |
| Security & Protection | 33 (80.5%) | 8 (19.5%) |
| Firefighting & Prevention | 15 (78.9%) | 4 (21.0%) |
| Law Enforcement | 18 (81.8%) | 4 (18.2%) |
| Food Preparation & Serving | 15 (30.6%) | 34 (69.4%) |
| Cleaning & Maintenance | 10 (83.3%) | 2 (16.7%) |
| Personal Care & Service | 4 (8.9%) | 41 (91.1%) |
| Total (Category) | 79 (31.7%) | 170 (68.3%) |
| Total (Overall) | 590 (47.7%) | 647 (52.3%) |
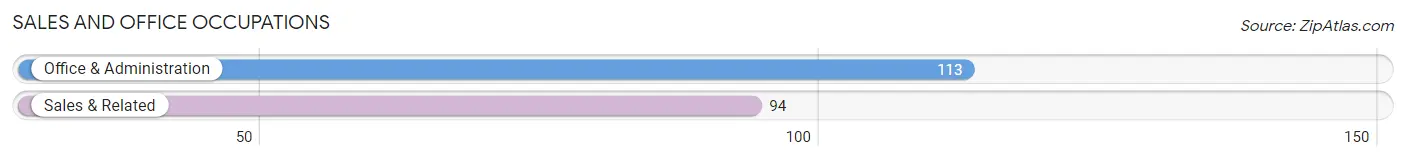
Sales and Office Occupations
The most common Sales and Office occupations in Farm Loop are Office & Administration (113 | 9.1%), and Sales & Related (94 | 7.6%).
Sales and Office Occupations by Sex
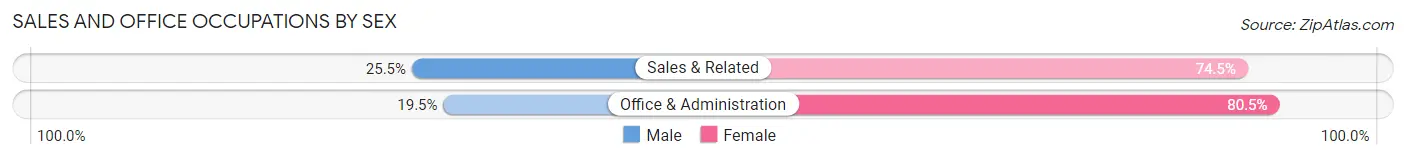
| Occupation | Male | Female |
| Sales & Related | 24 (25.5%) | 70 (74.5%) |
| Office & Administration | 22 (19.5%) | 91 (80.5%) |
| Total (Category) | 46 (22.2%) | 161 (77.8%) |
| Total (Overall) | 590 (47.7%) | 647 (52.3%) |
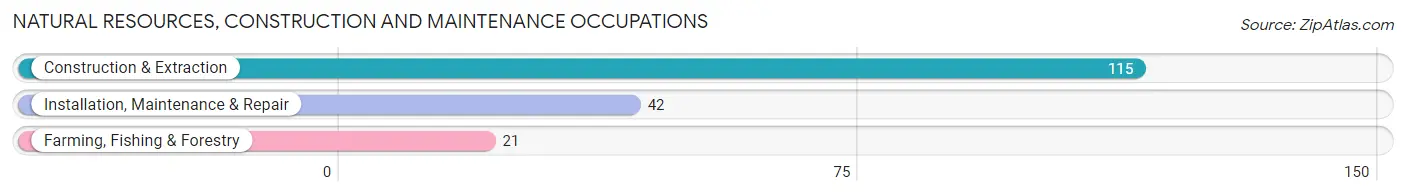
Natural Resources, Construction and Maintenance Occupations
The most common Natural Resources, Construction and Maintenance occupations in Farm Loop are Construction & Extraction (115 | 9.3%), Installation, Maintenance & Repair (42 | 3.4%), and Farming, Fishing & Forestry (21 | 1.7%).
Natural Resources, Construction and Maintenance Occupations by Sex
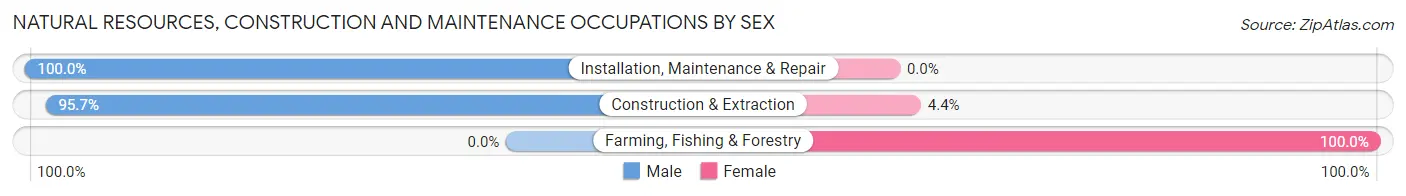
| Occupation | Male | Female |
| Farming, Fishing & Forestry | 0 (0.0%) | 21 (100.0%) |
| Construction & Extraction | 110 (95.7%) | 5 (4.3%) |
| Installation, Maintenance & Repair | 42 (100.0%) | 0 (0.0%) |
| Total (Category) | 152 (85.4%) | 26 (14.6%) |
| Total (Overall) | 590 (47.7%) | 647 (52.3%) |
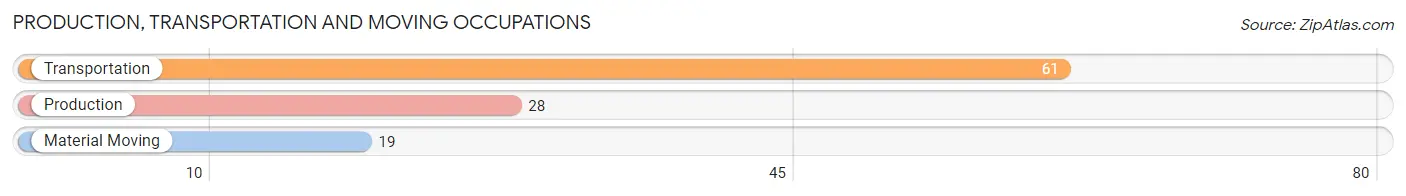
Production, Transportation and Moving Occupations
The most common Production, Transportation and Moving occupations in Farm Loop are Transportation (61 | 4.9%), Production (28 | 2.3%), and Material Moving (19 | 1.5%).
Production, Transportation and Moving Occupations by Sex
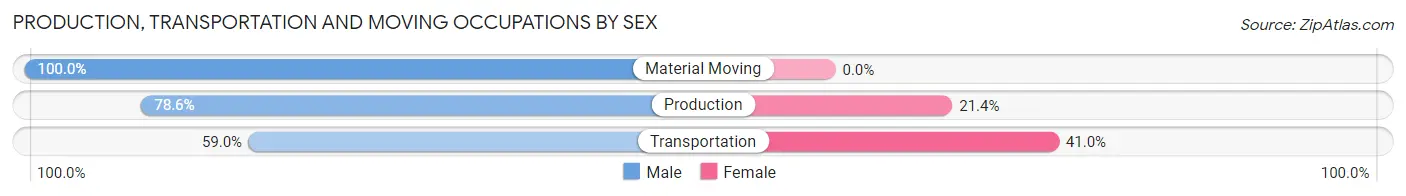
| Occupation | Male | Female |
| Production | 22 (78.6%) | 6 (21.4%) |
| Transportation | 36 (59.0%) | 25 (41.0%) |
| Material Moving | 19 (100.0%) | 0 (0.0%) |
| Total (Category) | 77 (71.3%) | 31 (28.7%) |
| Total (Overall) | 590 (47.7%) | 647 (52.3%) |
Employment Industries by Sex in Farm Loop
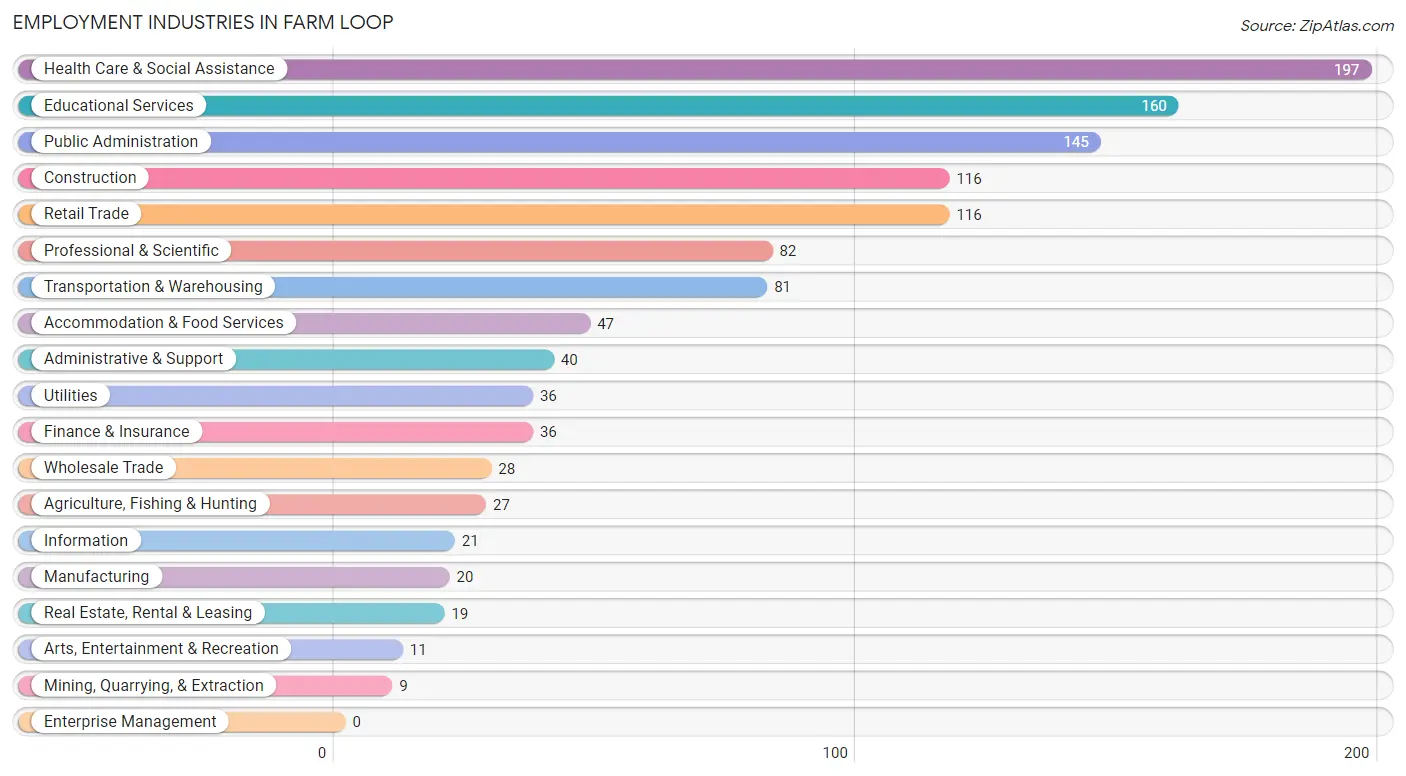
Employment Industries in Farm Loop
The major employment industries in Farm Loop include Health Care & Social Assistance (197 | 15.9%), Educational Services (160 | 12.9%), Public Administration (145 | 11.7%), Construction (116 | 9.4%), and Retail Trade (116 | 9.4%).
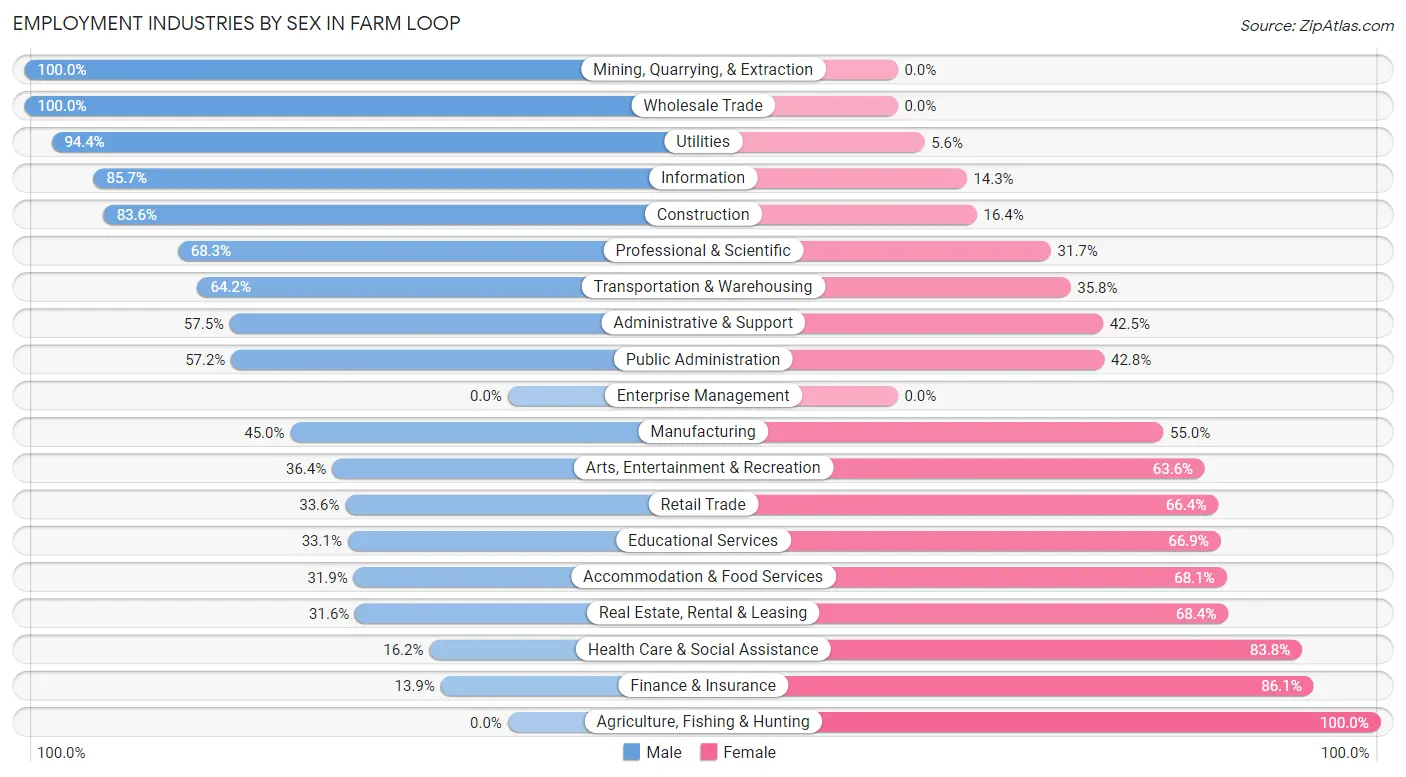
Employment Industries by Sex in Farm Loop
The Farm Loop industries that see more men than women are Mining, Quarrying, & Extraction (100.0%), Wholesale Trade (100.0%), and Utilities (94.4%), whereas the industries that tend to have a higher number of women are Agriculture, Fishing & Hunting (100.0%), Finance & Insurance (86.1%), and Health Care & Social Assistance (83.8%).
| Industry | Male | Female |
| Agriculture, Fishing & Hunting | 0 (0.0%) | 27 (100.0%) |
| Mining, Quarrying, & Extraction | 9 (100.0%) | 0 (0.0%) |
| Construction | 97 (83.6%) | 19 (16.4%) |
| Manufacturing | 9 (45.0%) | 11 (55.0%) |
| Wholesale Trade | 28 (100.0%) | 0 (0.0%) |
| Retail Trade | 39 (33.6%) | 77 (66.4%) |
| Transportation & Warehousing | 52 (64.2%) | 29 (35.8%) |
| Utilities | 34 (94.4%) | 2 (5.6%) |
| Information | 18 (85.7%) | 3 (14.3%) |
| Finance & Insurance | 5 (13.9%) | 31 (86.1%) |
| Real Estate, Rental & Leasing | 6 (31.6%) | 13 (68.4%) |
| Professional & Scientific | 56 (68.3%) | 26 (31.7%) |
| Enterprise Management | 0 (0.0%) | 0 (0.0%) |
| Administrative & Support | 23 (57.5%) | 17 (42.5%) |
| Educational Services | 53 (33.1%) | 107 (66.9%) |
| Health Care & Social Assistance | 32 (16.2%) | 165 (83.8%) |
| Arts, Entertainment & Recreation | 4 (36.4%) | 7 (63.6%) |
| Accommodation & Food Services | 15 (31.9%) | 32 (68.1%) |
| Public Administration | 83 (57.2%) | 62 (42.8%) |
| Total | 590 (47.7%) | 647 (52.3%) |
Education in Farm Loop
School Enrollment in Farm Loop
The most common levels of schooling among the 546 students in Farm Loop are middle school (150 | 27.5%), high school (136 | 24.9%), and elementary school (126 | 23.1%).
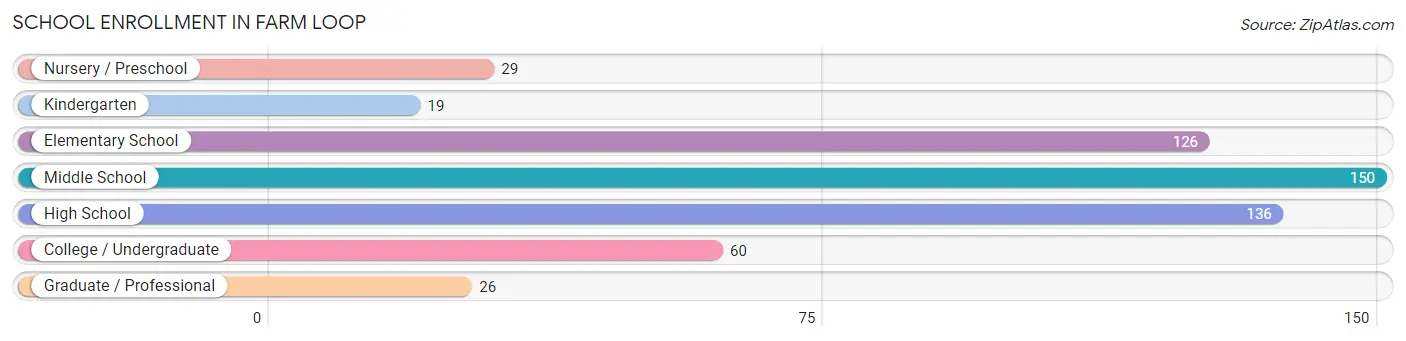
| School Level | # Students | % Students |
| Nursery / Preschool | 29 | 5.3% |
| Kindergarten | 19 | 3.5% |
| Elementary School | 126 | 23.1% |
| Middle School | 150 | 27.5% |
| High School | 136 | 24.9% |
| College / Undergraduate | 60 | 11.0% |
| Graduate / Professional | 26 | 4.8% |
| Total | 546 | 100.0% |
School Enrollment by Age by Funding Source in Farm Loop
Out of a total of 546 students who are enrolled in schools in Farm Loop, 90 (16.5%) attend a private institution, while the remaining 456 (83.5%) are enrolled in public schools. The age group of 25 to 34 year olds has the highest likelihood of being enrolled in private schools, with 7 (100.0% in the age bracket) enrolled. Conversely, the age group of 18 to 19 year olds has the lowest likelihood of being enrolled in a private school, with 50 (100.0% in the age bracket) attending a public institution.
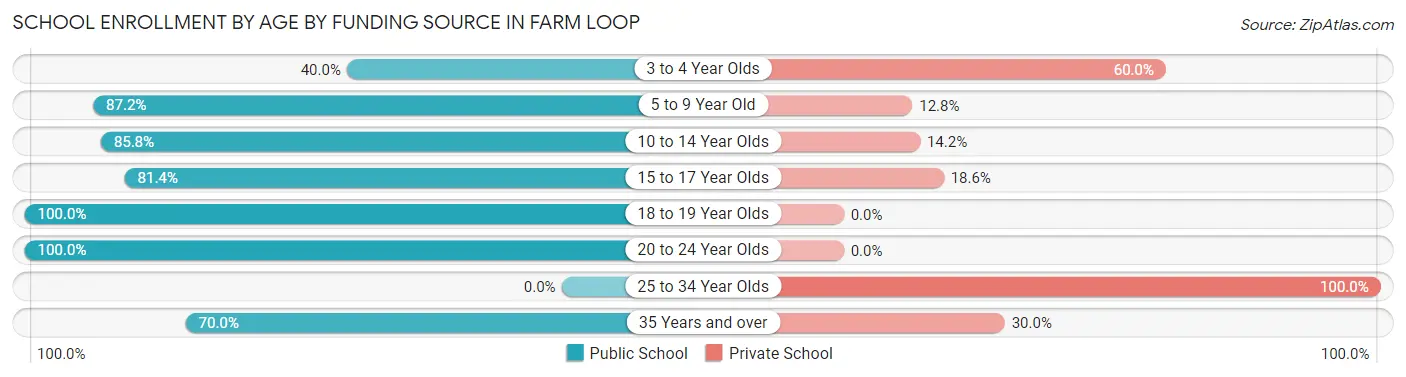
| Age Bracket | Public School | Private School |
| 3 to 4 Year Olds | 8 (40.0%) | 12 (60.0%) |
| 5 to 9 Year Old | 116 (87.2%) | 17 (12.8%) |
| 10 to 14 Year Olds | 157 (85.8%) | 26 (14.2%) |
| 15 to 17 Year Olds | 83 (81.4%) | 19 (18.6%) |
| 18 to 19 Year Olds | 50 (100.0%) | 0 (0.0%) |
| 20 to 24 Year Olds | 21 (100.0%) | 0 (0.0%) |
| 25 to 34 Year Olds | 0 (0.0%) | 7 (100.0%) |
| 35 Years and over | 21 (70.0%) | 9 (30.0%) |
| Total | 456 (83.5%) | 90 (16.5%) |
Educational Attainment by Field of Study in Farm Loop
Education (101 | 17.7%), business (66 | 11.6%), science & technology (65 | 11.4%), arts & humanities (54 | 9.5%), and social sciences (46 | 8.1%) are the most common fields of study among 569 individuals in Farm Loop who have obtained a bachelor's degree or higher.
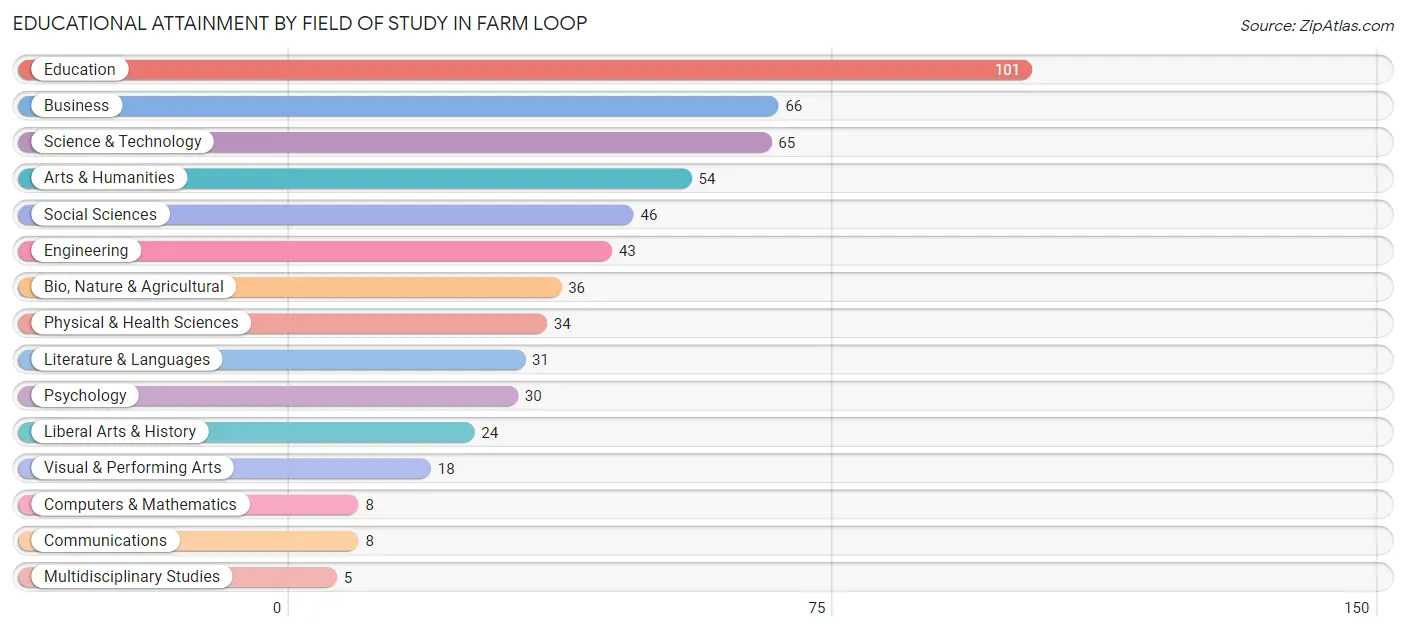
| Field of Study | # Graduates | % Graduates |
| Computers & Mathematics | 8 | 1.4% |
| Bio, Nature & Agricultural | 36 | 6.3% |
| Physical & Health Sciences | 34 | 6.0% |
| Psychology | 30 | 5.3% |
| Social Sciences | 46 | 8.1% |
| Engineering | 43 | 7.6% |
| Multidisciplinary Studies | 5 | 0.9% |
| Science & Technology | 65 | 11.4% |
| Business | 66 | 11.6% |
| Education | 101 | 17.7% |
| Literature & Languages | 31 | 5.4% |
| Liberal Arts & History | 24 | 4.2% |
| Visual & Performing Arts | 18 | 3.2% |
| Communications | 8 | 1.4% |
| Arts & Humanities | 54 | 9.5% |
| Total | 569 | 100.0% |
Transportation & Commute in Farm Loop
Vehicle Availability by Sex in Farm Loop
The most prevalent vehicle ownership categories in Farm Loop are males with 2 vehicles (216, accounting for 36.0%) and females with 2 vehicles (197, making up 34.6%).
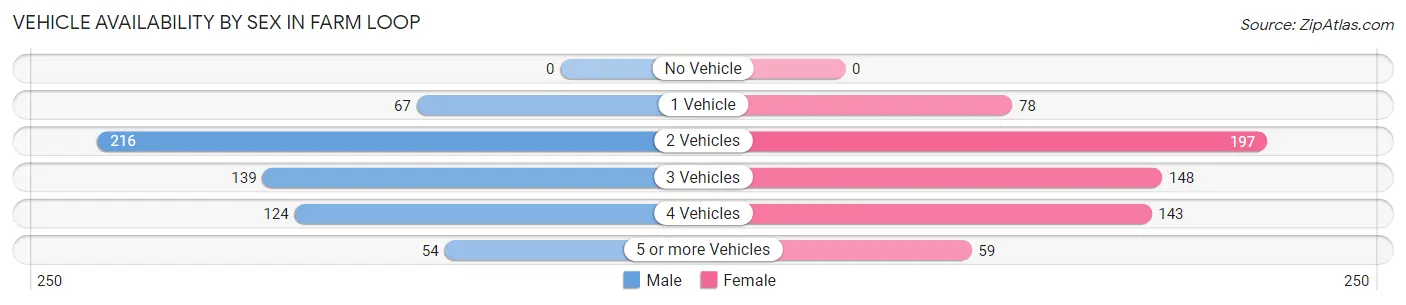
| Vehicles Available | Male | Female |
| No Vehicle | 0 (0.0%) | 0 (0.0%) |
| 1 Vehicle | 67 (11.2%) | 78 (12.5%) |
| 2 Vehicles | 216 (36.0%) | 197 (31.5%) |
| 3 Vehicles | 139 (23.2%) | 148 (23.7%) |
| 4 Vehicles | 124 (20.7%) | 143 (22.9%) |
| 5 or more Vehicles | 54 (9.0%) | 59 (9.4%) |
| Total | 600 (100.0%) | 625 (100.0%) |
Commute Time in Farm Loop
The most frequently occuring commute durations in Farm Loop are 60 to 89 minutes (197 commuters, 18.4%), 20 to 24 minutes (166 commuters, 15.5%), and 10 to 14 minutes (161 commuters, 15.0%).
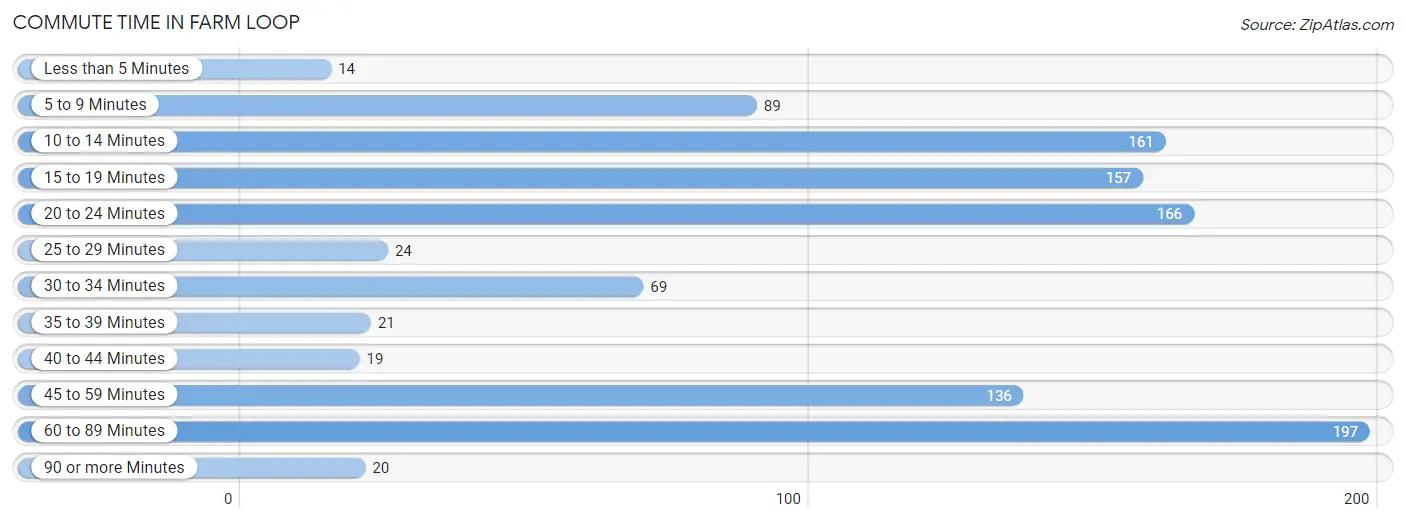
| Commute Time | # Commuters | % Commuters |
| Less than 5 Minutes | 14 | 1.3% |
| 5 to 9 Minutes | 89 | 8.3% |
| 10 to 14 Minutes | 161 | 15.0% |
| 15 to 19 Minutes | 157 | 14.6% |
| 20 to 24 Minutes | 166 | 15.5% |
| 25 to 29 Minutes | 24 | 2.2% |
| 30 to 34 Minutes | 69 | 6.4% |
| 35 to 39 Minutes | 21 | 2.0% |
| 40 to 44 Minutes | 19 | 1.8% |
| 45 to 59 Minutes | 136 | 12.7% |
| 60 to 89 Minutes | 197 | 18.4% |
| 90 or more Minutes | 20 | 1.9% |
Commute Time by Sex in Farm Loop
The most common commute times in Farm Loop are 60 to 89 minutes (146 commuters, 26.8%) for males and 20 to 24 minutes (119 commuters, 22.5%) for females.
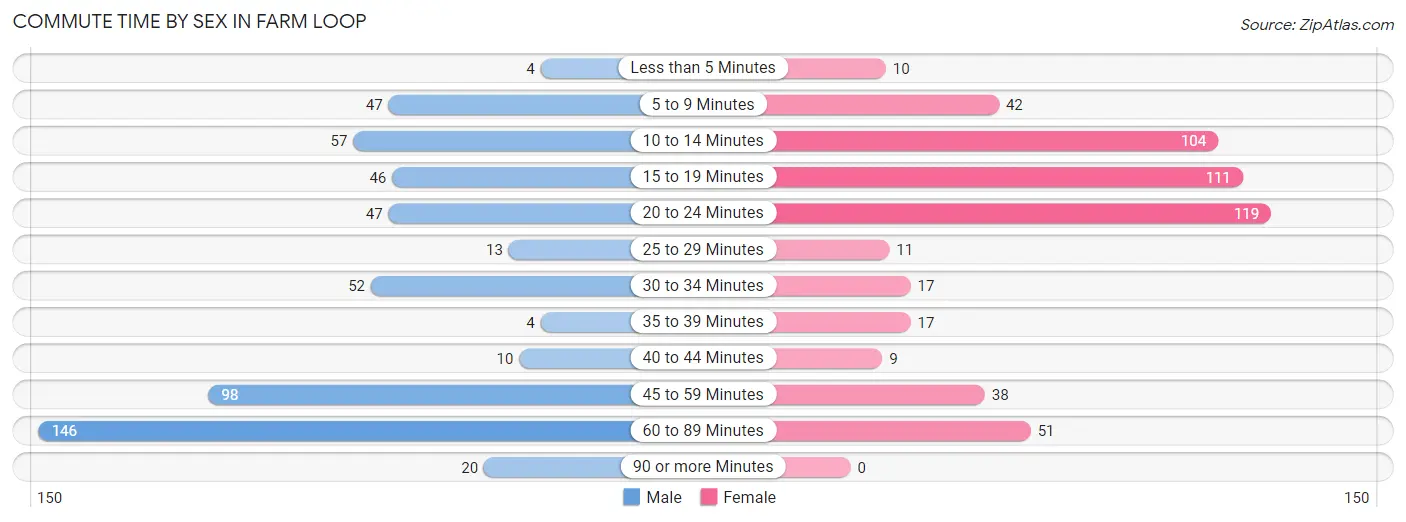
| Commute Time | Male | Female |
| Less than 5 Minutes | 4 (0.7%) | 10 (1.9%) |
| 5 to 9 Minutes | 47 (8.6%) | 42 (7.9%) |
| 10 to 14 Minutes | 57 (10.5%) | 104 (19.7%) |
| 15 to 19 Minutes | 46 (8.5%) | 111 (21.0%) |
| 20 to 24 Minutes | 47 (8.6%) | 119 (22.5%) |
| 25 to 29 Minutes | 13 (2.4%) | 11 (2.1%) |
| 30 to 34 Minutes | 52 (9.6%) | 17 (3.2%) |
| 35 to 39 Minutes | 4 (0.7%) | 17 (3.2%) |
| 40 to 44 Minutes | 10 (1.8%) | 9 (1.7%) |
| 45 to 59 Minutes | 98 (18.0%) | 38 (7.2%) |
| 60 to 89 Minutes | 146 (26.8%) | 51 (9.6%) |
| 90 or more Minutes | 20 (3.7%) | 0 (0.0%) |
Time of Departure to Work by Sex in Farm Loop
The most frequent times of departure to work in Farm Loop are 12:00 AM to 4:59 AM (85, 15.6%) for males and 7:30 AM to 7:59 AM (112, 21.2%) for females.
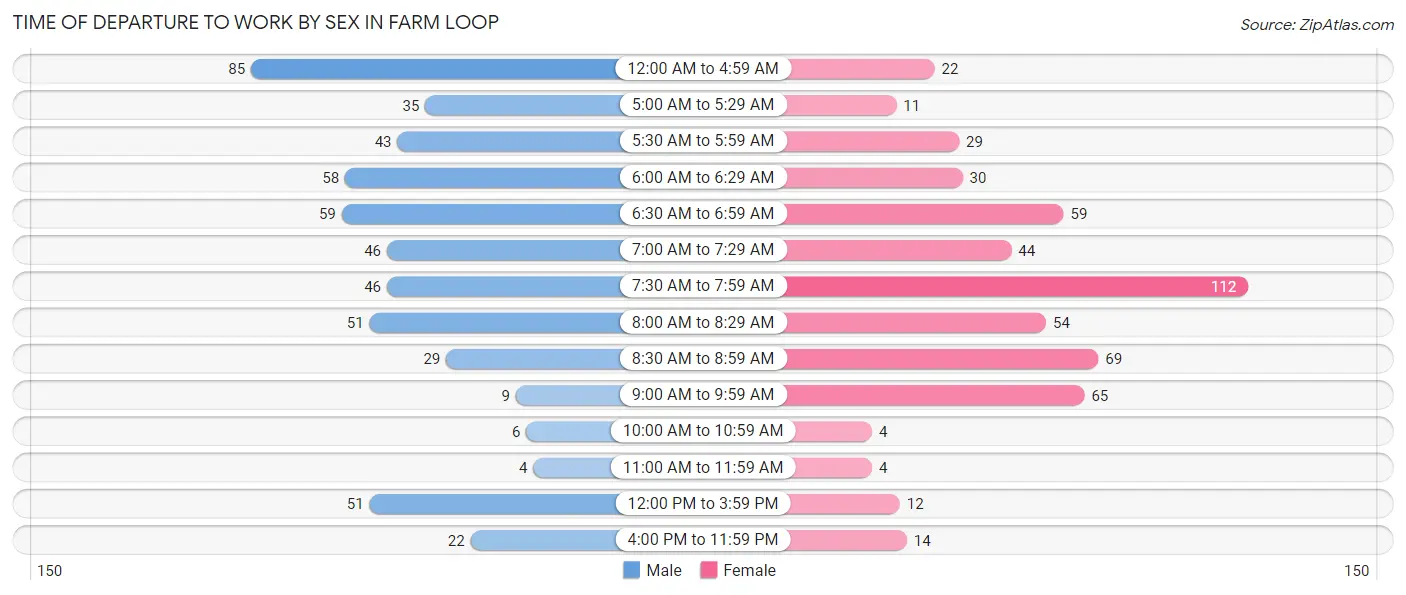
| Time of Departure | Male | Female |
| 12:00 AM to 4:59 AM | 85 (15.6%) | 22 (4.2%) |
| 5:00 AM to 5:29 AM | 35 (6.4%) | 11 (2.1%) |
| 5:30 AM to 5:59 AM | 43 (7.9%) | 29 (5.5%) |
| 6:00 AM to 6:29 AM | 58 (10.7%) | 30 (5.7%) |
| 6:30 AM to 6:59 AM | 59 (10.8%) | 59 (11.2%) |
| 7:00 AM to 7:29 AM | 46 (8.5%) | 44 (8.3%) |
| 7:30 AM to 7:59 AM | 46 (8.5%) | 112 (21.2%) |
| 8:00 AM to 8:29 AM | 51 (9.4%) | 54 (10.2%) |
| 8:30 AM to 8:59 AM | 29 (5.3%) | 69 (13.0%) |
| 9:00 AM to 9:59 AM | 9 (1.7%) | 65 (12.3%) |
| 10:00 AM to 10:59 AM | 6 (1.1%) | 4 (0.8%) |
| 11:00 AM to 11:59 AM | 4 (0.7%) | 4 (0.8%) |
| 12:00 PM to 3:59 PM | 51 (9.4%) | 12 (2.3%) |
| 4:00 PM to 11:59 PM | 22 (4.0%) | 14 (2.6%) |
| Total | 544 (100.0%) | 529 (100.0%) |
Housing Occupancy in Farm Loop
Occupancy by Ownership in Farm Loop
Of the total 944 dwellings in Farm Loop, owner-occupied units account for 814 (86.2%), while renter-occupied units make up 130 (13.8%).
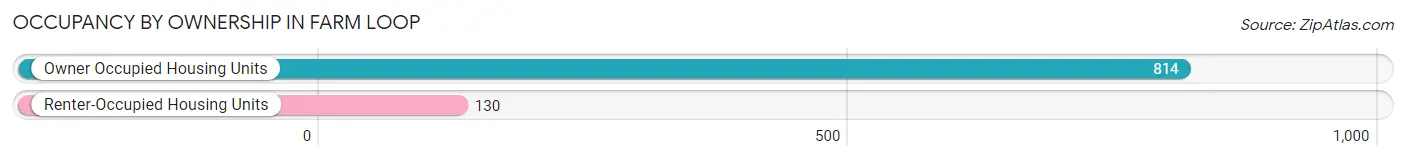
| Occupancy | # Housing Units | % Housing Units |
| Owner Occupied Housing Units | 814 | 86.2% |
| Renter-Occupied Housing Units | 130 | 13.8% |
| Total Occupied Housing Units | 944 | 100.0% |
Occupancy by Household Size in Farm Loop
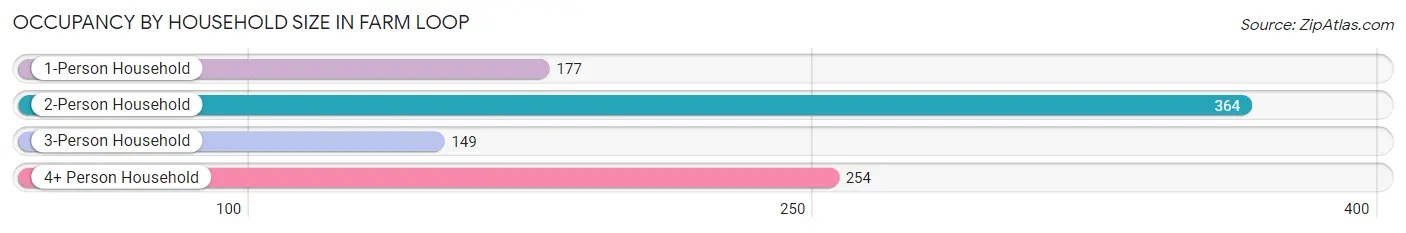
| Household Size | # Housing Units | % Housing Units |
| 1-Person Household | 177 | 18.8% |
| 2-Person Household | 364 | 38.6% |
| 3-Person Household | 149 | 15.8% |
| 4+ Person Household | 254 | 26.9% |
| Total Housing Units | 944 | 100.0% |
Occupancy by Ownership by Household Size in Farm Loop
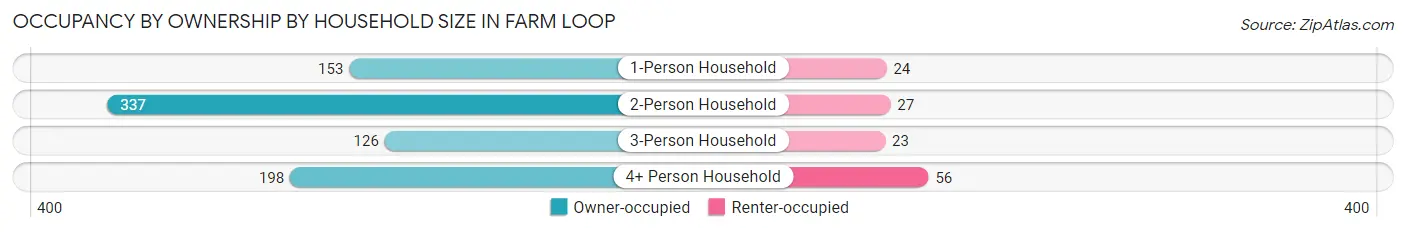
| Household Size | Owner-occupied | Renter-occupied |
| 1-Person Household | 153 (86.4%) | 24 (13.6%) |
| 2-Person Household | 337 (92.6%) | 27 (7.4%) |
| 3-Person Household | 126 (84.6%) | 23 (15.4%) |
| 4+ Person Household | 198 (77.9%) | 56 (22.1%) |
| Total Housing Units | 814 (86.2%) | 130 (13.8%) |
Occupancy by Educational Attainment in Farm Loop
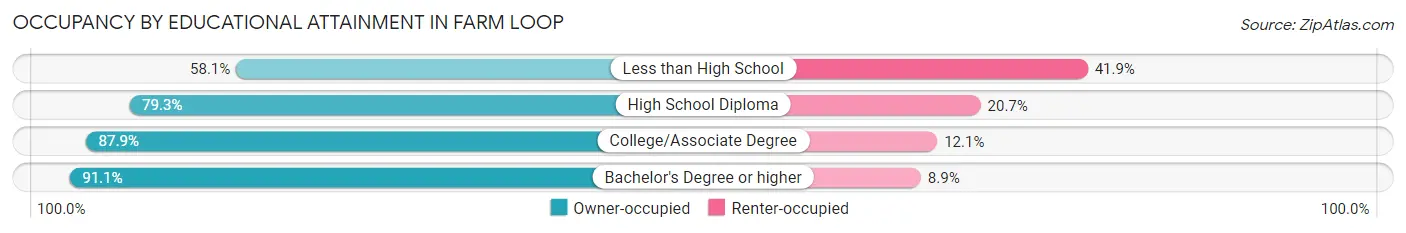
| Household Size | Owner-occupied | Renter-occupied |
| Less than High School | 18 (58.1%) | 13 (41.9%) |
| High School Diploma | 157 (79.3%) | 41 (20.7%) |
| College/Associate Degree | 341 (87.9%) | 47 (12.1%) |
| Bachelor's Degree or higher | 298 (91.1%) | 29 (8.9%) |
Occupancy by Age of Householder in Farm Loop
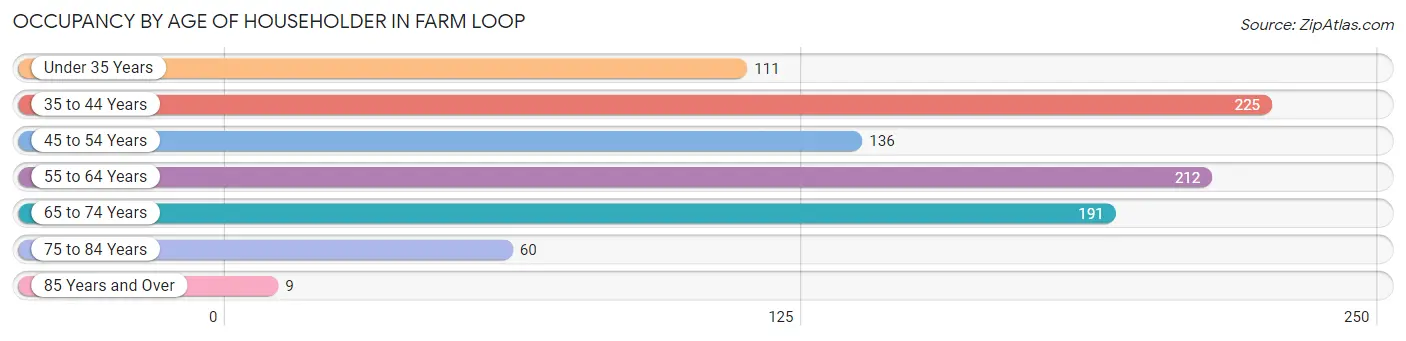
| Age Bracket | # Households | % Households |
| Under 35 Years | 111 | 11.8% |
| 35 to 44 Years | 225 | 23.8% |
| 45 to 54 Years | 136 | 14.4% |
| 55 to 64 Years | 212 | 22.5% |
| 65 to 74 Years | 191 | 20.2% |
| 75 to 84 Years | 60 | 6.4% |
| 85 Years and Over | 9 | 0.9% |
| Total | 944 | 100.0% |
Housing Finances in Farm Loop
Median Income by Occupancy in Farm Loop
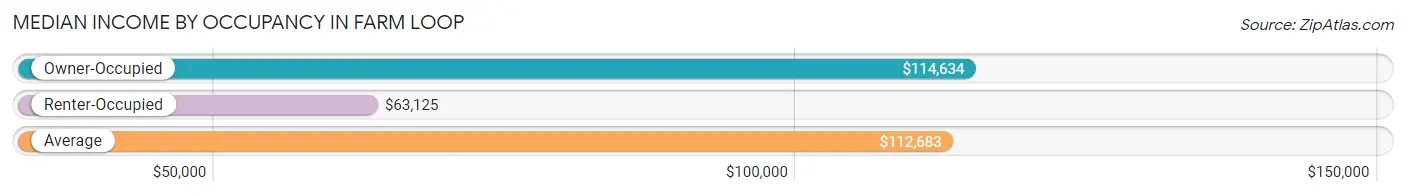
| Occupancy Type | # Households | Median Income |
| Owner-Occupied | 814 (86.2%) | $114,634 |
| Renter-Occupied | 130 (13.8%) | $63,125 |
| Average | 944 (100.0%) | $112,683 |
Occupancy by Householder Income Bracket in Farm Loop
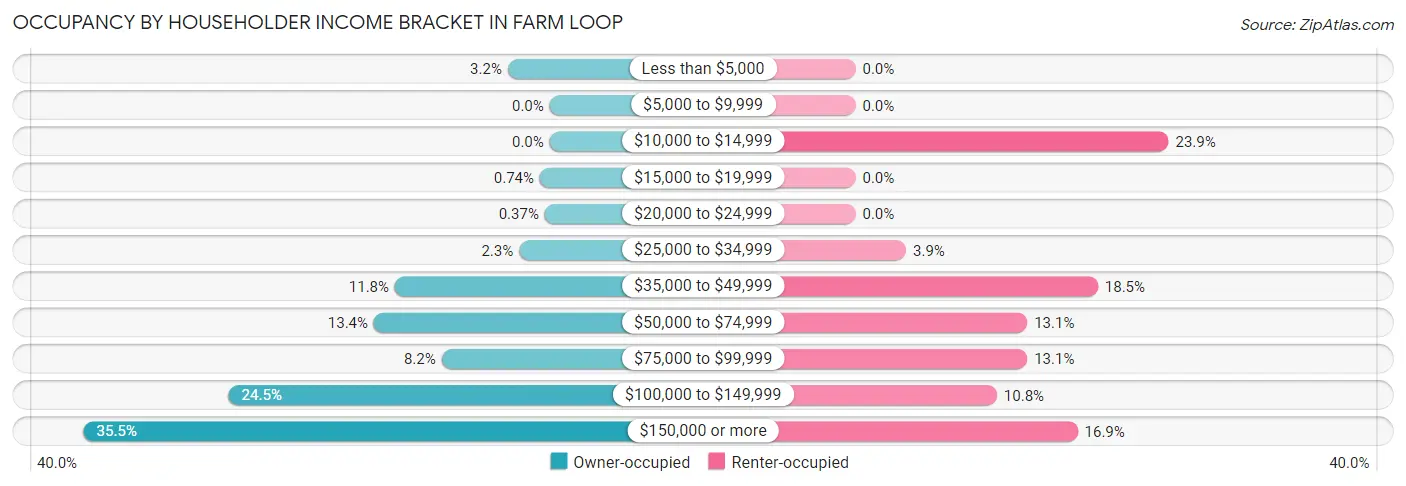
| Income Bracket | Owner-occupied | Renter-occupied |
| Less than $5,000 | 26 (3.2%) | 0 (0.0%) |
| $5,000 to $9,999 | 0 (0.0%) | 0 (0.0%) |
| $10,000 to $14,999 | 0 (0.0%) | 31 (23.8%) |
| $15,000 to $19,999 | 6 (0.7%) | 0 (0.0%) |
| $20,000 to $24,999 | 3 (0.4%) | 0 (0.0%) |
| $25,000 to $34,999 | 19 (2.3%) | 5 (3.8%) |
| $35,000 to $49,999 | 96 (11.8%) | 24 (18.5%) |
| $50,000 to $74,999 | 109 (13.4%) | 17 (13.1%) |
| $75,000 to $99,999 | 67 (8.2%) | 17 (13.1%) |
| $100,000 to $149,999 | 199 (24.4%) | 14 (10.8%) |
| $150,000 or more | 289 (35.5%) | 22 (16.9%) |
| Total | 814 (100.0%) | 130 (100.0%) |
Monthly Housing Cost Tiers in Farm Loop
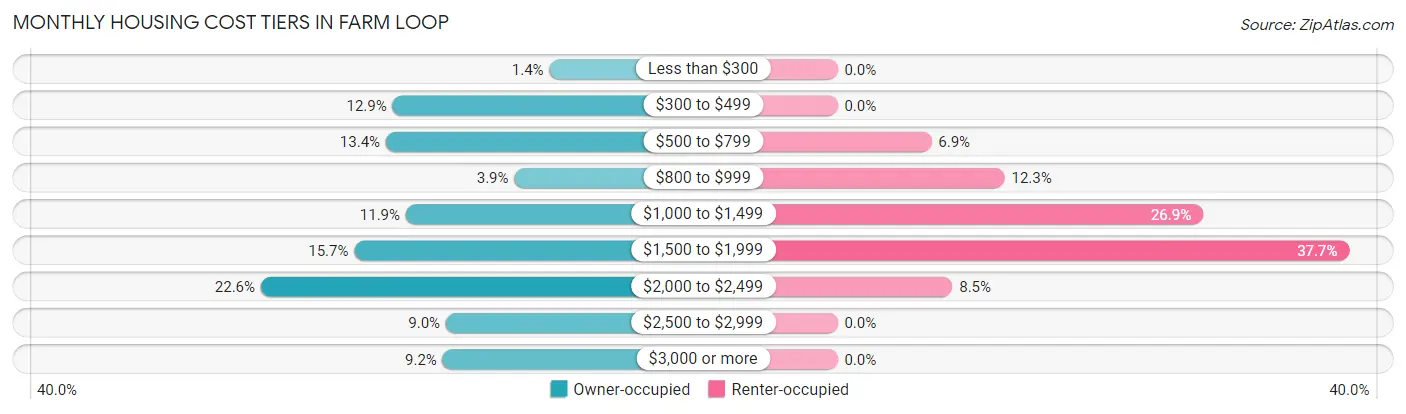
| Monthly Cost | Owner-occupied | Renter-occupied |
| Less than $300 | 11 (1.3%) | 0 (0.0%) |
| $300 to $499 | 105 (12.9%) | 0 (0.0%) |
| $500 to $799 | 109 (13.4%) | 9 (6.9%) |
| $800 to $999 | 32 (3.9%) | 16 (12.3%) |
| $1,000 to $1,499 | 97 (11.9%) | 35 (26.9%) |
| $1,500 to $1,999 | 128 (15.7%) | 49 (37.7%) |
| $2,000 to $2,499 | 184 (22.6%) | 11 (8.5%) |
| $2,500 to $2,999 | 73 (9.0%) | 0 (0.0%) |
| $3,000 or more | 75 (9.2%) | 0 (0.0%) |
| Total | 814 (100.0%) | 130 (100.0%) |
Physical Housing Characteristics in Farm Loop
Housing Structures in Farm Loop
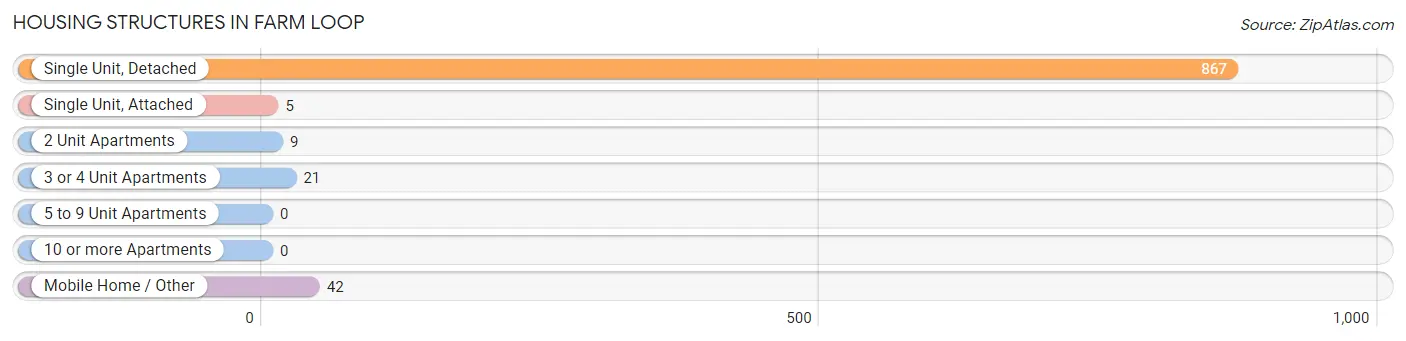
| Structure Type | # Housing Units | % Housing Units |
| Single Unit, Detached | 867 | 91.8% |
| Single Unit, Attached | 5 | 0.5% |
| 2 Unit Apartments | 9 | 0.9% |
| 3 or 4 Unit Apartments | 21 | 2.2% |
| 5 to 9 Unit Apartments | 0 | 0.0% |
| 10 or more Apartments | 0 | 0.0% |
| Mobile Home / Other | 42 | 4.4% |
| Total | 944 | 100.0% |
Housing Structures by Occupancy in Farm Loop
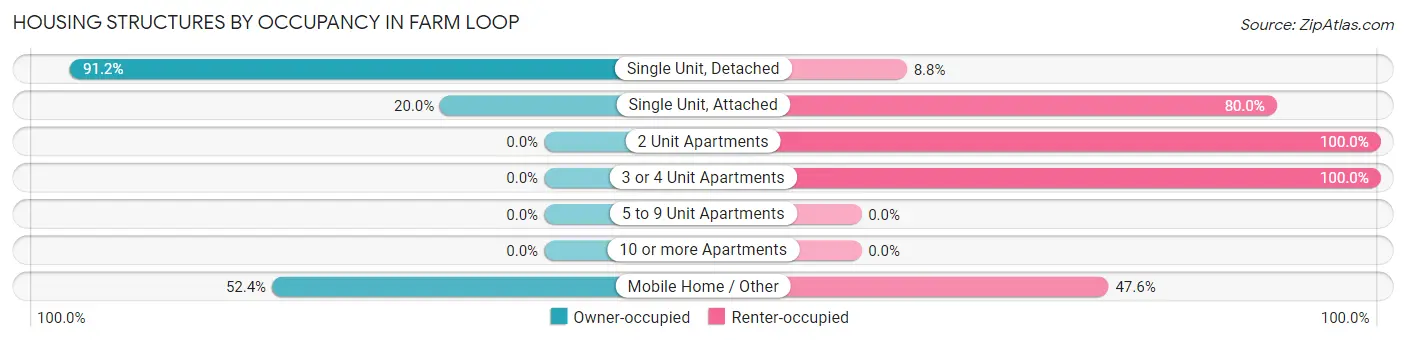
| Structure Type | Owner-occupied | Renter-occupied |
| Single Unit, Detached | 791 (91.2%) | 76 (8.8%) |
| Single Unit, Attached | 1 (20.0%) | 4 (80.0%) |
| 2 Unit Apartments | 0 (0.0%) | 9 (100.0%) |
| 3 or 4 Unit Apartments | 0 (0.0%) | 21 (100.0%) |
| 5 to 9 Unit Apartments | 0 (0.0%) | 0 (0.0%) |
| 10 or more Apartments | 0 (0.0%) | 0 (0.0%) |
| Mobile Home / Other | 22 (52.4%) | 20 (47.6%) |
| Total | 814 (86.2%) | 130 (13.8%) |
Housing Structures by Number of Rooms in Farm Loop
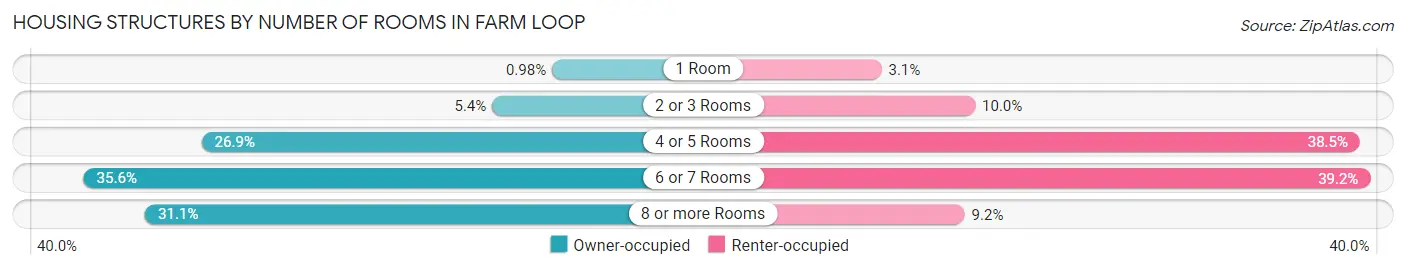
| Number of Rooms | Owner-occupied | Renter-occupied |
| 1 Room | 8 (1.0%) | 4 (3.1%) |
| 2 or 3 Rooms | 44 (5.4%) | 13 (10.0%) |
| 4 or 5 Rooms | 219 (26.9%) | 50 (38.5%) |
| 6 or 7 Rooms | 290 (35.6%) | 51 (39.2%) |
| 8 or more Rooms | 253 (31.1%) | 12 (9.2%) |
| Total | 814 (100.0%) | 130 (100.0%) |
Housing Structure by Heating Type in Farm Loop
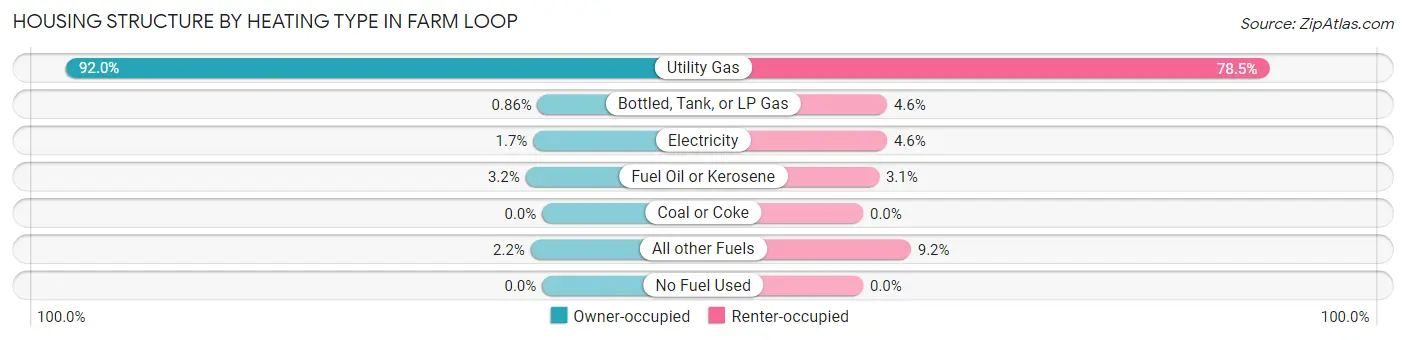
| Heating Type | Owner-occupied | Renter-occupied |
| Utility Gas | 749 (92.0%) | 102 (78.5%) |
| Bottled, Tank, or LP Gas | 7 (0.9%) | 6 (4.6%) |
| Electricity | 14 (1.7%) | 6 (4.6%) |
| Fuel Oil or Kerosene | 26 (3.2%) | 4 (3.1%) |
| Coal or Coke | 0 (0.0%) | 0 (0.0%) |
| All other Fuels | 18 (2.2%) | 12 (9.2%) |
| No Fuel Used | 0 (0.0%) | 0 (0.0%) |
| Total | 814 (100.0%) | 130 (100.0%) |
Household Vehicle Usage in Farm Loop
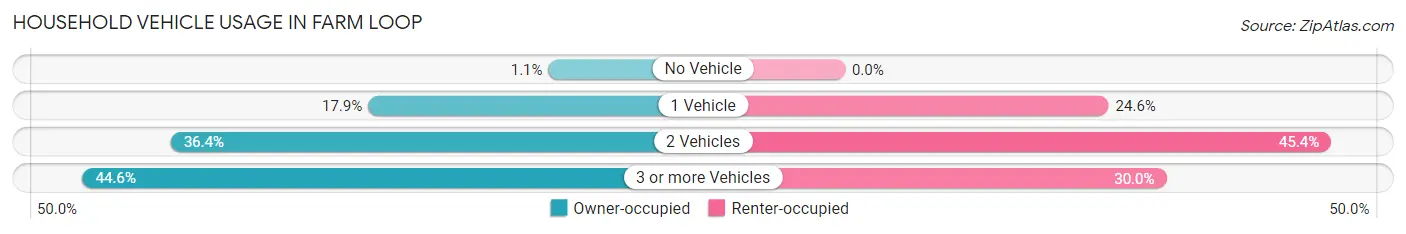
| Vehicles per Household | Owner-occupied | Renter-occupied |
| No Vehicle | 9 (1.1%) | 0 (0.0%) |
| 1 Vehicle | 146 (17.9%) | 32 (24.6%) |
| 2 Vehicles | 296 (36.4%) | 59 (45.4%) |
| 3 or more Vehicles | 363 (44.6%) | 39 (30.0%) |
| Total | 814 (100.0%) | 130 (100.0%) |
Real Estate & Mortgages in Farm Loop
Real Estate and Mortgage Overview in Farm Loop
| Characteristic | Without Mortgage | With Mortgage |
| Housing Units | 287 | 527 |
| Median Property Value | $305,100 | $366,600 |
| Median Household Income | $65,781 | $232 |
| Monthly Housing Costs | $585 | $75 |
| Real Estate Taxes | $3,044 | $17 |
Property Value by Mortgage Status in Farm Loop
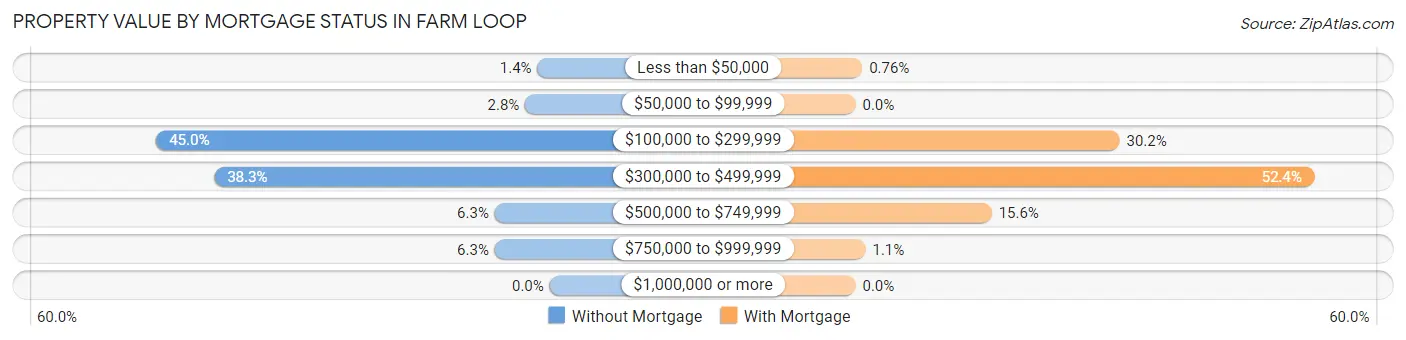
| Property Value | Without Mortgage | With Mortgage |
| Less than $50,000 | 4 (1.4%) | 4 (0.8%) |
| $50,000 to $99,999 | 8 (2.8%) | 0 (0.0%) |
| $100,000 to $299,999 | 129 (45.0%) | 159 (30.2%) |
| $300,000 to $499,999 | 110 (38.3%) | 276 (52.4%) |
| $500,000 to $749,999 | 18 (6.3%) | 82 (15.6%) |
| $750,000 to $999,999 | 18 (6.3%) | 6 (1.1%) |
| $1,000,000 or more | 0 (0.0%) | 0 (0.0%) |
| Total | 287 (100.0%) | 527 (100.0%) |
Household Income by Mortgage Status in Farm Loop
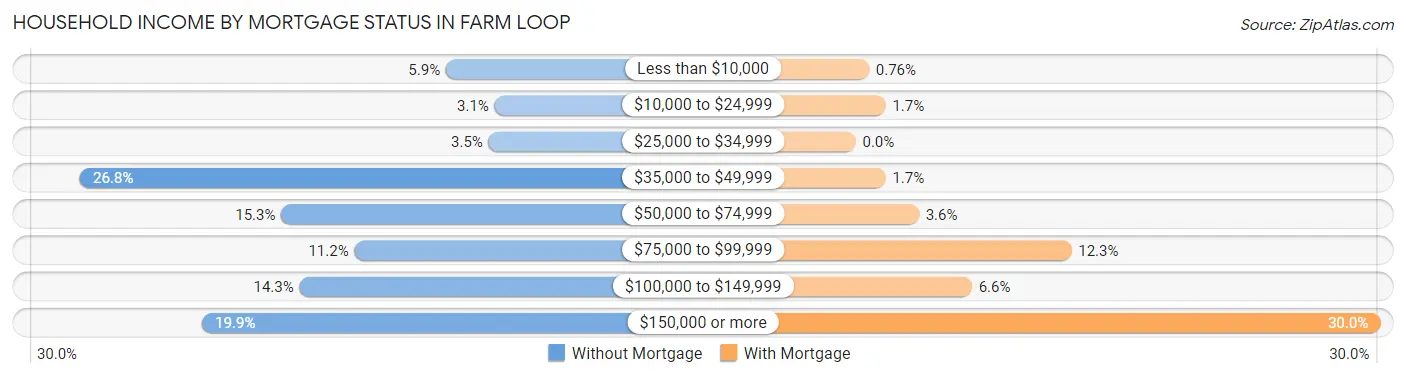
| Household Income | Without Mortgage | With Mortgage |
| Less than $10,000 | 17 (5.9%) | 4 (0.8%) |
| $10,000 to $24,999 | 9 (3.1%) | 9 (1.7%) |
| $25,000 to $34,999 | 10 (3.5%) | 0 (0.0%) |
| $35,000 to $49,999 | 77 (26.8%) | 9 (1.7%) |
| $50,000 to $74,999 | 44 (15.3%) | 19 (3.6%) |
| $75,000 to $99,999 | 32 (11.2%) | 65 (12.3%) |
| $100,000 to $149,999 | 41 (14.3%) | 35 (6.6%) |
| $150,000 or more | 57 (19.9%) | 158 (30.0%) |
| Total | 287 (100.0%) | 527 (100.0%) |
Property Value to Household Income Ratio in Farm Loop
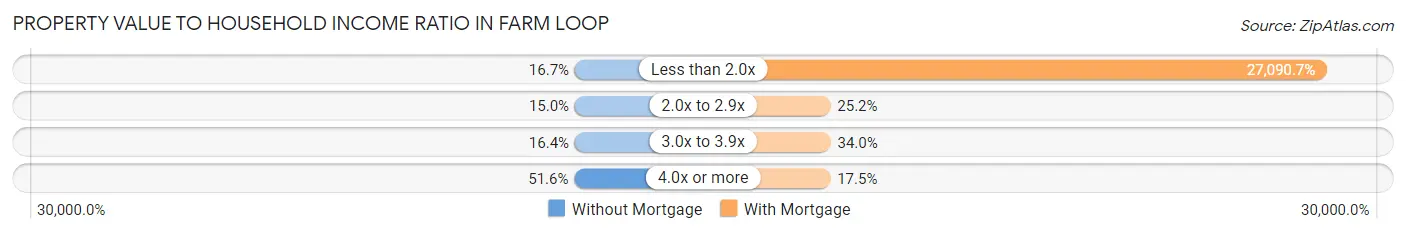
| Value-to-Income Ratio | Without Mortgage | With Mortgage |
| Less than 2.0x | 48 (16.7%) | 142,768 (27,090.7%) |
| 2.0x to 2.9x | 43 (15.0%) | 133 (25.2%) |
| 3.0x to 3.9x | 47 (16.4%) | 179 (34.0%) |
| 4.0x or more | 148 (51.6%) | 92 (17.5%) |
| Total | 287 (100.0%) | 527 (100.0%) |
Real Estate Taxes by Mortgage Status in Farm Loop
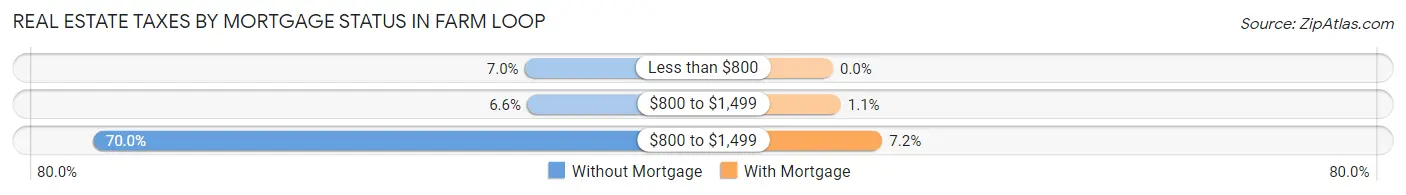
| Property Taxes | Without Mortgage | With Mortgage |
| Less than $800 | 20 (7.0%) | 0 (0.0%) |
| $800 to $1,499 | 19 (6.6%) | 6 (1.1%) |
| $800 to $1,499 | 201 (70.0%) | 38 (7.2%) |
| Total | 287 (100.0%) | 527 (100.0%) |
Health & Disability in Farm Loop
Health Insurance Coverage by Age in Farm Loop
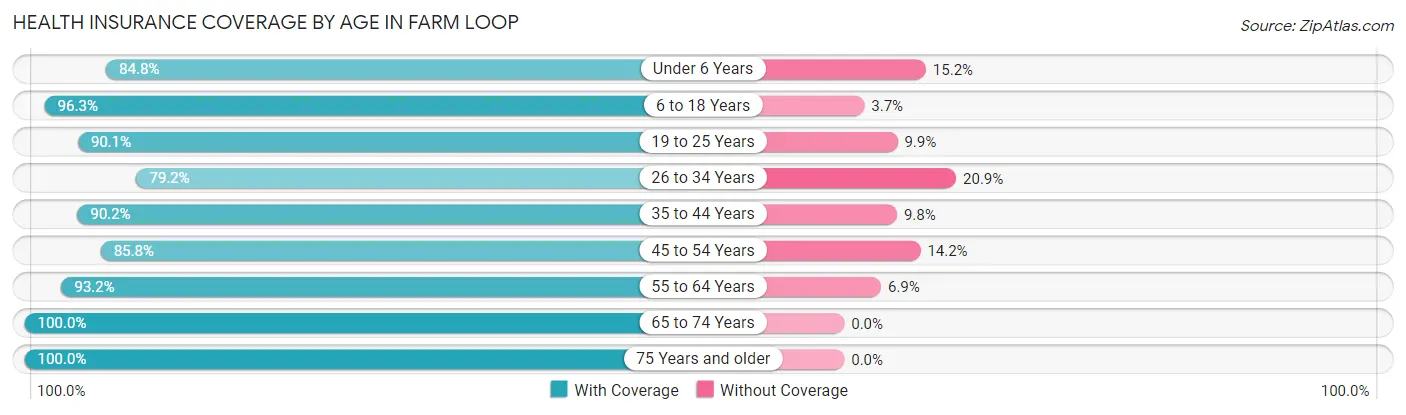
| Age Bracket | With Coverage | Without Coverage |
| Under 6 Years | 156 (84.8%) | 28 (15.2%) |
| 6 to 18 Years | 438 (96.3%) | 17 (3.7%) |
| 19 to 25 Years | 109 (90.1%) | 12 (9.9%) |
| 26 to 34 Years | 224 (79.1%) | 59 (20.8%) |
| 35 to 44 Years | 376 (90.2%) | 41 (9.8%) |
| 45 to 54 Years | 278 (85.8%) | 46 (14.2%) |
| 55 to 64 Years | 340 (93.1%) | 25 (6.9%) |
| 65 to 74 Years | 285 (100.0%) | 0 (0.0%) |
| 75 Years and older | 99 (100.0%) | 0 (0.0%) |
| Total | 2,305 (91.0%) | 228 (9.0%) |
Health Insurance Coverage by Citizenship Status in Farm Loop
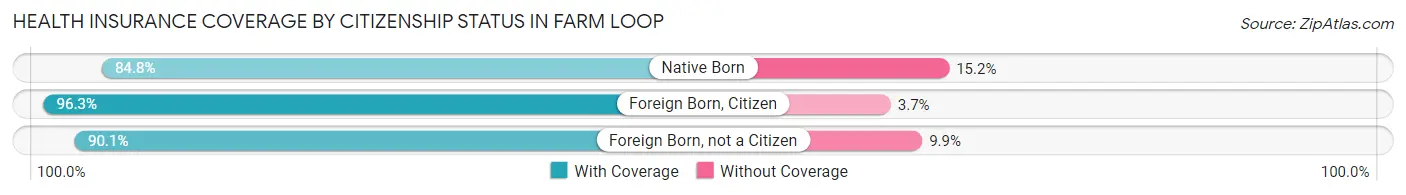
| Citizenship Status | With Coverage | Without Coverage |
| Native Born | 156 (84.8%) | 28 (15.2%) |
| Foreign Born, Citizen | 438 (96.3%) | 17 (3.7%) |
| Foreign Born, not a Citizen | 109 (90.1%) | 12 (9.9%) |
Health Insurance Coverage by Household Income in Farm Loop
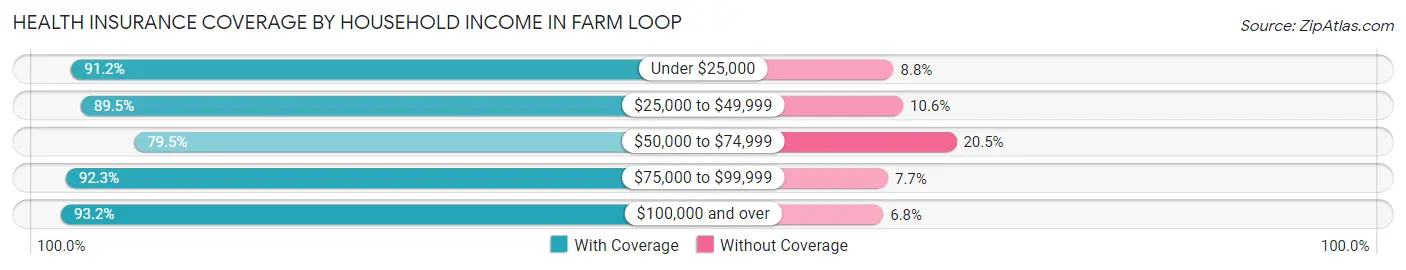
| Household Income | With Coverage | Without Coverage |
| Under $25,000 | 104 (91.2%) | 10 (8.8%) |
| $25,000 to $49,999 | 246 (89.4%) | 29 (10.5%) |
| $50,000 to $74,999 | 236 (79.5%) | 61 (20.5%) |
| $75,000 to $99,999 | 191 (92.3%) | 16 (7.7%) |
| $100,000 and over | 1,525 (93.2%) | 112 (6.8%) |
Public vs Private Health Insurance Coverage by Age in Farm Loop
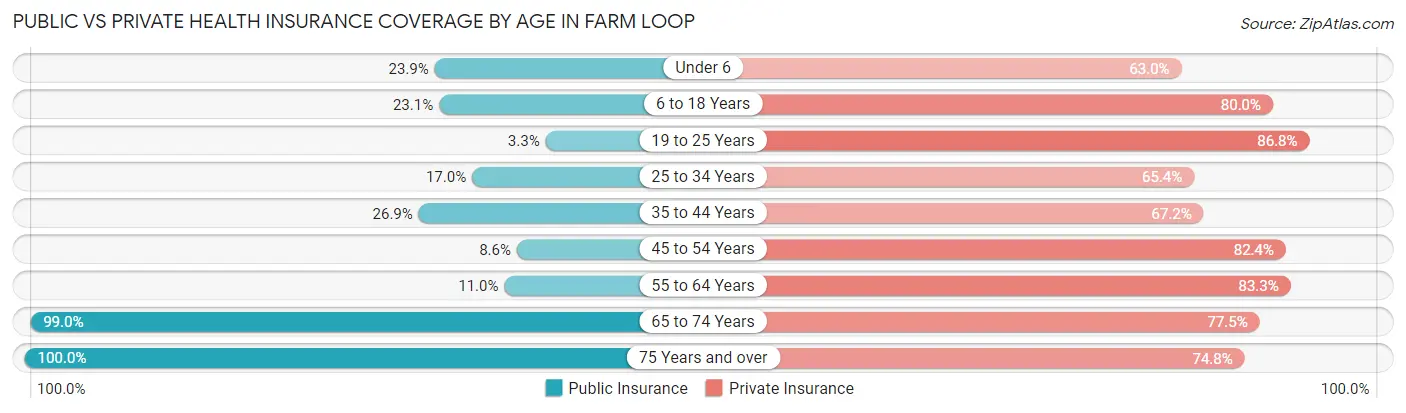
| Age Bracket | Public Insurance | Private Insurance |
| Under 6 | 44 (23.9%) | 116 (63.0%) |
| 6 to 18 Years | 105 (23.1%) | 364 (80.0%) |
| 19 to 25 Years | 4 (3.3%) | 105 (86.8%) |
| 25 to 34 Years | 48 (17.0%) | 185 (65.4%) |
| 35 to 44 Years | 112 (26.9%) | 280 (67.1%) |
| 45 to 54 Years | 28 (8.6%) | 267 (82.4%) |
| 55 to 64 Years | 40 (11.0%) | 304 (83.3%) |
| 65 to 74 Years | 282 (99.0%) | 221 (77.5%) |
| 75 Years and over | 99 (100.0%) | 74 (74.8%) |
| Total | 762 (30.1%) | 1,916 (75.6%) |
Disability Status by Sex by Age in Farm Loop
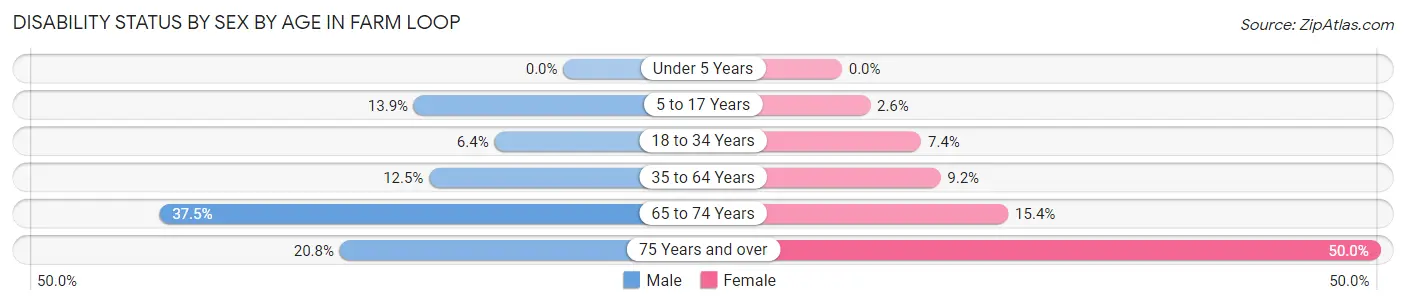
| Age Bracket | Male | Female |
| Under 5 Years | 0 (0.0%) | 0 (0.0%) |
| 5 to 17 Years | 33 (13.9%) | 5 (2.6%) |
| 18 to 34 Years | 14 (6.4%) | 17 (7.4%) |
| 35 to 64 Years | 67 (12.4%) | 52 (9.1%) |
| 65 to 74 Years | 51 (37.5%) | 23 (15.4%) |
| 75 Years and over | 11 (20.7%) | 23 (50.0%) |
Disability Class by Sex by Age in Farm Loop
Disability Class: Hearing Difficulty
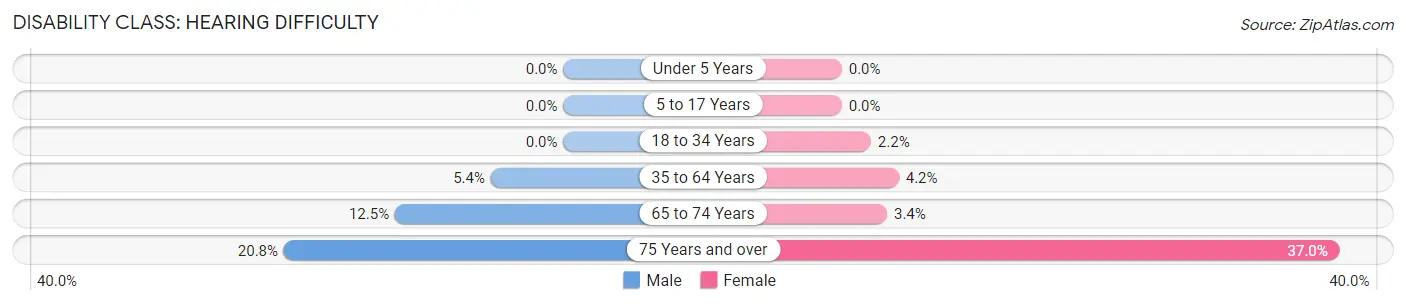
| Age Bracket | Male | Female |
| Under 5 Years | 0 (0.0%) | 0 (0.0%) |
| 5 to 17 Years | 0 (0.0%) | 0 (0.0%) |
| 18 to 34 Years | 0 (0.0%) | 5 (2.2%) |
| 35 to 64 Years | 29 (5.4%) | 24 (4.2%) |
| 65 to 74 Years | 17 (12.5%) | 5 (3.4%) |
| 75 Years and over | 11 (20.7%) | 17 (37.0%) |
Disability Class: Vision Difficulty
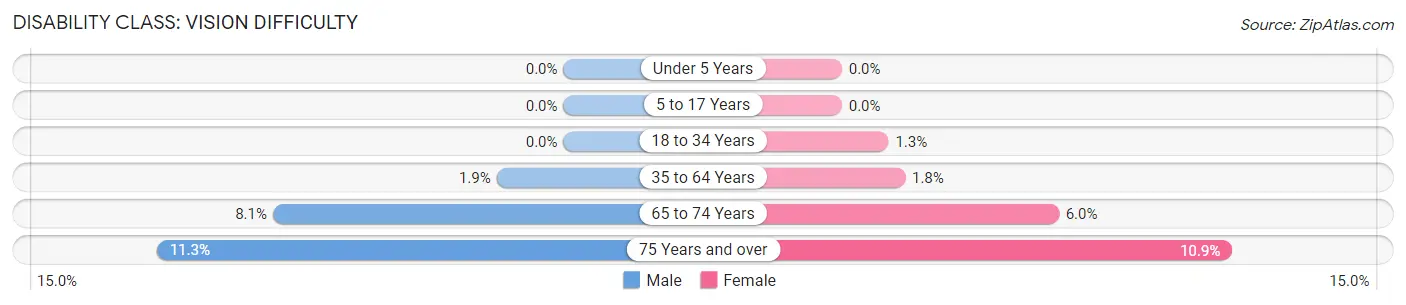
| Age Bracket | Male | Female |
| Under 5 Years | 0 (0.0%) | 0 (0.0%) |
| 5 to 17 Years | 0 (0.0%) | 0 (0.0%) |
| 18 to 34 Years | 0 (0.0%) | 3 (1.3%) |
| 35 to 64 Years | 10 (1.9%) | 10 (1.8%) |
| 65 to 74 Years | 11 (8.1%) | 9 (6.0%) |
| 75 Years and over | 6 (11.3%) | 5 (10.9%) |
Disability Class: Cognitive Difficulty
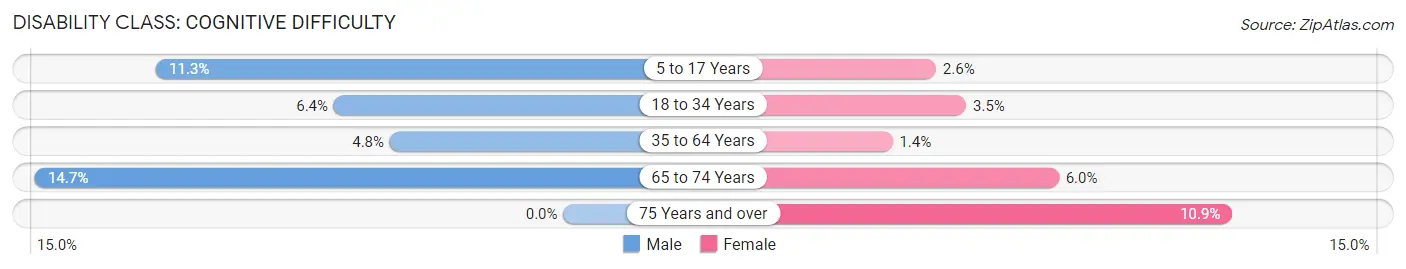
| Age Bracket | Male | Female |
| 5 to 17 Years | 27 (11.3%) | 5 (2.6%) |
| 18 to 34 Years | 14 (6.4%) | 8 (3.5%) |
| 35 to 64 Years | 26 (4.8%) | 8 (1.4%) |
| 65 to 74 Years | 20 (14.7%) | 9 (6.0%) |
| 75 Years and over | 0 (0.0%) | 5 (10.9%) |
Disability Class: Ambulatory Difficulty
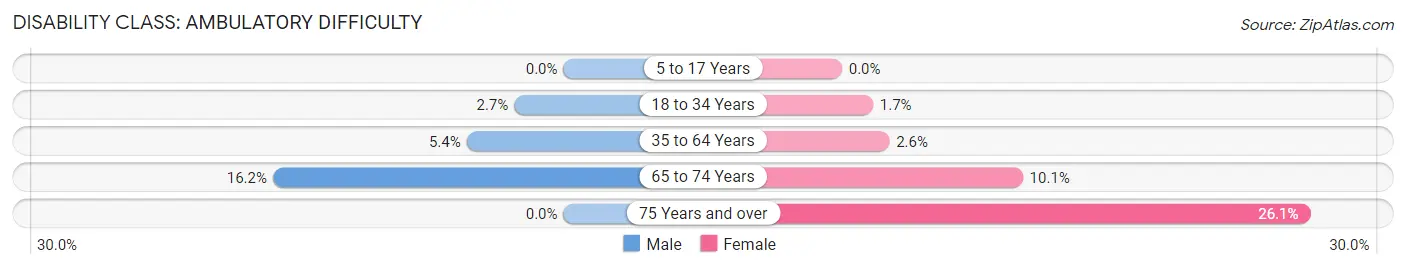
| Age Bracket | Male | Female |
| 5 to 17 Years | 0 (0.0%) | 0 (0.0%) |
| 18 to 34 Years | 6 (2.7%) | 4 (1.7%) |
| 35 to 64 Years | 29 (5.4%) | 15 (2.6%) |
| 65 to 74 Years | 22 (16.2%) | 15 (10.1%) |
| 75 Years and over | 0 (0.0%) | 12 (26.1%) |
Disability Class: Self-Care Difficulty
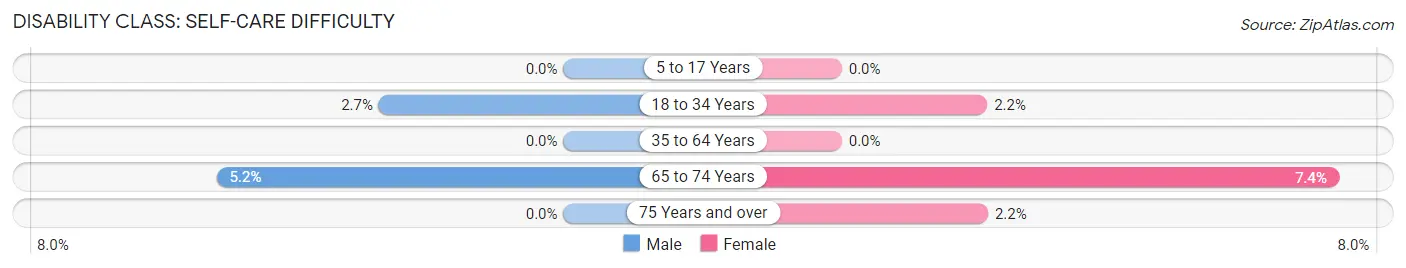
| Age Bracket | Male | Female |
| 5 to 17 Years | 0 (0.0%) | 0 (0.0%) |
| 18 to 34 Years | 6 (2.7%) | 5 (2.2%) |
| 35 to 64 Years | 0 (0.0%) | 0 (0.0%) |
| 65 to 74 Years | 7 (5.1%) | 11 (7.4%) |
| 75 Years and over | 0 (0.0%) | 1 (2.2%) |
Technology Access in Farm Loop
Computing Device Access in Farm Loop
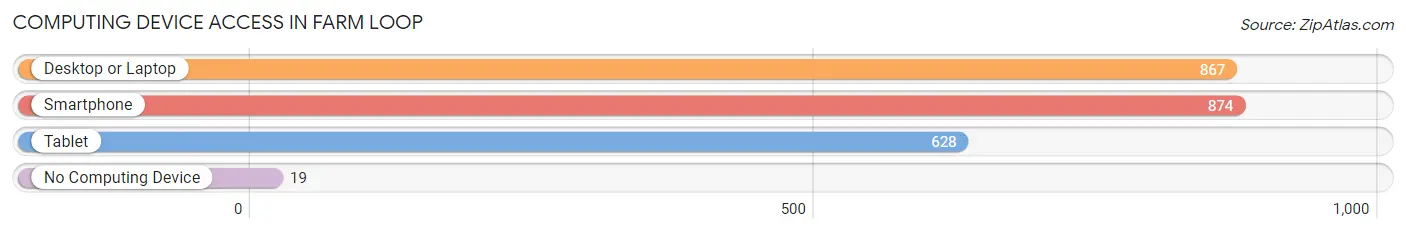
| Device Type | # Households | % Households |
| Desktop or Laptop | 867 | 91.8% |
| Smartphone | 874 | 92.6% |
| Tablet | 628 | 66.5% |
| No Computing Device | 19 | 2.0% |
| Total | 944 | 100.0% |
Internet Access in Farm Loop
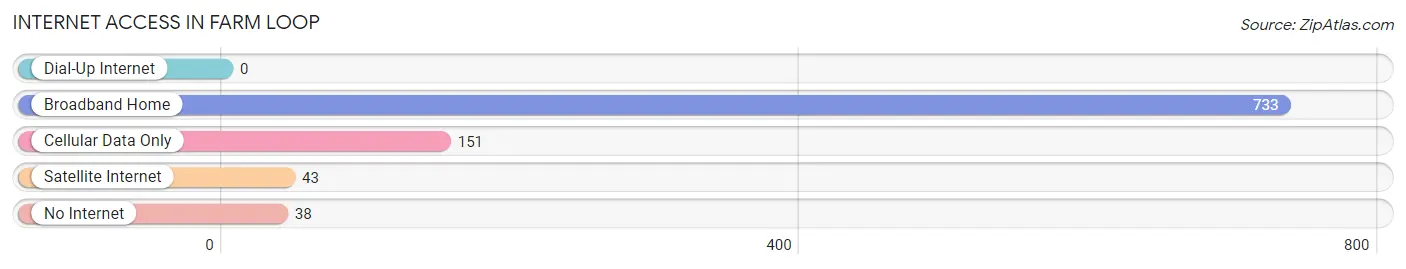
| Internet Type | # Households | % Households |
| Dial-Up Internet | 0 | 0.0% |
| Broadband Home | 733 | 77.6% |
| Cellular Data Only | 151 | 16.0% |
| Satellite Internet | 43 | 4.6% |
| No Internet | 38 | 4.0% |
| Total | 944 | 100.0% |
Farm Loop Summary
Loop, Alaska is a small unincorporated community located in the Matanuska-Susitna Borough of Alaska. It is situated on the south side of the Matanuska River, approximately 25 miles northeast of Palmer and 40 miles north of Anchorage. The community is home to a small population of approximately 200 people, and is primarily a farming and fishing community.
History
Loop, Alaska was first settled in the early 1900s by homesteaders who were attracted to the area by its fertile soil and abundant fish and game. The first settlers were mostly of Scandinavian descent, and the community was named after a nearby loop in the Matanuska River. The community was initially a small farming and fishing village, and the first school was built in the area in the 1920s.
In the 1950s, the community began to grow as more people moved to the area to take advantage of the fertile soil and abundant fish and game. The community was incorporated in 1959, and the first mayor was elected in 1960.
Geography
Loop, Alaska is located in the Matanuska-Susitna Borough of Alaska, approximately 25 miles northeast of Palmer and 40 miles north of Anchorage. The community is situated on the south side of the Matanuska River, and is surrounded by mountains and forests. The climate in the area is generally mild, with temperatures ranging from the mid-30s in the winter to the mid-60s in the summer.
Economy
The economy of Loop, Alaska is primarily based on farming and fishing. The community is home to several small farms, which produce a variety of crops, including potatoes, carrots, and hay. The area is also home to several commercial fishing operations, which harvest salmon, halibut, and other fish from the nearby waters.
In addition to farming and fishing, the community is home to several small businesses, including a general store, a gas station, and a restaurant. The community also has a small airport, which serves as a hub for air travel to and from the area.
Demographics
As of the 2010 census, the population of Loop, Alaska was approximately 200 people. The racial makeup of the community was 95.5% White, 0.5% Native American, 0.5% Asian, and 3.5% from other races. The median household income in the community was $45,000, and the median age was 44.
Conclusion
Loop, Alaska is a small unincorporated community located in the Matanuska-Susitna Borough of Alaska. It is situated on the south side of the Matanuska River, approximately 25 miles northeast of Palmer and 40 miles north of Anchorage. The community is home to a small population of approximately 200 people, and is primarily a farming and fishing community. The economy of Loop, Alaska is primarily based on farming and fishing, and the community is home to several small businesses. The racial makeup of the community is primarily White, with a small percentage of Native American and Asian residents.
Common Questions
What is Per Capita Income in Farm Loop?
Per Capita income in Farm Loop is $46,587.
What is the Median Family Income in Farm Loop?
Median Family Income in Farm Loop is $117,422.
What is the Median Household income in Farm Loop?
Median Household Income in Farm Loop is $112,683.
What is Income or Wage Gap in Farm Loop?
Income or Wage Gap in Farm Loop is 51.4%.
Women in Farm Loop earn 48.6 cents for every dollar earned by a man.
What is Inequality or Gini Index in Farm Loop?
Inequality or Gini Index in Farm Loop is 0.39.
What is the Total Population of Farm Loop?
Total Population of Farm Loop is 2,561.
What is the Total Male Population of Farm Loop?
Total Male Population of Farm Loop is 1,284.
What is the Total Female Population of Farm Loop?
Total Female Population of Farm Loop is 1,277.
What is the Ratio of Males per 100 Females in Farm Loop?
There are 100.55 Males per 100 Females in Farm Loop.
What is the Ratio of Females per 100 Males in Farm Loop?
There are 99.45 Females per 100 Males in Farm Loop.
What is the Median Population Age in Farm Loop?
Median Population Age in Farm Loop is 40.9 Years.
What is the Average Family Size in Farm Loop
Average Family Size in Farm Loop is 3.1 People.
What is the Average Household Size in Farm Loop
Average Household Size in Farm Loop is 2.7 People.
How Large is the Labor Force in Farm Loop?
There are 1,371 People in the Labor Forcein in Farm Loop.
What is the Percentage of People in the Labor Force in Farm Loop?
67.4% of People are in the Labor Force in Farm Loop.
What is the Unemployment Rate in Farm Loop?
Unemployment Rate in Farm Loop is 7.8%.