Sterling, AK Map & Demographics
Sterling Map
Sterling Overview
$61,101
PER CAPITA INCOME
$134,940
AVG FAMILY INCOME
$98,542
AVG HOUSEHOLD INCOME
53.3%
WAGE / INCOME GAP [ % ]
46.7¢/ $1
WAGE / INCOME GAP [ $ ]
0.50
INEQUALITY / GINI INDEX
6,307
TOTAL POPULATION
3,329
MALE POPULATION
2,978
FEMALE POPULATION
111.79
MALES / 100 FEMALES
89.46
FEMALES / 100 MALES
47.6
MEDIAN AGE
3.1
AVG FAMILY SIZE
2.4
AVG HOUSEHOLD SIZE
3,111
LABOR FORCE [ PEOPLE ]
58.6%
PERCENT IN LABOR FORCE
10.5%
UNEMPLOYMENT RATE
Sterling Zip Codes
Sterling Area Codes
Income in Sterling
Income Overview in Sterling
Per Capita Income in Sterling is $61,101, while median incomes of families and households are $134,940 and $98,542 respectively.
| Characteristic | Number | Measure |
| Per Capita Income | 6,307 | $61,101 |
| Median Family Income | 1,587 | $134,940 |
| Mean Family Income | 1,587 | $194,575 |
| Median Household Income | 2,622 | $98,542 |
| Mean Household Income | 2,622 | $141,993 |
| Income Deficit | 1,587 | $0 |
| Wage / Income Gap (%) | 6,307 | 53.33% |
| Wage / Income Gap ($) | 6,307 | 46.67¢ per $1 |
| Gini / Inequality Index | 6,307 | 0.50 |
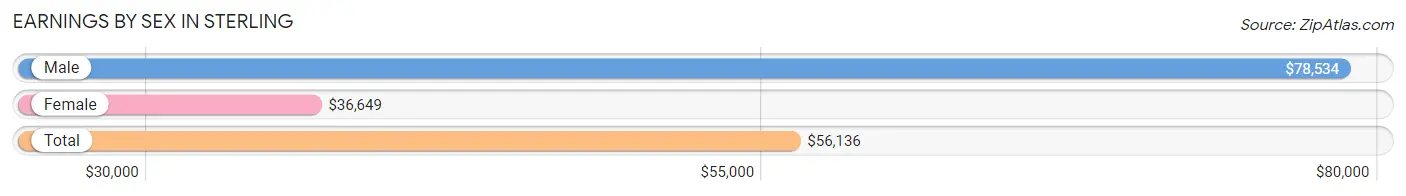
Earnings by Sex in Sterling
Average Earnings in Sterling are $56,136, $78,534 for men and $36,649 for women, a difference of 53.3%.
| Sex | Number | Average Earnings |
| Male | 1,866 (54.2%) | $78,534 |
| Female | 1,576 (45.8%) | $36,649 |
| Total | 3,442 (100.0%) | $56,136 |
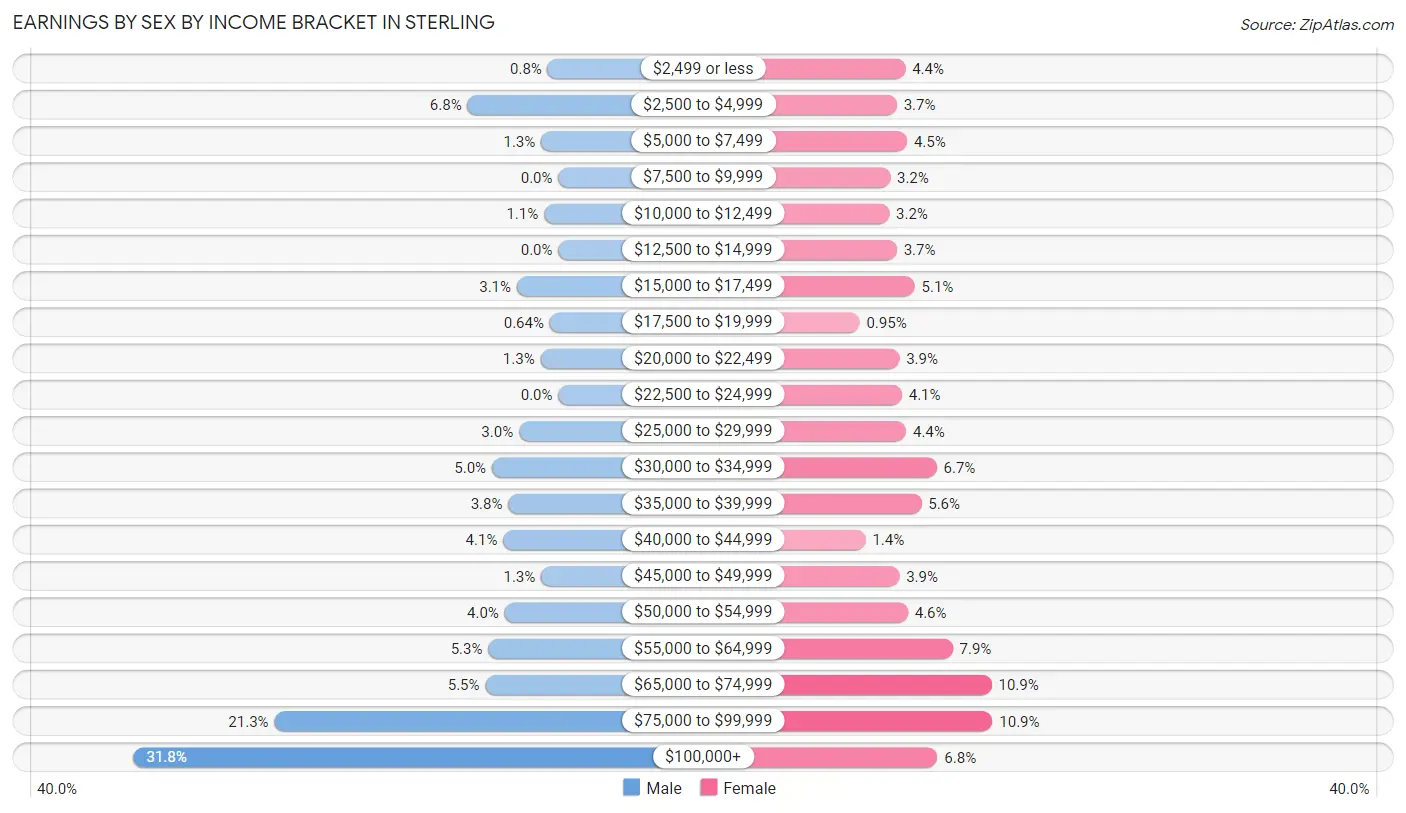
Earnings by Sex by Income Bracket in Sterling
The most common earnings brackets in Sterling are $100,000+ for men (594 | 31.8%) and $75,000 to $99,999 for women (172 | 10.9%).
| Income | Male | Female |
| $2,499 or less | 15 (0.8%) | 69 (4.4%) |
| $2,500 to $4,999 | 127 (6.8%) | 59 (3.7%) |
| $5,000 to $7,499 | 24 (1.3%) | 71 (4.5%) |
| $7,500 to $9,999 | 0 (0.0%) | 51 (3.2%) |
| $10,000 to $12,499 | 20 (1.1%) | 50 (3.2%) |
| $12,500 to $14,999 | 0 (0.0%) | 59 (3.7%) |
| $15,000 to $17,499 | 58 (3.1%) | 80 (5.1%) |
| $17,500 to $19,999 | 12 (0.6%) | 15 (0.9%) |
| $20,000 to $22,499 | 25 (1.3%) | 62 (3.9%) |
| $22,500 to $24,999 | 0 (0.0%) | 65 (4.1%) |
| $25,000 to $29,999 | 55 (2.9%) | 70 (4.4%) |
| $30,000 to $34,999 | 93 (5.0%) | 106 (6.7%) |
| $35,000 to $39,999 | 70 (3.7%) | 88 (5.6%) |
| $40,000 to $44,999 | 77 (4.1%) | 22 (1.4%) |
| $45,000 to $49,999 | 24 (1.3%) | 62 (3.9%) |
| $50,000 to $54,999 | 75 (4.0%) | 72 (4.6%) |
| $55,000 to $64,999 | 98 (5.2%) | 125 (7.9%) |
| $65,000 to $74,999 | 102 (5.5%) | 171 (10.8%) |
| $75,000 to $99,999 | 397 (21.3%) | 172 (10.9%) |
| $100,000+ | 594 (31.8%) | 107 (6.8%) |
| Total | 1,866 (100.0%) | 1,576 (100.0%) |
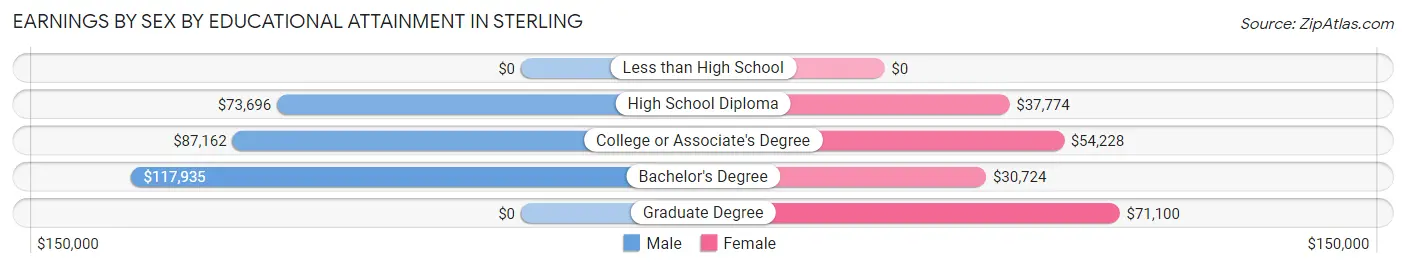
Earnings by Sex by Educational Attainment in Sterling
Average earnings in Sterling are $88,206 for men and $39,665 for women, a difference of 55.0%. Men with an educational attainment of bachelor's degree enjoy the highest average annual earnings of $117,935, while those with high school diploma education earn the least with $73,696. Women with an educational attainment of graduate degree earn the most with the average annual earnings of $71,100, while those with bachelor's degree education have the smallest earnings of $30,724.
| Educational Attainment | Male Income | Female Income |
| Less than High School | - | - |
| High School Diploma | $73,696 | $37,774 |
| College or Associate's Degree | $87,162 | $54,228 |
| Bachelor's Degree | $117,935 | $30,724 |
| Graduate Degree | - | - |
| Total | $88,206 | $39,665 |
Family Income in Sterling
Family Income Brackets in Sterling
According to the Sterling family income data, there are 449 families falling into the $200,000+ income range, which is the most common income bracket and makes up 28.3% of all families.
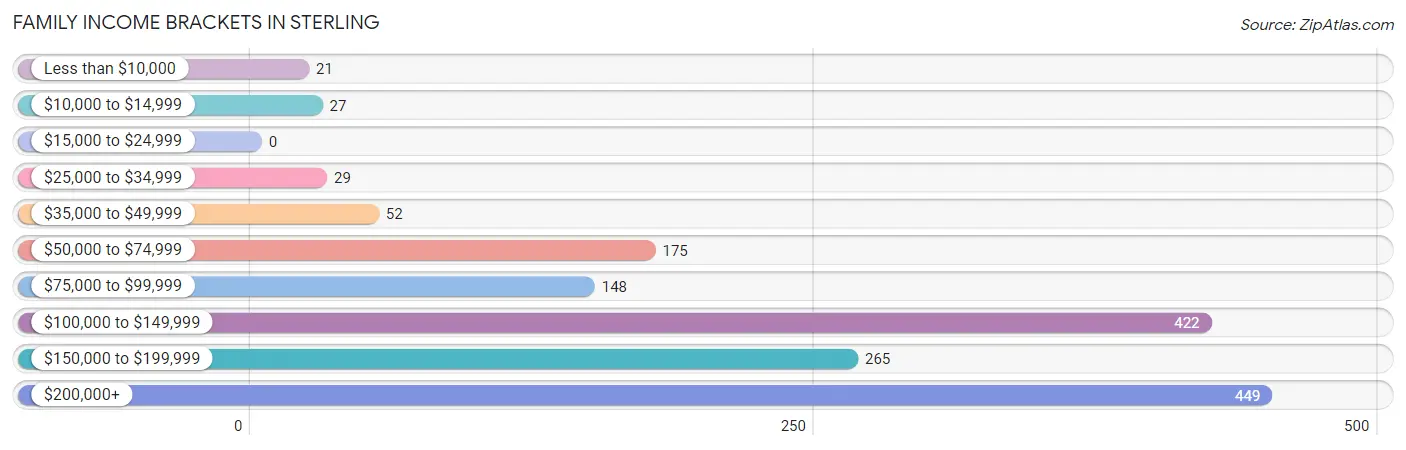
| Income Bracket | # Families | % Families |
| Less than $10,000 | 21 | 1.3% |
| $10,000 to $14,999 | 27 | 1.7% |
| $15,000 to $24,999 | 0 | 0.0% |
| $25,000 to $34,999 | 29 | 1.8% |
| $35,000 to $49,999 | 52 | 3.3% |
| $50,000 to $74,999 | 175 | 11.0% |
| $75,000 to $99,999 | 148 | 9.3% |
| $100,000 to $149,999 | 422 | 26.6% |
| $150,000 to $199,999 | 265 | 16.7% |
| $200,000+ | 449 | 28.3% |
Family Income by Famaliy Size in Sterling
4-person families (276 | 17.4%) account for the highest median family income in Sterling with $198,152 per family, while 2-person families (860 | 54.2%) have the highest median income of $63,100 per family member.
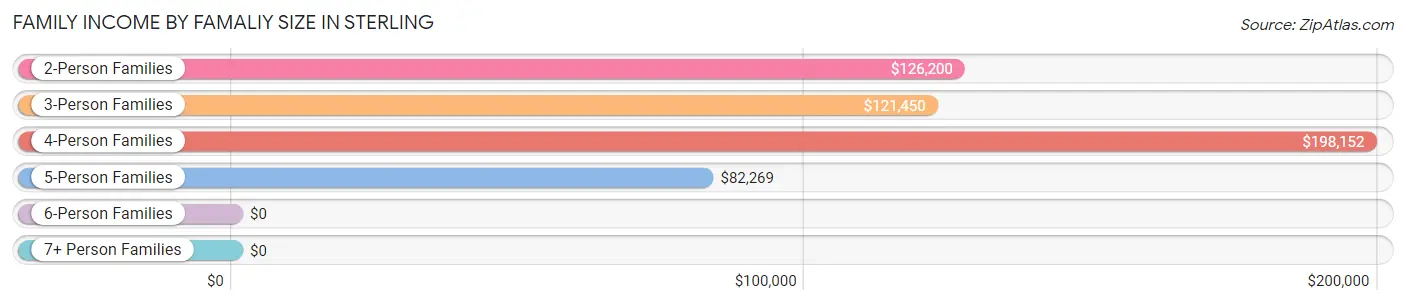
| Income Bracket | # Families | Median Income |
| 2-Person Families | 860 (54.2%) | $126,200 |
| 3-Person Families | 315 (19.9%) | $121,450 |
| 4-Person Families | 276 (17.4%) | $198,152 |
| 5-Person Families | 107 (6.7%) | $82,269 |
| 6-Person Families | 29 (1.8%) | $0 |
| 7+ Person Families | 0 (0.0%) | $0 |
| Total | 1,587 (100.0%) | $134,940 |
Family Income by Number of Earners in Sterling
The median family income in Sterling is $134,940, with families comprising 3+ earners (253) having the highest median family income of $247,981, while families with no earners (257) have the lowest median family income of $81,673, accounting for 15.9% and 16.2% of families, respectively.
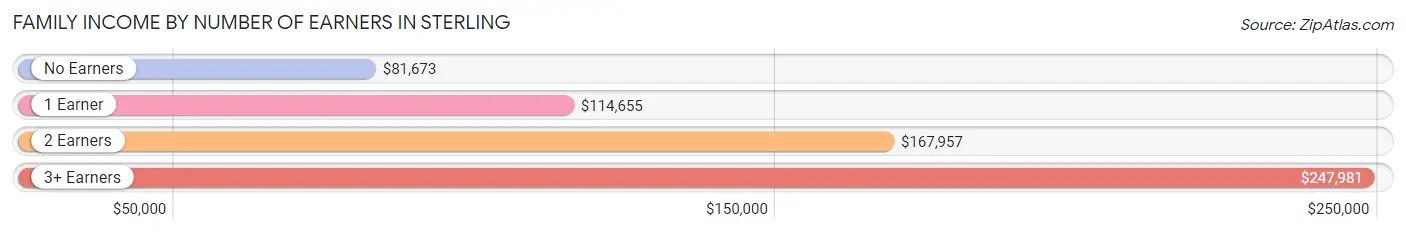
| Number of Earners | # Families | Median Income |
| No Earners | 257 (16.2%) | $81,673 |
| 1 Earner | 482 (30.4%) | $114,655 |
| 2 Earners | 595 (37.5%) | $167,957 |
| 3+ Earners | 253 (15.9%) | $247,981 |
| Total | 1,587 (100.0%) | $134,940 |
Household Income in Sterling
Household Income Brackets in Sterling
With 530 households falling in the category, the $100,000 to $149,999 income range is the most frequent in Sterling, accounting for 20.2% of all households. In contrast, only 37 households (1.4%) fall into the $25,000 to $34,999 income bracket, making it the least populous group.
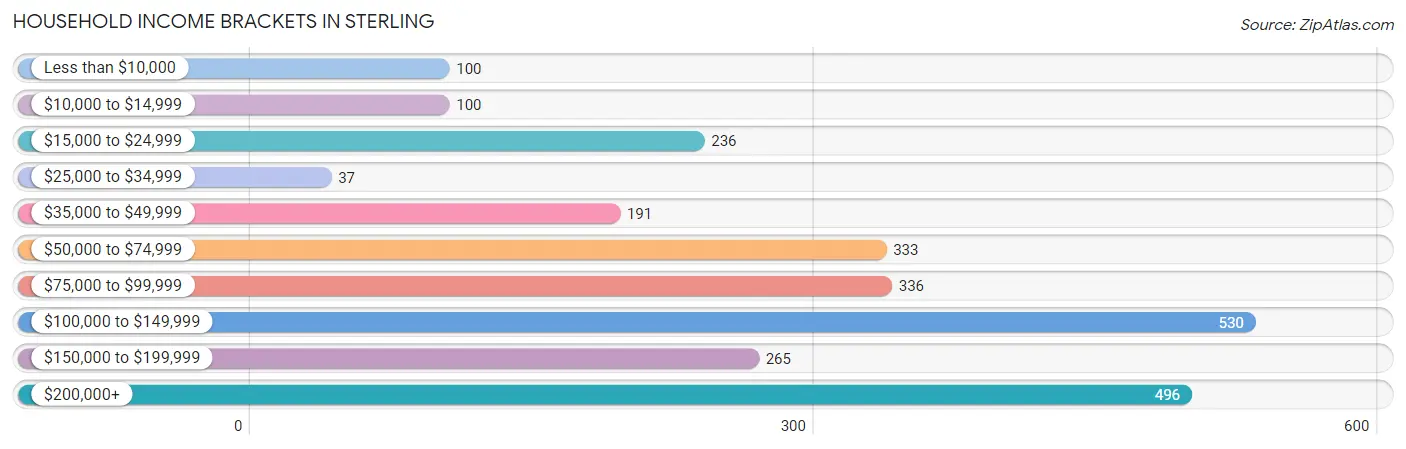
| Income Bracket | # Households | % Households |
| Less than $10,000 | 100 | 3.8% |
| $10,000 to $14,999 | 100 | 3.8% |
| $15,000 to $24,999 | 236 | 9.0% |
| $25,000 to $34,999 | 37 | 1.4% |
| $35,000 to $49,999 | 191 | 7.3% |
| $50,000 to $74,999 | 333 | 12.7% |
| $75,000 to $99,999 | 336 | 12.8% |
| $100,000 to $149,999 | 530 | 20.2% |
| $150,000 to $199,999 | 265 | 10.1% |
| $200,000+ | 496 | 18.9% |
Household Income by Householder Age in Sterling
The median household income in Sterling is $98,542, with the highest median household income of $160,294 found in the 25 to 44 years age bracket for the primary householder. A total of 464 households (17.7%) fall into this category. Meanwhile, the 15 to 24 years age bracket for the primary householder has the lowest median household income of $0, with 18 households (0.7%) in this group.
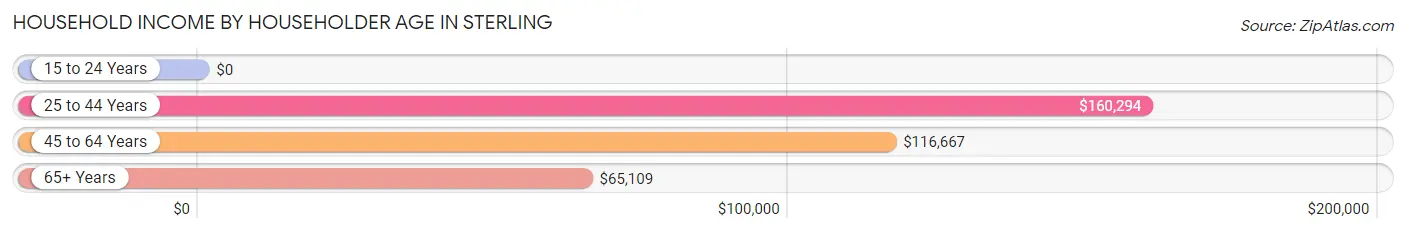
| Income Bracket | # Households | Median Income |
| 15 to 24 Years | 18 (0.7%) | $0 |
| 25 to 44 Years | 464 (17.7%) | $160,294 |
| 45 to 64 Years | 1,178 (44.9%) | $116,667 |
| 65+ Years | 962 (36.7%) | $65,109 |
| Total | 2,622 (100.0%) | $98,542 |
Poverty in Sterling
Income Below Poverty by Sex and Age in Sterling
With 10.6% poverty level for males and 9.0% for females among the residents of Sterling, 5 year old males and 15 year old females are the most vulnerable to poverty, with 37 males (77.1%) and 34 females (63.0%) in their respective age groups living below the poverty level.
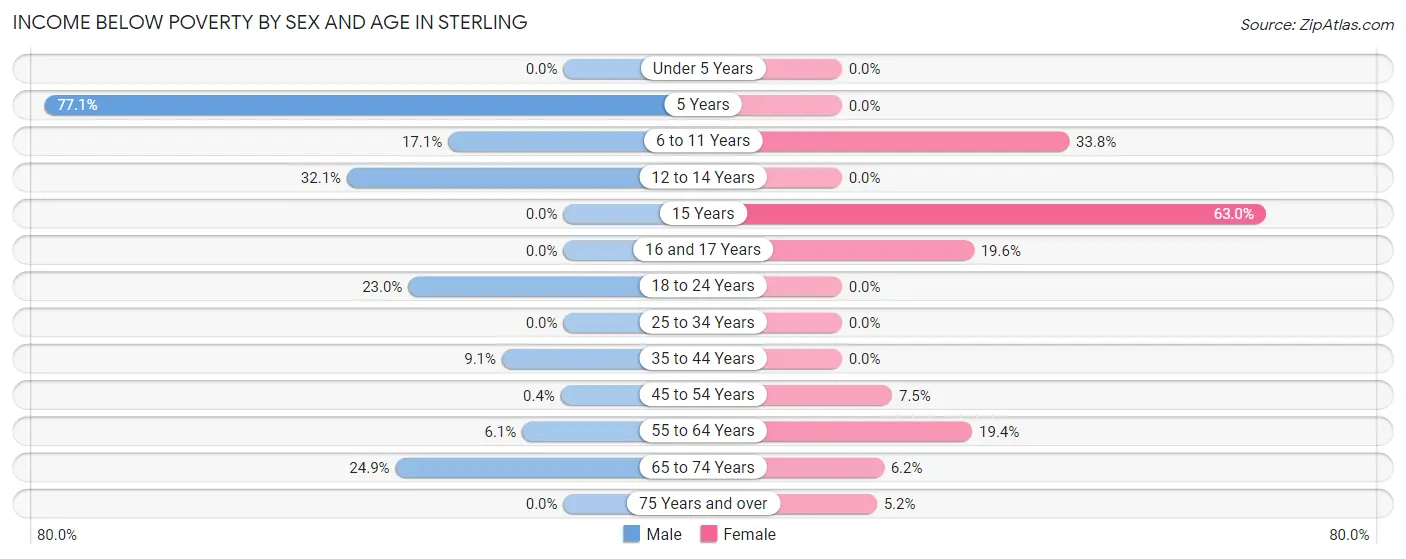
| Age Bracket | Male | Female |
| Under 5 Years | 0 (0.0%) | 0 (0.0%) |
| 5 Years | 37 (77.1%) | 0 (0.0%) |
| 6 to 11 Years | 56 (17.1%) | 54 (33.8%) |
| 12 to 14 Years | 36 (32.1%) | 0 (0.0%) |
| 15 Years | 0 (0.0%) | 34 (63.0%) |
| 16 and 17 Years | 0 (0.0%) | 19 (19.6%) |
| 18 to 24 Years | 53 (23.0%) | 0 (0.0%) |
| 25 to 34 Years | 0 (0.0%) | 0 (0.0%) |
| 35 to 44 Years | 24 (9.1%) | 0 (0.0%) |
| 45 to 54 Years | 2 (0.4%) | 29 (7.5%) |
| 55 to 64 Years | 38 (6.1%) | 90 (19.4%) |
| 65 to 74 Years | 108 (24.9%) | 28 (6.2%) |
| 75 Years and over | 0 (0.0%) | 12 (5.2%) |
| Total | 354 (10.6%) | 266 (9.0%) |
Income Above Poverty by Sex and Age in Sterling
According to the poverty statistics in Sterling, males aged under 5 years and females aged under 5 years are the age groups that are most secure financially, with 100.0% of males and 100.0% of females in these age groups living above the poverty line.
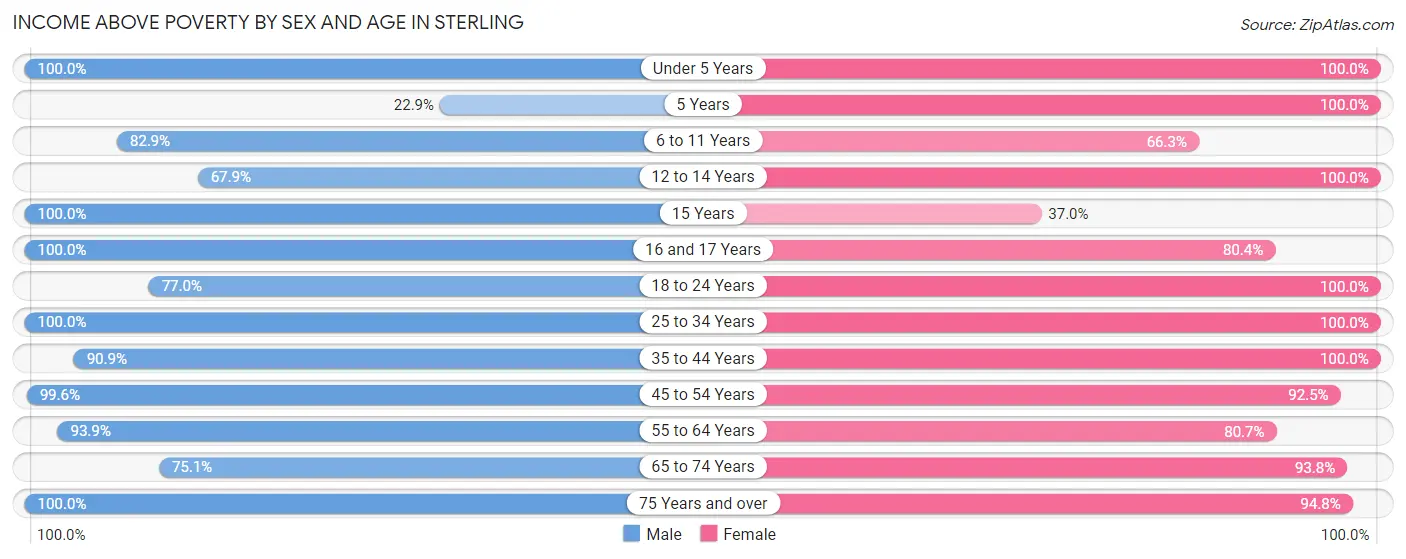
| Age Bracket | Male | Female |
| Under 5 Years | 46 (100.0%) | 138 (100.0%) |
| 5 Years | 11 (22.9%) | 48 (100.0%) |
| 6 to 11 Years | 271 (82.9%) | 106 (66.2%) |
| 12 to 14 Years | 76 (67.9%) | 31 (100.0%) |
| 15 Years | 34 (100.0%) | 20 (37.0%) |
| 16 and 17 Years | 74 (100.0%) | 78 (80.4%) |
| 18 to 24 Years | 177 (77.0%) | 316 (100.0%) |
| 25 to 34 Years | 349 (100.0%) | 301 (100.0%) |
| 35 to 44 Years | 239 (90.9%) | 278 (100.0%) |
| 45 to 54 Years | 498 (99.6%) | 360 (92.5%) |
| 55 to 64 Years | 583 (93.9%) | 375 (80.6%) |
| 65 to 74 Years | 325 (75.1%) | 422 (93.8%) |
| 75 Years and over | 292 (100.0%) | 219 (94.8%) |
| Total | 2,975 (89.4%) | 2,692 (91.0%) |
Income Below Poverty Among Married-Couple Families in Sterling
The poverty statistics for married-couple families in Sterling show that 1.9% or 27 of the total 1,382 families live below the poverty line. Families with no children have the highest poverty rate of 2.9%, comprising of 27 families. On the other hand, families with 1 or 2 children have the lowest poverty rate of 0.0%, which includes 0 families.
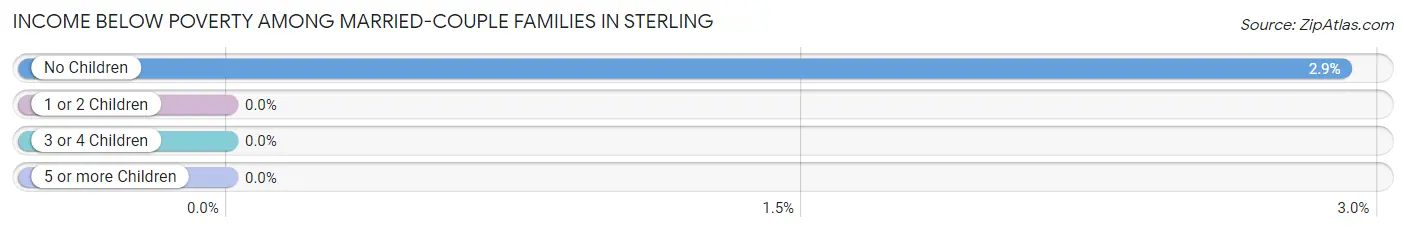
| Children | Above Poverty | Below Poverty |
| No Children | 900 (97.1%) | 27 (2.9%) |
| 1 or 2 Children | 390 (100.0%) | 0 (0.0%) |
| 3 or 4 Children | 65 (100.0%) | 0 (0.0%) |
| 5 or more Children | 0 (0.0%) | 0 (0.0%) |
| Total | 1,355 (98.1%) | 27 (1.9%) |
Income Below Poverty Among Single-Parent Households in Sterling
According to the poverty data in Sterling, 23.3% or 14 single-father households and 24.1% or 35 single-mother households are living below the poverty line. Among single-father households, those with no children have the highest poverty rate, with 14 households (23.3%) experiencing poverty. Likewise, among single-mother households, those with 3 or 4 children have the highest poverty rate, with 35 households (100.0%) falling below the poverty line.
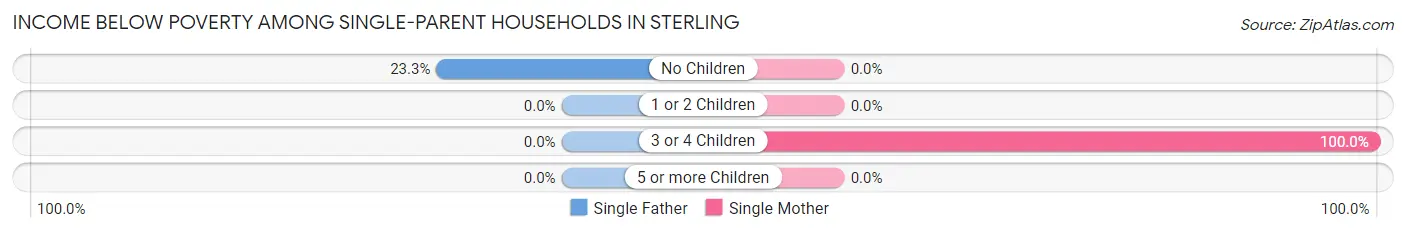
| Children | Single Father | Single Mother |
| No Children | 14 (23.3%) | 0 (0.0%) |
| 1 or 2 Children | 0 (0.0%) | 0 (0.0%) |
| 3 or 4 Children | 0 (0.0%) | 35 (100.0%) |
| 5 or more Children | 0 (0.0%) | 0 (0.0%) |
| Total | 14 (23.3%) | 35 (24.1%) |
Income Below Poverty Among Married-Couple vs Single-Parent Households in Sterling
The poverty data for Sterling shows that 27 of the married-couple family households (1.9%) and 49 of the single-parent households (23.9%) are living below the poverty level. Within the married-couple family households, those with no children have the highest poverty rate, with 27 households (2.9%) falling below the poverty line. Among the single-parent households, those with 3 or 4 children have the highest poverty rate, with 35 household (100.0%) living below poverty.
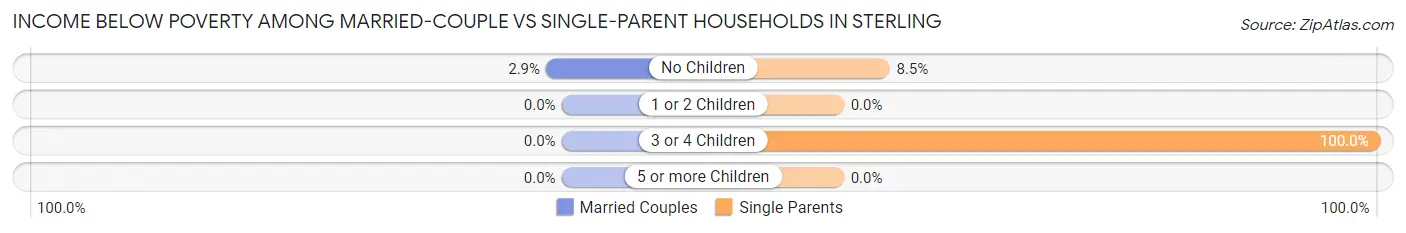
| Children | Married-Couple Families | Single-Parent Households |
| No Children | 27 (2.9%) | 14 (8.5%) |
| 1 or 2 Children | 0 (0.0%) | 0 (0.0%) |
| 3 or 4 Children | 0 (0.0%) | 35 (100.0%) |
| 5 or more Children | 0 (0.0%) | 0 (0.0%) |
| Total | 27 (1.9%) | 49 (23.9%) |
Race in Sterling
The most populous races in Sterling are White / Caucasian (5,674 | 90.0%), Two or more Races (337 | 5.3%), and Native / Alaskan (208 | 3.3%).
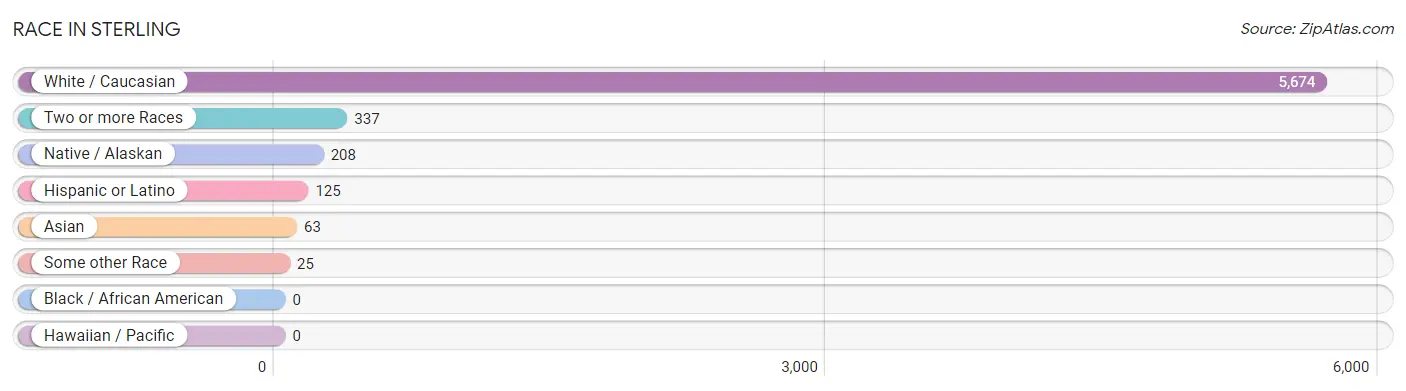
| Race | # Population | % Population |
| Asian | 63 | 1.0% |
| Black / African American | 0 | 0.0% |
| Hawaiian / Pacific | 0 | 0.0% |
| Hispanic or Latino | 125 | 2.0% |
| Native / Alaskan | 208 | 3.3% |
| White / Caucasian | 5,674 | 90.0% |
| Two or more Races | 337 | 5.3% |
| Some other Race | 25 | 0.4% |
| Total | 6,307 | 100.0% |
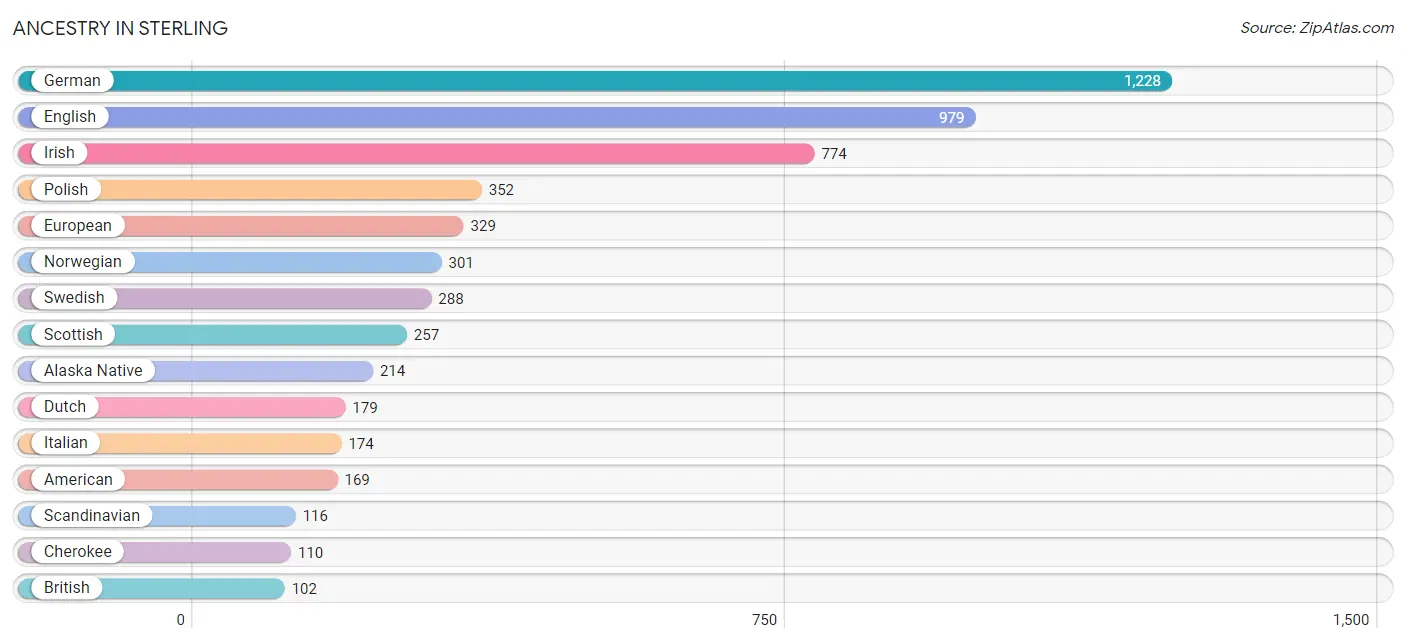
Ancestry in Sterling
The most populous ancestries reported in Sterling are German (1,228 | 19.5%), English (979 | 15.5%), Irish (774 | 12.3%), Polish (352 | 5.6%), and European (329 | 5.2%), together accounting for 58.1% of all Sterling residents.
| Ancestry | # Population | % Population |
| Alaska Native | 214 | 3.4% |
| Alaskan Athabascan | 9 | 0.1% |
| Aleut | 2 | 0.0% |
| American | 169 | 2.7% |
| Arab | 41 | 0.6% |
| British | 102 | 1.6% |
| Canadian | 25 | 0.4% |
| Central American | 29 | 0.5% |
| Cherokee | 110 | 1.7% |
| Czech | 25 | 0.4% |
| Danish | 27 | 0.4% |
| Dutch | 179 | 2.8% |
| English | 979 | 15.5% |
| European | 329 | 5.2% |
| Finnish | 44 | 0.7% |
| French | 61 | 1.0% |
| German | 1,228 | 19.5% |
| Irish | 774 | 12.3% |
| Iroquois | 43 | 0.7% |
| Italian | 174 | 2.8% |
| Korean | 63 | 1.0% |
| Mexican | 54 | 0.9% |
| Moroccan | 41 | 0.6% |
| Norwegian | 301 | 4.8% |
| Panamanian | 29 | 0.5% |
| Polish | 352 | 5.6% |
| Puerto Rican | 29 | 0.5% |
| Russian | 29 | 0.5% |
| Scandinavian | 116 | 1.8% |
| Scotch-Irish | 12 | 0.2% |
| Scottish | 257 | 4.1% |
| Spaniard | 13 | 0.2% |
| Subsaharan African | 19 | 0.3% |
| Swedish | 288 | 4.6% |
| Swiss | 12 | 0.2% |
| Tlingit-Haida | 11 | 0.2% |
| Welsh | 84 | 1.3% |
| Yup'ik | 33 | 0.5% |
| Zimbabwean | 19 | 0.3% | View All 39 Rows |
Immigrants in Sterling
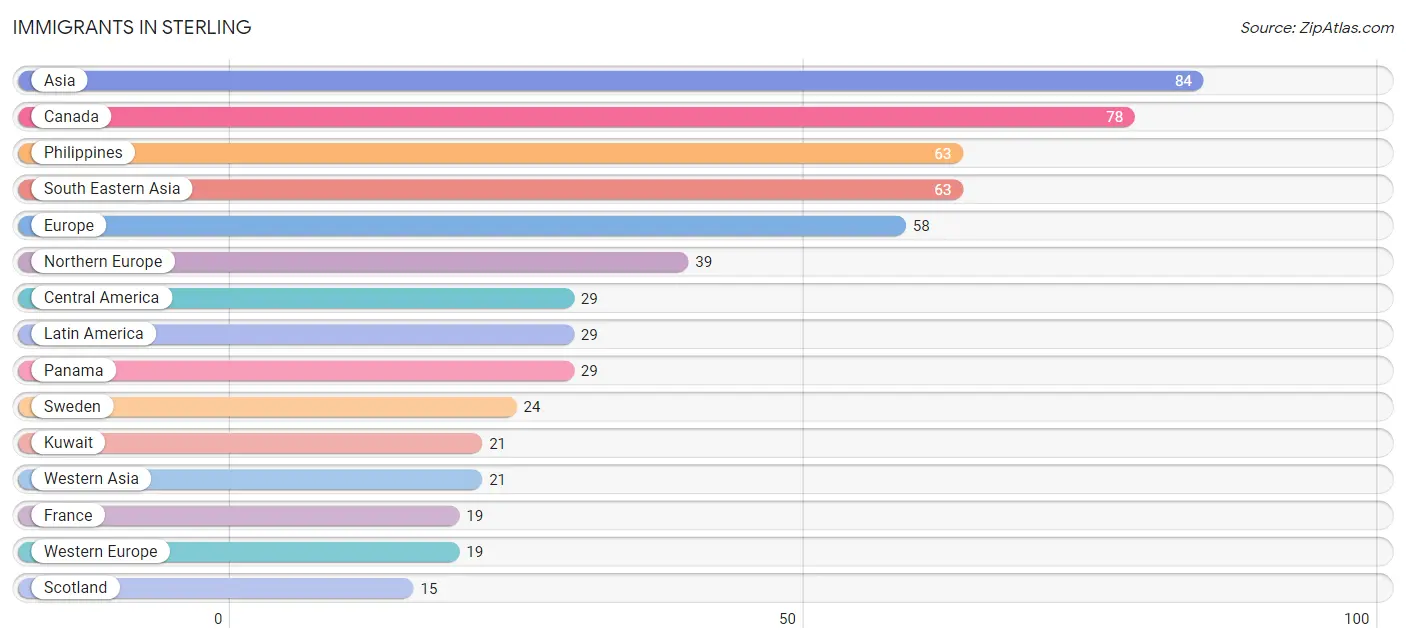
The most numerous immigrant groups reported in Sterling came from Asia (84 | 1.3%), Canada (78 | 1.2%), Philippines (63 | 1.0%), South Eastern Asia (63 | 1.0%), and Europe (58 | 0.9%), together accounting for 5.5% of all Sterling residents.
| Immigration Origin | # Population | % Population |
| Asia | 84 | 1.3% |
| Canada | 78 | 1.2% |
| Central America | 29 | 0.5% |
| Europe | 58 | 0.9% |
| France | 19 | 0.3% |
| Kuwait | 21 | 0.3% |
| Latin America | 29 | 0.5% |
| Northern Europe | 39 | 0.6% |
| Panama | 29 | 0.5% |
| Philippines | 63 | 1.0% |
| Scotland | 15 | 0.2% |
| South Eastern Asia | 63 | 1.0% |
| Sweden | 24 | 0.4% |
| Western Asia | 21 | 0.3% |
| Western Europe | 19 | 0.3% | View All 15 Rows |
Sex and Age in Sterling
Sex and Age in Sterling
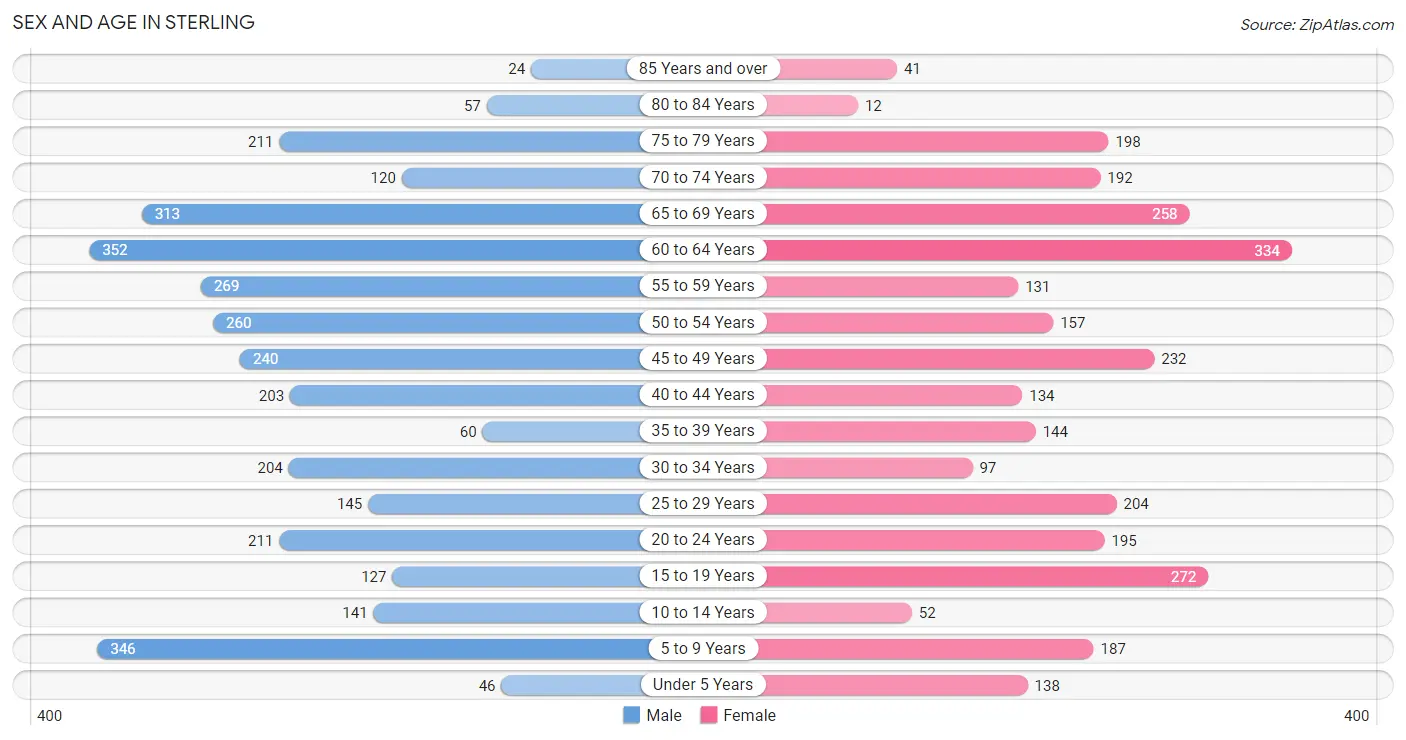
The most populous age groups in Sterling are 60 to 64 Years (352 | 10.6%) for men and 60 to 64 Years (334 | 11.2%) for women.
| Age Bracket | Male | Female |
| Under 5 Years | 46 (1.4%) | 138 (4.6%) |
| 5 to 9 Years | 346 (10.4%) | 187 (6.3%) |
| 10 to 14 Years | 141 (4.2%) | 52 (1.8%) |
| 15 to 19 Years | 127 (3.8%) | 272 (9.1%) |
| 20 to 24 Years | 211 (6.3%) | 195 (6.6%) |
| 25 to 29 Years | 145 (4.4%) | 204 (6.9%) |
| 30 to 34 Years | 204 (6.1%) | 97 (3.3%) |
| 35 to 39 Years | 60 (1.8%) | 144 (4.8%) |
| 40 to 44 Years | 203 (6.1%) | 134 (4.5%) |
| 45 to 49 Years | 240 (7.2%) | 232 (7.8%) |
| 50 to 54 Years | 260 (7.8%) | 157 (5.3%) |
| 55 to 59 Years | 269 (8.1%) | 131 (4.4%) |
| 60 to 64 Years | 352 (10.6%) | 334 (11.2%) |
| 65 to 69 Years | 313 (9.4%) | 258 (8.7%) |
| 70 to 74 Years | 120 (3.6%) | 192 (6.5%) |
| 75 to 79 Years | 211 (6.3%) | 198 (6.7%) |
| 80 to 84 Years | 57 (1.7%) | 12 (0.4%) |
| 85 Years and over | 24 (0.7%) | 41 (1.4%) |
| Total | 3,329 (100.0%) | 2,978 (100.0%) |
Families and Households in Sterling
Median Family Size in Sterling
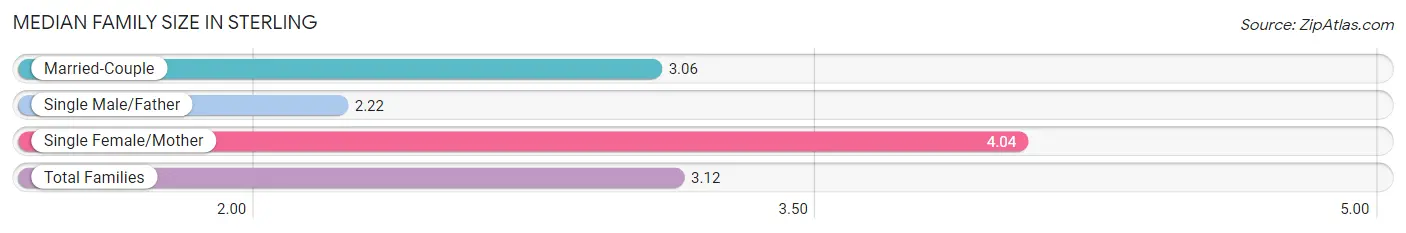
The median family size in Sterling is 3.12 persons per family, with single female/mother families (145 | 9.1%) accounting for the largest median family size of 4.04 persons per family. On the other hand, single male/father families (60 | 3.8%) represent the smallest median family size with 2.22 persons per family.
| Family Type | # Families | Family Size |
| Married-Couple | 1,382 (87.1%) | 3.06 |
| Single Male/Father | 60 (3.8%) | 2.22 |
| Single Female/Mother | 145 (9.1%) | 4.04 |
| Total Families | 1,587 (100.0%) | 3.12 |
Median Household Size in Sterling
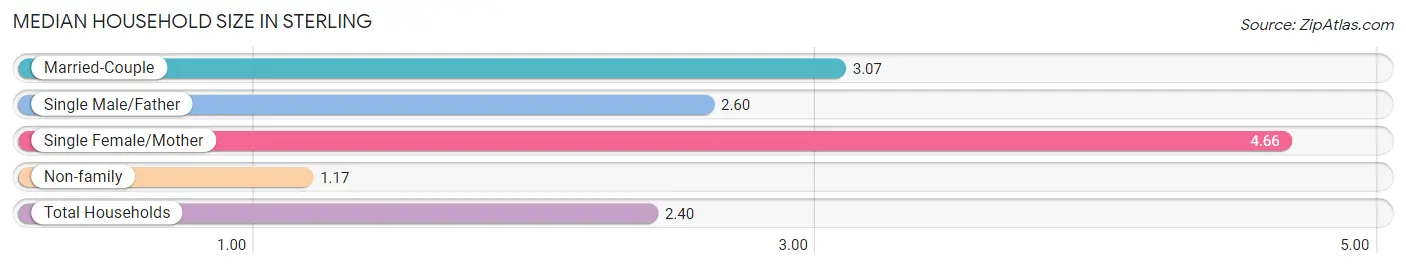
The median household size in Sterling is 2.40 persons per household, with single female/mother households (145 | 5.5%) accounting for the largest median household size of 4.66 persons per household. non-family households (1,035 | 39.5%) represent the smallest median household size with 1.17 persons per household.
| Household Type | # Households | Household Size |
| Married-Couple | 1,382 (52.7%) | 3.07 |
| Single Male/Father | 60 (2.3%) | 2.60 |
| Single Female/Mother | 145 (5.5%) | 4.66 |
| Non-family | 1,035 (39.5%) | 1.17 |
| Total Households | 2,622 (100.0%) | 2.40 |
Household Size by Marriage Status in Sterling
Out of a total of 2,622 households in Sterling, 1,587 (60.5%) are family households, while 1,035 (39.5%) are nonfamily households. The most numerous type of family households are 2-person households, comprising 818, and the most common type of nonfamily households are 1-person households, comprising 906.
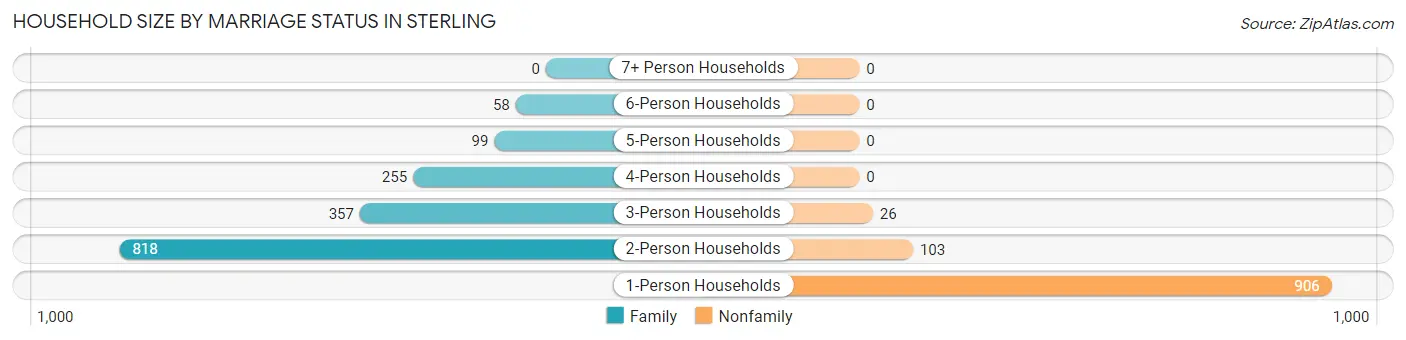
| Household Size | Family Households | Nonfamily Households |
| 1-Person Households | - | 906 (34.5%) |
| 2-Person Households | 818 (31.2%) | 103 (3.9%) |
| 3-Person Households | 357 (13.6%) | 26 (1.0%) |
| 4-Person Households | 255 (9.7%) | 0 (0.0%) |
| 5-Person Households | 99 (3.8%) | 0 (0.0%) |
| 6-Person Households | 58 (2.2%) | 0 (0.0%) |
| 7+ Person Households | 0 (0.0%) | 0 (0.0%) |
| Total | 1,587 (60.5%) | 1,035 (39.5%) |
Female Fertility in Sterling
Fertility by Age in Sterling
Average fertility rate in Sterling is 49.0 births per 1,000 women. Women in the age bracket of 20 to 34 years have the highest fertility rate with 137.0 births per 1,000 women. Women in the age bracket of 20 to 34 years acount for 100.0% of all women with births.
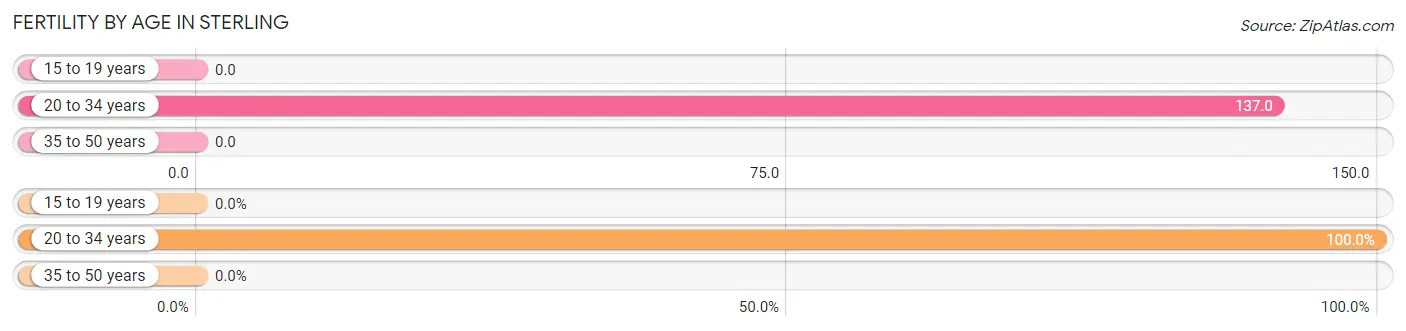
| Age Bracket | Women with Births | Births / 1,000 Women |
| 15 to 19 years | 0 (0.0%) | 0.0 |
| 20 to 34 years | 68 (100.0%) | 137.0 |
| 35 to 50 years | 0 (0.0%) | 0.0 |
| Total | 68 (100.0%) | 49.0 |
Fertility by Age by Marriage Status in Sterling
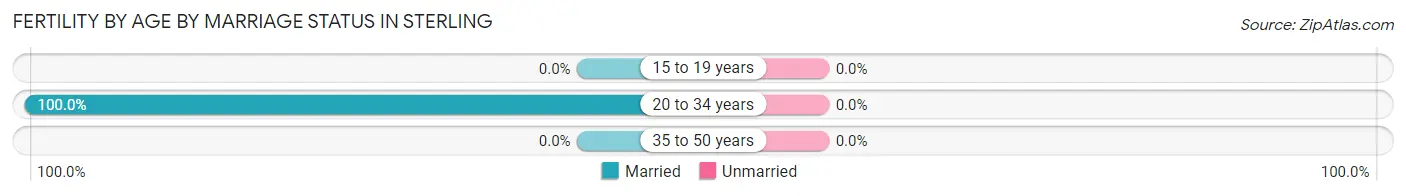
| Age Bracket | Married | Unmarried |
| 15 to 19 years | 0 (0.0%) | 0 (0.0%) |
| 20 to 34 years | 68 (100.0%) | 0 (0.0%) |
| 35 to 50 years | 0 (0.0%) | 0 (0.0%) |
| Total | 68 (100.0%) | 0 (0.0%) |
Fertility by Education in Sterling
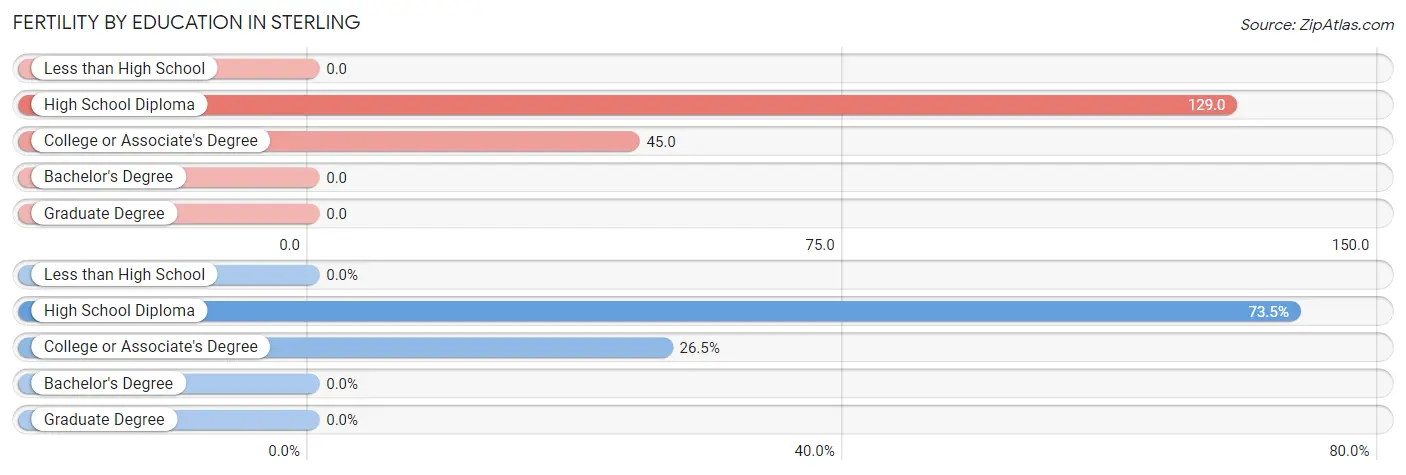
| Educational Attainment | Women with Births | Births / 1,000 Women |
| Less than High School | 0 (0.0%) | 0.0 |
| High School Diploma | 50 (73.5%) | 129.0 |
| College or Associate's Degree | 18 (26.5%) | 45.0 |
| Bachelor's Degree | 0 (0.0%) | 0.0 |
| Graduate Degree | 0 (0.0%) | 0.0 |
| Total | 68 (100.0%) | 49.0 |
Fertility by Education by Marriage Status in Sterling
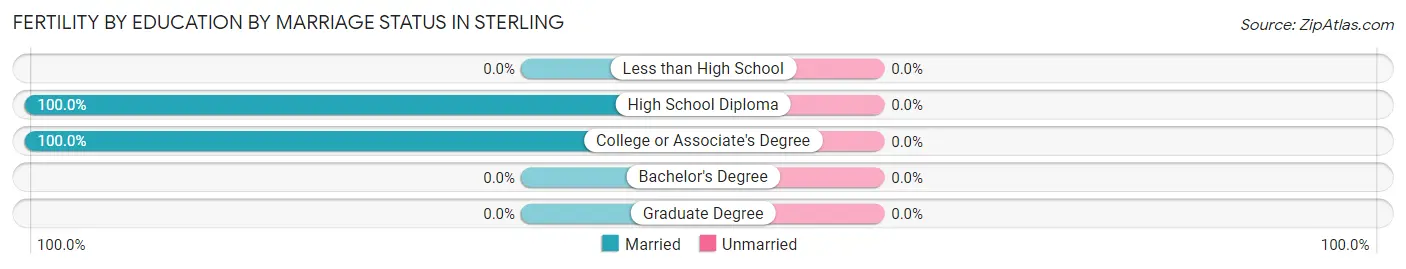
| Educational Attainment | Married | Unmarried |
| Less than High School | 0 (0.0%) | 0 (0.0%) |
| High School Diploma | 50 (100.0%) | 0 (0.0%) |
| College or Associate's Degree | 18 (100.0%) | 0 (0.0%) |
| Bachelor's Degree | 0 (0.0%) | 0 (0.0%) |
| Graduate Degree | 0 (0.0%) | 0 (0.0%) |
| Total | 68 (100.0%) | 0 (0.0%) |
Employment Characteristics in Sterling
Employment by Class of Employer in Sterling
Among the 2,676 employed individuals in Sterling, private company employees (1,451 | 54.2%), not-for-profit organizations (345 | 12.9%), and local government employees (315 | 11.8%) make up the most common classes of employment.
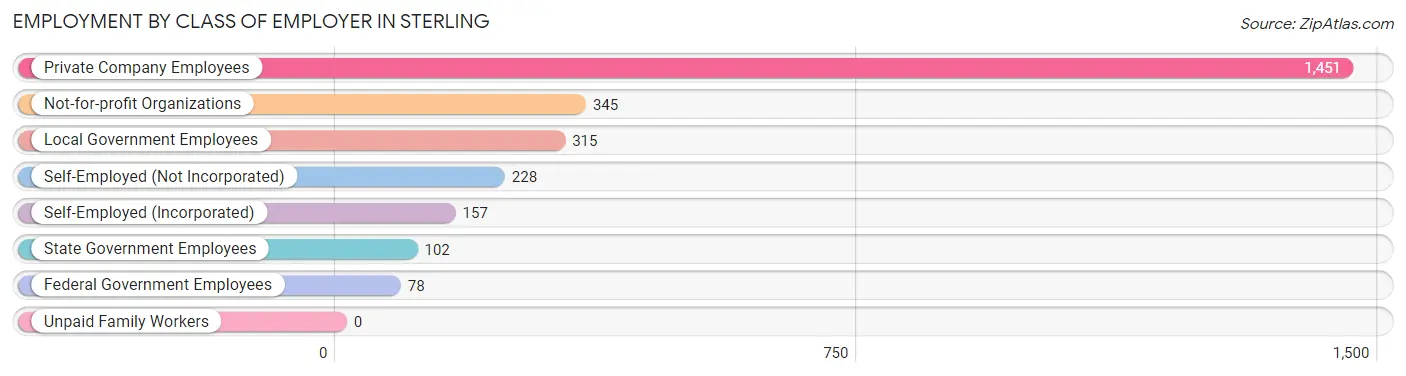
| Employer Class | # Employees | % Employees |
| Private Company Employees | 1,451 | 54.2% |
| Self-Employed (Incorporated) | 157 | 5.9% |
| Self-Employed (Not Incorporated) | 228 | 8.5% |
| Not-for-profit Organizations | 345 | 12.9% |
| Local Government Employees | 315 | 11.8% |
| State Government Employees | 102 | 3.8% |
| Federal Government Employees | 78 | 2.9% |
| Unpaid Family Workers | 0 | 0.0% |
| Total | 2,676 | 100.0% |
Employment Status by Age in Sterling
According to the labor force statistics for Sterling, out of the total population over 16 years of age (5,309), 58.6% or 3,111 individuals are in the labor force, with 10.5% or 327 of them unemployed. The age group with the highest labor force participation rate is 30 to 34 years, with 96.3% or 290 individuals in the labor force. Within the labor force, the 20 to 24 years age range has the highest percentage of unemployed individuals, with 30.4% or 91 of them being unemployed.
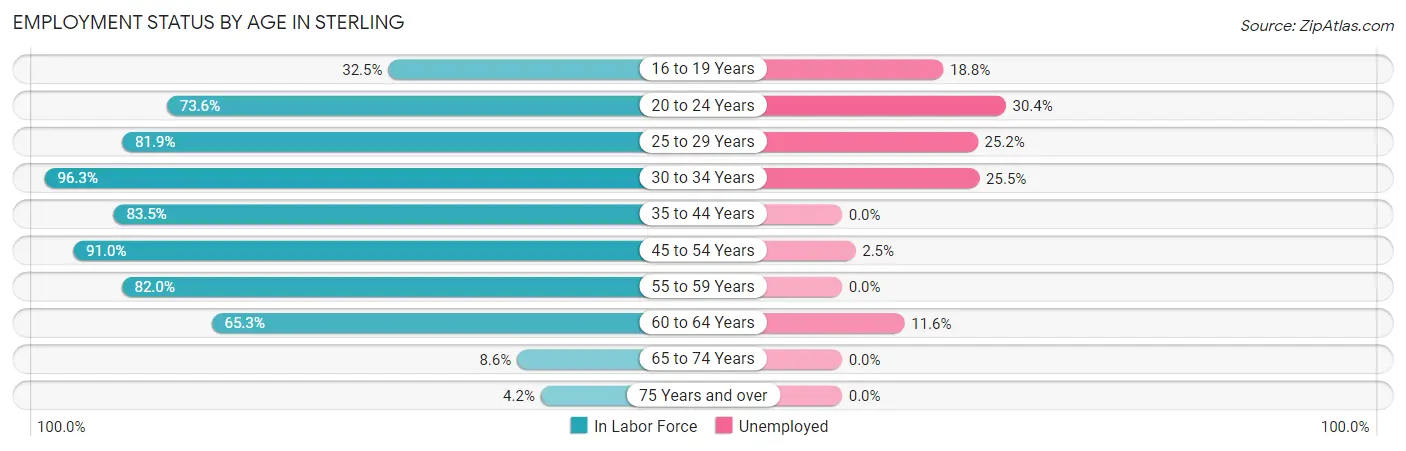
| Age Bracket | In Labor Force | Unemployed |
| 16 to 19 Years | 101 (32.5%) | 19 (18.8%) |
| 20 to 24 Years | 299 (73.6%) | 91 (30.4%) |
| 25 to 29 Years | 286 (81.9%) | 72 (25.2%) |
| 30 to 34 Years | 290 (96.3%) | 74 (25.5%) |
| 35 to 44 Years | 452 (83.5%) | 0 (0.0%) |
| 45 to 54 Years | 809 (91.0%) | 20 (2.5%) |
| 55 to 59 Years | 328 (82.0%) | 0 (0.0%) |
| 60 to 64 Years | 448 (65.3%) | 52 (11.6%) |
| 65 to 74 Years | 76 (8.6%) | 0 (0.0%) |
| 75 Years and over | 23 (4.2%) | 0 (0.0%) |
| Total | 3,111 (58.6%) | 327 (10.5%) |
Employment Status by Educational Attainment in Sterling
According to labor force statistics for Sterling, 82.5% of individuals (2,612) out of the total population between 25 and 64 years of age (3,166) are in the labor force, with 8.3% or 217 of them being unemployed. The group with the highest labor force participation rate are those with the educational attainment of bachelor's degree or higher, with 87.7% or 867 individuals in the labor force. Within the labor force, individuals with college / associate degree education have the highest percentage of unemployment, with 14.2% or 121 of them being unemployed.
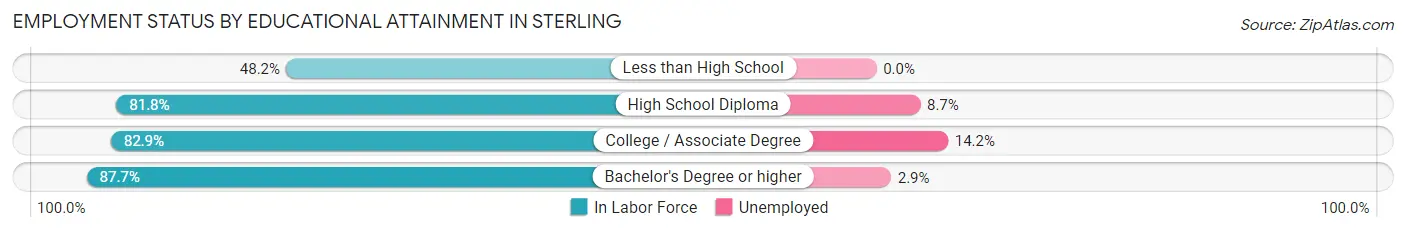
| Educational Attainment | In Labor Force | Unemployed |
| Less than High School | 66 (48.2%) | 0 (0.0%) |
| High School Diploma | 826 (81.8%) | 88 (8.7%) |
| College / Associate Degree | 854 (82.9%) | 146 (14.2%) |
| Bachelor's Degree or higher | 867 (87.7%) | 29 (2.9%) |
| Total | 2,612 (82.5%) | 263 (8.3%) |
Employment Occupations by Sex in Sterling
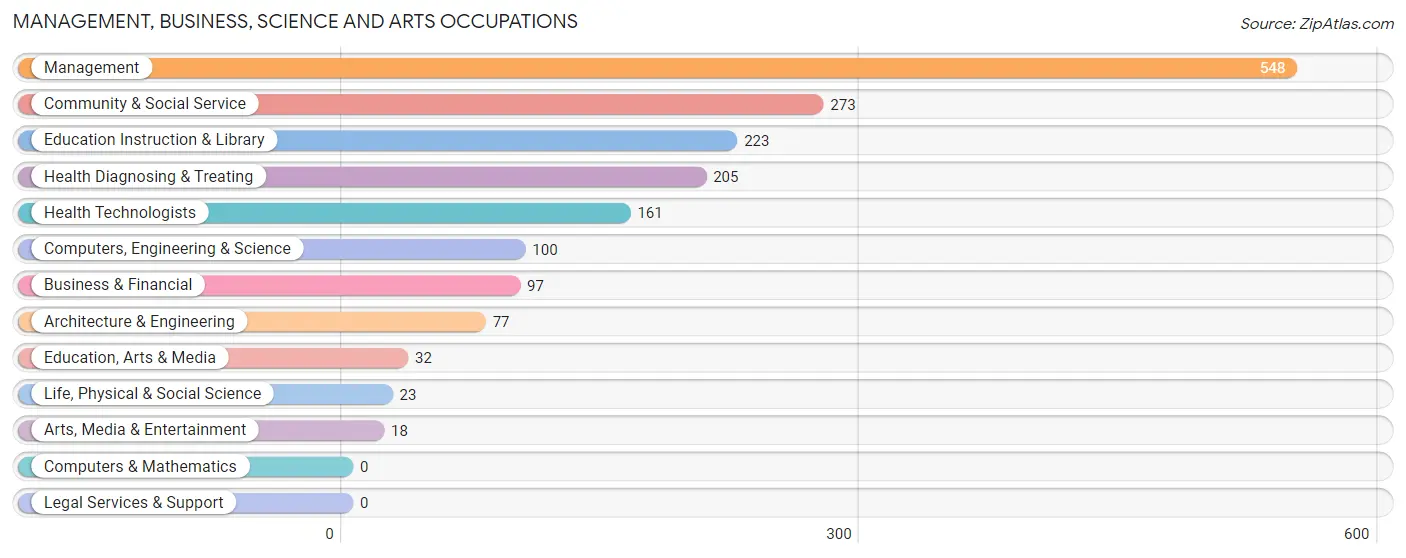
Management, Business, Science and Arts Occupations
The most common Management, Business, Science and Arts occupations in Sterling are Management (548 | 19.7%), Community & Social Service (273 | 9.8%), Education Instruction & Library (223 | 8.0%), Health Diagnosing & Treating (205 | 7.4%), and Health Technologists (161 | 5.8%).
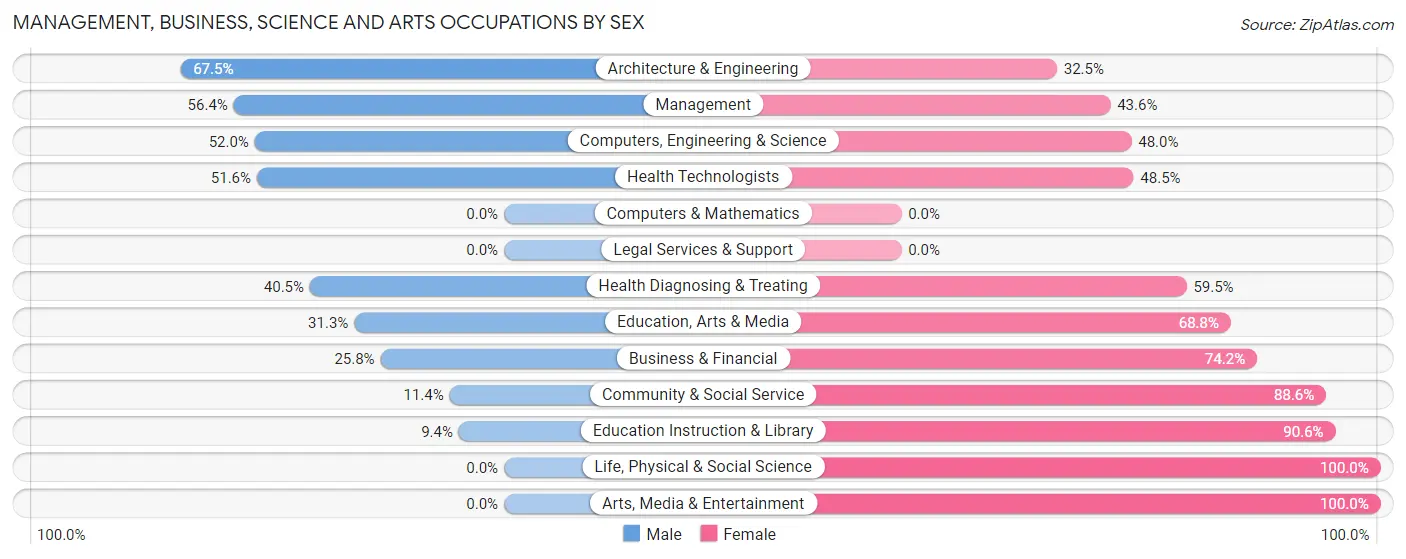
Management, Business, Science and Arts Occupations by Sex
Within the Management, Business, Science and Arts occupations in Sterling, the most male-oriented occupations are Architecture & Engineering (67.5%), Management (56.4%), and Computers, Engineering & Science (52.0%), while the most female-oriented occupations are Life, Physical & Social Science (100.0%), Arts, Media & Entertainment (100.0%), and Education Instruction & Library (90.6%).
| Occupation | Male | Female |
| Management | 309 (56.4%) | 239 (43.6%) |
| Business & Financial | 25 (25.8%) | 72 (74.2%) |
| Computers, Engineering & Science | 52 (52.0%) | 48 (48.0%) |
| Computers & Mathematics | 0 (0.0%) | 0 (0.0%) |
| Architecture & Engineering | 52 (67.5%) | 25 (32.5%) |
| Life, Physical & Social Science | 0 (0.0%) | 23 (100.0%) |
| Community & Social Service | 31 (11.4%) | 242 (88.6%) |
| Education, Arts & Media | 10 (31.2%) | 22 (68.8%) |
| Legal Services & Support | 0 (0.0%) | 0 (0.0%) |
| Education Instruction & Library | 21 (9.4%) | 202 (90.6%) |
| Arts, Media & Entertainment | 0 (0.0%) | 18 (100.0%) |
| Health Diagnosing & Treating | 83 (40.5%) | 122 (59.5%) |
| Health Technologists | 83 (51.5%) | 78 (48.4%) |
| Total (Category) | 500 (40.9%) | 723 (59.1%) |
| Total (Overall) | 1,435 (51.5%) | 1,349 (48.5%) |
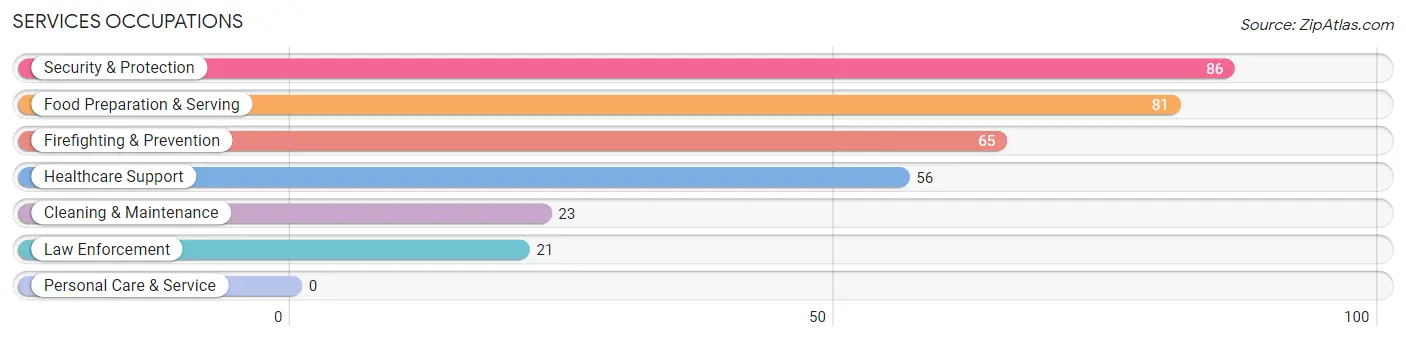
Services Occupations
The most common Services occupations in Sterling are Security & Protection (86 | 3.1%), Food Preparation & Serving (81 | 2.9%), Firefighting & Prevention (65 | 2.3%), Healthcare Support (56 | 2.0%), and Cleaning & Maintenance (23 | 0.8%).
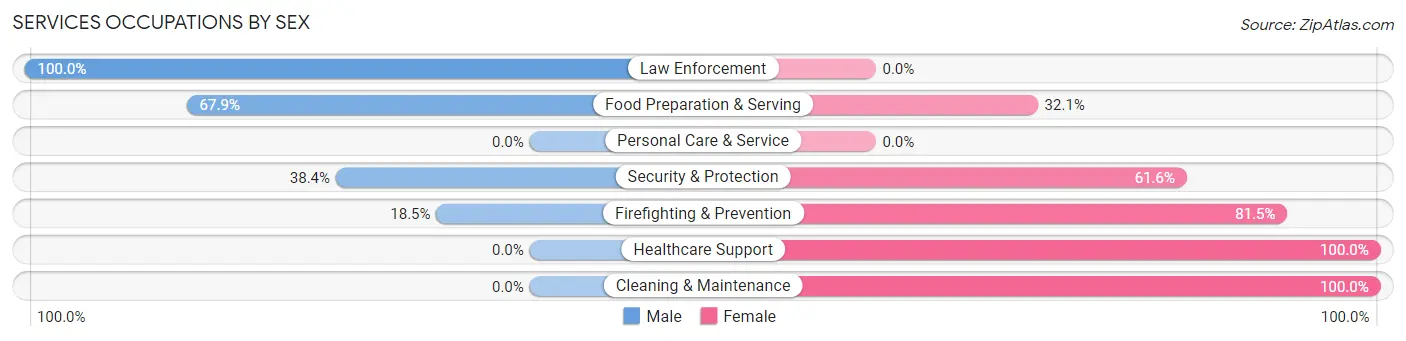
Services Occupations by Sex
Within the Services occupations in Sterling, the most male-oriented occupations are Law Enforcement (100.0%), Food Preparation & Serving (67.9%), and Security & Protection (38.4%), while the most female-oriented occupations are Healthcare Support (100.0%), Cleaning & Maintenance (100.0%), and Firefighting & Prevention (81.5%).
| Occupation | Male | Female |
| Healthcare Support | 0 (0.0%) | 56 (100.0%) |
| Security & Protection | 33 (38.4%) | 53 (61.6%) |
| Firefighting & Prevention | 12 (18.5%) | 53 (81.5%) |
| Law Enforcement | 21 (100.0%) | 0 (0.0%) |
| Food Preparation & Serving | 55 (67.9%) | 26 (32.1%) |
| Cleaning & Maintenance | 0 (0.0%) | 23 (100.0%) |
| Personal Care & Service | 0 (0.0%) | 0 (0.0%) |
| Total (Category) | 88 (35.8%) | 158 (64.2%) |
| Total (Overall) | 1,435 (51.5%) | 1,349 (48.5%) |
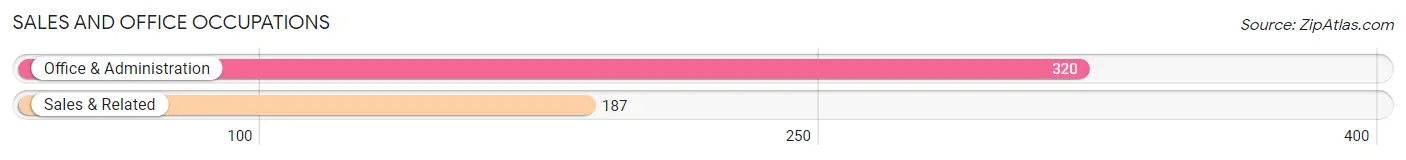
Sales and Office Occupations
The most common Sales and Office occupations in Sterling are Office & Administration (320 | 11.5%), and Sales & Related (187 | 6.7%).
Sales and Office Occupations by Sex
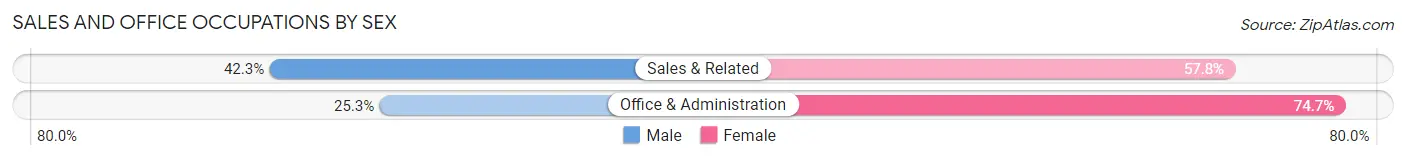
| Occupation | Male | Female |
| Sales & Related | 79 (42.2%) | 108 (57.8%) |
| Office & Administration | 81 (25.3%) | 239 (74.7%) |
| Total (Category) | 160 (31.6%) | 347 (68.4%) |
| Total (Overall) | 1,435 (51.5%) | 1,349 (48.5%) |
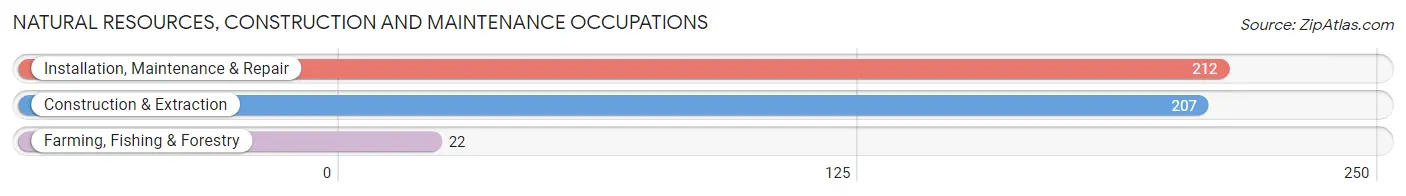
Natural Resources, Construction and Maintenance Occupations
The most common Natural Resources, Construction and Maintenance occupations in Sterling are Installation, Maintenance & Repair (212 | 7.6%), Construction & Extraction (207 | 7.4%), and Farming, Fishing & Forestry (22 | 0.8%).
Natural Resources, Construction and Maintenance Occupations by Sex
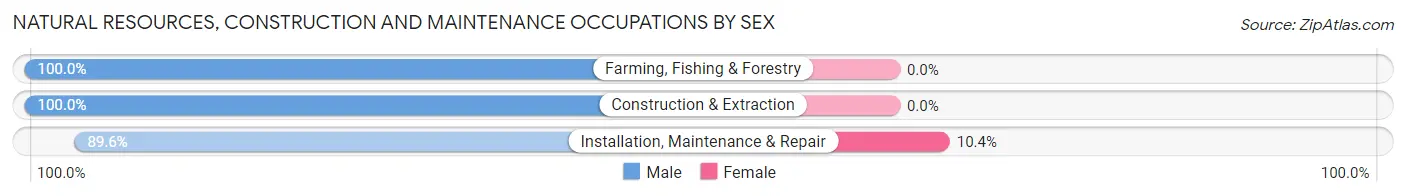
| Occupation | Male | Female |
| Farming, Fishing & Forestry | 22 (100.0%) | 0 (0.0%) |
| Construction & Extraction | 207 (100.0%) | 0 (0.0%) |
| Installation, Maintenance & Repair | 190 (89.6%) | 22 (10.4%) |
| Total (Category) | 419 (95.0%) | 22 (5.0%) |
| Total (Overall) | 1,435 (51.5%) | 1,349 (48.5%) |
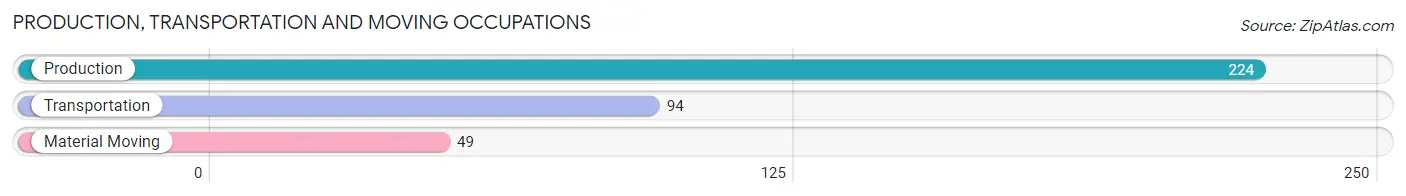
Production, Transportation and Moving Occupations
The most common Production, Transportation and Moving occupations in Sterling are Production (224 | 8.1%), Transportation (94 | 3.4%), and Material Moving (49 | 1.8%).
Production, Transportation and Moving Occupations by Sex
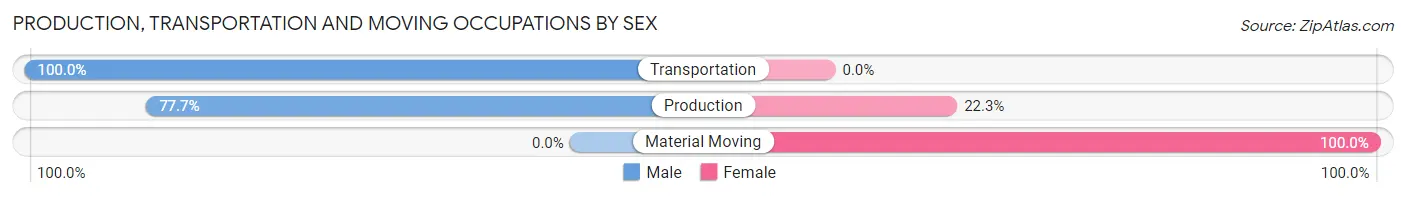
| Occupation | Male | Female |
| Production | 174 (77.7%) | 50 (22.3%) |
| Transportation | 94 (100.0%) | 0 (0.0%) |
| Material Moving | 0 (0.0%) | 49 (100.0%) |
| Total (Category) | 268 (73.0%) | 99 (27.0%) |
| Total (Overall) | 1,435 (51.5%) | 1,349 (48.5%) |
Employment Industries by Sex in Sterling
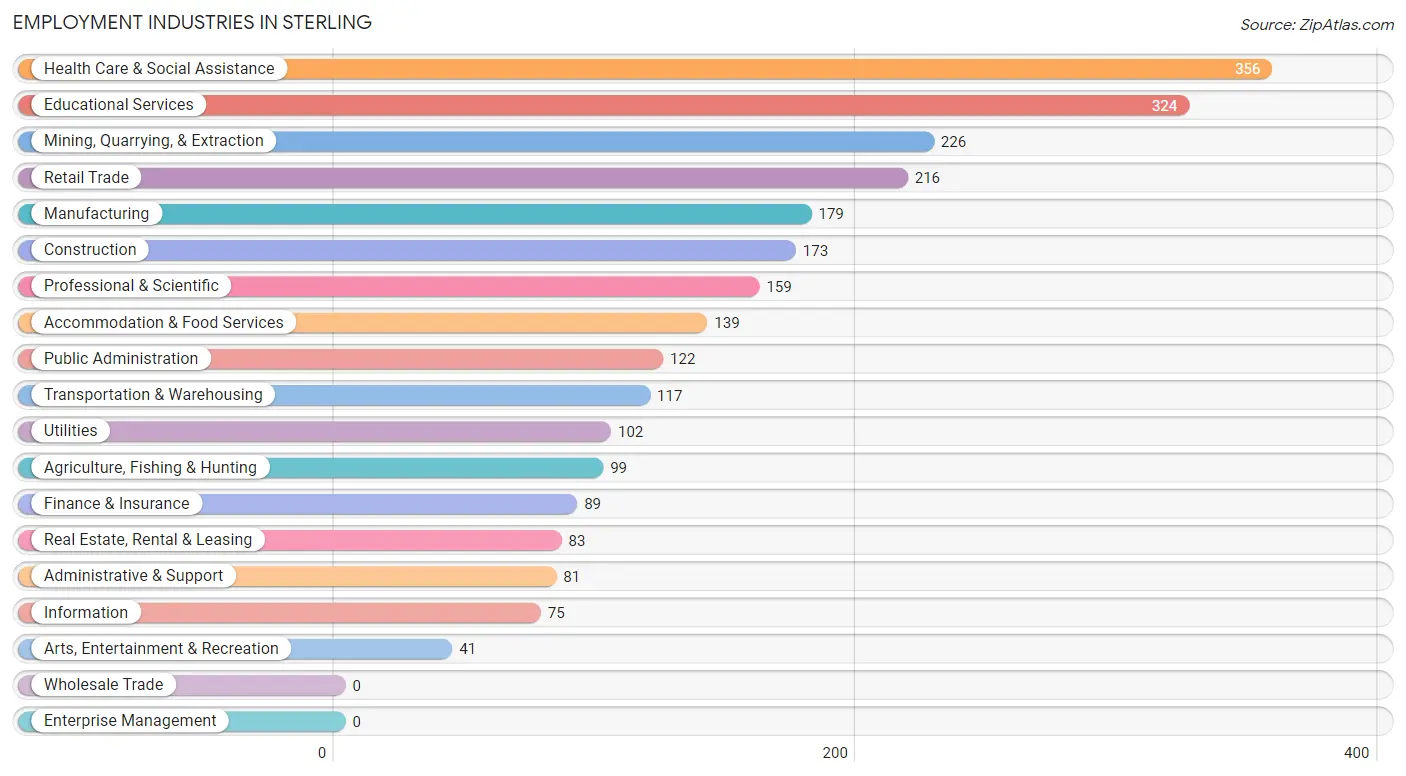
Employment Industries in Sterling
The major employment industries in Sterling include Health Care & Social Assistance (356 | 12.8%), Educational Services (324 | 11.6%), Mining, Quarrying, & Extraction (226 | 8.1%), Retail Trade (216 | 7.8%), and Manufacturing (179 | 6.4%).
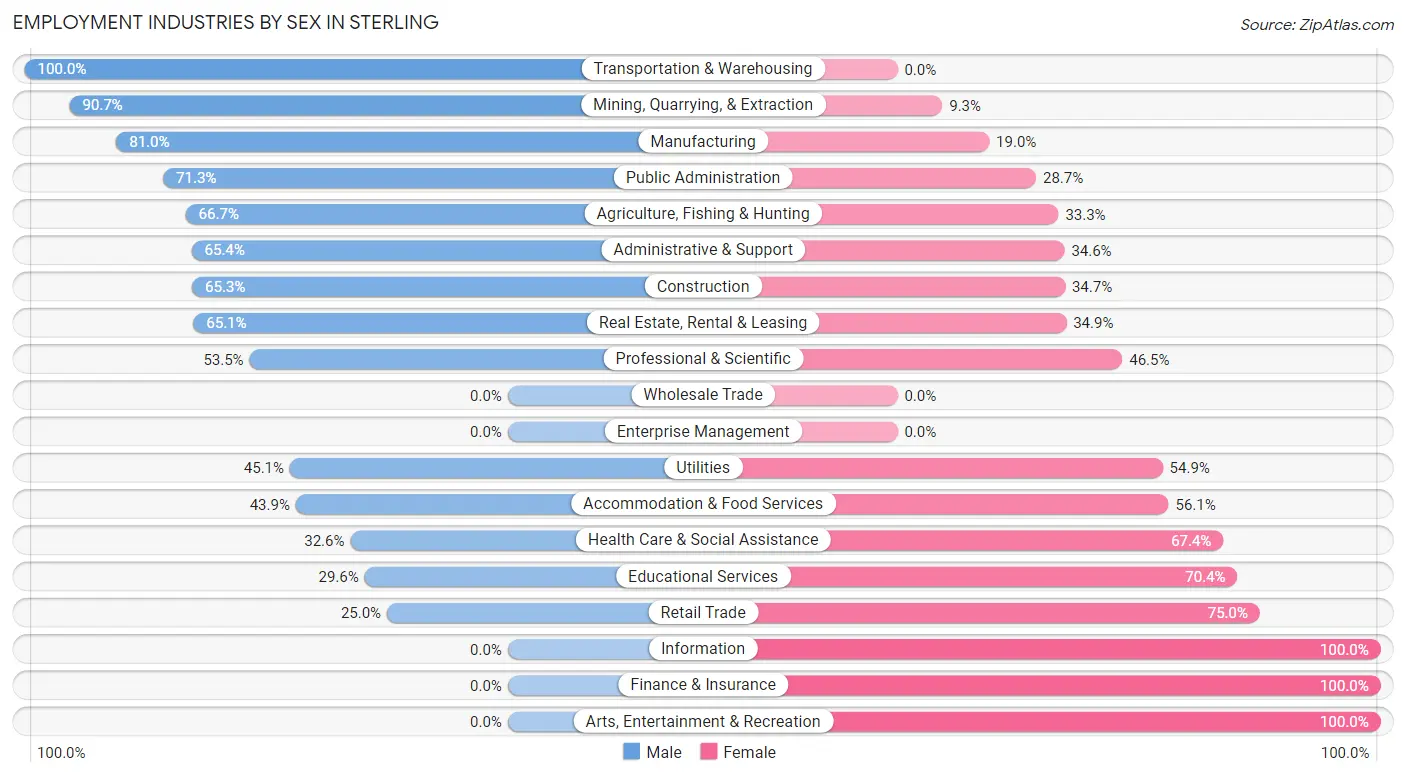
Employment Industries by Sex in Sterling
The Sterling industries that see more men than women are Transportation & Warehousing (100.0%), Mining, Quarrying, & Extraction (90.7%), and Manufacturing (81.0%), whereas the industries that tend to have a higher number of women are Information (100.0%), Finance & Insurance (100.0%), and Arts, Entertainment & Recreation (100.0%).
| Industry | Male | Female |
| Agriculture, Fishing & Hunting | 66 (66.7%) | 33 (33.3%) |
| Mining, Quarrying, & Extraction | 205 (90.7%) | 21 (9.3%) |
| Construction | 113 (65.3%) | 60 (34.7%) |
| Manufacturing | 145 (81.0%) | 34 (19.0%) |
| Wholesale Trade | 0 (0.0%) | 0 (0.0%) |
| Retail Trade | 54 (25.0%) | 162 (75.0%) |
| Transportation & Warehousing | 117 (100.0%) | 0 (0.0%) |
| Utilities | 46 (45.1%) | 56 (54.9%) |
| Information | 0 (0.0%) | 75 (100.0%) |
| Finance & Insurance | 0 (0.0%) | 89 (100.0%) |
| Real Estate, Rental & Leasing | 54 (65.1%) | 29 (34.9%) |
| Professional & Scientific | 85 (53.5%) | 74 (46.5%) |
| Enterprise Management | 0 (0.0%) | 0 (0.0%) |
| Administrative & Support | 53 (65.4%) | 28 (34.6%) |
| Educational Services | 96 (29.6%) | 228 (70.4%) |
| Health Care & Social Assistance | 116 (32.6%) | 240 (67.4%) |
| Arts, Entertainment & Recreation | 0 (0.0%) | 41 (100.0%) |
| Accommodation & Food Services | 61 (43.9%) | 78 (56.1%) |
| Public Administration | 87 (71.3%) | 35 (28.7%) |
| Total | 1,435 (51.5%) | 1,349 (48.5%) |
Education in Sterling
School Enrollment in Sterling
The most common levels of schooling among the 1,339 students in Sterling are elementary school (466 | 34.8%), high school (296 | 22.1%), and college / undergraduate (233 | 17.4%).
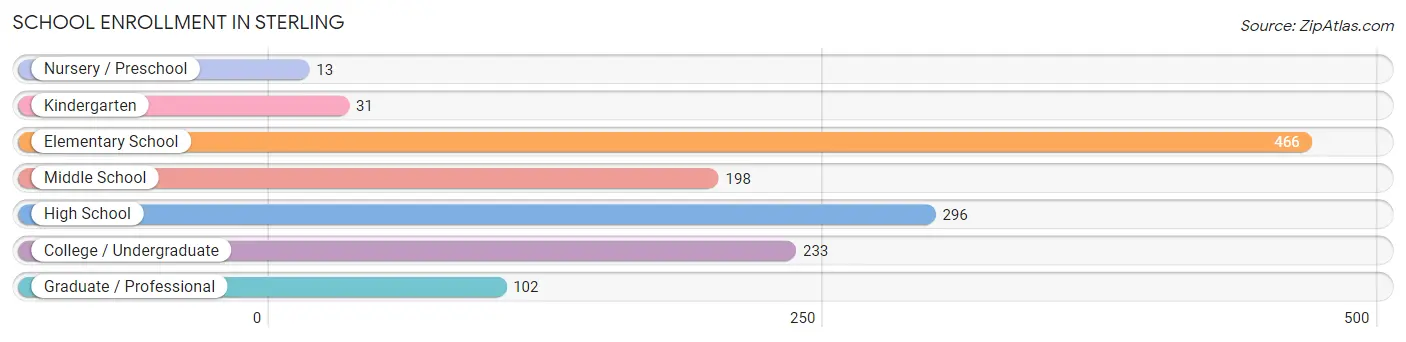
| School Level | # Students | % Students |
| Nursery / Preschool | 13 | 1.0% |
| Kindergarten | 31 | 2.3% |
| Elementary School | 466 | 34.8% |
| Middle School | 198 | 14.8% |
| High School | 296 | 22.1% |
| College / Undergraduate | 233 | 17.4% |
| Graduate / Professional | 102 | 7.6% |
| Total | 1,339 | 100.0% |
School Enrollment by Age by Funding Source in Sterling
Out of a total of 1,339 students who are enrolled in schools in Sterling, 348 (26.0%) attend a private institution, while the remaining 991 (74.0%) are enrolled in public schools. The age group of 3 to 4 year olds has the highest likelihood of being enrolled in private schools, with 13 (100.0% in the age bracket) enrolled. Conversely, the age group of 18 to 19 year olds has the lowest likelihood of being enrolled in a private school, with 120 (100.0% in the age bracket) attending a public institution.
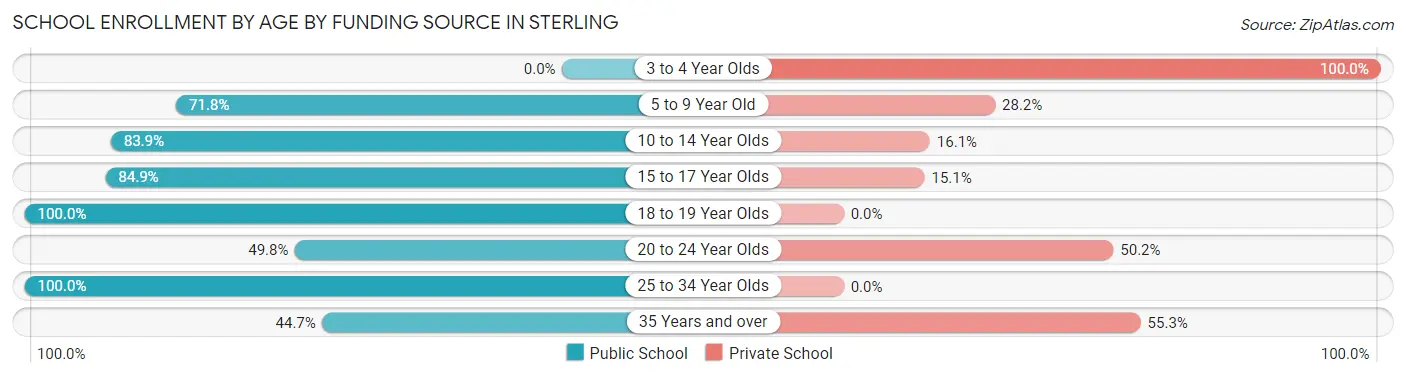
| Age Bracket | Public School | Private School |
| 3 to 4 Year Olds | 0 (0.0%) | 13 (100.0%) |
| 5 to 9 Year Old | 336 (71.8%) | 132 (28.2%) |
| 10 to 14 Year Olds | 162 (83.9%) | 31 (16.1%) |
| 15 to 17 Year Olds | 220 (84.9%) | 39 (15.1%) |
| 18 to 19 Year Olds | 120 (100.0%) | 0 (0.0%) |
| 20 to 24 Year Olds | 106 (49.8%) | 107 (50.2%) |
| 25 to 34 Year Olds | 26 (100.0%) | 0 (0.0%) |
| 35 Years and over | 21 (44.7%) | 26 (55.3%) |
| Total | 991 (74.0%) | 348 (26.0%) |
Educational Attainment by Field of Study in Sterling
Education (392 | 27.1%), business (199 | 13.7%), bio, nature & agricultural (186 | 12.8%), arts & humanities (141 | 9.7%), and liberal arts & history (127 | 8.8%) are the most common fields of study among 1,449 individuals in Sterling who have obtained a bachelor's degree or higher.
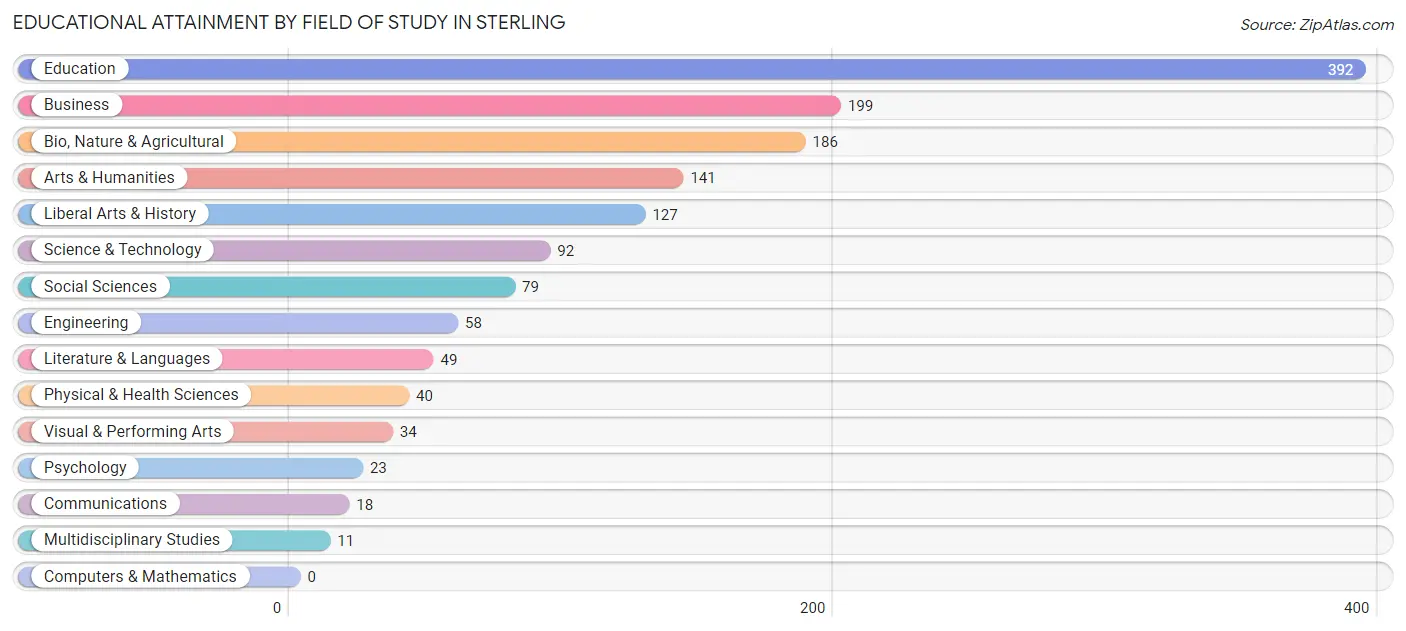
| Field of Study | # Graduates | % Graduates |
| Computers & Mathematics | 0 | 0.0% |
| Bio, Nature & Agricultural | 186 | 12.8% |
| Physical & Health Sciences | 40 | 2.8% |
| Psychology | 23 | 1.6% |
| Social Sciences | 79 | 5.4% |
| Engineering | 58 | 4.0% |
| Multidisciplinary Studies | 11 | 0.8% |
| Science & Technology | 92 | 6.4% |
| Business | 199 | 13.7% |
| Education | 392 | 27.1% |
| Literature & Languages | 49 | 3.4% |
| Liberal Arts & History | 127 | 8.8% |
| Visual & Performing Arts | 34 | 2.4% |
| Communications | 18 | 1.2% |
| Arts & Humanities | 141 | 9.7% |
| Total | 1,449 | 100.0% |
Transportation & Commute in Sterling
Vehicle Availability by Sex in Sterling
The most prevalent vehicle ownership categories in Sterling are males with 2 vehicles (511, accounting for 36.9%) and females with 2 vehicles (426, making up 39.6%).
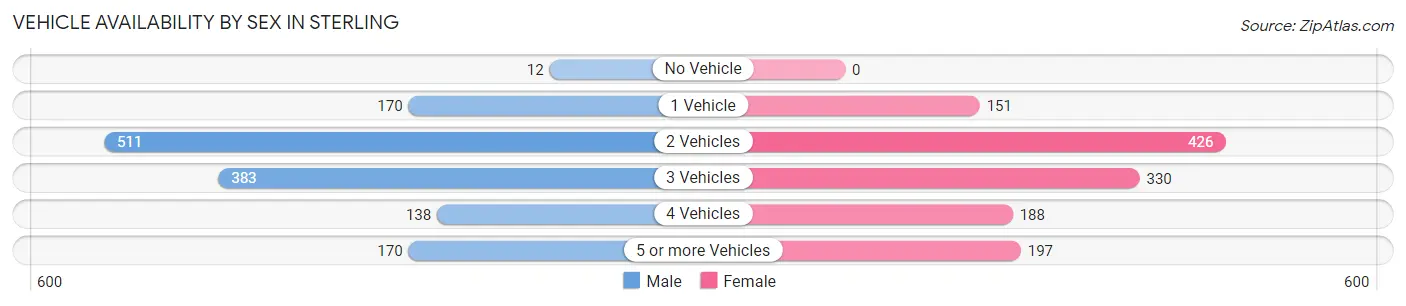
| Vehicles Available | Male | Female |
| No Vehicle | 12 (0.9%) | 0 (0.0%) |
| 1 Vehicle | 170 (12.3%) | 151 (11.7%) |
| 2 Vehicles | 511 (36.9%) | 426 (33.0%) |
| 3 Vehicles | 383 (27.7%) | 330 (25.5%) |
| 4 Vehicles | 138 (10.0%) | 188 (14.5%) |
| 5 or more Vehicles | 170 (12.3%) | 197 (15.2%) |
| Total | 1,384 (100.0%) | 1,292 (100.0%) |
Commute Time in Sterling
The most frequently occuring commute durations in Sterling are 30 to 34 minutes (370 commuters, 16.1%), 15 to 19 minutes (368 commuters, 16.0%), and 10 to 14 minutes (320 commuters, 13.9%).
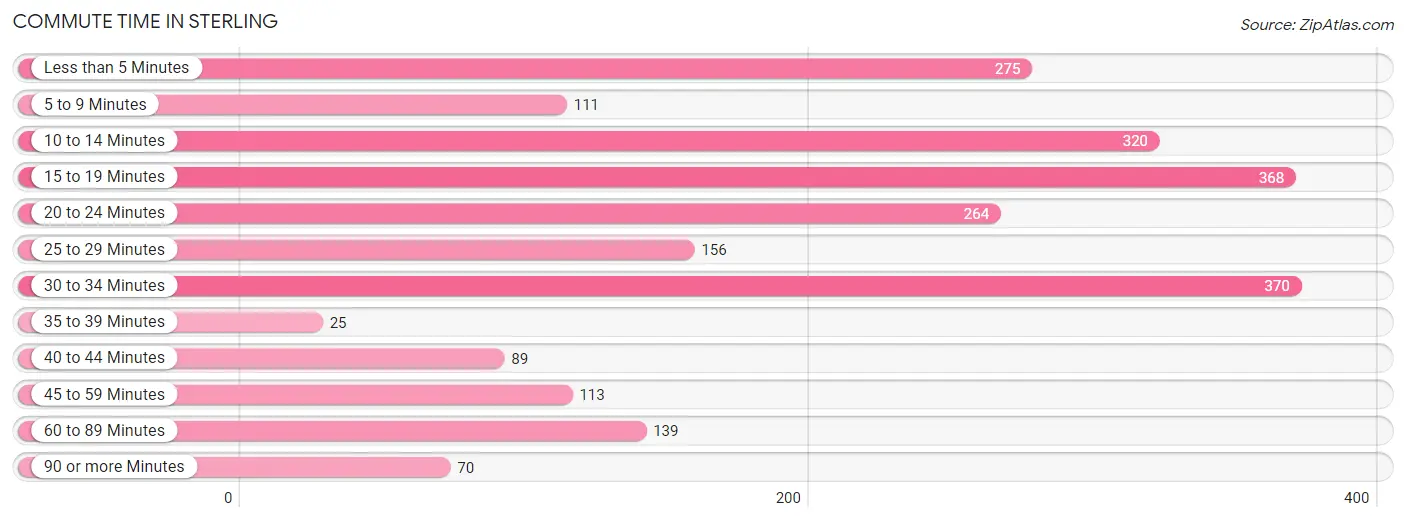
| Commute Time | # Commuters | % Commuters |
| Less than 5 Minutes | 275 | 12.0% |
| 5 to 9 Minutes | 111 | 4.8% |
| 10 to 14 Minutes | 320 | 13.9% |
| 15 to 19 Minutes | 368 | 16.0% |
| 20 to 24 Minutes | 264 | 11.5% |
| 25 to 29 Minutes | 156 | 6.8% |
| 30 to 34 Minutes | 370 | 16.1% |
| 35 to 39 Minutes | 25 | 1.1% |
| 40 to 44 Minutes | 89 | 3.9% |
| 45 to 59 Minutes | 113 | 4.9% |
| 60 to 89 Minutes | 139 | 6.0% |
| 90 or more Minutes | 70 | 3.0% |
Commute Time by Sex in Sterling
The most common commute times in Sterling are less than 5 minutes (204 commuters, 16.7%) for males and 10 to 14 minutes (237 commuters, 22.0%) for females.
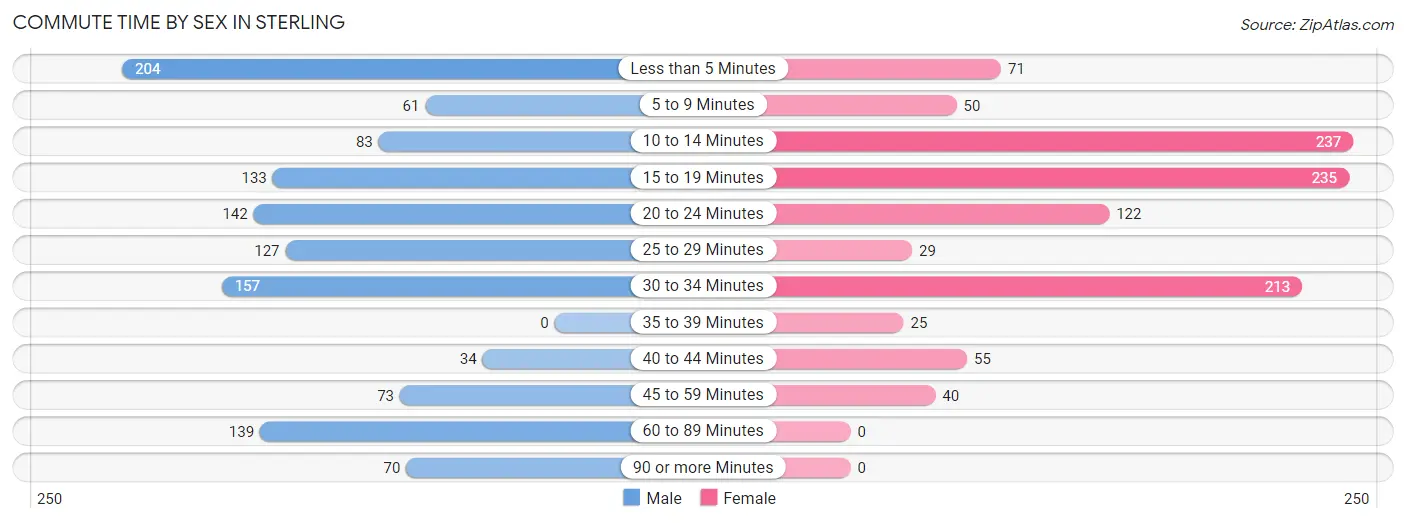
| Commute Time | Male | Female |
| Less than 5 Minutes | 204 (16.7%) | 71 (6.6%) |
| 5 to 9 Minutes | 61 (5.0%) | 50 (4.6%) |
| 10 to 14 Minutes | 83 (6.8%) | 237 (22.0%) |
| 15 to 19 Minutes | 133 (10.9%) | 235 (21.8%) |
| 20 to 24 Minutes | 142 (11.6%) | 122 (11.3%) |
| 25 to 29 Minutes | 127 (10.4%) | 29 (2.7%) |
| 30 to 34 Minutes | 157 (12.8%) | 213 (19.8%) |
| 35 to 39 Minutes | 0 (0.0%) | 25 (2.3%) |
| 40 to 44 Minutes | 34 (2.8%) | 55 (5.1%) |
| 45 to 59 Minutes | 73 (6.0%) | 40 (3.7%) |
| 60 to 89 Minutes | 139 (11.4%) | 0 (0.0%) |
| 90 or more Minutes | 70 (5.7%) | 0 (0.0%) |
Time of Departure to Work by Sex in Sterling
The most frequent times of departure to work in Sterling are 7:00 AM to 7:29 AM (199, 16.3%) for males and 7:00 AM to 7:29 AM (322, 29.9%) for females.
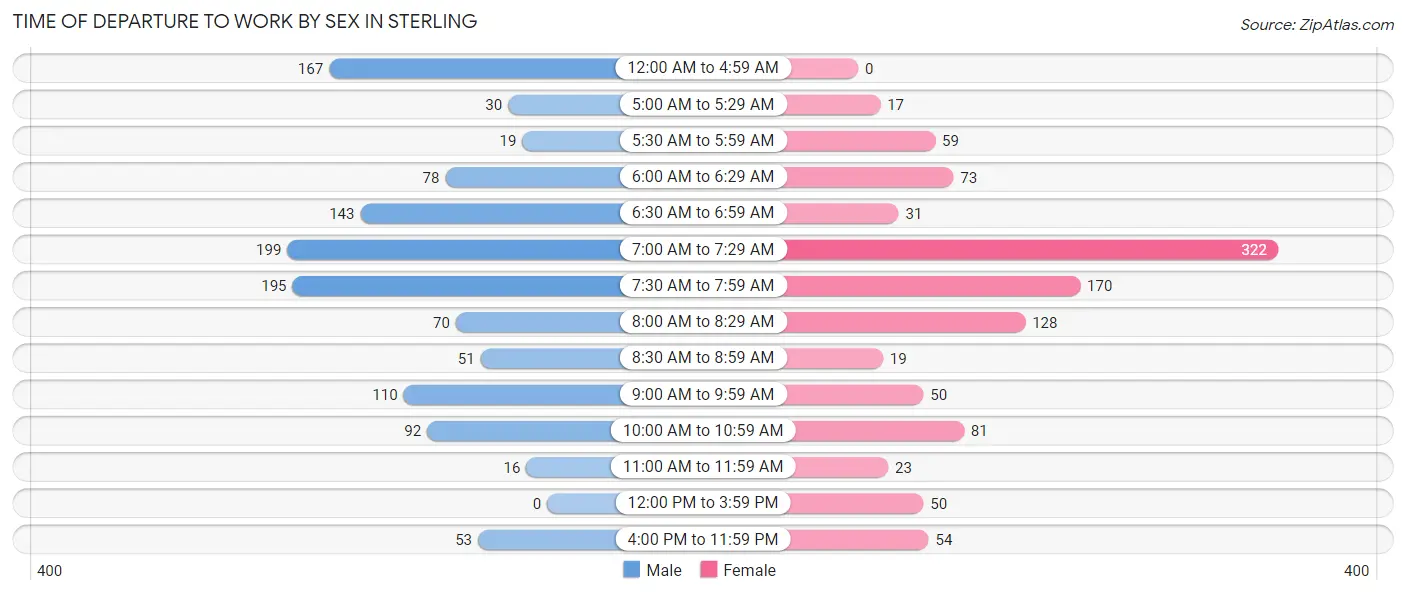
| Time of Departure | Male | Female |
| 12:00 AM to 4:59 AM | 167 (13.7%) | 0 (0.0%) |
| 5:00 AM to 5:29 AM | 30 (2.5%) | 17 (1.6%) |
| 5:30 AM to 5:59 AM | 19 (1.5%) | 59 (5.5%) |
| 6:00 AM to 6:29 AM | 78 (6.4%) | 73 (6.8%) |
| 6:30 AM to 6:59 AM | 143 (11.7%) | 31 (2.9%) |
| 7:00 AM to 7:29 AM | 199 (16.3%) | 322 (29.9%) |
| 7:30 AM to 7:59 AM | 195 (15.9%) | 170 (15.8%) |
| 8:00 AM to 8:29 AM | 70 (5.7%) | 128 (11.9%) |
| 8:30 AM to 8:59 AM | 51 (4.2%) | 19 (1.8%) |
| 9:00 AM to 9:59 AM | 110 (9.0%) | 50 (4.6%) |
| 10:00 AM to 10:59 AM | 92 (7.5%) | 81 (7.5%) |
| 11:00 AM to 11:59 AM | 16 (1.3%) | 23 (2.1%) |
| 12:00 PM to 3:59 PM | 0 (0.0%) | 50 (4.6%) |
| 4:00 PM to 11:59 PM | 53 (4.3%) | 54 (5.0%) |
| Total | 1,223 (100.0%) | 1,077 (100.0%) |
Housing Occupancy in Sterling
Occupancy by Ownership in Sterling
Of the total 2,622 dwellings in Sterling, owner-occupied units account for 2,295 (87.5%), while renter-occupied units make up 327 (12.5%).
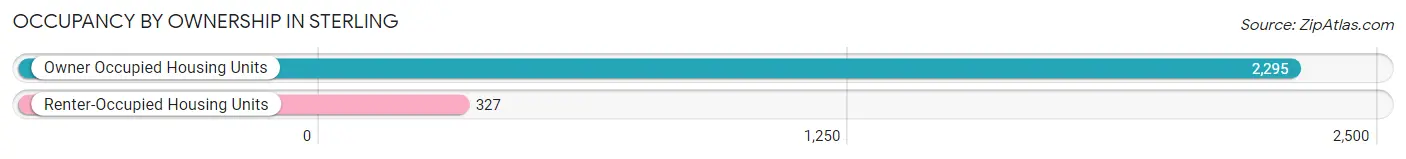
| Occupancy | # Housing Units | % Housing Units |
| Owner Occupied Housing Units | 2,295 | 87.5% |
| Renter-Occupied Housing Units | 327 | 12.5% |
| Total Occupied Housing Units | 2,622 | 100.0% |
Occupancy by Household Size in Sterling
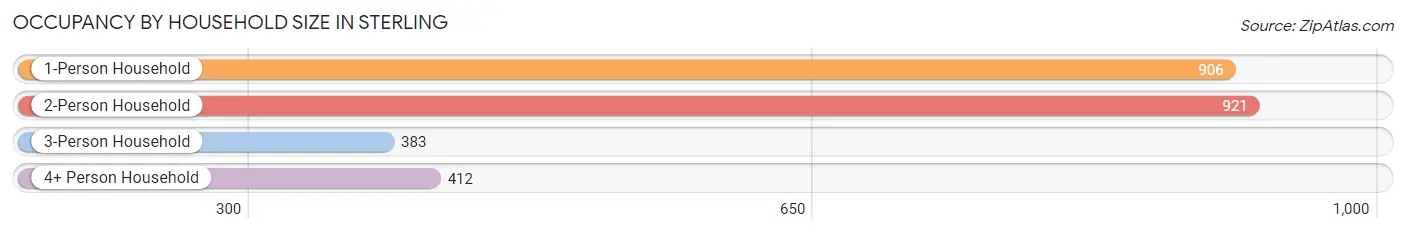
| Household Size | # Housing Units | % Housing Units |
| 1-Person Household | 906 | 34.5% |
| 2-Person Household | 921 | 35.1% |
| 3-Person Household | 383 | 14.6% |
| 4+ Person Household | 412 | 15.7% |
| Total Housing Units | 2,622 | 100.0% |
Occupancy by Ownership by Household Size in Sterling
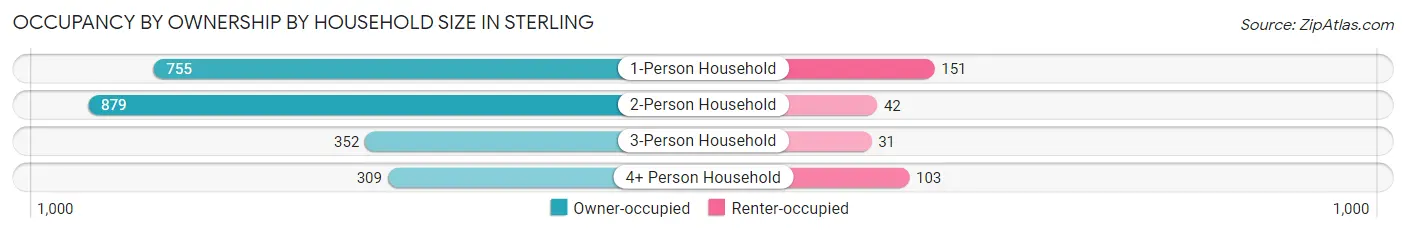
| Household Size | Owner-occupied | Renter-occupied |
| 1-Person Household | 755 (83.3%) | 151 (16.7%) |
| 2-Person Household | 879 (95.4%) | 42 (4.6%) |
| 3-Person Household | 352 (91.9%) | 31 (8.1%) |
| 4+ Person Household | 309 (75.0%) | 103 (25.0%) |
| Total Housing Units | 2,295 (87.5%) | 327 (12.5%) |
Occupancy by Educational Attainment in Sterling
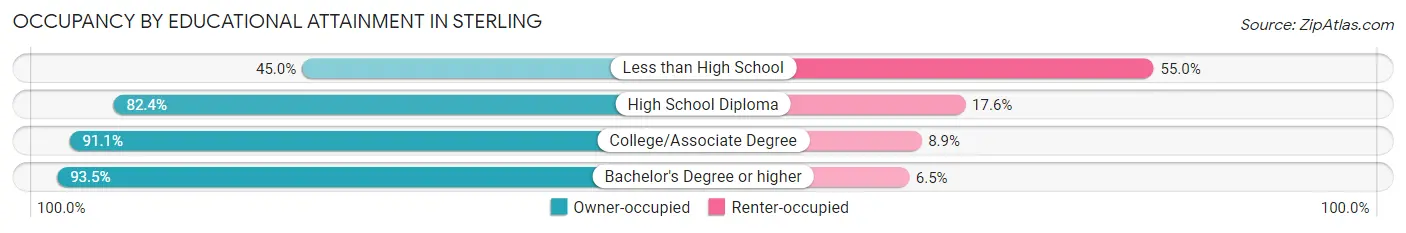
| Household Size | Owner-occupied | Renter-occupied |
| Less than High School | 45 (45.0%) | 55 (55.0%) |
| High School Diploma | 635 (82.4%) | 136 (17.6%) |
| College/Associate Degree | 836 (91.1%) | 82 (8.9%) |
| Bachelor's Degree or higher | 779 (93.5%) | 54 (6.5%) |
Occupancy by Age of Householder in Sterling
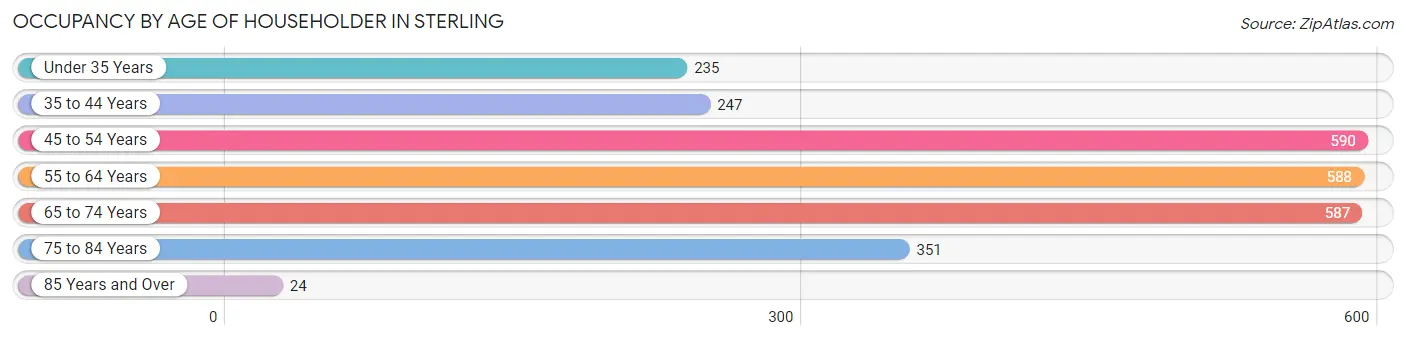
| Age Bracket | # Households | % Households |
| Under 35 Years | 235 | 9.0% |
| 35 to 44 Years | 247 | 9.4% |
| 45 to 54 Years | 590 | 22.5% |
| 55 to 64 Years | 588 | 22.4% |
| 65 to 74 Years | 587 | 22.4% |
| 75 to 84 Years | 351 | 13.4% |
| 85 Years and Over | 24 | 0.9% |
| Total | 2,622 | 100.0% |
Housing Finances in Sterling
Median Income by Occupancy in Sterling
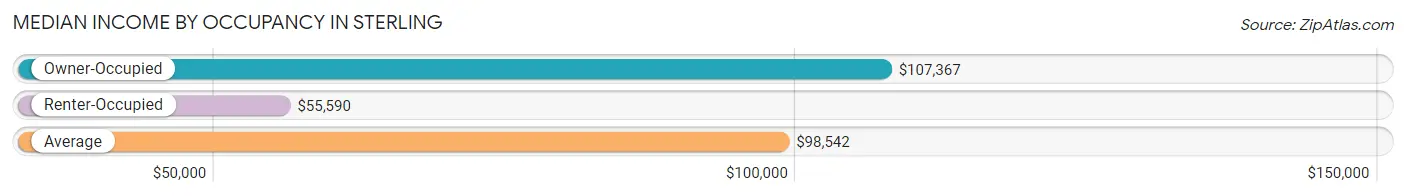
| Occupancy Type | # Households | Median Income |
| Owner-Occupied | 2,295 (87.5%) | $107,367 |
| Renter-Occupied | 327 (12.5%) | $55,590 |
| Average | 2,622 (100.0%) | $98,542 |
Occupancy by Householder Income Bracket in Sterling
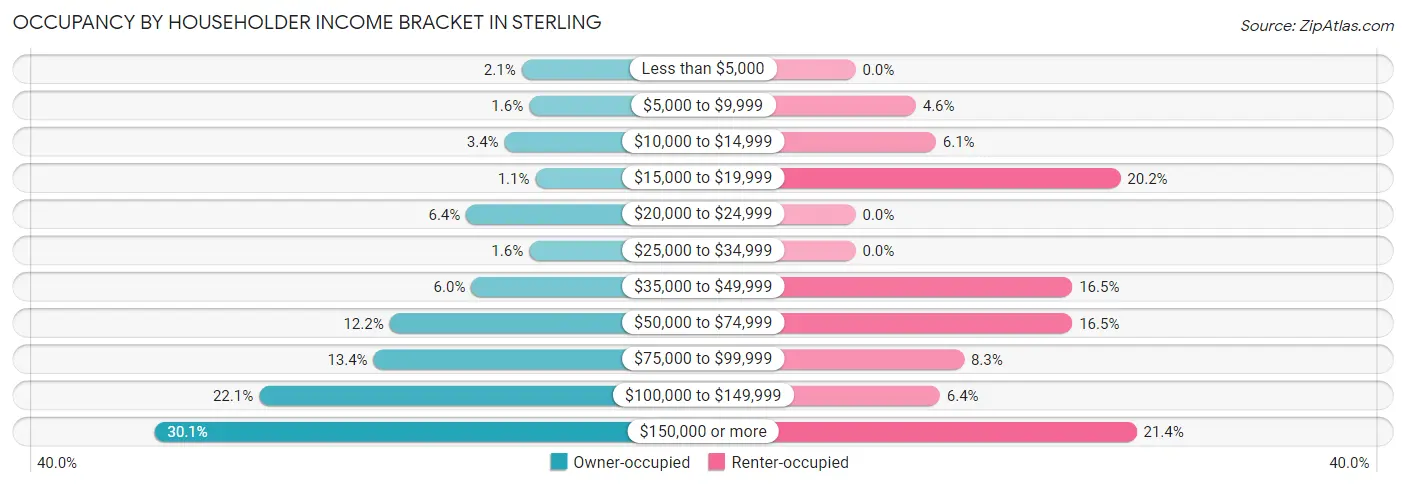
| Income Bracket | Owner-occupied | Renter-occupied |
| Less than $5,000 | 49 (2.1%) | 0 (0.0%) |
| $5,000 to $9,999 | 36 (1.6%) | 15 (4.6%) |
| $10,000 to $14,999 | 79 (3.4%) | 20 (6.1%) |
| $15,000 to $19,999 | 25 (1.1%) | 66 (20.2%) |
| $20,000 to $24,999 | 146 (6.4%) | 0 (0.0%) |
| $25,000 to $34,999 | 36 (1.6%) | 0 (0.0%) |
| $35,000 to $49,999 | 137 (6.0%) | 54 (16.5%) |
| $50,000 to $74,999 | 280 (12.2%) | 54 (16.5%) |
| $75,000 to $99,999 | 308 (13.4%) | 27 (8.3%) |
| $100,000 to $149,999 | 508 (22.1%) | 21 (6.4%) |
| $150,000 or more | 691 (30.1%) | 70 (21.4%) |
| Total | 2,295 (100.0%) | 327 (100.0%) |
Monthly Housing Cost Tiers in Sterling
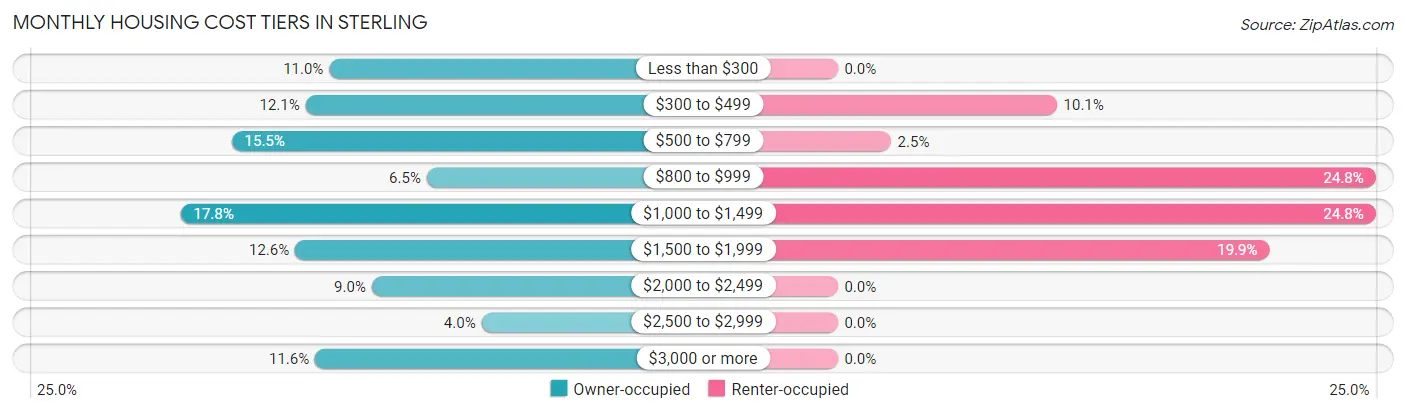
| Monthly Cost | Owner-occupied | Renter-occupied |
| Less than $300 | 252 (11.0%) | 0 (0.0%) |
| $300 to $499 | 277 (12.1%) | 33 (10.1%) |
| $500 to $799 | 355 (15.5%) | 8 (2.5%) |
| $800 to $999 | 149 (6.5%) | 81 (24.8%) |
| $1,000 to $1,499 | 409 (17.8%) | 81 (24.8%) |
| $1,500 to $1,999 | 288 (12.6%) | 65 (19.9%) |
| $2,000 to $2,499 | 207 (9.0%) | 0 (0.0%) |
| $2,500 to $2,999 | 91 (4.0%) | 0 (0.0%) |
| $3,000 or more | 267 (11.6%) | 0 (0.0%) |
| Total | 2,295 (100.0%) | 327 (100.0%) |
Physical Housing Characteristics in Sterling
Housing Structures in Sterling
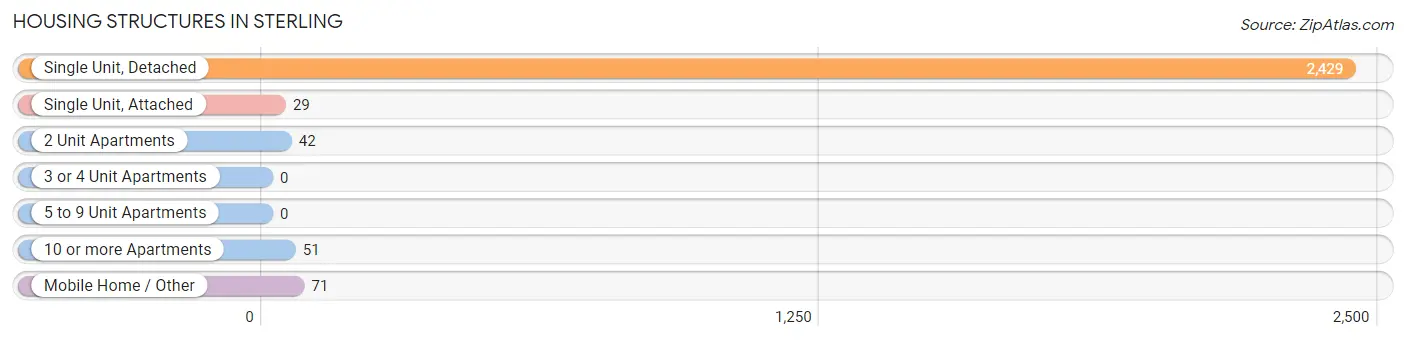
| Structure Type | # Housing Units | % Housing Units |
| Single Unit, Detached | 2,429 | 92.6% |
| Single Unit, Attached | 29 | 1.1% |
| 2 Unit Apartments | 42 | 1.6% |
| 3 or 4 Unit Apartments | 0 | 0.0% |
| 5 to 9 Unit Apartments | 0 | 0.0% |
| 10 or more Apartments | 51 | 1.9% |
| Mobile Home / Other | 71 | 2.7% |
| Total | 2,622 | 100.0% |
Housing Structures by Occupancy in Sterling
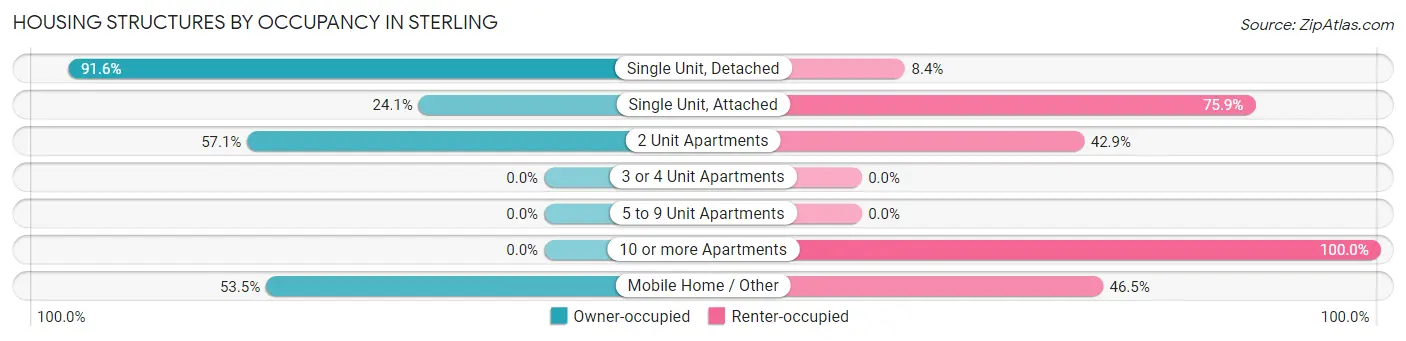
| Structure Type | Owner-occupied | Renter-occupied |
| Single Unit, Detached | 2,226 (91.6%) | 203 (8.4%) |
| Single Unit, Attached | 7 (24.1%) | 22 (75.9%) |
| 2 Unit Apartments | 24 (57.1%) | 18 (42.9%) |
| 3 or 4 Unit Apartments | 0 (0.0%) | 0 (0.0%) |
| 5 to 9 Unit Apartments | 0 (0.0%) | 0 (0.0%) |
| 10 or more Apartments | 0 (0.0%) | 51 (100.0%) |
| Mobile Home / Other | 38 (53.5%) | 33 (46.5%) |
| Total | 2,295 (87.5%) | 327 (12.5%) |
Housing Structures by Number of Rooms in Sterling
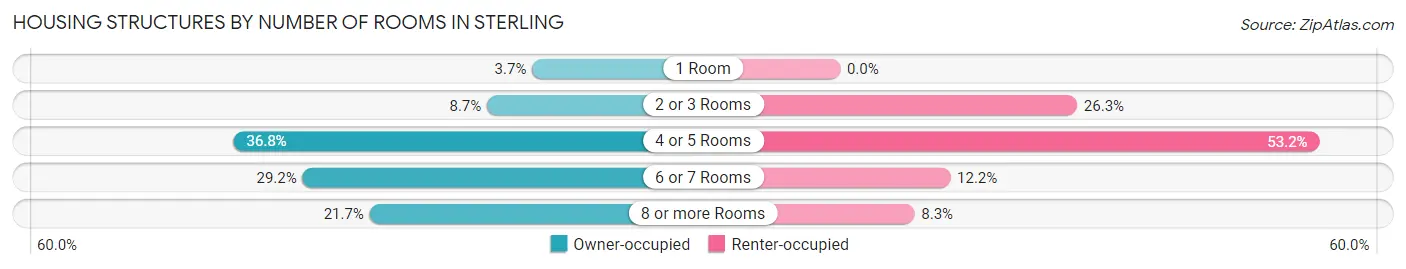
| Number of Rooms | Owner-occupied | Renter-occupied |
| 1 Room | 84 (3.7%) | 0 (0.0%) |
| 2 or 3 Rooms | 199 (8.7%) | 86 (26.3%) |
| 4 or 5 Rooms | 845 (36.8%) | 174 (53.2%) |
| 6 or 7 Rooms | 669 (29.1%) | 40 (12.2%) |
| 8 or more Rooms | 498 (21.7%) | 27 (8.3%) |
| Total | 2,295 (100.0%) | 327 (100.0%) |
Housing Structure by Heating Type in Sterling
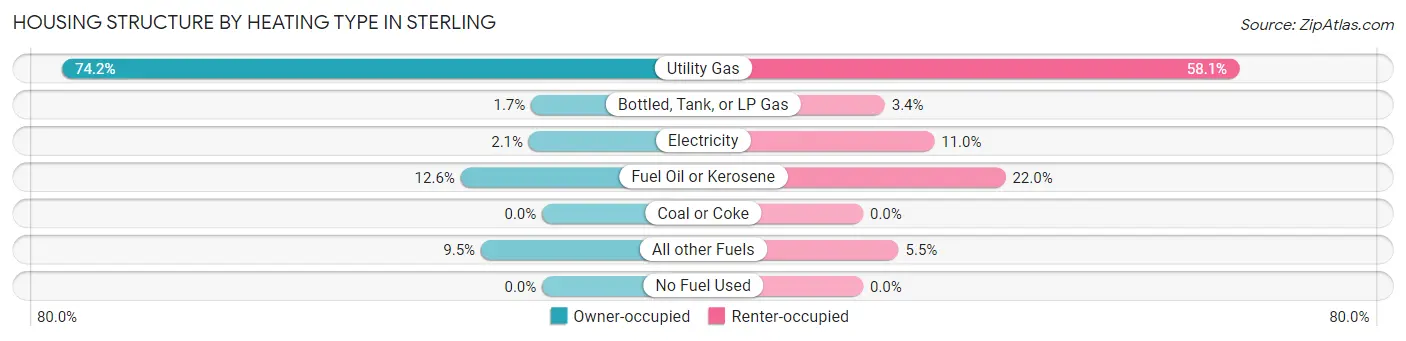
| Heating Type | Owner-occupied | Renter-occupied |
| Utility Gas | 1,703 (74.2%) | 190 (58.1%) |
| Bottled, Tank, or LP Gas | 39 (1.7%) | 11 (3.4%) |
| Electricity | 47 (2.1%) | 36 (11.0%) |
| Fuel Oil or Kerosene | 289 (12.6%) | 72 (22.0%) |
| Coal or Coke | 0 (0.0%) | 0 (0.0%) |
| All other Fuels | 217 (9.5%) | 18 (5.5%) |
| No Fuel Used | 0 (0.0%) | 0 (0.0%) |
| Total | 2,295 (100.0%) | 327 (100.0%) |
Household Vehicle Usage in Sterling
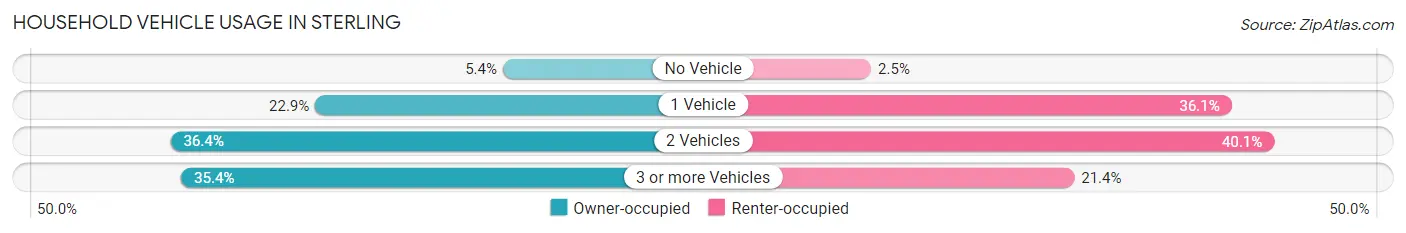
| Vehicles per Household | Owner-occupied | Renter-occupied |
| No Vehicle | 123 (5.4%) | 8 (2.5%) |
| 1 Vehicle | 525 (22.9%) | 118 (36.1%) |
| 2 Vehicles | 835 (36.4%) | 131 (40.1%) |
| 3 or more Vehicles | 812 (35.4%) | 70 (21.4%) |
| Total | 2,295 (100.0%) | 327 (100.0%) |
Real Estate & Mortgages in Sterling
Real Estate and Mortgage Overview in Sterling
| Characteristic | Without Mortgage | With Mortgage |
| Housing Units | 1,025 | 1,270 |
| Median Property Value | $259,900 | $372,400 |
| Median Household Income | $66,384 | $512 |
| Monthly Housing Costs | $488 | $267 |
| Real Estate Taxes | $1,378 | $223 |
Property Value by Mortgage Status in Sterling
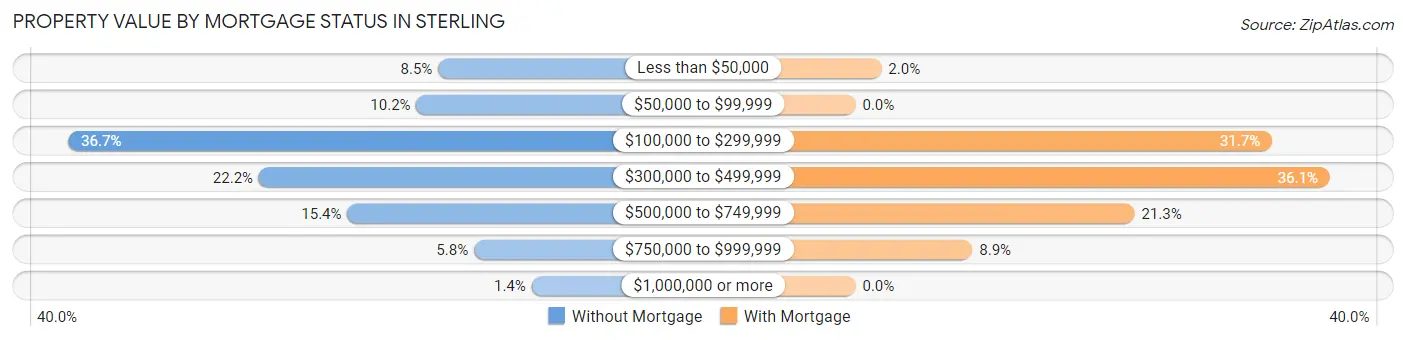
| Property Value | Without Mortgage | With Mortgage |
| Less than $50,000 | 87 (8.5%) | 25 (2.0%) |
| $50,000 to $99,999 | 104 (10.2%) | 0 (0.0%) |
| $100,000 to $299,999 | 376 (36.7%) | 403 (31.7%) |
| $300,000 to $499,999 | 227 (22.2%) | 459 (36.1%) |
| $500,000 to $749,999 | 158 (15.4%) | 270 (21.3%) |
| $750,000 to $999,999 | 59 (5.8%) | 113 (8.9%) |
| $1,000,000 or more | 14 (1.4%) | 0 (0.0%) |
| Total | 1,025 (100.0%) | 1,270 (100.0%) |
Household Income by Mortgage Status in Sterling
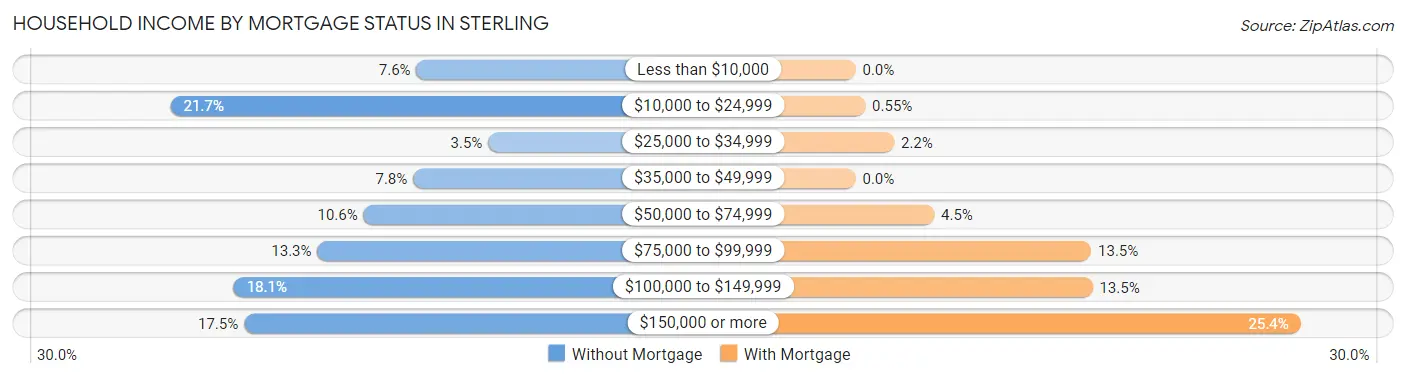
| Household Income | Without Mortgage | With Mortgage |
| Less than $10,000 | 78 (7.6%) | 0 (0.0%) |
| $10,000 to $24,999 | 222 (21.7%) | 7 (0.5%) |
| $25,000 to $34,999 | 36 (3.5%) | 28 (2.2%) |
| $35,000 to $49,999 | 80 (7.8%) | 0 (0.0%) |
| $50,000 to $74,999 | 109 (10.6%) | 57 (4.5%) |
| $75,000 to $99,999 | 136 (13.3%) | 171 (13.5%) |
| $100,000 to $149,999 | 185 (18.0%) | 172 (13.5%) |
| $150,000 or more | 179 (17.5%) | 323 (25.4%) |
| Total | 1,025 (100.0%) | 1,270 (100.0%) |
Property Value to Household Income Ratio in Sterling
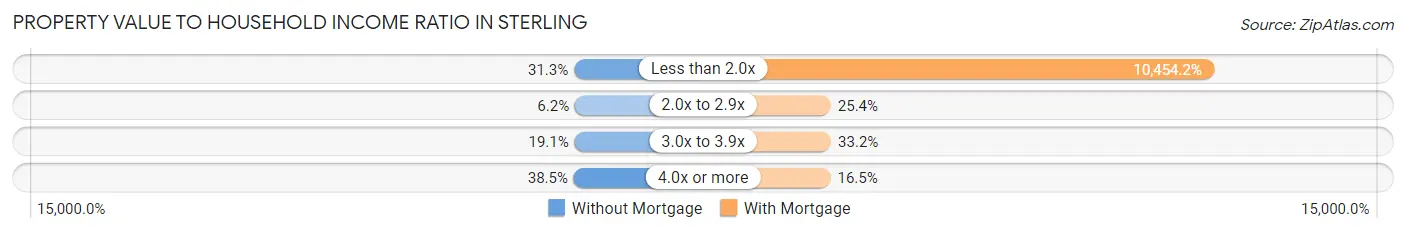
| Value-to-Income Ratio | Without Mortgage | With Mortgage |
| Less than 2.0x | 321 (31.3%) | 132,768 (10,454.2%) |
| 2.0x to 2.9x | 64 (6.2%) | 323 (25.4%) |
| 3.0x to 3.9x | 196 (19.1%) | 422 (33.2%) |
| 4.0x or more | 395 (38.5%) | 210 (16.5%) |
| Total | 1,025 (100.0%) | 1,270 (100.0%) |
Real Estate Taxes by Mortgage Status in Sterling
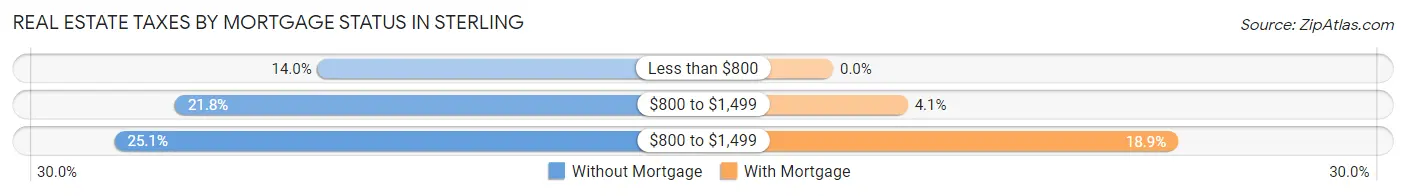
| Property Taxes | Without Mortgage | With Mortgage |
| Less than $800 | 143 (14.0%) | 0 (0.0%) |
| $800 to $1,499 | 223 (21.8%) | 52 (4.1%) |
| $800 to $1,499 | 257 (25.1%) | 240 (18.9%) |
| Total | 1,025 (100.0%) | 1,270 (100.0%) |
Health & Disability in Sterling
Health Insurance Coverage by Age in Sterling
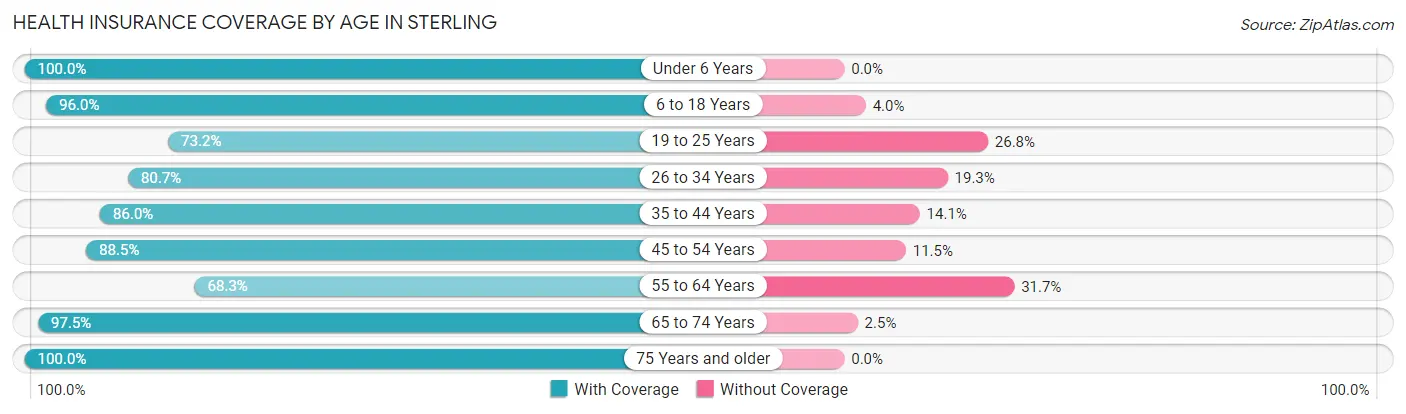
| Age Bracket | With Coverage | Without Coverage |
| Under 6 Years | 280 (100.0%) | 0 (0.0%) |
| 6 to 18 Years | 937 (96.0%) | 39 (4.0%) |
| 19 to 25 Years | 413 (73.2%) | 151 (26.8%) |
| 26 to 34 Years | 440 (80.7%) | 105 (19.3%) |
| 35 to 44 Years | 465 (86.0%) | 76 (14.1%) |
| 45 to 54 Years | 787 (88.5%) | 102 (11.5%) |
| 55 to 64 Years | 742 (68.3%) | 344 (31.7%) |
| 65 to 74 Years | 861 (97.5%) | 22 (2.5%) |
| 75 Years and older | 523 (100.0%) | 0 (0.0%) |
| Total | 5,448 (86.7%) | 839 (13.3%) |
Health Insurance Coverage by Citizenship Status in Sterling
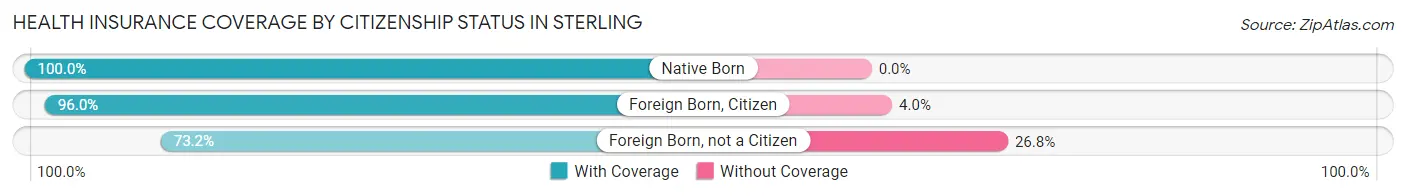
| Citizenship Status | With Coverage | Without Coverage |
| Native Born | 280 (100.0%) | 0 (0.0%) |
| Foreign Born, Citizen | 937 (96.0%) | 39 (4.0%) |
| Foreign Born, not a Citizen | 413 (73.2%) | 151 (26.8%) |
Health Insurance Coverage by Household Income in Sterling
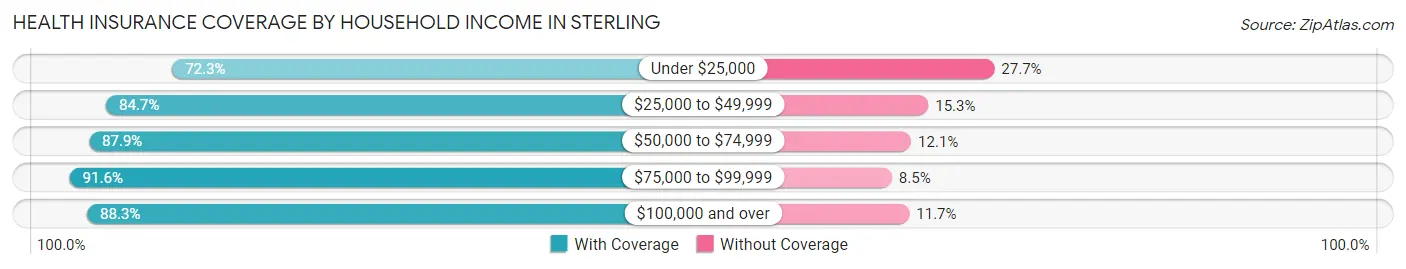
| Household Income | With Coverage | Without Coverage |
| Under $25,000 | 463 (72.3%) | 177 (27.7%) |
| $25,000 to $49,999 | 394 (84.7%) | 71 (15.3%) |
| $50,000 to $74,999 | 605 (87.9%) | 83 (12.1%) |
| $75,000 to $99,999 | 509 (91.5%) | 47 (8.5%) |
| $100,000 and over | 3,471 (88.3%) | 461 (11.7%) |
Public vs Private Health Insurance Coverage by Age in Sterling
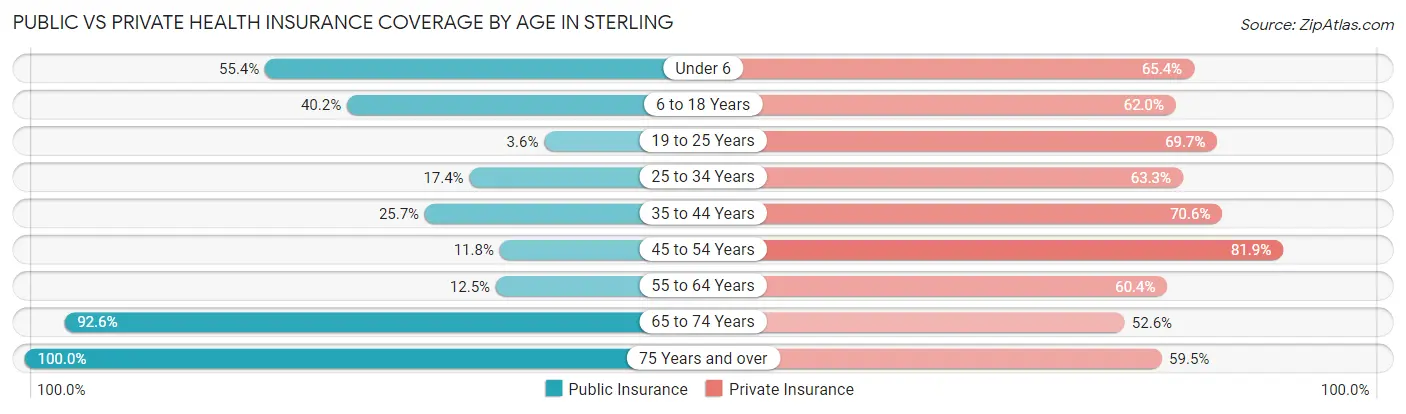
| Age Bracket | Public Insurance | Private Insurance |
| Under 6 | 155 (55.4%) | 183 (65.4%) |
| 6 to 18 Years | 392 (40.2%) | 605 (62.0%) |
| 19 to 25 Years | 20 (3.5%) | 393 (69.7%) |
| 25 to 34 Years | 95 (17.4%) | 345 (63.3%) |
| 35 to 44 Years | 139 (25.7%) | 382 (70.6%) |
| 45 to 54 Years | 105 (11.8%) | 728 (81.9%) |
| 55 to 64 Years | 136 (12.5%) | 656 (60.4%) |
| 65 to 74 Years | 818 (92.6%) | 464 (52.5%) |
| 75 Years and over | 523 (100.0%) | 311 (59.5%) |
| Total | 2,383 (37.9%) | 4,067 (64.7%) |
Disability Status by Sex by Age in Sterling
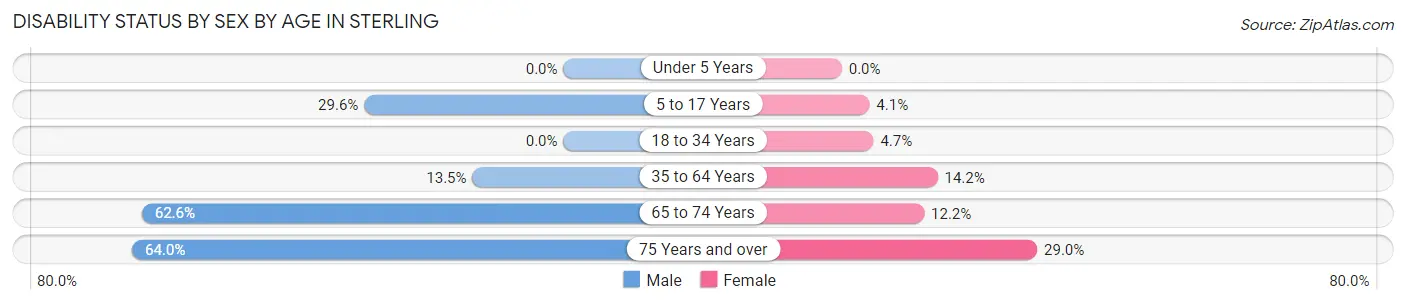
| Age Bracket | Male | Female |
| Under 5 Years | 0 (0.0%) | 0 (0.0%) |
| 5 to 17 Years | 176 (29.6%) | 16 (4.1%) |
| 18 to 34 Years | 0 (0.0%) | 29 (4.7%) |
| 35 to 64 Years | 187 (13.5%) | 161 (14.2%) |
| 65 to 74 Years | 271 (62.6%) | 55 (12.2%) |
| 75 Years and over | 187 (64.0%) | 67 (29.0%) |
Disability Class by Sex by Age in Sterling
Disability Class: Hearing Difficulty
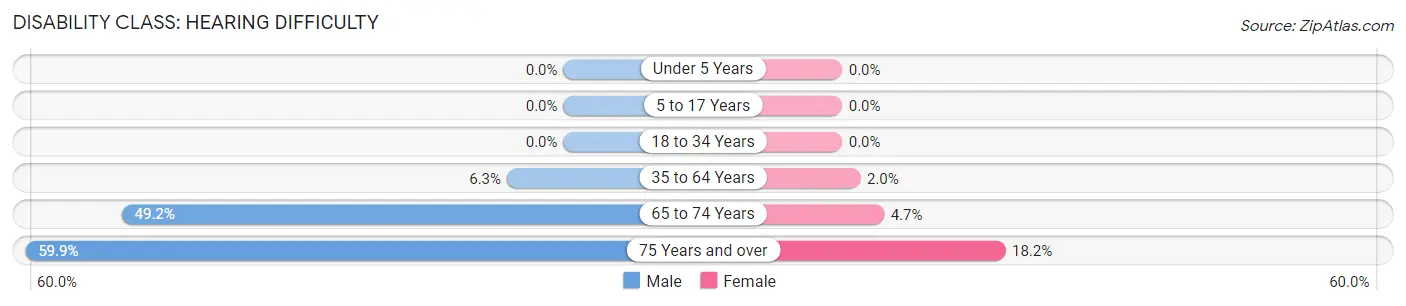
| Age Bracket | Male | Female |
| Under 5 Years | 0 (0.0%) | 0 (0.0%) |
| 5 to 17 Years | 0 (0.0%) | 0 (0.0%) |
| 18 to 34 Years | 0 (0.0%) | 0 (0.0%) |
| 35 to 64 Years | 87 (6.3%) | 23 (2.0%) |
| 65 to 74 Years | 213 (49.2%) | 21 (4.7%) |
| 75 Years and over | 175 (59.9%) | 42 (18.2%) |
Disability Class: Vision Difficulty
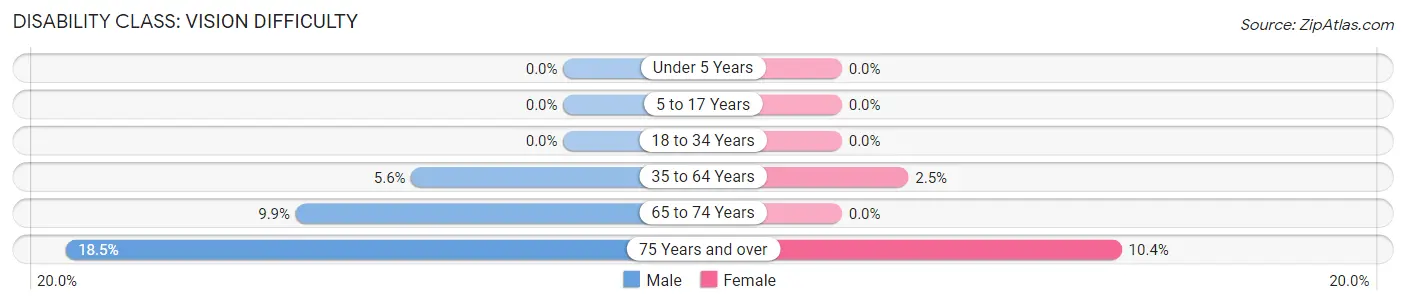
| Age Bracket | Male | Female |
| Under 5 Years | 0 (0.0%) | 0 (0.0%) |
| 5 to 17 Years | 0 (0.0%) | 0 (0.0%) |
| 18 to 34 Years | 0 (0.0%) | 0 (0.0%) |
| 35 to 64 Years | 78 (5.6%) | 28 (2.5%) |
| 65 to 74 Years | 43 (9.9%) | 0 (0.0%) |
| 75 Years and over | 54 (18.5%) | 24 (10.4%) |
Disability Class: Cognitive Difficulty
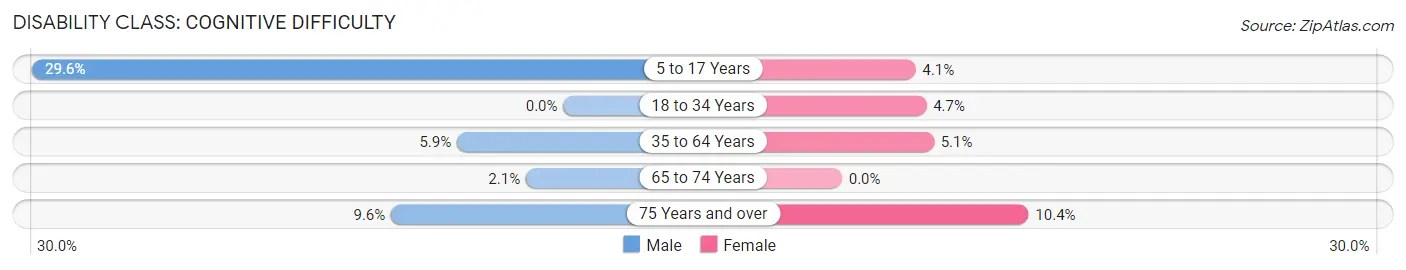
| Age Bracket | Male | Female |
| 5 to 17 Years | 176 (29.6%) | 16 (4.1%) |
| 18 to 34 Years | 0 (0.0%) | 29 (4.7%) |
| 35 to 64 Years | 82 (5.9%) | 58 (5.1%) |
| 65 to 74 Years | 9 (2.1%) | 0 (0.0%) |
| 75 Years and over | 28 (9.6%) | 24 (10.4%) |
Disability Class: Ambulatory Difficulty
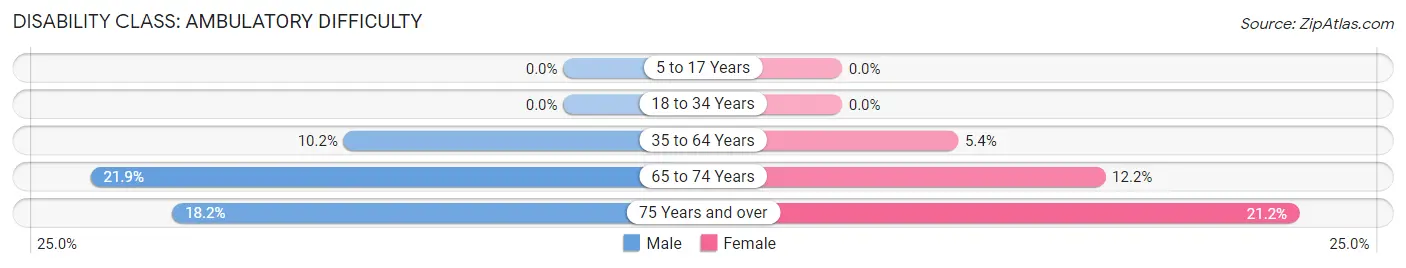
| Age Bracket | Male | Female |
| 5 to 17 Years | 0 (0.0%) | 0 (0.0%) |
| 18 to 34 Years | 0 (0.0%) | 0 (0.0%) |
| 35 to 64 Years | 141 (10.2%) | 61 (5.4%) |
| 65 to 74 Years | 95 (21.9%) | 55 (12.2%) |
| 75 Years and over | 53 (18.1%) | 49 (21.2%) |
Disability Class: Self-Care Difficulty
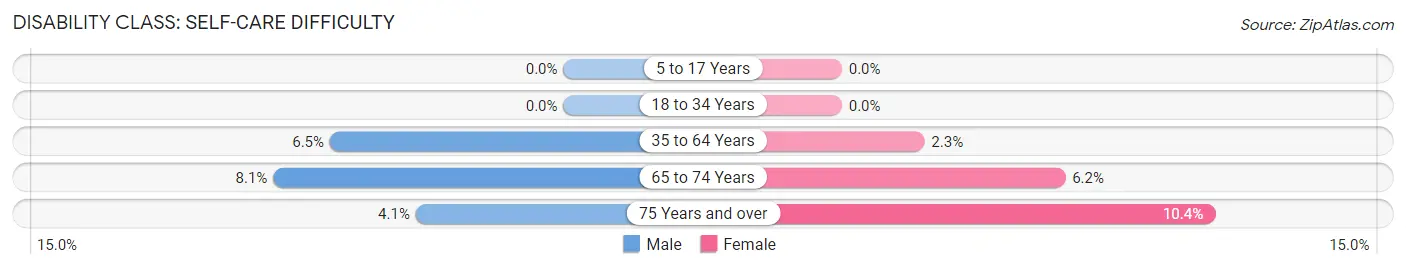
| Age Bracket | Male | Female |
| 5 to 17 Years | 0 (0.0%) | 0 (0.0%) |
| 18 to 34 Years | 0 (0.0%) | 0 (0.0%) |
| 35 to 64 Years | 90 (6.5%) | 26 (2.3%) |
| 65 to 74 Years | 35 (8.1%) | 28 (6.2%) |
| 75 Years and over | 12 (4.1%) | 24 (10.4%) |
Technology Access in Sterling
Computing Device Access in Sterling
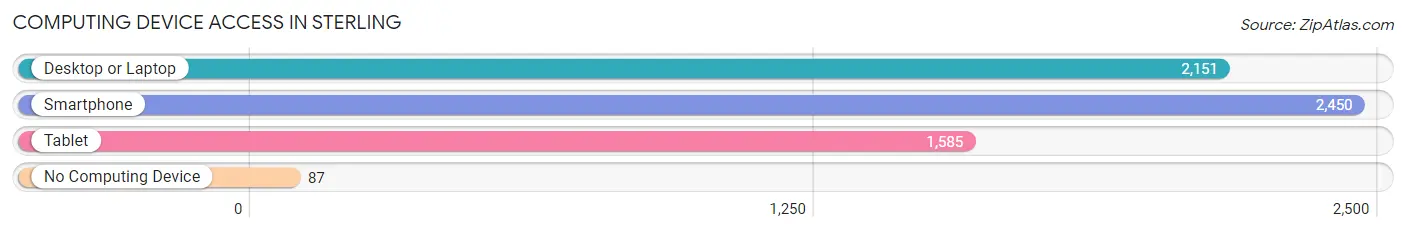
| Device Type | # Households | % Households |
| Desktop or Laptop | 2,151 | 82.0% |
| Smartphone | 2,450 | 93.4% |
| Tablet | 1,585 | 60.5% |
| No Computing Device | 87 | 3.3% |
| Total | 2,622 | 100.0% |
Internet Access in Sterling
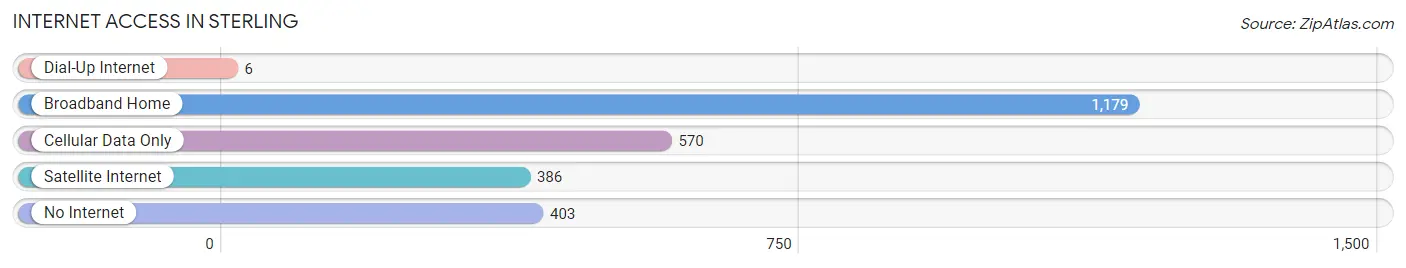
| Internet Type | # Households | % Households |
| Dial-Up Internet | 6 | 0.2% |
| Broadband Home | 1,179 | 45.0% |
| Cellular Data Only | 570 | 21.7% |
| Satellite Internet | 386 | 14.7% |
| No Internet | 403 | 15.4% |
| Total | 2,622 | 100.0% |
Sterling Summary
Sterling is a census-designated place (CDP) in the Kenai Peninsula Borough of the U.S. state of Alaska. It is located on the Kenai Peninsula, about 25 miles (40 km) east of the city of Kenai. As of the 2010 census, the population of Sterling was 1,722.
History
The area that is now Sterling was first settled by the Dena'ina Athabascan people. The first non-Native settlers arrived in the area in the late 19th century, and the community was officially established in the early 1900s. The community was named after Sterling Creek, which was named after a prospector named Sterling.
In the early 1900s, the area was a popular destination for gold prospectors. The Sterling Mining District was established in 1906, and the Sterling post office was established in 1907. The Sterling Highway, which runs through the community, was built in the 1930s.
Geography
Sterling is located in the Kenai Peninsula Borough of Alaska at 61°45'N 151°17'W. It is situated on the Kenai Peninsula, about 25 miles (40 km) east of the city of Kenai. The Sterling Highway runs through the community.
The Sterling CDP has a total area of 28.3 square miles (73.2 km2), of which 28.2 square miles (73.0 km2) is land and 0.1 square miles (0.2 km2) (0.36%) is water.
Economy
The economy of Sterling is largely based on tourism and fishing. The community is home to several fishing lodges and resorts, as well as a number of small businesses. The Sterling Highway is a popular route for tourists traveling to and from the Kenai Peninsula.
Demographics
As of the 2010 census, there were 1,722 people, 690 households, and 463 families residing in the Sterling CDP. The population density was 61.0 people per square mile (23.5/km2). There were 817 housing units at an average density of 28.9 per square mile (11.2/km2). The racial makeup of the CDP was 87.2% White, 0.2% African American, 5.2% Native American, 0.7% Asian, 0.1% Pacific Islander, 0.7% from other races, and 5.7% from two or more races. Hispanic or Latino of any race were 3.2% of the population.
There were 690 households, out of which 28.3% had children under the age of 18 living with them, 51.3% were married couples living together, 8.7% had a female householder with no husband present, and 34.3% were non-families. 28.3% of all households were made up of individuals, and 8.7% had someone living alone who was 65 years of age or older. The average household size was 2.50 and the average family size was 3.06.
In the Sterling CDP, the population was spread out, with 25.2% under the age of 18, 6.2% from 18 to 24, 25.2% from 25 to 44, 30.2% from 45 to 64, and 13.2% who were 65 years of age or older. The median age was 41 years. For every 100 females, there were 103.2 males. For every 100 females age 18 and over, there were 103.2 males.
The median income for a household in the Sterling CDP was $50,000, and the median income for a family was $56,250. Males had a median income of $41,250 versus $30,000 for females. The per capita income for the CDP was $22,917. About 5.2% of families and 8.7% of the population were below the poverty line, including 8.7% of those under age 18 and none of those age 65 or over.
Common Questions
What is Per Capita Income in Sterling?
Per Capita income in Sterling is $61,101.
What is the Median Family Income in Sterling?
Median Family Income in Sterling is $134,940.
What is the Median Household income in Sterling?
Median Household Income in Sterling is $98,542.
What is Income or Wage Gap in Sterling?
Income or Wage Gap in Sterling is 53.3%.
Women in Sterling earn 46.7 cents for every dollar earned by a man.
What is Inequality or Gini Index in Sterling?
Inequality or Gini Index in Sterling is 0.50.
What is the Total Population of Sterling?
Total Population of Sterling is 6,307.
What is the Total Male Population of Sterling?
Total Male Population of Sterling is 3,329.
What is the Total Female Population of Sterling?
Total Female Population of Sterling is 2,978.
What is the Ratio of Males per 100 Females in Sterling?
There are 111.79 Males per 100 Females in Sterling.
What is the Ratio of Females per 100 Males in Sterling?
There are 89.46 Females per 100 Males in Sterling.
What is the Median Population Age in Sterling?
Median Population Age in Sterling is 47.6 Years.
What is the Average Family Size in Sterling
Average Family Size in Sterling is 3.1 People.
What is the Average Household Size in Sterling
Average Household Size in Sterling is 2.4 People.
How Large is the Labor Force in Sterling?
There are 3,111 People in the Labor Forcein in Sterling.
What is the Percentage of People in the Labor Force in Sterling?
58.6% of People are in the Labor Force in Sterling.
What is the Unemployment Rate in Sterling?
Unemployment Rate in Sterling is 10.5%.