Utqiagvik, AK Map & Demographics
Utqiagvik Overview
$38,852
PER CAPITA INCOME
$105,116
AVG FAMILY INCOME
$86,810
AVG HOUSEHOLD INCOME
8.3%
WAGE / INCOME GAP [ % ]
91.7¢/ $1
WAGE / INCOME GAP [ $ ]
0.45
INEQUALITY / GINI INDEX
4,876
TOTAL POPULATION
2,504
MALE POPULATION
2,372
FEMALE POPULATION
105.56
MALES / 100 FEMALES
94.73
FEMALES / 100 MALES
30.7
MEDIAN AGE
3.6
AVG FAMILY SIZE
3.0
AVG HOUSEHOLD SIZE
2,363
LABOR FORCE [ PEOPLE ]
65.9%
PERCENT IN LABOR FORCE
11.5%
UNEMPLOYMENT RATE
Income in Utqiagvik
Income Overview in Utqiagvik
Per Capita Income in Utqiagvik is $38,852, while median incomes of families and households are $105,116 and $86,810 respectively.
| Characteristic | Number | Measure |
| Per Capita Income | 4,876 | $38,852 |
| Median Family Income | 1,078 | $105,116 |
| Mean Family Income | 1,078 | $128,417 |
| Median Household Income | 1,568 | $86,810 |
| Mean Household Income | 1,568 | $114,990 |
| Income Deficit | 1,078 | $0 |
| Wage / Income Gap (%) | 4,876 | 8.33% |
| Wage / Income Gap ($) | 4,876 | 91.67¢ per $1 |
| Gini / Inequality Index | 4,876 | 0.45 |
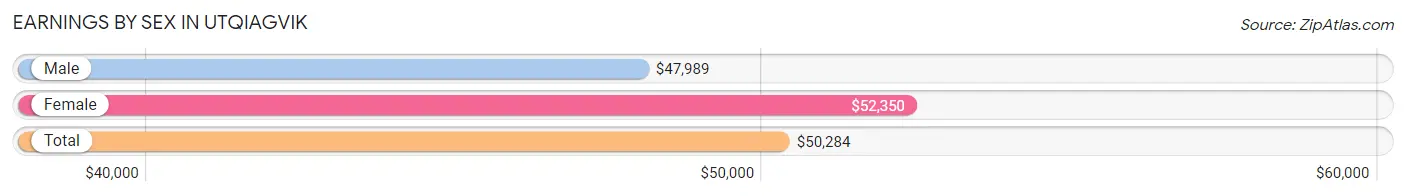
Earnings by Sex in Utqiagvik
Average Earnings in Utqiagvik are $50,284, $47,989 for men and $52,350 for women, a difference of 8.3%.
| Sex | Number | Average Earnings |
| Male | 1,247 (51.9%) | $47,989 |
| Female | 1,157 (48.1%) | $52,350 |
| Total | 2,404 (100.0%) | $50,284 |
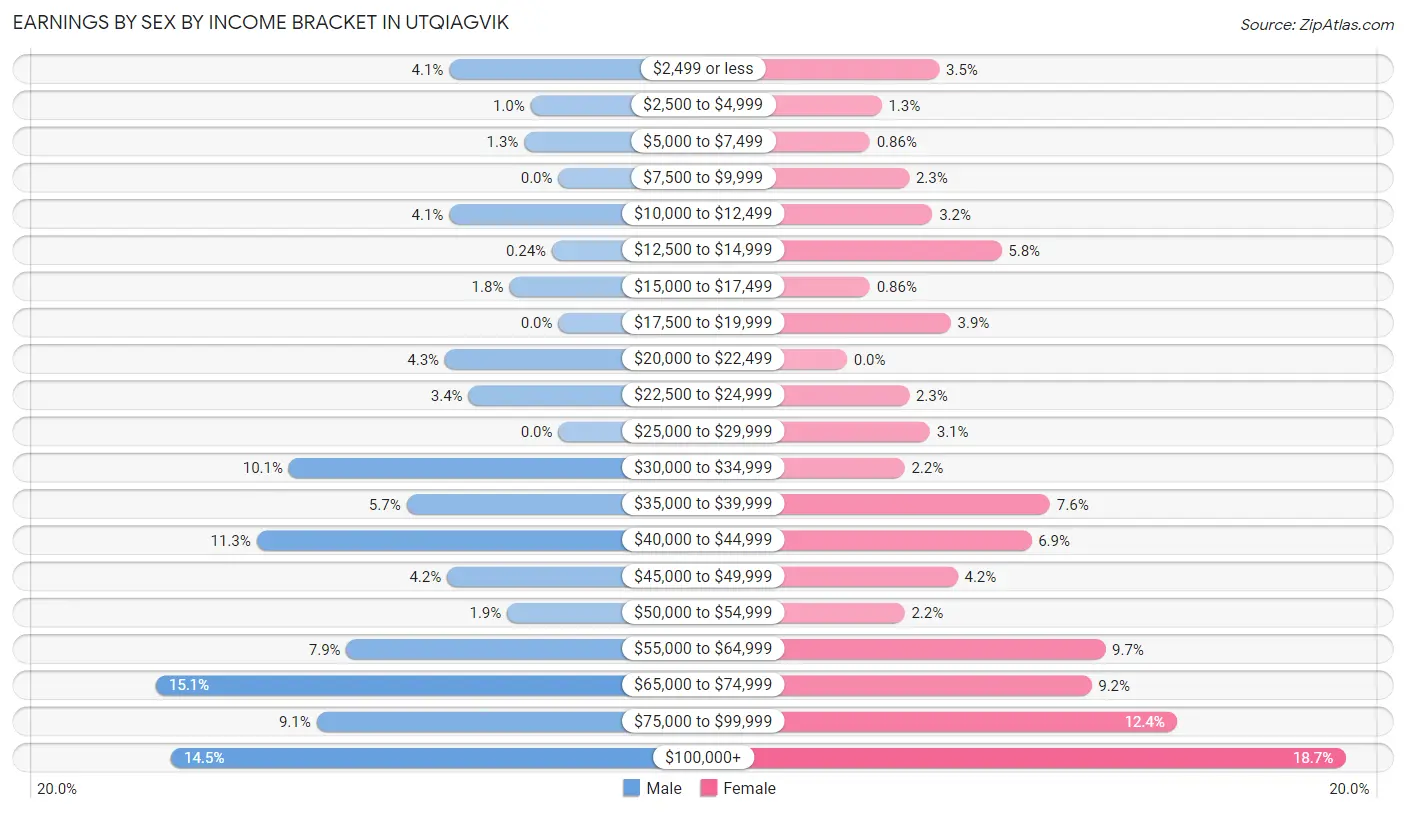
Earnings by Sex by Income Bracket in Utqiagvik
The most common earnings brackets in Utqiagvik are $65,000 to $74,999 for men (188 | 15.1%) and $100,000+ for women (216 | 18.7%).
| Income | Male | Female |
| $2,499 or less | 51 (4.1%) | 40 (3.5%) |
| $2,500 to $4,999 | 13 (1.0%) | 15 (1.3%) |
| $5,000 to $7,499 | 16 (1.3%) | 10 (0.9%) |
| $7,500 to $9,999 | 0 (0.0%) | 27 (2.3%) |
| $10,000 to $12,499 | 51 (4.1%) | 37 (3.2%) |
| $12,500 to $14,999 | 3 (0.2%) | 67 (5.8%) |
| $15,000 to $17,499 | 23 (1.8%) | 10 (0.9%) |
| $17,500 to $19,999 | 0 (0.0%) | 45 (3.9%) |
| $20,000 to $22,499 | 53 (4.3%) | 0 (0.0%) |
| $22,500 to $24,999 | 42 (3.4%) | 27 (2.3%) |
| $25,000 to $29,999 | 0 (0.0%) | 36 (3.1%) |
| $30,000 to $34,999 | 126 (10.1%) | 25 (2.2%) |
| $35,000 to $39,999 | 71 (5.7%) | 88 (7.6%) |
| $40,000 to $44,999 | 141 (11.3%) | 80 (6.9%) |
| $45,000 to $49,999 | 52 (4.2%) | 48 (4.2%) |
| $50,000 to $54,999 | 24 (1.9%) | 25 (2.2%) |
| $55,000 to $64,999 | 99 (7.9%) | 112 (9.7%) |
| $65,000 to $74,999 | 188 (15.1%) | 106 (9.2%) |
| $75,000 to $99,999 | 113 (9.1%) | 143 (12.4%) |
| $100,000+ | 181 (14.5%) | 216 (18.7%) |
| Total | 1,247 (100.0%) | 1,157 (100.0%) |
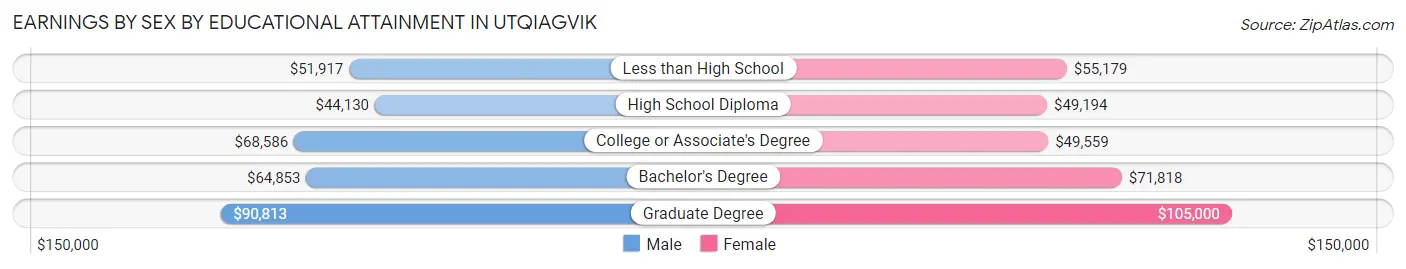
Earnings by Sex by Educational Attainment in Utqiagvik
Average earnings in Utqiagvik are $62,500 for men and $62,443 for women, a difference of 0.1%. Men with an educational attainment of graduate degree enjoy the highest average annual earnings of $90,813, while those with high school diploma education earn the least with $44,130. Women with an educational attainment of graduate degree earn the most with the average annual earnings of $105,000, while those with high school diploma education have the smallest earnings of $49,194.
| Educational Attainment | Male Income | Female Income |
| Less than High School | $51,917 | $55,179 |
| High School Diploma | $44,130 | $49,194 |
| College or Associate's Degree | $68,586 | $49,559 |
| Bachelor's Degree | $64,853 | $71,818 |
| Graduate Degree | $90,813 | $105,000 |
| Total | $62,500 | $62,443 |
Family Income in Utqiagvik
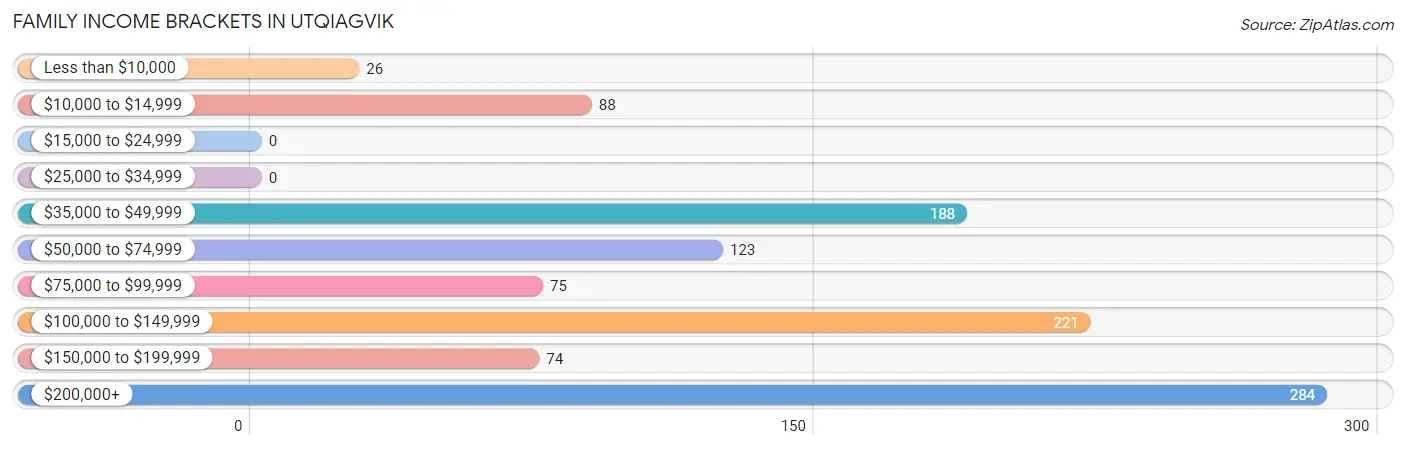
Family Income Brackets in Utqiagvik
According to the Utqiagvik family income data, there are 284 families falling into the $200,000+ income range, which is the most common income bracket and makes up 26.4% of all families.
| Income Bracket | # Families | % Families |
| Less than $10,000 | 26 | 2.4% |
| $10,000 to $14,999 | 88 | 8.2% |
| $15,000 to $24,999 | 0 | 0.0% |
| $25,000 to $34,999 | 0 | 0.0% |
| $35,000 to $49,999 | 188 | 17.4% |
| $50,000 to $74,999 | 123 | 11.4% |
| $75,000 to $99,999 | 75 | 7.0% |
| $100,000 to $149,999 | 221 | 20.5% |
| $150,000 to $199,999 | 74 | 6.9% |
| $200,000+ | 284 | 26.3% |
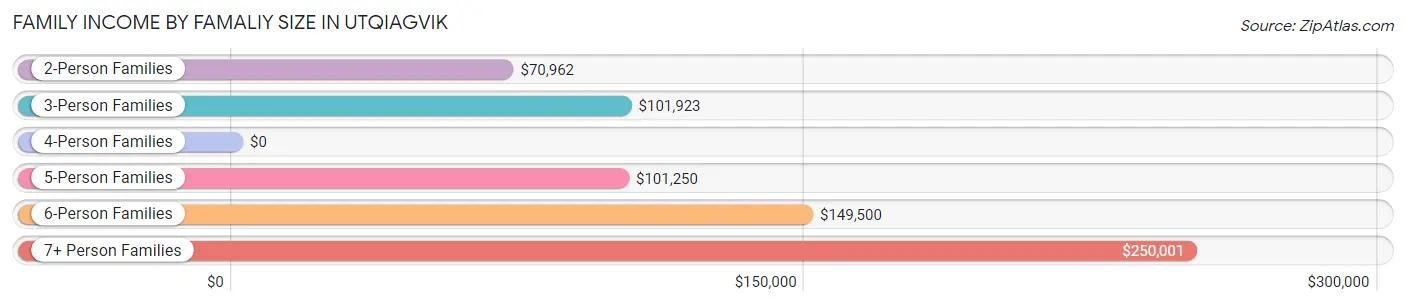
Family Income by Famaliy Size in Utqiagvik
7+ person families (37 | 3.4%) account for the highest median family income in Utqiagvik with $250,001 per family, while 7+ person families (37 | 3.4%) have the highest median income of $35,714 per family member.
| Income Bracket | # Families | Median Income |
| 2-Person Families | 310 (28.8%) | $70,962 |
| 3-Person Families | 300 (27.8%) | $101,923 |
| 4-Person Families | 190 (17.6%) | $0 |
| 5-Person Families | 107 (9.9%) | $101,250 |
| 6-Person Families | 134 (12.4%) | $149,500 |
| 7+ Person Families | 37 (3.4%) | $250,001 |
| Total | 1,078 (100.0%) | $105,116 |
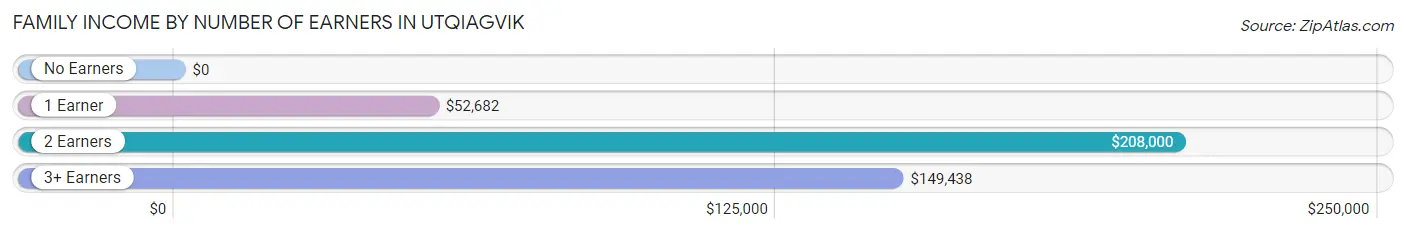
Family Income by Number of Earners in Utqiagvik
| Number of Earners | # Families | Median Income |
| No Earners | 159 (14.7%) | $0 |
| 1 Earner | 346 (32.1%) | $52,682 |
| 2 Earners | 404 (37.5%) | $208,000 |
| 3+ Earners | 169 (15.7%) | $149,438 |
| Total | 1,078 (100.0%) | $105,116 |
Household Income in Utqiagvik
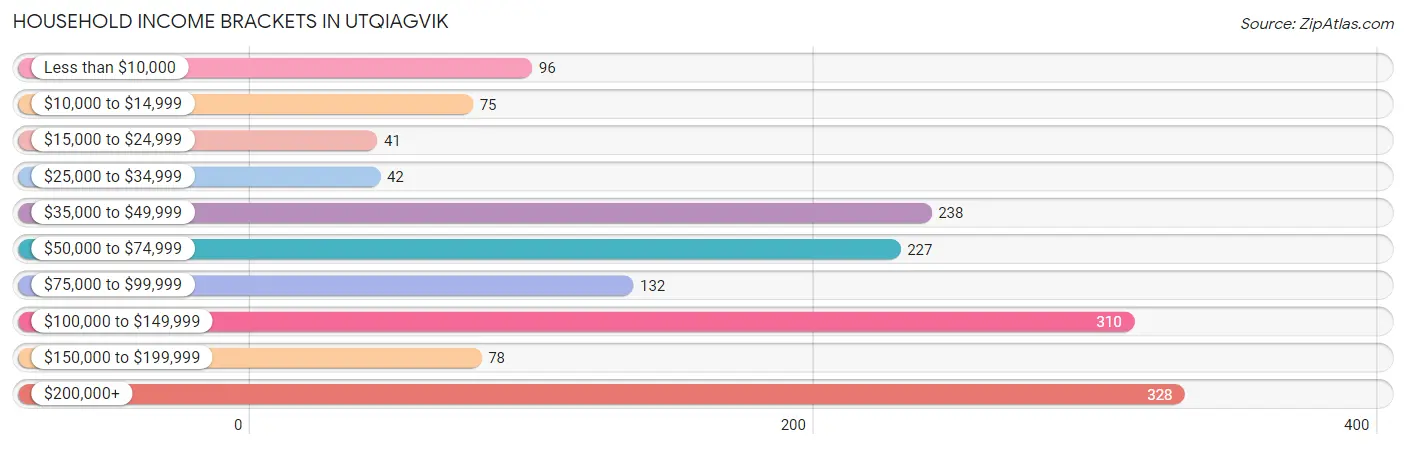
Household Income Brackets in Utqiagvik
With 328 households falling in the category, the $200,000+ income range is the most frequent in Utqiagvik, accounting for 20.9% of all households. In contrast, only 41 households (2.6%) fall into the $15,000 to $24,999 income bracket, making it the least populous group.
| Income Bracket | # Households | % Households |
| Less than $10,000 | 96 | 6.1% |
| $10,000 to $14,999 | 75 | 4.8% |
| $15,000 to $24,999 | 41 | 2.6% |
| $25,000 to $34,999 | 42 | 2.7% |
| $35,000 to $49,999 | 238 | 15.2% |
| $50,000 to $74,999 | 227 | 14.5% |
| $75,000 to $99,999 | 132 | 8.4% |
| $100,000 to $149,999 | 310 | 19.8% |
| $150,000 to $199,999 | 78 | 5.0% |
| $200,000+ | 328 | 20.9% |
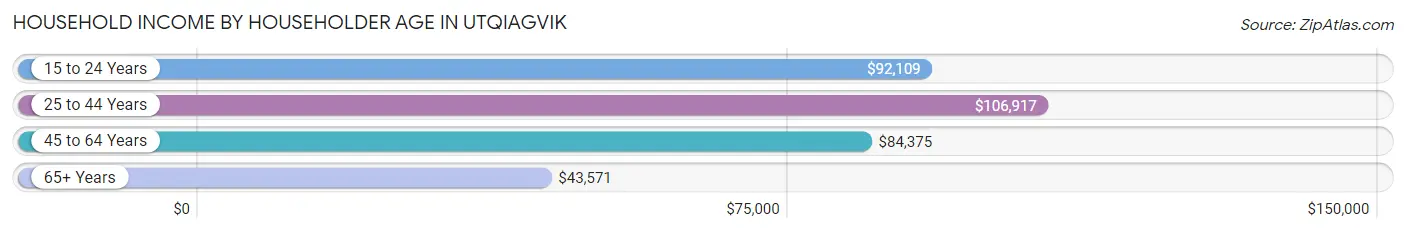
Household Income by Householder Age in Utqiagvik
The median household income in Utqiagvik is $86,810, with the highest median household income of $106,917 found in the 25 to 44 years age bracket for the primary householder. A total of 482 households (30.7%) fall into this category. Meanwhile, the 65+ years age bracket for the primary householder has the lowest median household income of $43,571, with 346 households (22.1%) in this group.
| Income Bracket | # Households | Median Income |
| 15 to 24 Years | 72 (4.6%) | $92,109 |
| 25 to 44 Years | 482 (30.7%) | $106,917 |
| 45 to 64 Years | 668 (42.6%) | $84,375 |
| 65+ Years | 346 (22.1%) | $43,571 |
| Total | 1,568 (100.0%) | $86,810 |
Poverty in Utqiagvik
Income Below Poverty by Sex and Age in Utqiagvik
With 8.1% poverty level for males and 10.4% for females among the residents of Utqiagvik, 65 to 74 year old males and under 5 year old females are the most vulnerable to poverty, with 106 males (48.4%) and 45 females (31.2%) in their respective age groups living below the poverty level.
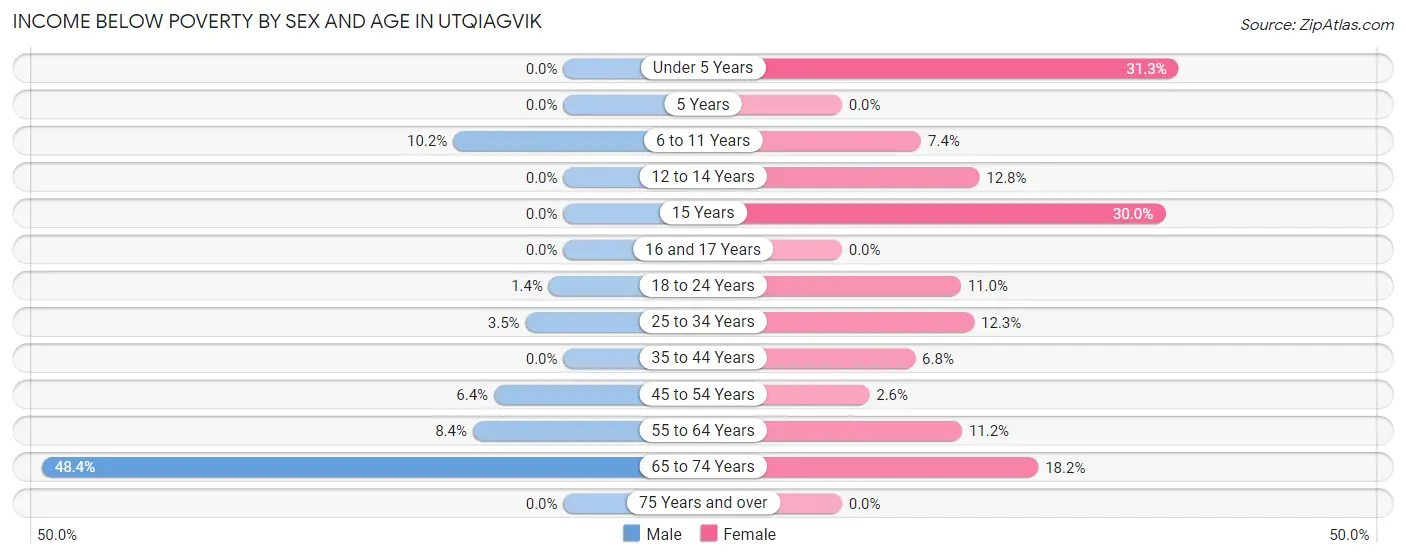
| Age Bracket | Male | Female |
| Under 5 Years | 0 (0.0%) | 45 (31.2%) |
| 5 Years | 0 (0.0%) | 0 (0.0%) |
| 6 to 11 Years | 30 (10.2%) | 19 (7.4%) |
| 12 to 14 Years | 0 (0.0%) | 18 (12.8%) |
| 15 Years | 0 (0.0%) | 12 (30.0%) |
| 16 and 17 Years | 0 (0.0%) | 0 (0.0%) |
| 18 to 24 Years | 4 (1.3%) | 17 (11.0%) |
| 25 to 34 Years | 13 (3.5%) | 41 (12.3%) |
| 35 to 44 Years | 0 (0.0%) | 19 (6.8%) |
| 45 to 54 Years | 15 (6.4%) | 6 (2.5%) |
| 55 to 64 Years | 30 (8.4%) | 33 (11.2%) |
| 65 to 74 Years | 106 (48.4%) | 33 (18.2%) |
| 75 Years and over | 0 (0.0%) | 0 (0.0%) |
| Total | 198 (8.1%) | 243 (10.4%) |
Income Above Poverty by Sex and Age in Utqiagvik
According to the poverty statistics in Utqiagvik, males aged under 5 years and females aged 5 years are the age groups that are most secure financially, with 100.0% of males and 100.0% of females in these age groups living above the poverty line.
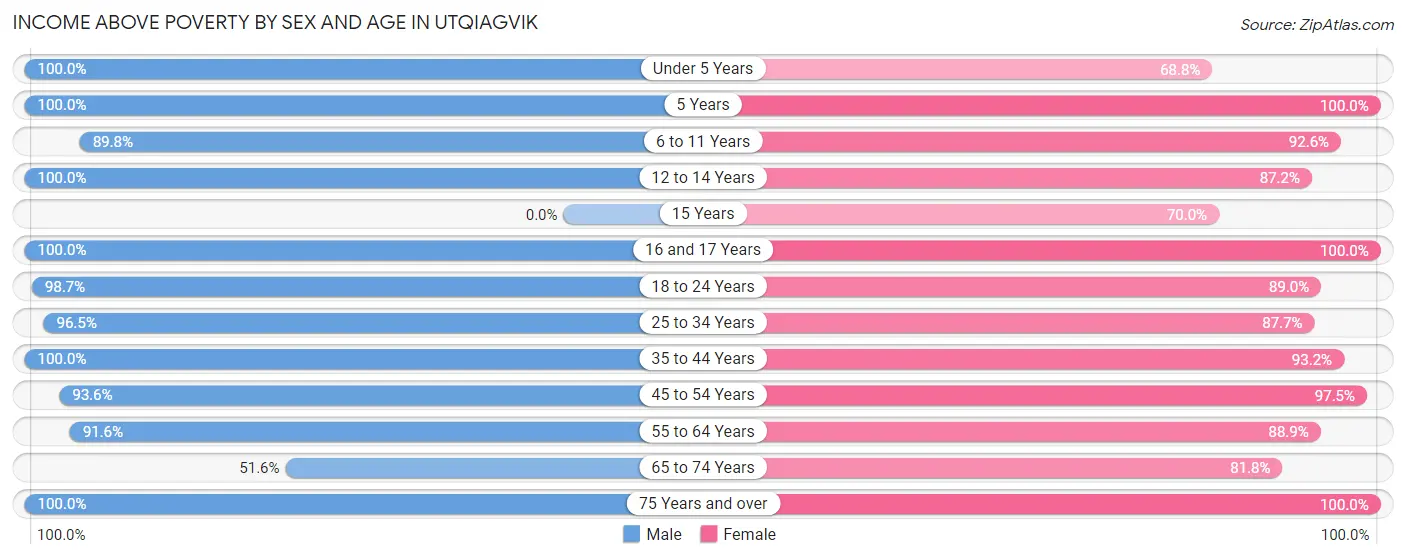
| Age Bracket | Male | Female |
| Under 5 Years | 150 (100.0%) | 99 (68.8%) |
| 5 Years | 36 (100.0%) | 33 (100.0%) |
| 6 to 11 Years | 263 (89.8%) | 239 (92.6%) |
| 12 to 14 Years | 118 (100.0%) | 123 (87.2%) |
| 15 Years | 0 (0.0%) | 28 (70.0%) |
| 16 and 17 Years | 78 (100.0%) | 168 (100.0%) |
| 18 to 24 Years | 292 (98.7%) | 137 (89.0%) |
| 25 to 34 Years | 356 (96.5%) | 293 (87.7%) |
| 35 to 44 Years | 253 (100.0%) | 260 (93.2%) |
| 45 to 54 Years | 218 (93.6%) | 229 (97.5%) |
| 55 to 64 Years | 327 (91.6%) | 263 (88.8%) |
| 65 to 74 Years | 113 (51.6%) | 148 (81.8%) |
| 75 Years and over | 39 (100.0%) | 72 (100.0%) |
| Total | 2,243 (91.9%) | 2,092 (89.6%) |
Income Below Poverty Among Married-Couple Families in Utqiagvik
The poverty statistics for married-couple families in Utqiagvik show that 7.7% or 47 of the total 613 families live below the poverty line. Families with no children have the highest poverty rate of 14.2%, comprising of 47 families. On the other hand, families with 1 or 2 children have the lowest poverty rate of 0.0%, which includes 0 families.
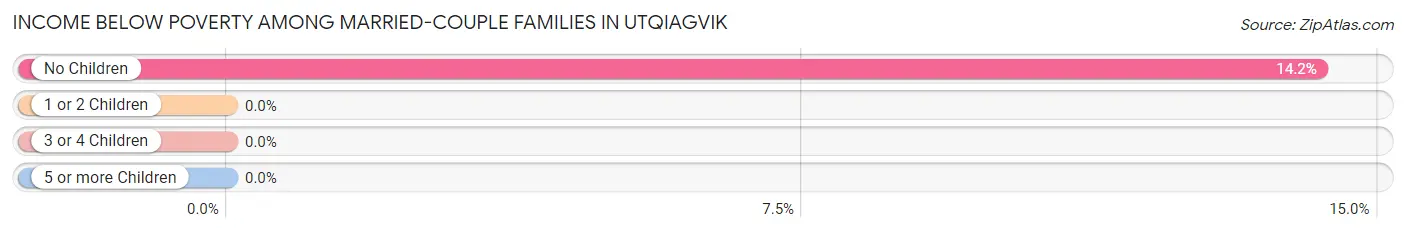
| Children | Above Poverty | Below Poverty |
| No Children | 283 (85.8%) | 47 (14.2%) |
| 1 or 2 Children | 183 (100.0%) | 0 (0.0%) |
| 3 or 4 Children | 79 (100.0%) | 0 (0.0%) |
| 5 or more Children | 21 (100.0%) | 0 (0.0%) |
| Total | 566 (92.3%) | 47 (7.7%) |
Income Below Poverty Among Single-Parent Households in Utqiagvik
According to the poverty data in Utqiagvik, 12.5% or 26 single-father households and 16.0% or 41 single-mother households are living below the poverty line. Among single-father households, those with no children have the highest poverty rate, with 26 households (32.9%) experiencing poverty. Likewise, among single-mother households, those with 3 or 4 children have the highest poverty rate, with 41 households (46.1%) falling below the poverty line.
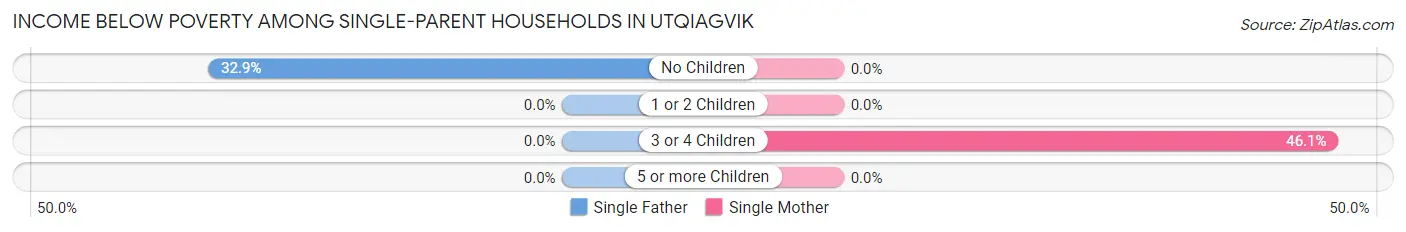
| Children | Single Father | Single Mother |
| No Children | 26 (32.9%) | 0 (0.0%) |
| 1 or 2 Children | 0 (0.0%) | 0 (0.0%) |
| 3 or 4 Children | 0 (0.0%) | 41 (46.1%) |
| 5 or more Children | 0 (0.0%) | 0 (0.0%) |
| Total | 26 (12.5%) | 41 (16.0%) |
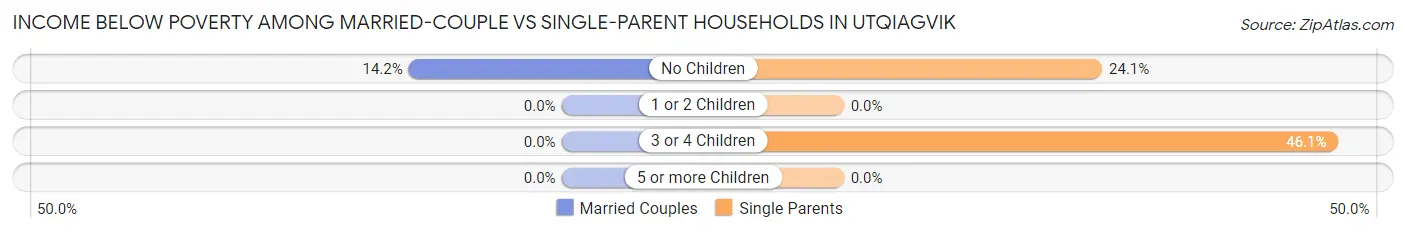
Income Below Poverty Among Married-Couple vs Single-Parent Households in Utqiagvik
The poverty data for Utqiagvik shows that 47 of the married-couple family households (7.7%) and 67 of the single-parent households (14.4%) are living below the poverty level. Within the married-couple family households, those with no children have the highest poverty rate, with 47 households (14.2%) falling below the poverty line. Among the single-parent households, those with 3 or 4 children have the highest poverty rate, with 41 household (46.1%) living below poverty.
| Children | Married-Couple Families | Single-Parent Households |
| No Children | 47 (14.2%) | 26 (24.1%) |
| 1 or 2 Children | 0 (0.0%) | 0 (0.0%) |
| 3 or 4 Children | 0 (0.0%) | 41 (46.1%) |
| 5 or more Children | 0 (0.0%) | 0 (0.0%) |
| Total | 47 (7.7%) | 67 (14.4%) |
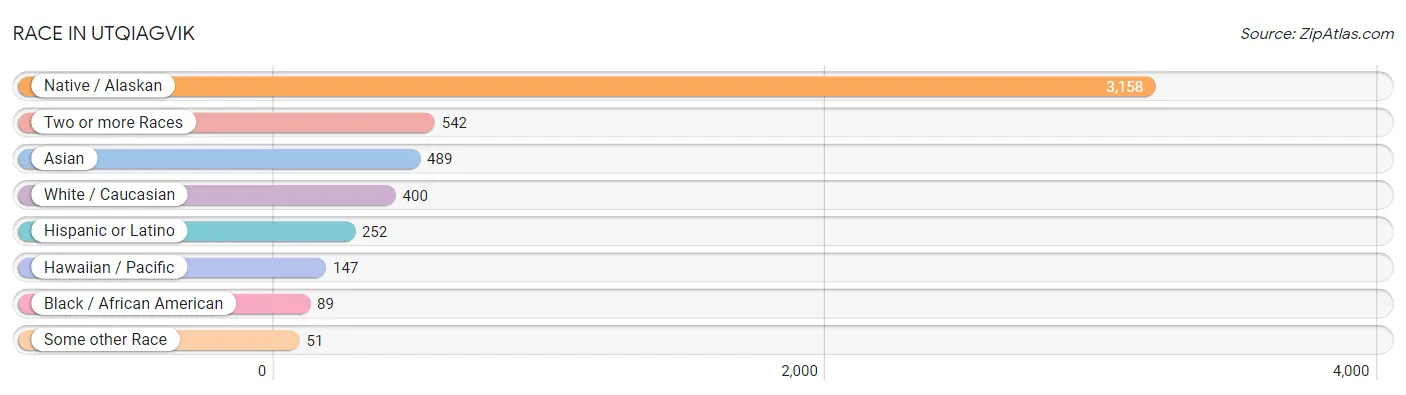
Race in Utqiagvik
The most populous races in Utqiagvik are Native / Alaskan (3,158 | 64.8%), Two or more Races (542 | 11.1%), and Asian (489 | 10.0%).
| Race | # Population | % Population |
| Asian | 489 | 10.0% |
| Black / African American | 89 | 1.8% |
| Hawaiian / Pacific | 147 | 3.0% |
| Hispanic or Latino | 252 | 5.2% |
| Native / Alaskan | 3,158 | 64.8% |
| White / Caucasian | 400 | 8.2% |
| Two or more Races | 542 | 11.1% |
| Some other Race | 51 | 1.1% |
| Total | 4,876 | 100.0% |
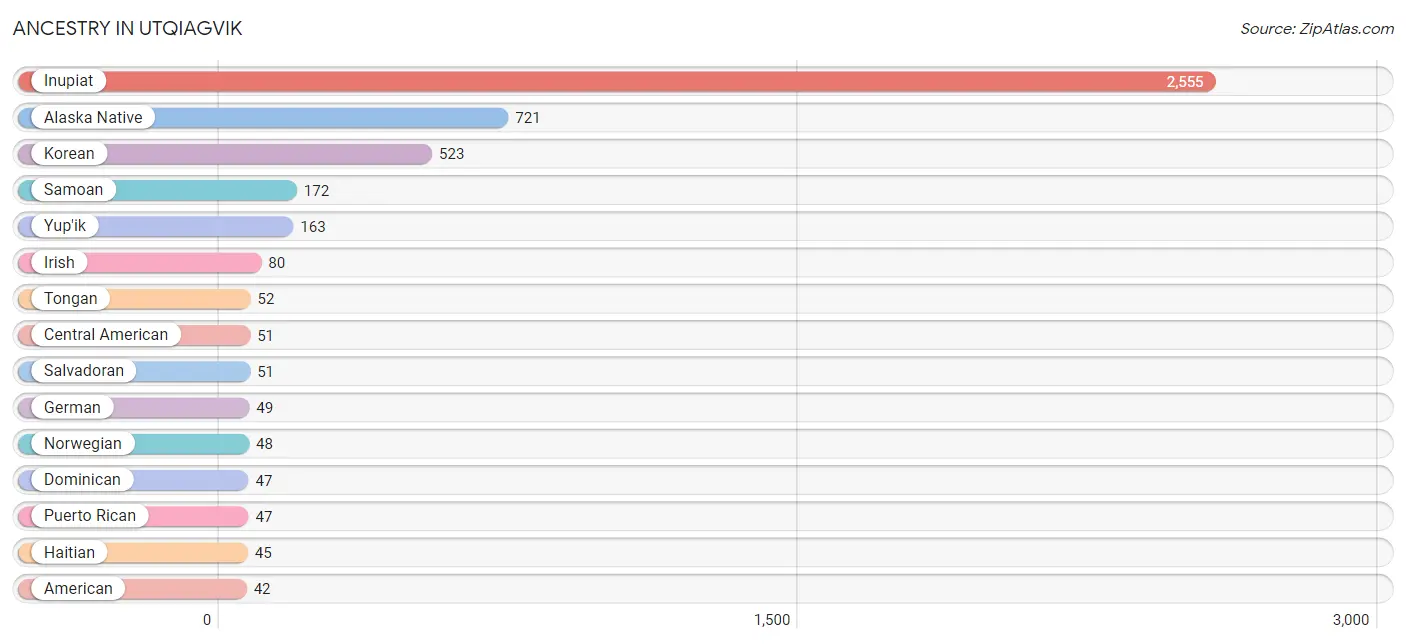
Ancestry in Utqiagvik
The most populous ancestries reported in Utqiagvik are Inupiat (2,555 | 52.4%), Alaska Native (721 | 14.8%), Korean (523 | 10.7%), Samoan (172 | 3.5%), and Yup'ik (163 | 3.3%), together accounting for 84.8% of all Utqiagvik residents.
| Ancestry | # Population | % Population |
| Alaska Native | 721 | 14.8% |
| Alaskan Athabascan | 32 | 0.7% |
| American | 42 | 0.9% |
| British | 32 | 0.7% |
| Burmese | 29 | 0.6% |
| Central American | 51 | 1.1% |
| Chippewa | 12 | 0.3% |
| Choctaw | 38 | 0.8% |
| Creek | 29 | 0.6% |
| Czech | 3 | 0.1% |
| Dominican | 47 | 1.0% |
| Dutch | 17 | 0.4% |
| English | 32 | 0.7% |
| French | 29 | 0.6% |
| French Canadian | 19 | 0.4% |
| German | 49 | 1.0% |
| Haitian | 45 | 0.9% |
| Inupiat | 2,555 | 52.4% |
| Irish | 80 | 1.6% |
| Italian | 40 | 0.8% |
| Korean | 523 | 10.7% |
| Macedonian | 11 | 0.2% |
| Mexican | 28 | 0.6% |
| Native Hawaiian | 9 | 0.2% |
| Norwegian | 48 | 1.0% |
| Puerto Rican | 47 | 1.0% |
| Russian | 6 | 0.1% |
| Salvadoran | 51 | 1.1% |
| Samoan | 172 | 3.5% |
| Scandinavian | 25 | 0.5% |
| Scottish | 3 | 0.1% |
| Swedish | 16 | 0.3% |
| Thai | 39 | 0.8% |
| Tongan | 52 | 1.1% |
| Yup'ik | 163 | 3.3% | View All 35 Rows |
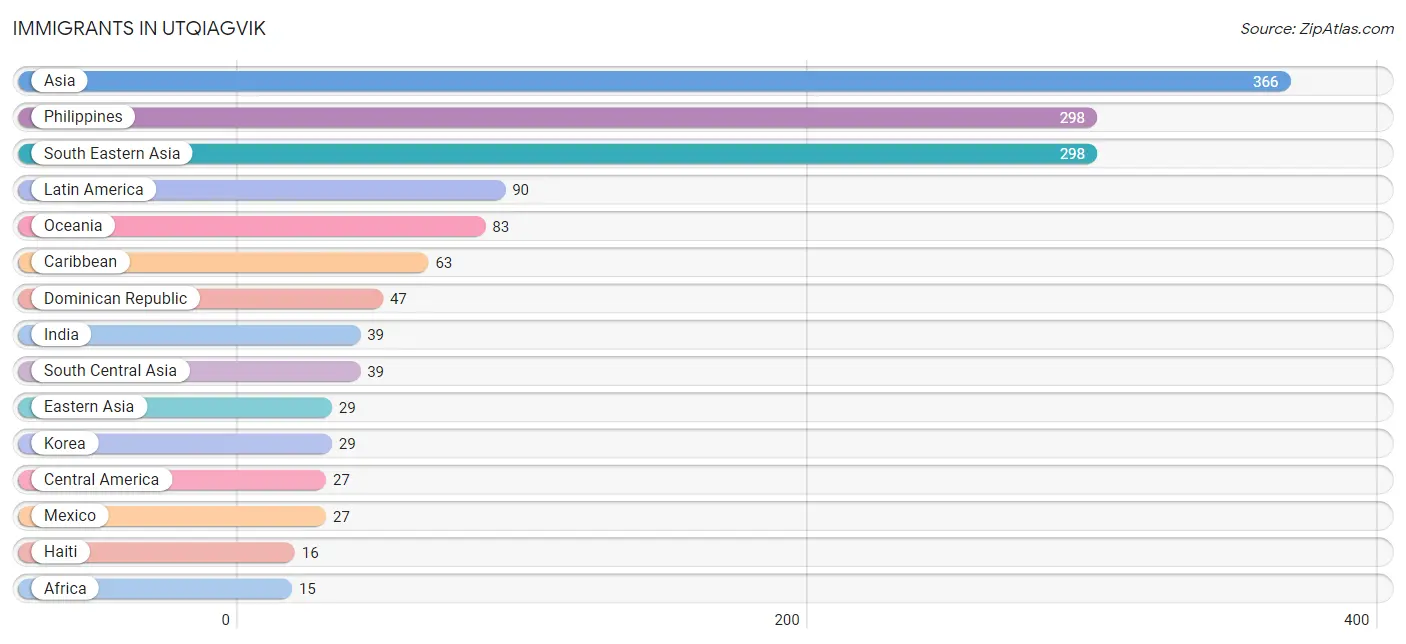
Immigrants in Utqiagvik
The most numerous immigrant groups reported in Utqiagvik came from Asia (366 | 7.5%), Philippines (298 | 6.1%), South Eastern Asia (298 | 6.1%), Latin America (90 | 1.8%), and Oceania (83 | 1.7%), together accounting for 23.3% of all Utqiagvik residents.
| Immigration Origin | # Population | % Population |
| Africa | 15 | 0.3% |
| Asia | 366 | 7.5% |
| Canada | 3 | 0.1% |
| Caribbean | 63 | 1.3% |
| Central America | 27 | 0.5% |
| Dominican Republic | 47 | 1.0% |
| Eastern Africa | 5 | 0.1% |
| Eastern Asia | 29 | 0.6% |
| Eastern Europe | 11 | 0.2% |
| Egypt | 10 | 0.2% |
| Europe | 11 | 0.2% |
| Haiti | 16 | 0.3% |
| India | 39 | 0.8% |
| Korea | 29 | 0.6% |
| Latin America | 90 | 1.8% |
| Mexico | 27 | 0.5% |
| North Macedonia | 11 | 0.2% |
| Northern Africa | 10 | 0.2% |
| Oceania | 83 | 1.7% |
| Philippines | 298 | 6.1% |
| Somalia | 5 | 0.1% |
| South Central Asia | 39 | 0.8% |
| South Eastern Asia | 298 | 6.1% | View All 23 Rows |
Sex and Age in Utqiagvik
Sex and Age in Utqiagvik
The most populous age groups in Utqiagvik are 5 to 9 Years (276 | 11.0%) for men and 10 to 14 Years (299 | 12.6%) for women.
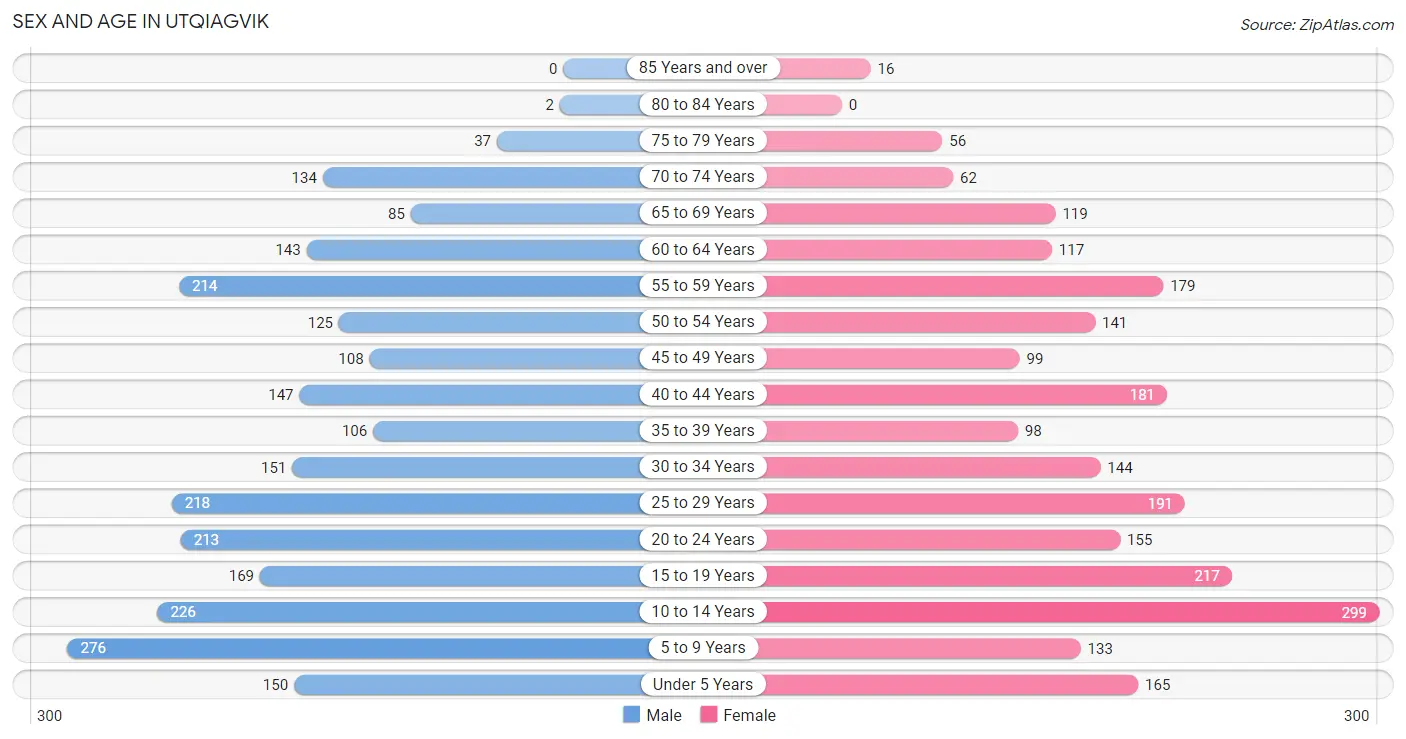
| Age Bracket | Male | Female |
| Under 5 Years | 150 (6.0%) | 165 (7.0%) |
| 5 to 9 Years | 276 (11.0%) | 133 (5.6%) |
| 10 to 14 Years | 226 (9.0%) | 299 (12.6%) |
| 15 to 19 Years | 169 (6.8%) | 217 (9.1%) |
| 20 to 24 Years | 213 (8.5%) | 155 (6.5%) |
| 25 to 29 Years | 218 (8.7%) | 191 (8.1%) |
| 30 to 34 Years | 151 (6.0%) | 144 (6.1%) |
| 35 to 39 Years | 106 (4.2%) | 98 (4.1%) |
| 40 to 44 Years | 147 (5.9%) | 181 (7.6%) |
| 45 to 49 Years | 108 (4.3%) | 99 (4.2%) |
| 50 to 54 Years | 125 (5.0%) | 141 (5.9%) |
| 55 to 59 Years | 214 (8.6%) | 179 (7.5%) |
| 60 to 64 Years | 143 (5.7%) | 117 (4.9%) |
| 65 to 69 Years | 85 (3.4%) | 119 (5.0%) |
| 70 to 74 Years | 134 (5.3%) | 62 (2.6%) |
| 75 to 79 Years | 37 (1.5%) | 56 (2.4%) |
| 80 to 84 Years | 2 (0.1%) | 0 (0.0%) |
| 85 Years and over | 0 (0.0%) | 16 (0.7%) |
| Total | 2,504 (100.0%) | 2,372 (100.0%) |
Families and Households in Utqiagvik
Median Family Size in Utqiagvik
The median family size in Utqiagvik is 3.57 persons per family, with married-couple families (613 | 56.9%) accounting for the largest median family size of 3.8 persons per family. On the other hand, single male/father families (208 | 19.3%) represent the smallest median family size with 3.16 persons per family.
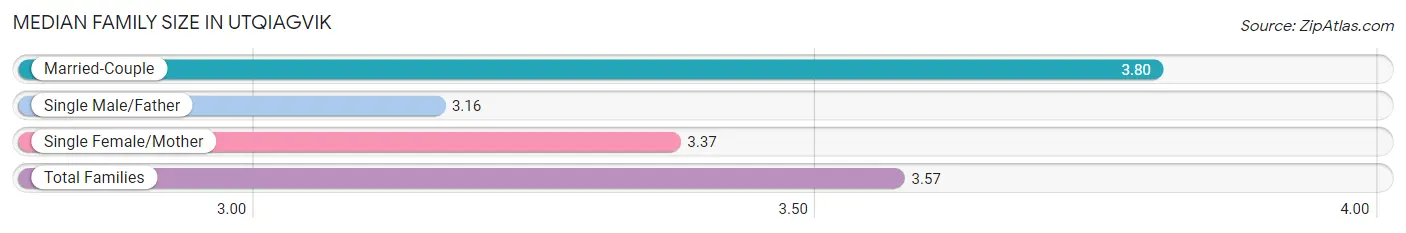
| Family Type | # Families | Family Size |
| Married-Couple | 613 (56.9%) | 3.80 |
| Single Male/Father | 208 (19.3%) | 3.16 |
| Single Female/Mother | 257 (23.8%) | 3.37 |
| Total Families | 1,078 (100.0%) | 3.57 |
Median Household Size in Utqiagvik
The median household size in Utqiagvik is 3.02 persons per household, with married-couple households (613 | 39.1%) accounting for the largest median household size of 3.99 persons per household. non-family households (490 | 31.2%) represent the smallest median household size with 1.32 persons per household.
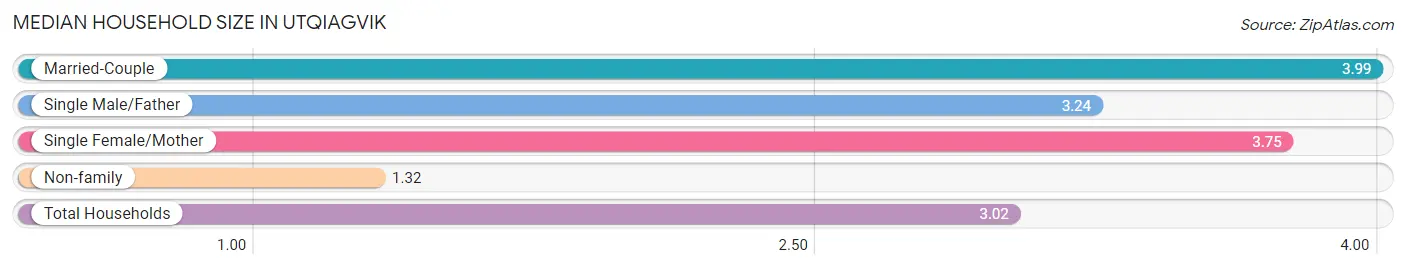
| Household Type | # Households | Household Size |
| Married-Couple | 613 (39.1%) | 3.99 |
| Single Male/Father | 208 (13.3%) | 3.24 |
| Single Female/Mother | 257 (16.4%) | 3.75 |
| Non-family | 490 (31.2%) | 1.32 |
| Total Households | 1,568 (100.0%) | 3.02 |
Household Size by Marriage Status in Utqiagvik
Out of a total of 1,568 households in Utqiagvik, 1,078 (68.8%) are family households, while 490 (31.2%) are nonfamily households. The most numerous type of family households are 2-person households, comprising 296, and the most common type of nonfamily households are 1-person households, comprising 349.
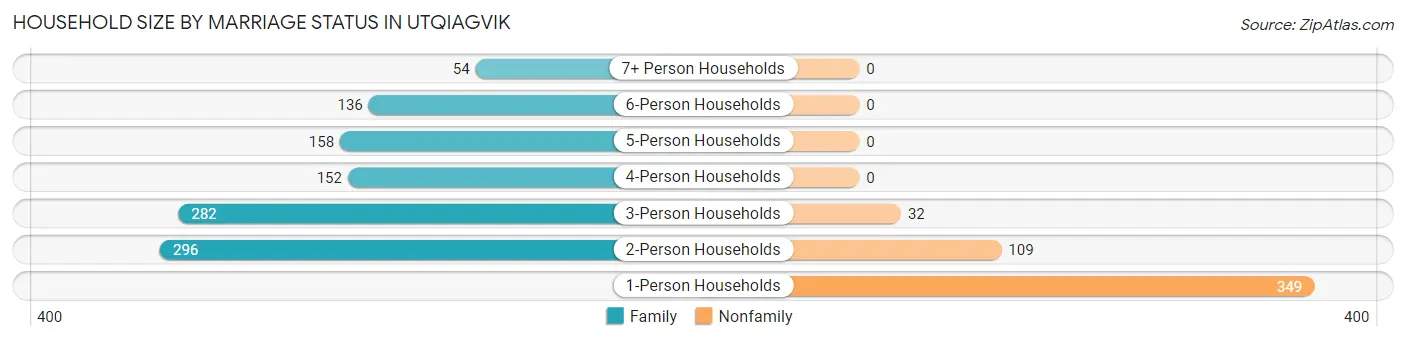
| Household Size | Family Households | Nonfamily Households |
| 1-Person Households | - | 349 (22.3%) |
| 2-Person Households | 296 (18.9%) | 109 (7.0%) |
| 3-Person Households | 282 (18.0%) | 32 (2.0%) |
| 4-Person Households | 152 (9.7%) | 0 (0.0%) |
| 5-Person Households | 158 (10.1%) | 0 (0.0%) |
| 6-Person Households | 136 (8.7%) | 0 (0.0%) |
| 7+ Person Households | 54 (3.4%) | 0 (0.0%) |
| Total | 1,078 (68.8%) | 490 (31.2%) |
Female Fertility in Utqiagvik
Fertility by Age in Utqiagvik
Average fertility rate in Utqiagvik is 17.0 births per 1,000 women. Women in the age bracket of 20 to 34 years have the highest fertility rate with 39.0 births per 1,000 women. Women in the age bracket of 20 to 34 years acount for 100.0% of all women with births.
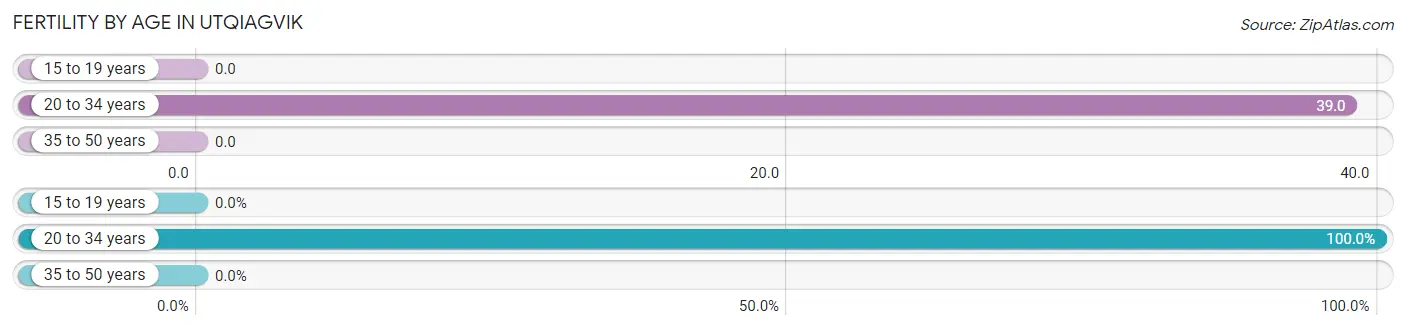
| Age Bracket | Women with Births | Births / 1,000 Women |
| 15 to 19 years | 0 (0.0%) | 0.0 |
| 20 to 34 years | 19 (100.0%) | 39.0 |
| 35 to 50 years | 0 (0.0%) | 0.0 |
| Total | 19 (100.0%) | 17.0 |
Fertility by Age by Marriage Status in Utqiagvik
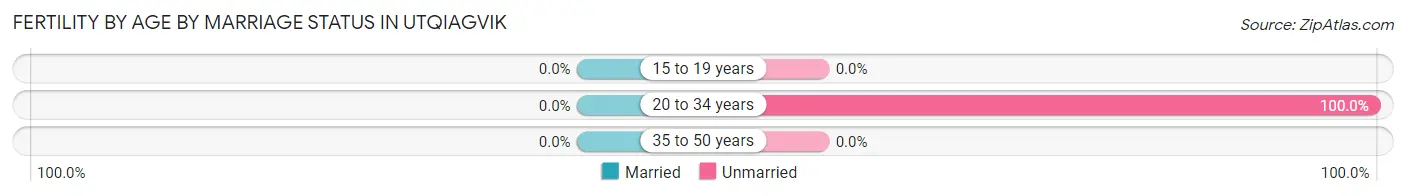
| Age Bracket | Married | Unmarried |
| 15 to 19 years | 0 (0.0%) | 0 (0.0%) |
| 20 to 34 years | 0 (0.0%) | 19 (100.0%) |
| 35 to 50 years | 0 (0.0%) | 0 (0.0%) |
| Total | 0 (0.0%) | 19 (100.0%) |
Fertility by Education in Utqiagvik
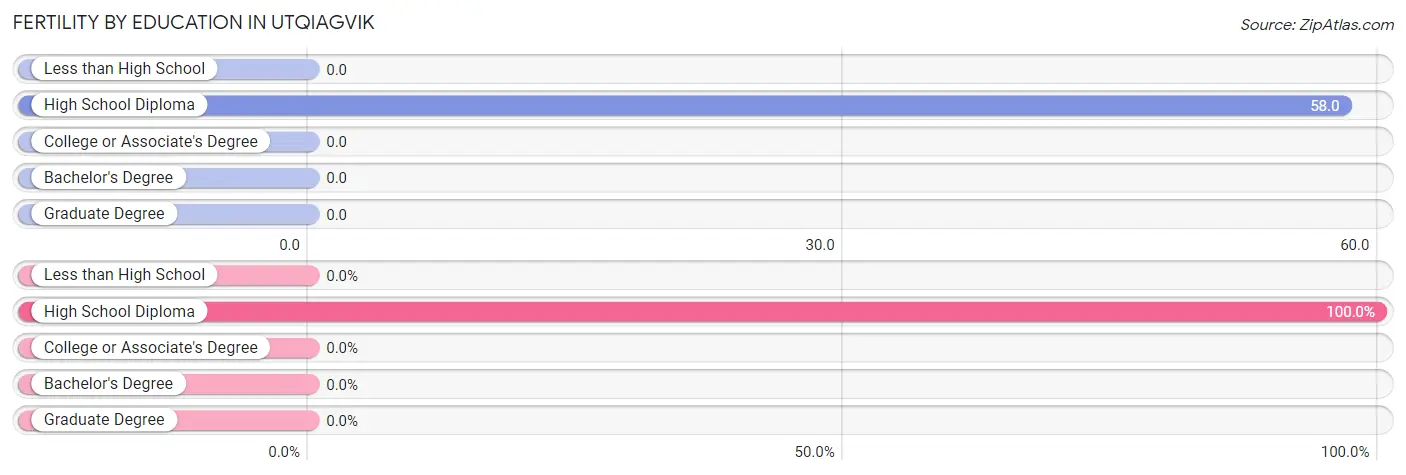
| Educational Attainment | Women with Births | Births / 1,000 Women |
| Less than High School | 0 (0.0%) | 0.0 |
| High School Diploma | 19 (100.0%) | 58.0 |
| College or Associate's Degree | 0 (0.0%) | 0.0 |
| Bachelor's Degree | 0 (0.0%) | 0.0 |
| Graduate Degree | 0 (0.0%) | 0.0 |
| Total | 19 (100.0%) | 17.0 |
Fertility by Education by Marriage Status in Utqiagvik
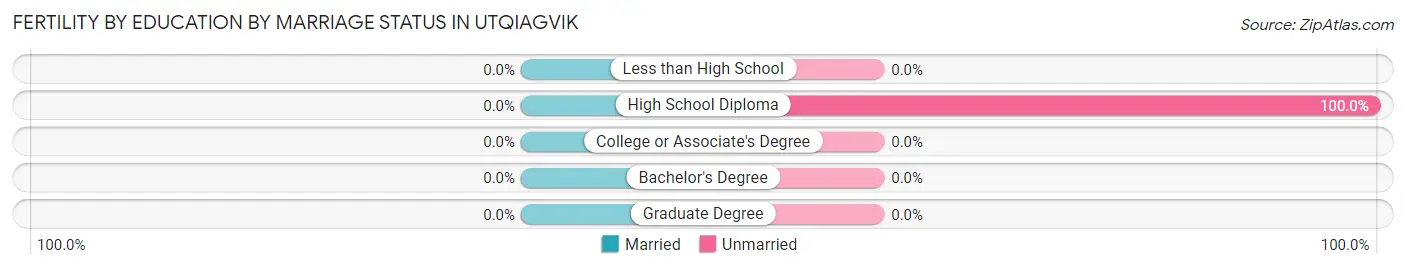
| Educational Attainment | Married | Unmarried |
| Less than High School | 0 (0.0%) | 0 (0.0%) |
| High School Diploma | 0 (0.0%) | 19 (100.0%) |
| College or Associate's Degree | 0 (0.0%) | 0 (0.0%) |
| Bachelor's Degree | 0 (0.0%) | 0 (0.0%) |
| Graduate Degree | 0 (0.0%) | 0 (0.0%) |
| Total | 0 (0.0%) | 19 (100.0%) |
Employment Characteristics in Utqiagvik
Employment by Class of Employer in Utqiagvik
Among the 2,074 employed individuals in Utqiagvik, local government employees (825 | 39.8%), private company employees (769 | 37.1%), and not-for-profit organizations (155 | 7.5%) make up the most common classes of employment.
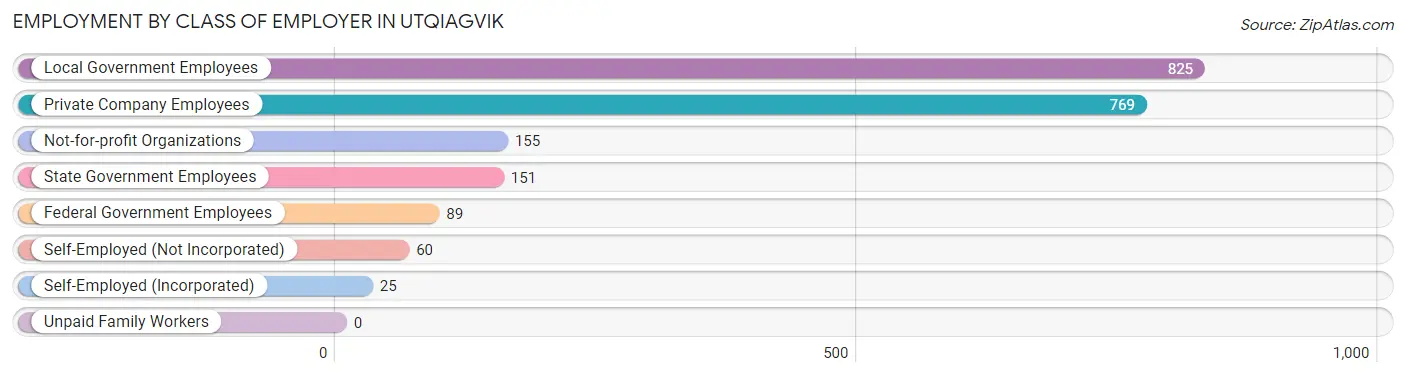
| Employer Class | # Employees | % Employees |
| Private Company Employees | 769 | 37.1% |
| Self-Employed (Incorporated) | 25 | 1.2% |
| Self-Employed (Not Incorporated) | 60 | 2.9% |
| Not-for-profit Organizations | 155 | 7.5% |
| Local Government Employees | 825 | 39.8% |
| State Government Employees | 151 | 7.3% |
| Federal Government Employees | 89 | 4.3% |
| Unpaid Family Workers | 0 | 0.0% |
| Total | 2,074 | 100.0% |
Employment Status by Age in Utqiagvik
According to the labor force statistics for Utqiagvik, out of the total population over 16 years of age (3,586), 65.9% or 2,363 individuals are in the labor force, with 11.5% or 272 of them unemployed. The age group with the highest labor force participation rate is 30 to 34 years, with 89.2% or 263 individuals in the labor force. Within the labor force, the 20 to 24 years age range has the highest percentage of unemployed individuals, with 23.7% or 64 of them being unemployed.
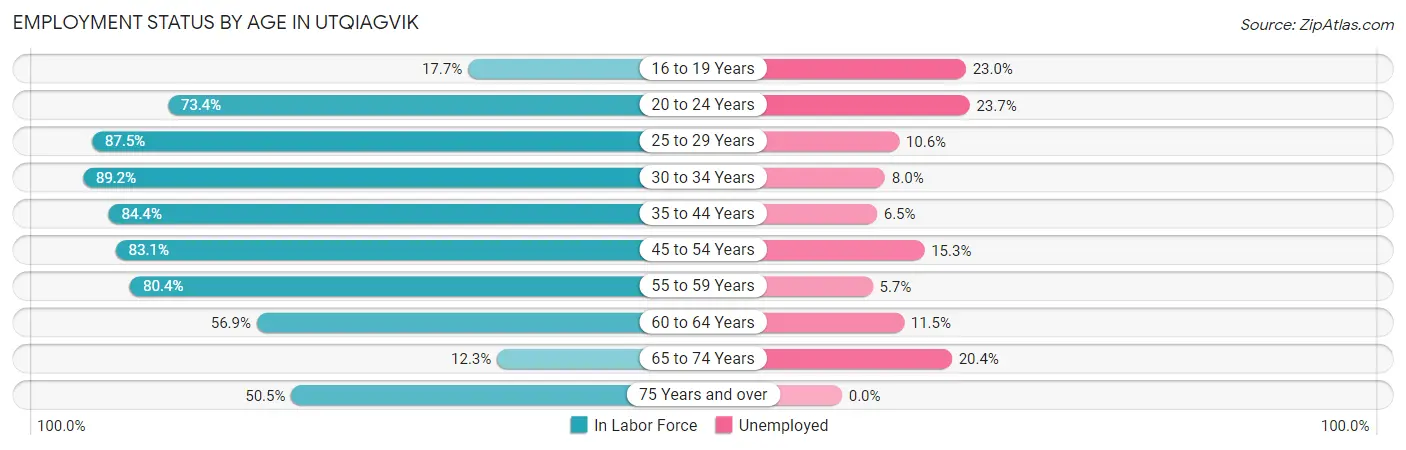
| Age Bracket | In Labor Force | Unemployed |
| 16 to 19 Years | 61 (17.7%) | 14 (23.0%) |
| 20 to 24 Years | 270 (73.4%) | 64 (23.7%) |
| 25 to 29 Years | 358 (87.5%) | 38 (10.6%) |
| 30 to 34 Years | 263 (89.2%) | 21 (8.0%) |
| 35 to 44 Years | 449 (84.4%) | 29 (6.5%) |
| 45 to 54 Years | 393 (83.1%) | 60 (15.3%) |
| 55 to 59 Years | 316 (80.4%) | 18 (5.7%) |
| 60 to 64 Years | 148 (56.9%) | 17 (11.5%) |
| 65 to 74 Years | 49 (12.3%) | 10 (20.4%) |
| 75 Years and over | 56 (50.5%) | 0 (0.0%) |
| Total | 2,363 (65.9%) | 272 (11.5%) |
Employment Status by Educational Attainment in Utqiagvik
According to labor force statistics for Utqiagvik, 81.6% of individuals (1,927) out of the total population between 25 and 64 years of age (2,362) are in the labor force, with 9.5% or 183 of them being unemployed. The group with the highest labor force participation rate are those with the educational attainment of bachelor's degree or higher, with 94.4% or 336 individuals in the labor force. Within the labor force, individuals with less than high school education have the highest percentage of unemployment, with 36.6% or 67 of them being unemployed.
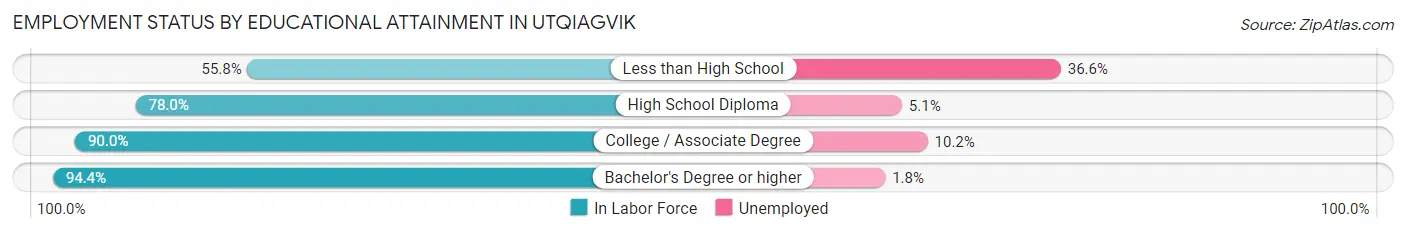
| Educational Attainment | In Labor Force | Unemployed |
| Less than High School | 183 (55.8%) | 120 (36.6%) |
| High School Diploma | 663 (78.0%) | 43 (5.1%) |
| College / Associate Degree | 745 (90.0%) | 84 (10.2%) |
| Bachelor's Degree or higher | 336 (94.4%) | 6 (1.8%) |
| Total | 1,927 (81.6%) | 224 (9.5%) |
Employment Occupations by Sex in Utqiagvik
Management, Business, Science and Arts Occupations
The most common Management, Business, Science and Arts occupations in Utqiagvik are Community & Social Service (389 | 18.6%), Education Instruction & Library (244 | 11.7%), Management (232 | 11.1%), Business & Financial (161 | 7.7%), and Education, Arts & Media (91 | 4.3%).
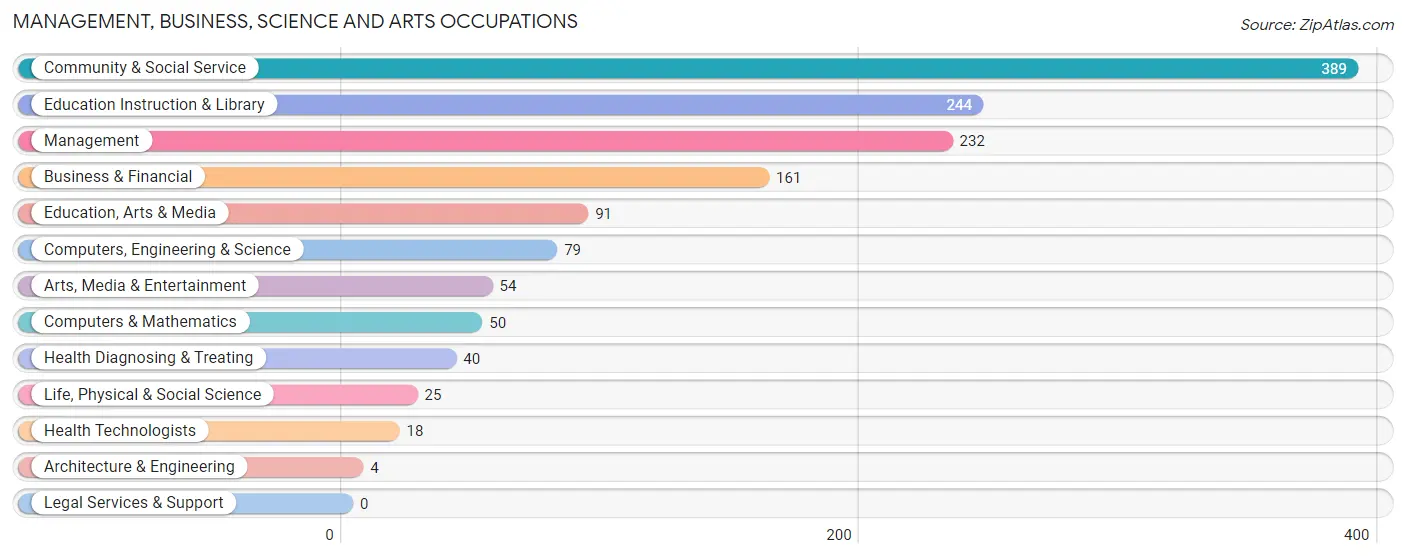
Management, Business, Science and Arts Occupations by Sex
Within the Management, Business, Science and Arts occupations in Utqiagvik, the most male-oriented occupations are Architecture & Engineering (100.0%), Management (39.7%), and Education Instruction & Library (35.7%), while the most female-oriented occupations are Arts, Media & Entertainment (100.0%), Computers & Mathematics (88.0%), and Health Diagnosing & Treating (87.5%).
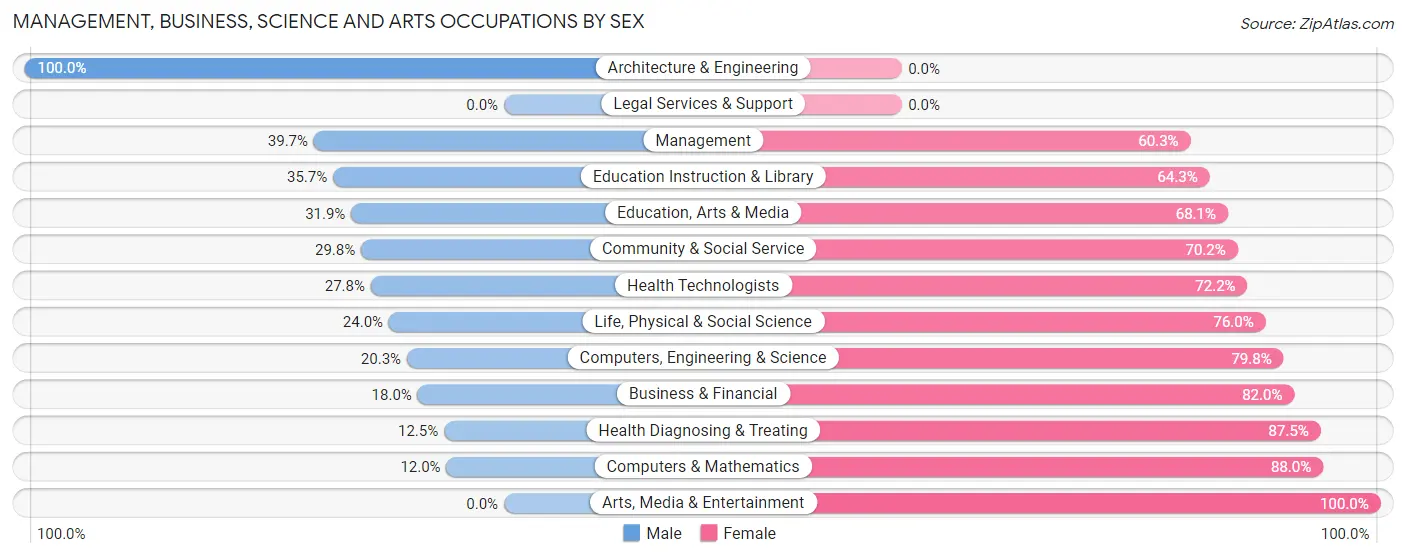
| Occupation | Male | Female |
| Management | 92 (39.7%) | 140 (60.3%) |
| Business & Financial | 29 (18.0%) | 132 (82.0%) |
| Computers, Engineering & Science | 16 (20.3%) | 63 (79.7%) |
| Computers & Mathematics | 6 (12.0%) | 44 (88.0%) |
| Architecture & Engineering | 4 (100.0%) | 0 (0.0%) |
| Life, Physical & Social Science | 6 (24.0%) | 19 (76.0%) |
| Community & Social Service | 116 (29.8%) | 273 (70.2%) |
| Education, Arts & Media | 29 (31.9%) | 62 (68.1%) |
| Legal Services & Support | 0 (0.0%) | 0 (0.0%) |
| Education Instruction & Library | 87 (35.7%) | 157 (64.3%) |
| Arts, Media & Entertainment | 0 (0.0%) | 54 (100.0%) |
| Health Diagnosing & Treating | 5 (12.5%) | 35 (87.5%) |
| Health Technologists | 5 (27.8%) | 13 (72.2%) |
| Total (Category) | 258 (28.6%) | 643 (71.4%) |
| Total (Overall) | 1,003 (47.9%) | 1,089 (52.1%) |
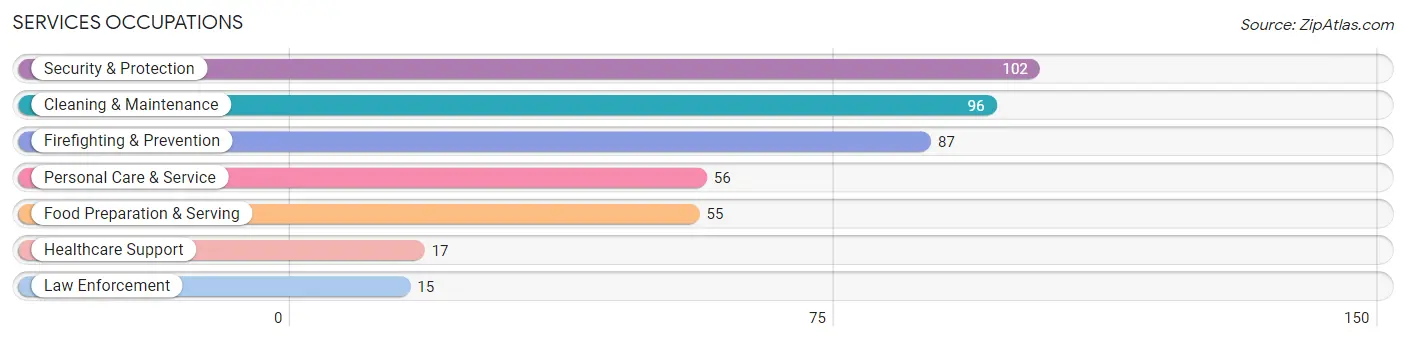
Services Occupations
The most common Services occupations in Utqiagvik are Security & Protection (102 | 4.9%), Cleaning & Maintenance (96 | 4.6%), Firefighting & Prevention (87 | 4.2%), Personal Care & Service (56 | 2.7%), and Food Preparation & Serving (55 | 2.6%).
Services Occupations by Sex
Within the Services occupations in Utqiagvik, the most male-oriented occupations are Healthcare Support (100.0%), Firefighting & Prevention (100.0%), and Security & Protection (97.1%), while the most female-oriented occupations are Law Enforcement (20.0%), Cleaning & Maintenance (17.7%), and Food Preparation & Serving (16.4%).
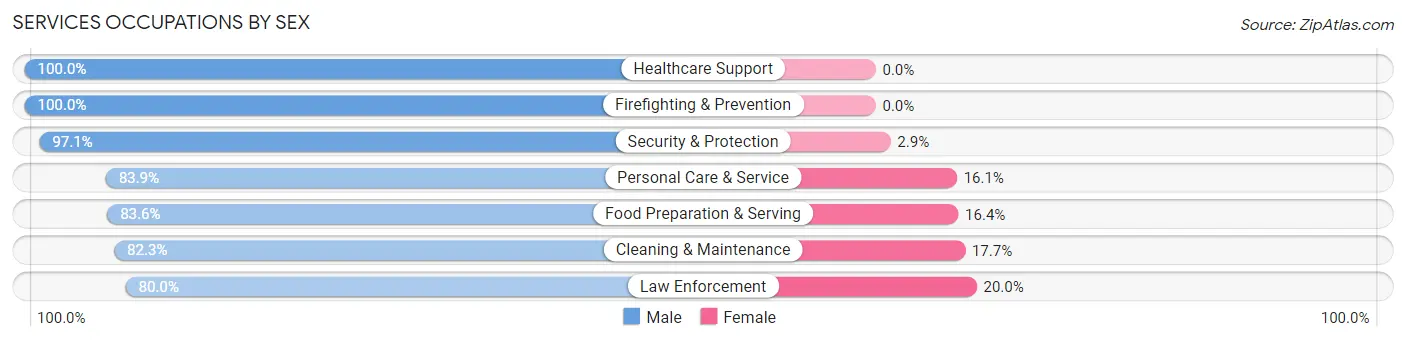
| Occupation | Male | Female |
| Healthcare Support | 17 (100.0%) | 0 (0.0%) |
| Security & Protection | 99 (97.1%) | 3 (2.9%) |
| Firefighting & Prevention | 87 (100.0%) | 0 (0.0%) |
| Law Enforcement | 12 (80.0%) | 3 (20.0%) |
| Food Preparation & Serving | 46 (83.6%) | 9 (16.4%) |
| Cleaning & Maintenance | 79 (82.3%) | 17 (17.7%) |
| Personal Care & Service | 47 (83.9%) | 9 (16.1%) |
| Total (Category) | 288 (88.3%) | 38 (11.7%) |
| Total (Overall) | 1,003 (47.9%) | 1,089 (52.1%) |
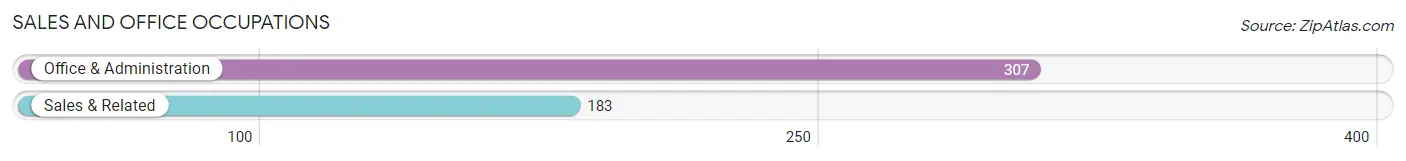
Sales and Office Occupations
The most common Sales and Office occupations in Utqiagvik are Office & Administration (307 | 14.7%), and Sales & Related (183 | 8.7%).
Sales and Office Occupations by Sex
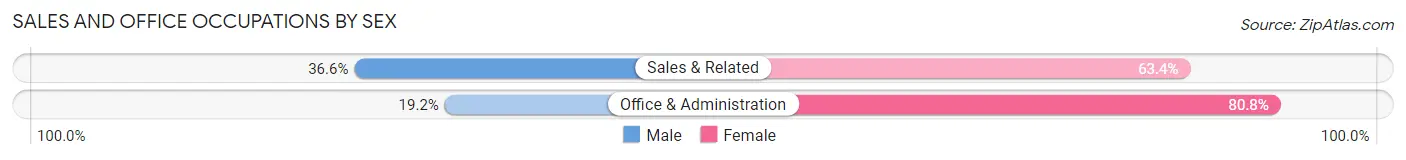
| Occupation | Male | Female |
| Sales & Related | 67 (36.6%) | 116 (63.4%) |
| Office & Administration | 59 (19.2%) | 248 (80.8%) |
| Total (Category) | 126 (25.7%) | 364 (74.3%) |
| Total (Overall) | 1,003 (47.9%) | 1,089 (52.1%) |
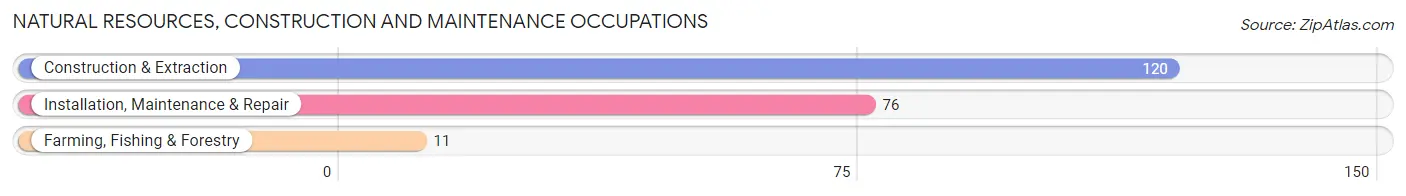
Natural Resources, Construction and Maintenance Occupations
The most common Natural Resources, Construction and Maintenance occupations in Utqiagvik are Construction & Extraction (120 | 5.7%), Installation, Maintenance & Repair (76 | 3.6%), and Farming, Fishing & Forestry (11 | 0.5%).
Natural Resources, Construction and Maintenance Occupations by Sex
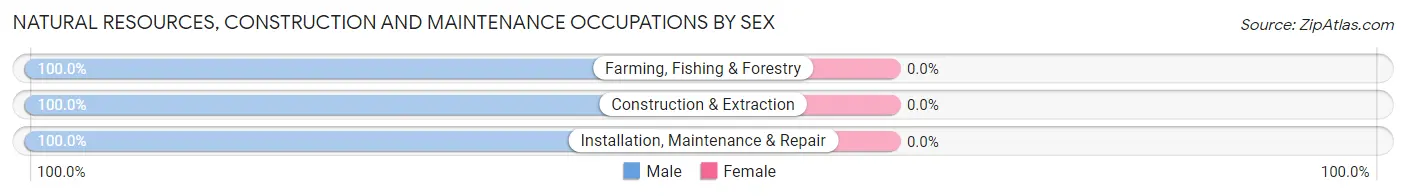
| Occupation | Male | Female |
| Farming, Fishing & Forestry | 11 (100.0%) | 0 (0.0%) |
| Construction & Extraction | 120 (100.0%) | 0 (0.0%) |
| Installation, Maintenance & Repair | 76 (100.0%) | 0 (0.0%) |
| Total (Category) | 207 (100.0%) | 0 (0.0%) |
| Total (Overall) | 1,003 (47.9%) | 1,089 (52.1%) |
Production, Transportation and Moving Occupations
The most common Production, Transportation and Moving occupations in Utqiagvik are Transportation (88 | 4.2%), Material Moving (42 | 2.0%), and Production (38 | 1.8%).
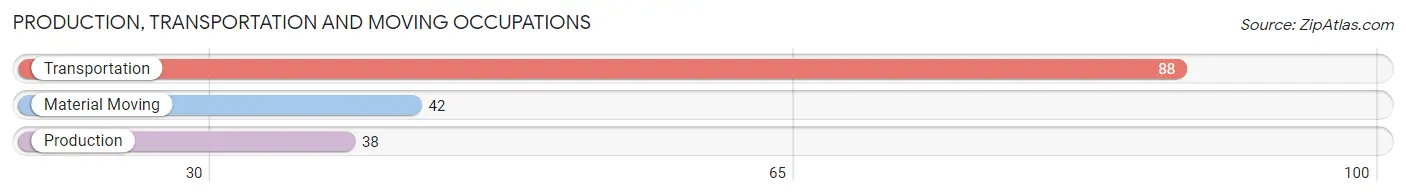
Production, Transportation and Moving Occupations by Sex
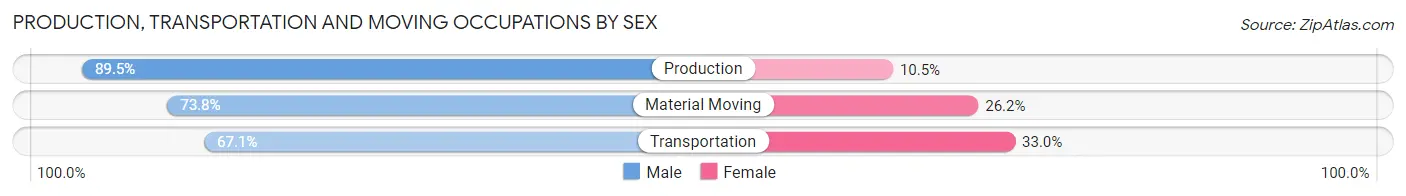
| Occupation | Male | Female |
| Production | 34 (89.5%) | 4 (10.5%) |
| Transportation | 59 (67.0%) | 29 (33.0%) |
| Material Moving | 31 (73.8%) | 11 (26.2%) |
| Total (Category) | 124 (73.8%) | 44 (26.2%) |
| Total (Overall) | 1,003 (47.9%) | 1,089 (52.1%) |
Employment Industries by Sex in Utqiagvik
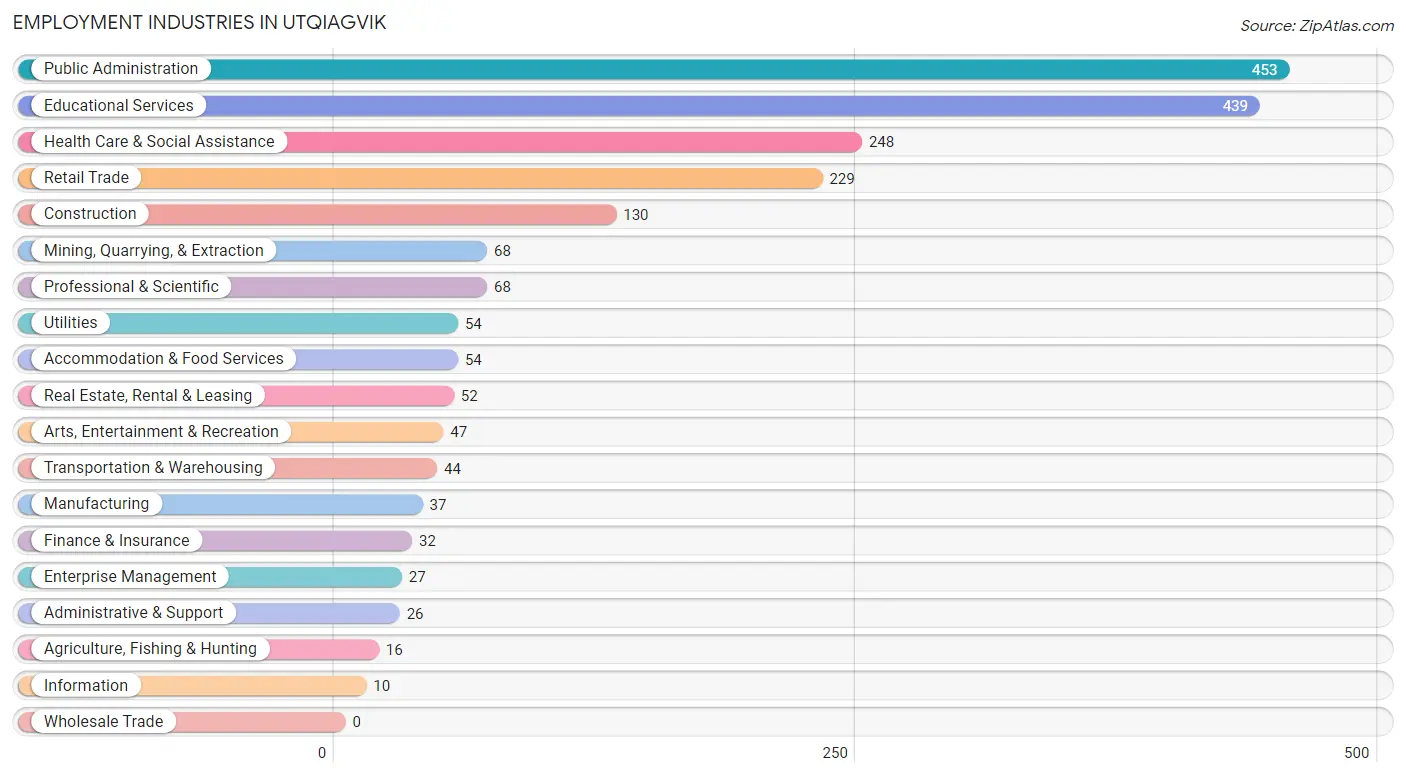
Employment Industries in Utqiagvik
The major employment industries in Utqiagvik include Public Administration (453 | 21.6%), Educational Services (439 | 21.0%), Health Care & Social Assistance (248 | 11.8%), Retail Trade (229 | 11.0%), and Construction (130 | 6.2%).
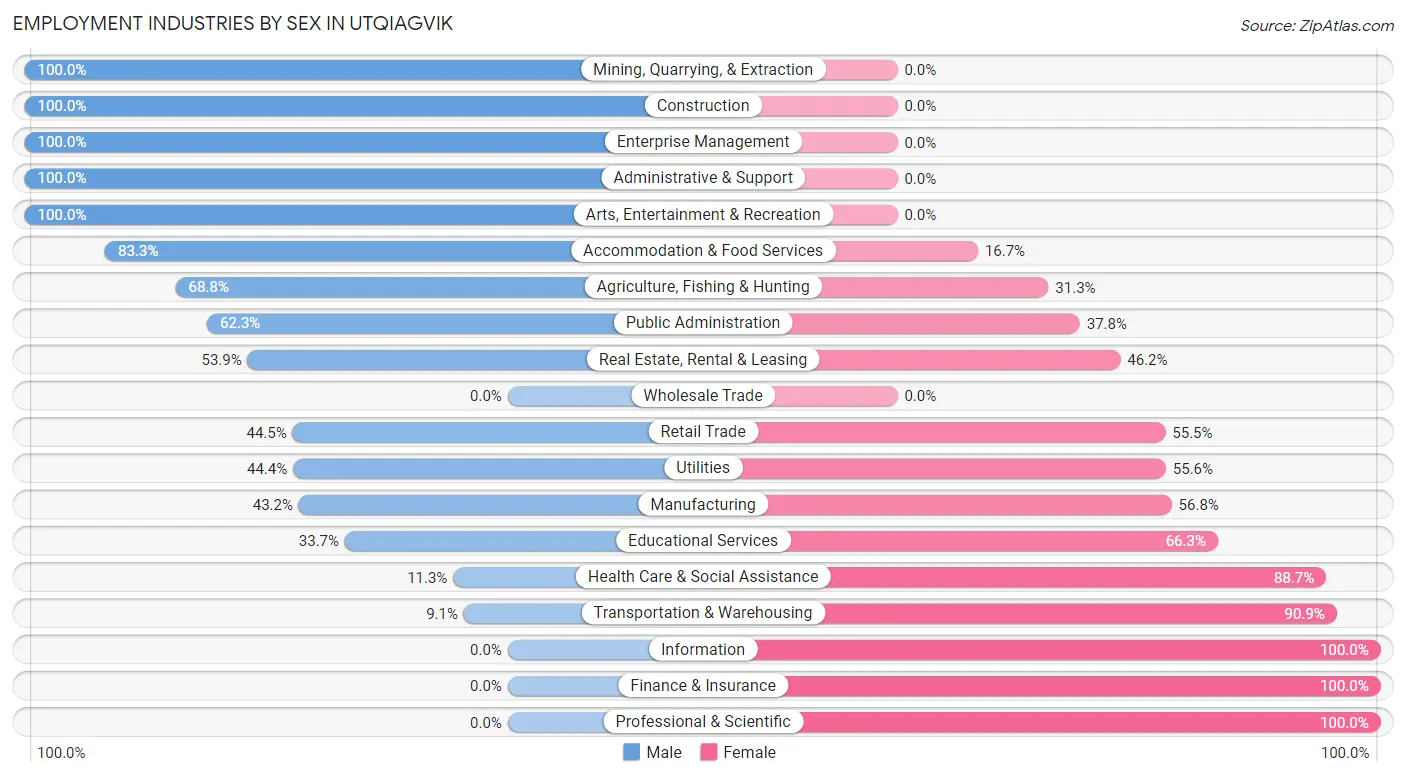
Employment Industries by Sex in Utqiagvik
The Utqiagvik industries that see more men than women are Mining, Quarrying, & Extraction (100.0%), Construction (100.0%), and Enterprise Management (100.0%), whereas the industries that tend to have a higher number of women are Information (100.0%), Finance & Insurance (100.0%), and Professional & Scientific (100.0%).
| Industry | Male | Female |
| Agriculture, Fishing & Hunting | 11 (68.8%) | 5 (31.2%) |
| Mining, Quarrying, & Extraction | 68 (100.0%) | 0 (0.0%) |
| Construction | 130 (100.0%) | 0 (0.0%) |
| Manufacturing | 16 (43.2%) | 21 (56.8%) |
| Wholesale Trade | 0 (0.0%) | 0 (0.0%) |
| Retail Trade | 102 (44.5%) | 127 (55.5%) |
| Transportation & Warehousing | 4 (9.1%) | 40 (90.9%) |
| Utilities | 24 (44.4%) | 30 (55.6%) |
| Information | 0 (0.0%) | 10 (100.0%) |
| Finance & Insurance | 0 (0.0%) | 32 (100.0%) |
| Real Estate, Rental & Leasing | 28 (53.8%) | 24 (46.2%) |
| Professional & Scientific | 0 (0.0%) | 68 (100.0%) |
| Enterprise Management | 27 (100.0%) | 0 (0.0%) |
| Administrative & Support | 26 (100.0%) | 0 (0.0%) |
| Educational Services | 148 (33.7%) | 291 (66.3%) |
| Health Care & Social Assistance | 28 (11.3%) | 220 (88.7%) |
| Arts, Entertainment & Recreation | 47 (100.0%) | 0 (0.0%) |
| Accommodation & Food Services | 45 (83.3%) | 9 (16.7%) |
| Public Administration | 282 (62.3%) | 171 (37.8%) |
| Total | 1,003 (47.9%) | 1,089 (52.1%) |
Education in Utqiagvik
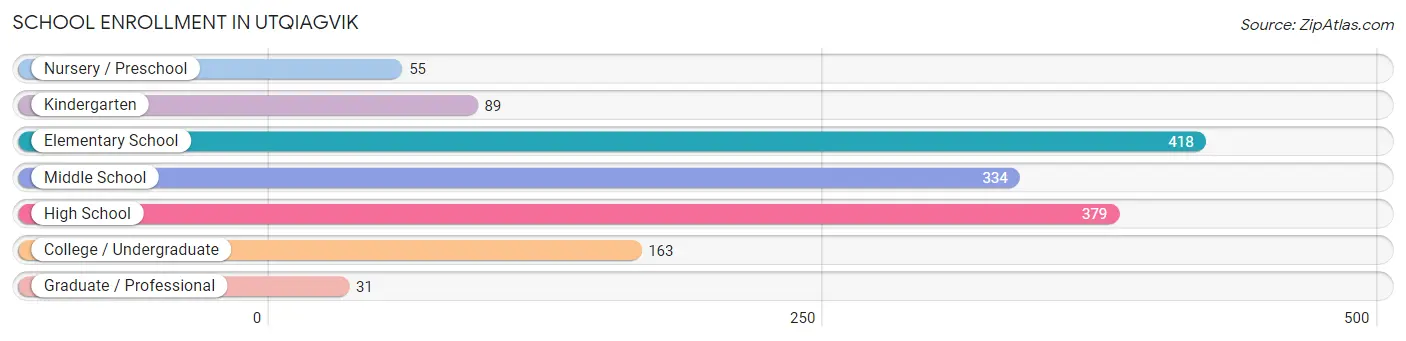
School Enrollment in Utqiagvik
The most common levels of schooling among the 1,469 students in Utqiagvik are elementary school (418 | 28.4%), high school (379 | 25.8%), and middle school (334 | 22.7%).
| School Level | # Students | % Students |
| Nursery / Preschool | 55 | 3.7% |
| Kindergarten | 89 | 6.1% |
| Elementary School | 418 | 28.4% |
| Middle School | 334 | 22.7% |
| High School | 379 | 25.8% |
| College / Undergraduate | 163 | 11.1% |
| Graduate / Professional | 31 | 2.1% |
| Total | 1,469 | 100.0% |
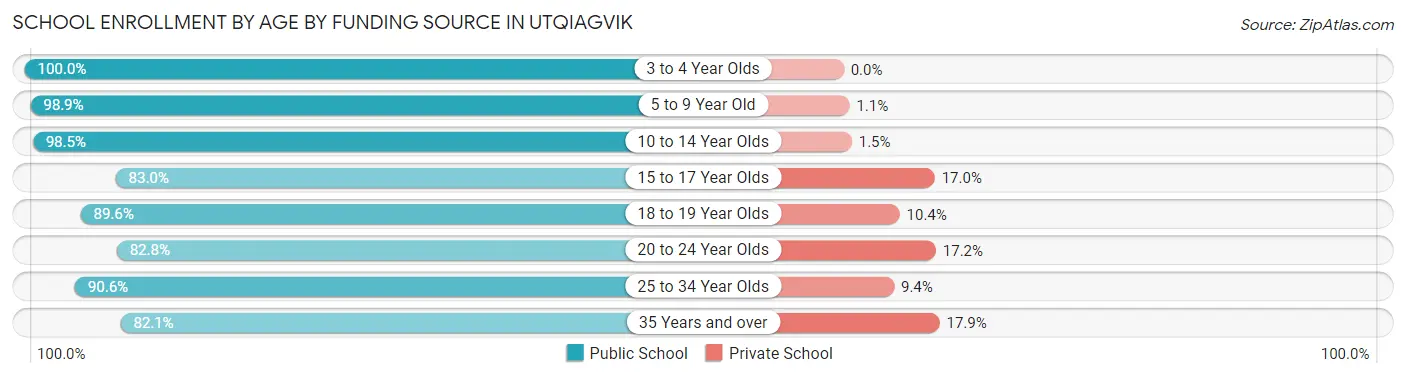
School Enrollment by Age by Funding Source in Utqiagvik
Out of a total of 1,469 students who are enrolled in schools in Utqiagvik, 98 (6.7%) attend a private institution, while the remaining 1,371 (93.3%) are enrolled in public schools. The age group of 35 years and over has the highest likelihood of being enrolled in private schools, with 10 (17.9% in the age bracket) enrolled. Conversely, the age group of 3 to 4 year olds has the lowest likelihood of being enrolled in a private school, with 78 (100.0% in the age bracket) attending a public institution.
| Age Bracket | Public School | Private School |
| 3 to 4 Year Olds | 78 (100.0%) | 0 (0.0%) |
| 5 to 9 Year Old | 368 (98.9%) | 4 (1.1%) |
| 10 to 14 Year Olds | 456 (98.5%) | 7 (1.5%) |
| 15 to 17 Year Olds | 240 (83.0%) | 49 (17.0%) |
| 18 to 19 Year Olds | 43 (89.6%) | 5 (10.4%) |
| 20 to 24 Year Olds | 82 (82.8%) | 17 (17.2%) |
| 25 to 34 Year Olds | 58 (90.6%) | 6 (9.4%) |
| 35 Years and over | 46 (82.1%) | 10 (17.9%) |
| Total | 1,371 (93.3%) | 98 (6.7%) |
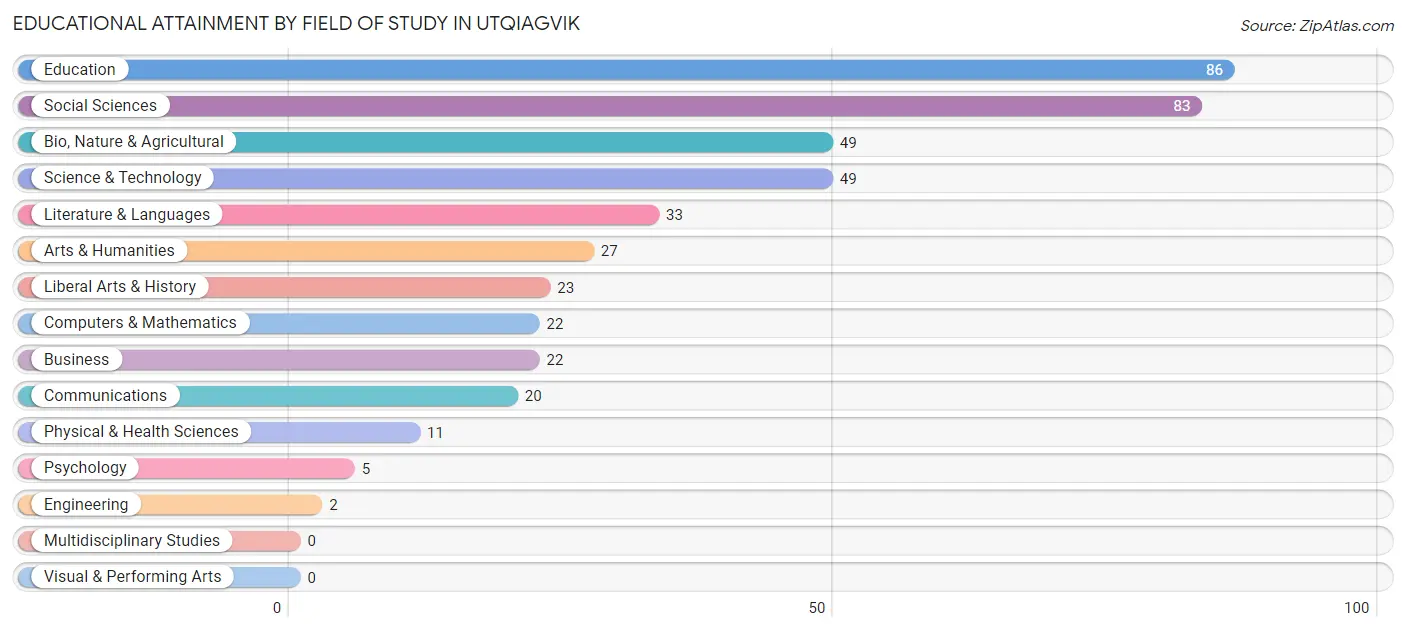
Educational Attainment by Field of Study in Utqiagvik
Education (86 | 19.9%), social sciences (83 | 19.2%), bio, nature & agricultural (49 | 11.3%), science & technology (49 | 11.3%), and literature & languages (33 | 7.6%) are the most common fields of study among 432 individuals in Utqiagvik who have obtained a bachelor's degree or higher.
| Field of Study | # Graduates | % Graduates |
| Computers & Mathematics | 22 | 5.1% |
| Bio, Nature & Agricultural | 49 | 11.3% |
| Physical & Health Sciences | 11 | 2.5% |
| Psychology | 5 | 1.2% |
| Social Sciences | 83 | 19.2% |
| Engineering | 2 | 0.5% |
| Multidisciplinary Studies | 0 | 0.0% |
| Science & Technology | 49 | 11.3% |
| Business | 22 | 5.1% |
| Education | 86 | 19.9% |
| Literature & Languages | 33 | 7.6% |
| Liberal Arts & History | 23 | 5.3% |
| Visual & Performing Arts | 0 | 0.0% |
| Communications | 20 | 4.6% |
| Arts & Humanities | 27 | 6.2% |
| Total | 432 | 100.0% |
Transportation & Commute in Utqiagvik
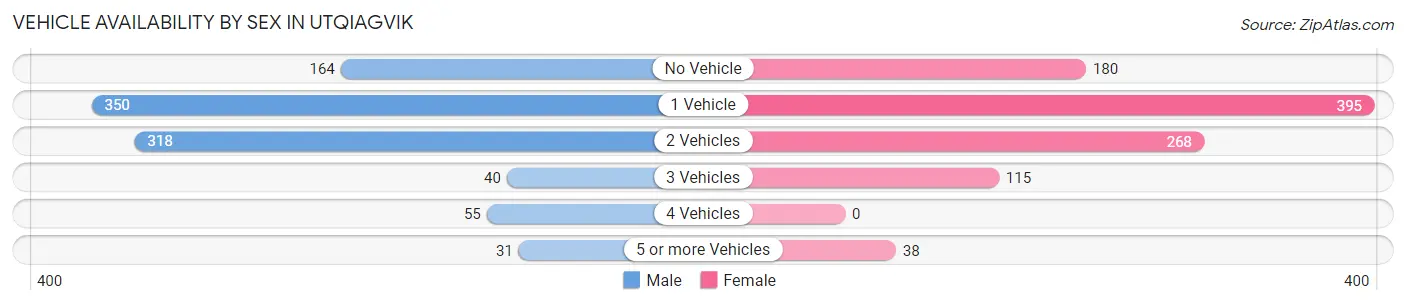
Vehicle Availability by Sex in Utqiagvik
The most prevalent vehicle ownership categories in Utqiagvik are males with 1 vehicle (350, accounting for 36.5%) and females with 1 vehicle (395, making up 35.1%).
| Vehicles Available | Male | Female |
| No Vehicle | 164 (17.1%) | 180 (18.1%) |
| 1 Vehicle | 350 (36.5%) | 395 (39.7%) |
| 2 Vehicles | 318 (33.2%) | 268 (26.9%) |
| 3 Vehicles | 40 (4.2%) | 115 (11.6%) |
| 4 Vehicles | 55 (5.7%) | 0 (0.0%) |
| 5 or more Vehicles | 31 (3.2%) | 38 (3.8%) |
| Total | 958 (100.0%) | 996 (100.0%) |
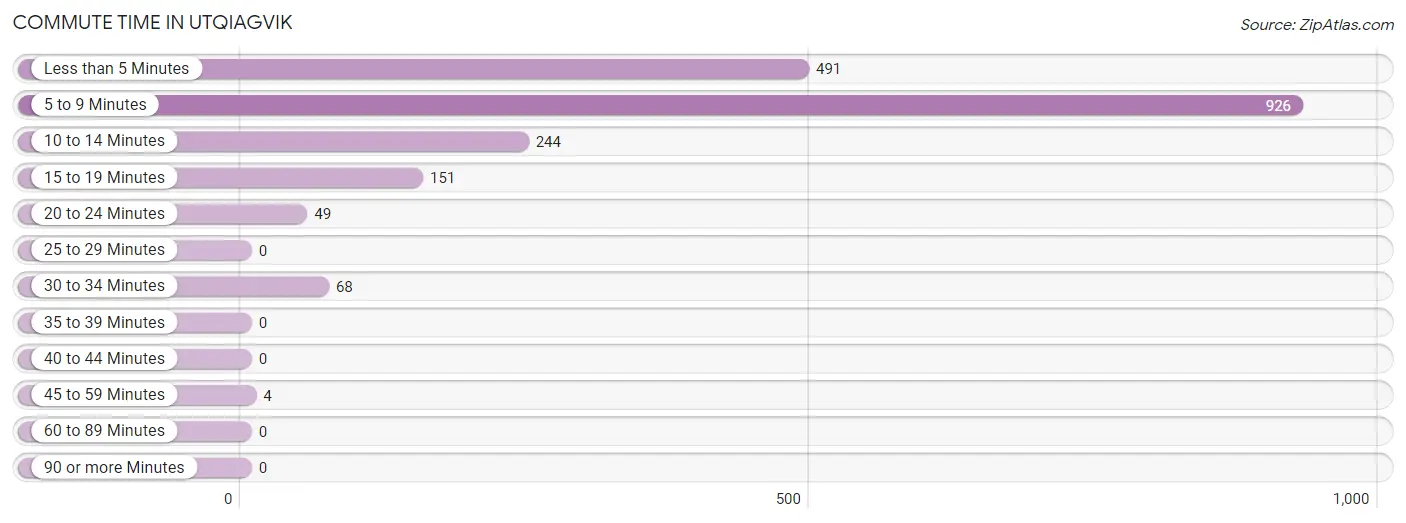
Commute Time in Utqiagvik
The most frequently occuring commute durations in Utqiagvik are 5 to 9 minutes (926 commuters, 47.9%), less than 5 minutes (491 commuters, 25.4%), and 10 to 14 minutes (244 commuters, 12.6%).
| Commute Time | # Commuters | % Commuters |
| Less than 5 Minutes | 491 | 25.4% |
| 5 to 9 Minutes | 926 | 47.9% |
| 10 to 14 Minutes | 244 | 12.6% |
| 15 to 19 Minutes | 151 | 7.8% |
| 20 to 24 Minutes | 49 | 2.5% |
| 25 to 29 Minutes | 0 | 0.0% |
| 30 to 34 Minutes | 68 | 3.5% |
| 35 to 39 Minutes | 0 | 0.0% |
| 40 to 44 Minutes | 0 | 0.0% |
| 45 to 59 Minutes | 4 | 0.2% |
| 60 to 89 Minutes | 0 | 0.0% |
| 90 or more Minutes | 0 | 0.0% |
Commute Time by Sex in Utqiagvik
The most common commute times in Utqiagvik are 5 to 9 minutes (461 commuters, 47.2%) for males and 5 to 9 minutes (465 commuters, 48.6%) for females.
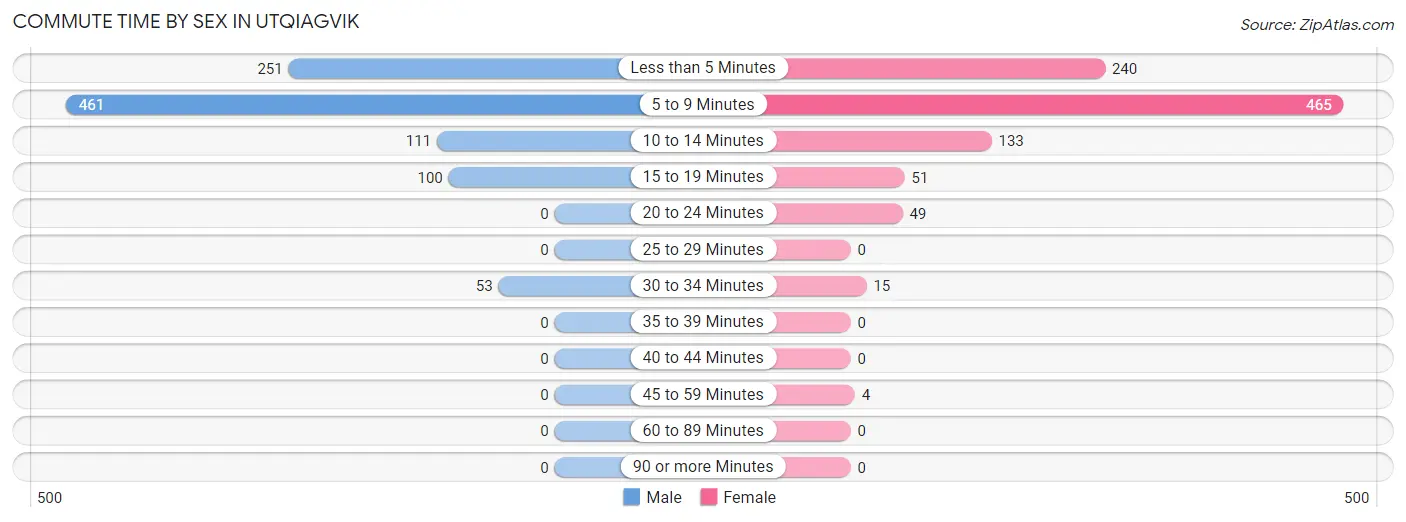
| Commute Time | Male | Female |
| Less than 5 Minutes | 251 (25.7%) | 240 (25.1%) |
| 5 to 9 Minutes | 461 (47.2%) | 465 (48.6%) |
| 10 to 14 Minutes | 111 (11.4%) | 133 (13.9%) |
| 15 to 19 Minutes | 100 (10.2%) | 51 (5.3%) |
| 20 to 24 Minutes | 0 (0.0%) | 49 (5.1%) |
| 25 to 29 Minutes | 0 (0.0%) | 0 (0.0%) |
| 30 to 34 Minutes | 53 (5.4%) | 15 (1.6%) |
| 35 to 39 Minutes | 0 (0.0%) | 0 (0.0%) |
| 40 to 44 Minutes | 0 (0.0%) | 0 (0.0%) |
| 45 to 59 Minutes | 0 (0.0%) | 4 (0.4%) |
| 60 to 89 Minutes | 0 (0.0%) | 0 (0.0%) |
| 90 or more Minutes | 0 (0.0%) | 0 (0.0%) |
Time of Departure to Work by Sex in Utqiagvik
The most frequent times of departure to work in Utqiagvik are 8:00 AM to 8:29 AM (233, 23.9%) for males and 8:00 AM to 8:29 AM (270, 28.2%) for females.
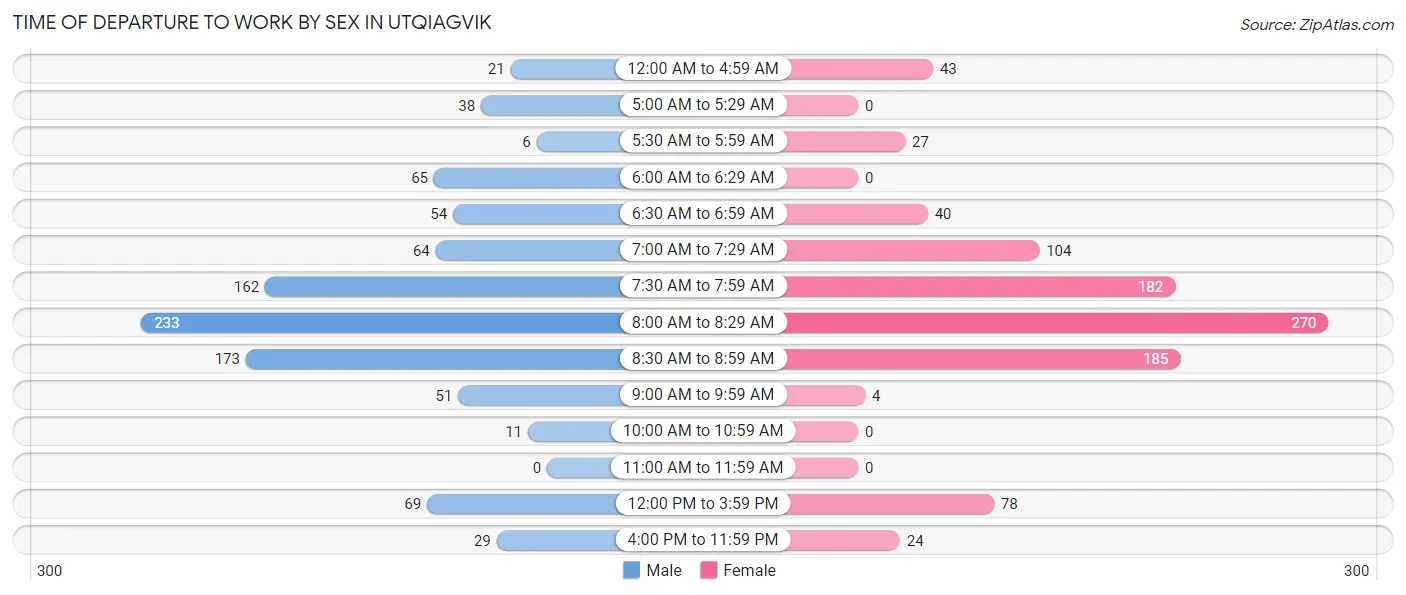
| Time of Departure | Male | Female |
| 12:00 AM to 4:59 AM | 21 (2.1%) | 43 (4.5%) |
| 5:00 AM to 5:29 AM | 38 (3.9%) | 0 (0.0%) |
| 5:30 AM to 5:59 AM | 6 (0.6%) | 27 (2.8%) |
| 6:00 AM to 6:29 AM | 65 (6.7%) | 0 (0.0%) |
| 6:30 AM to 6:59 AM | 54 (5.5%) | 40 (4.2%) |
| 7:00 AM to 7:29 AM | 64 (6.6%) | 104 (10.9%) |
| 7:30 AM to 7:59 AM | 162 (16.6%) | 182 (19.0%) |
| 8:00 AM to 8:29 AM | 233 (23.9%) | 270 (28.2%) |
| 8:30 AM to 8:59 AM | 173 (17.7%) | 185 (19.3%) |
| 9:00 AM to 9:59 AM | 51 (5.2%) | 4 (0.4%) |
| 10:00 AM to 10:59 AM | 11 (1.1%) | 0 (0.0%) |
| 11:00 AM to 11:59 AM | 0 (0.0%) | 0 (0.0%) |
| 12:00 PM to 3:59 PM | 69 (7.1%) | 78 (8.2%) |
| 4:00 PM to 11:59 PM | 29 (3.0%) | 24 (2.5%) |
| Total | 976 (100.0%) | 957 (100.0%) |
Housing Occupancy in Utqiagvik
Occupancy by Ownership in Utqiagvik
Of the total 1,568 dwellings in Utqiagvik, owner-occupied units account for 611 (39.0%), while renter-occupied units make up 957 (61.0%).
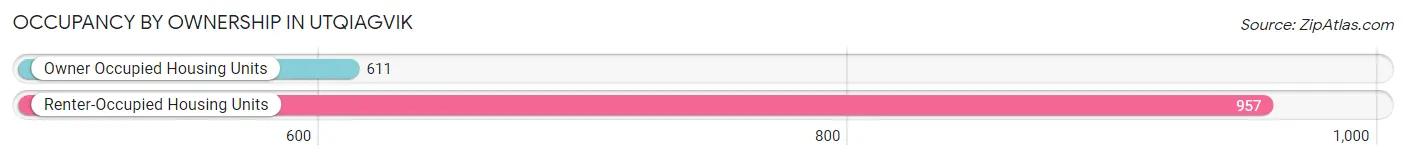
| Occupancy | # Housing Units | % Housing Units |
| Owner Occupied Housing Units | 611 | 39.0% |
| Renter-Occupied Housing Units | 957 | 61.0% |
| Total Occupied Housing Units | 1,568 | 100.0% |
Occupancy by Household Size in Utqiagvik
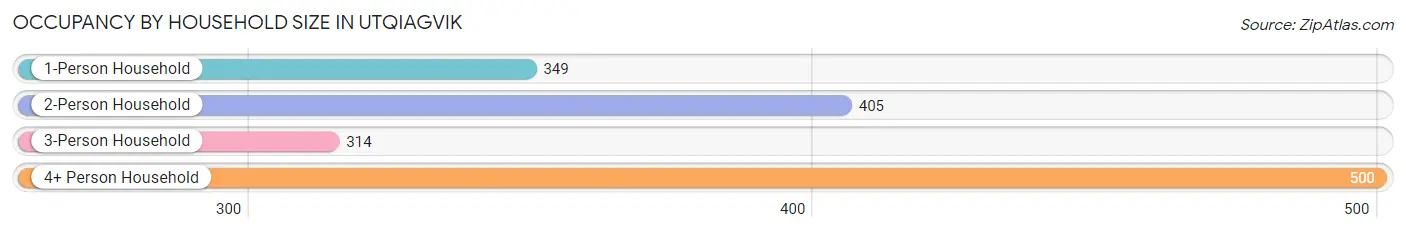
| Household Size | # Housing Units | % Housing Units |
| 1-Person Household | 349 | 22.3% |
| 2-Person Household | 405 | 25.8% |
| 3-Person Household | 314 | 20.0% |
| 4+ Person Household | 500 | 31.9% |
| Total Housing Units | 1,568 | 100.0% |
Occupancy by Ownership by Household Size in Utqiagvik
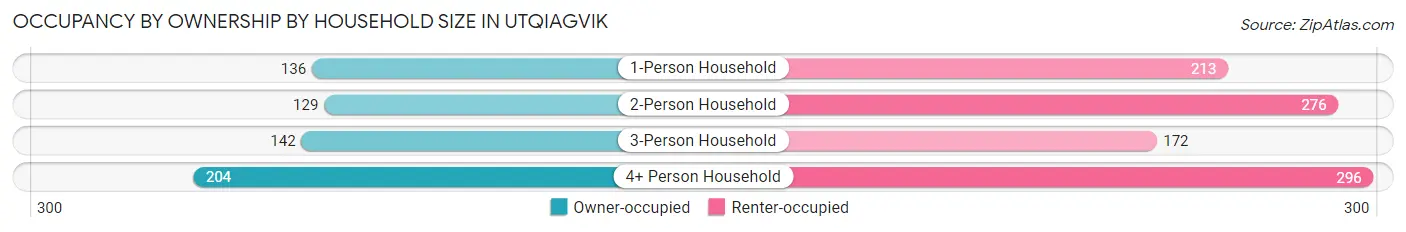
| Household Size | Owner-occupied | Renter-occupied |
| 1-Person Household | 136 (39.0%) | 213 (61.0%) |
| 2-Person Household | 129 (31.9%) | 276 (68.1%) |
| 3-Person Household | 142 (45.2%) | 172 (54.8%) |
| 4+ Person Household | 204 (40.8%) | 296 (59.2%) |
| Total Housing Units | 611 (39.0%) | 957 (61.0%) |
Occupancy by Educational Attainment in Utqiagvik
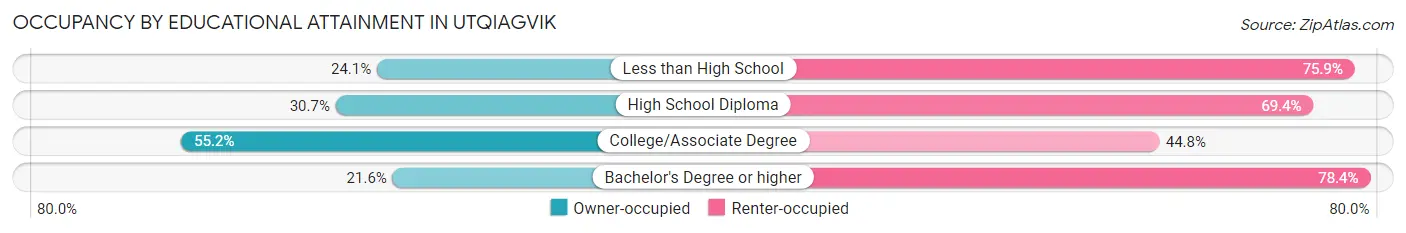
| Household Size | Owner-occupied | Renter-occupied |
| Less than High School | 40 (24.1%) | 126 (75.9%) |
| High School Diploma | 160 (30.6%) | 362 (69.4%) |
| College/Associate Degree | 363 (55.2%) | 295 (44.8%) |
| Bachelor's Degree or higher | 48 (21.6%) | 174 (78.4%) |
Occupancy by Age of Householder in Utqiagvik
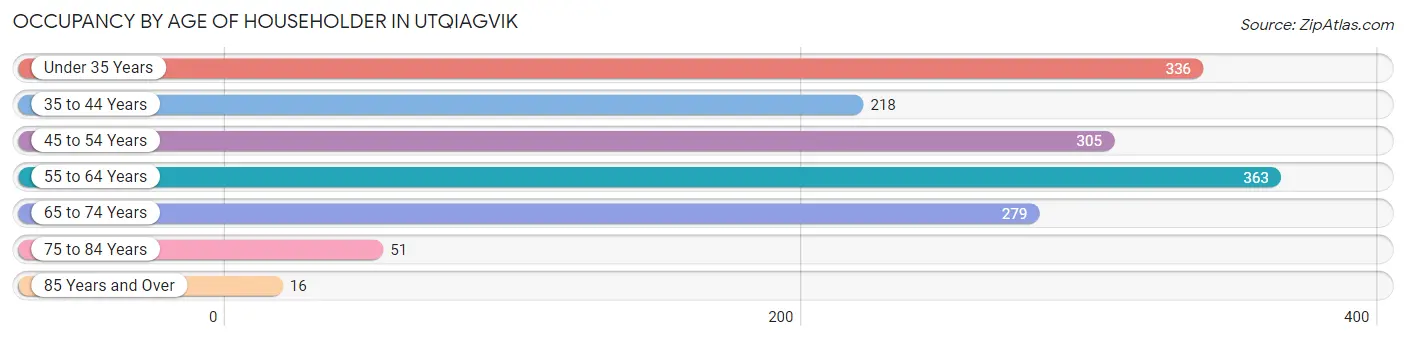
| Age Bracket | # Households | % Households |
| Under 35 Years | 336 | 21.4% |
| 35 to 44 Years | 218 | 13.9% |
| 45 to 54 Years | 305 | 19.5% |
| 55 to 64 Years | 363 | 23.2% |
| 65 to 74 Years | 279 | 17.8% |
| 75 to 84 Years | 51 | 3.3% |
| 85 Years and Over | 16 | 1.0% |
| Total | 1,568 | 100.0% |
Housing Finances in Utqiagvik
Median Income by Occupancy in Utqiagvik
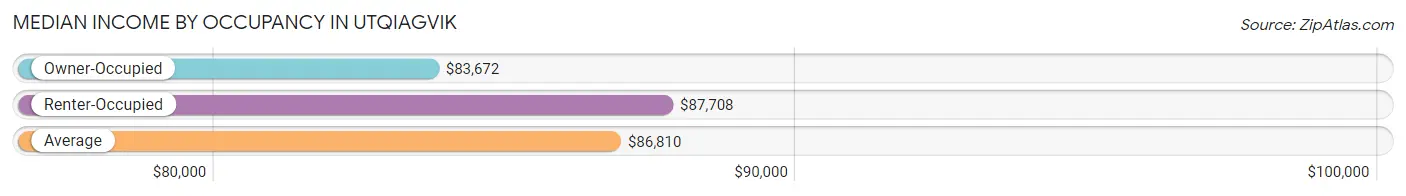
| Occupancy Type | # Households | Median Income |
| Owner-Occupied | 611 (39.0%) | $83,672 |
| Renter-Occupied | 957 (61.0%) | $87,708 |
| Average | 1,568 (100.0%) | $86,810 |
Occupancy by Householder Income Bracket in Utqiagvik
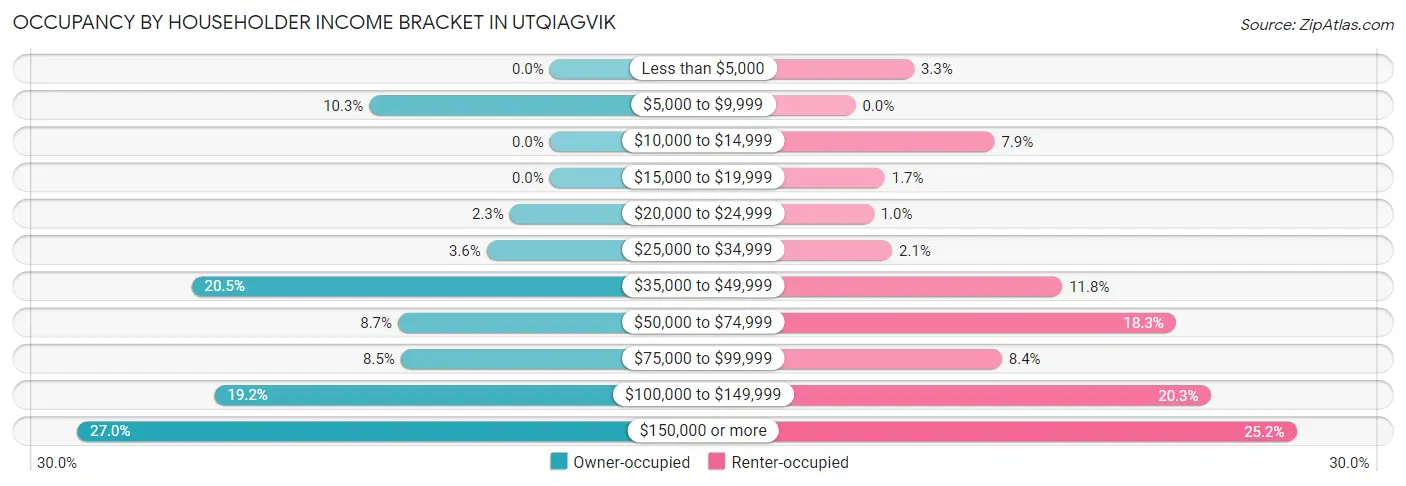
| Income Bracket | Owner-occupied | Renter-occupied |
| Less than $5,000 | 0 (0.0%) | 32 (3.3%) |
| $5,000 to $9,999 | 63 (10.3%) | 0 (0.0%) |
| $10,000 to $14,999 | 0 (0.0%) | 76 (7.9%) |
| $15,000 to $19,999 | 0 (0.0%) | 16 (1.7%) |
| $20,000 to $24,999 | 14 (2.3%) | 10 (1.0%) |
| $25,000 to $34,999 | 22 (3.6%) | 20 (2.1%) |
| $35,000 to $49,999 | 125 (20.5%) | 113 (11.8%) |
| $50,000 to $74,999 | 53 (8.7%) | 175 (18.3%) |
| $75,000 to $99,999 | 52 (8.5%) | 80 (8.4%) |
| $100,000 to $149,999 | 117 (19.2%) | 194 (20.3%) |
| $150,000 or more | 165 (27.0%) | 241 (25.2%) |
| Total | 611 (100.0%) | 957 (100.0%) |
Monthly Housing Cost Tiers in Utqiagvik
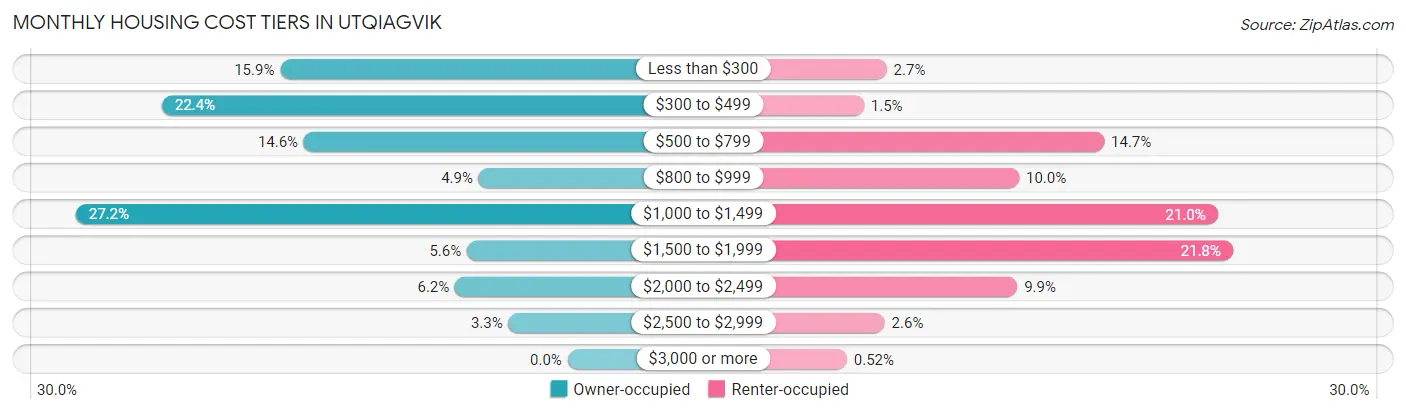
| Monthly Cost | Owner-occupied | Renter-occupied |
| Less than $300 | 97 (15.9%) | 26 (2.7%) |
| $300 to $499 | 137 (22.4%) | 14 (1.5%) |
| $500 to $799 | 89 (14.6%) | 141 (14.7%) |
| $800 to $999 | 30 (4.9%) | 96 (10.0%) |
| $1,000 to $1,499 | 166 (27.2%) | 201 (21.0%) |
| $1,500 to $1,999 | 34 (5.6%) | 209 (21.8%) |
| $2,000 to $2,499 | 38 (6.2%) | 95 (9.9%) |
| $2,500 to $2,999 | 20 (3.3%) | 25 (2.6%) |
| $3,000 or more | 0 (0.0%) | 5 (0.5%) |
| Total | 611 (100.0%) | 957 (100.0%) |
Physical Housing Characteristics in Utqiagvik
Housing Structures in Utqiagvik
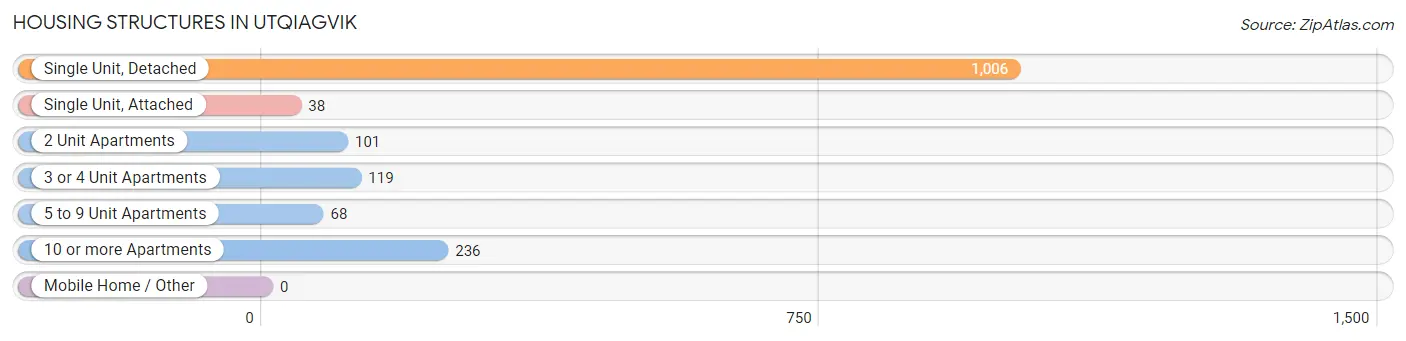
| Structure Type | # Housing Units | % Housing Units |
| Single Unit, Detached | 1,006 | 64.2% |
| Single Unit, Attached | 38 | 2.4% |
| 2 Unit Apartments | 101 | 6.4% |
| 3 or 4 Unit Apartments | 119 | 7.6% |
| 5 to 9 Unit Apartments | 68 | 4.3% |
| 10 or more Apartments | 236 | 15.0% |
| Mobile Home / Other | 0 | 0.0% |
| Total | 1,568 | 100.0% |
Housing Structures by Occupancy in Utqiagvik
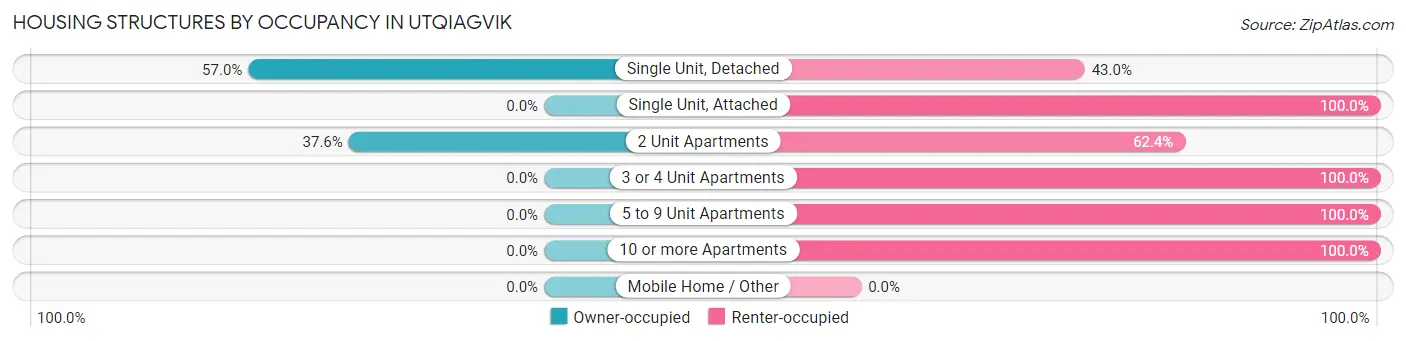
| Structure Type | Owner-occupied | Renter-occupied |
| Single Unit, Detached | 573 (57.0%) | 433 (43.0%) |
| Single Unit, Attached | 0 (0.0%) | 38 (100.0%) |
| 2 Unit Apartments | 38 (37.6%) | 63 (62.4%) |
| 3 or 4 Unit Apartments | 0 (0.0%) | 119 (100.0%) |
| 5 to 9 Unit Apartments | 0 (0.0%) | 68 (100.0%) |
| 10 or more Apartments | 0 (0.0%) | 236 (100.0%) |
| Mobile Home / Other | 0 (0.0%) | 0 (0.0%) |
| Total | 611 (39.0%) | 957 (61.0%) |
Housing Structures by Number of Rooms in Utqiagvik
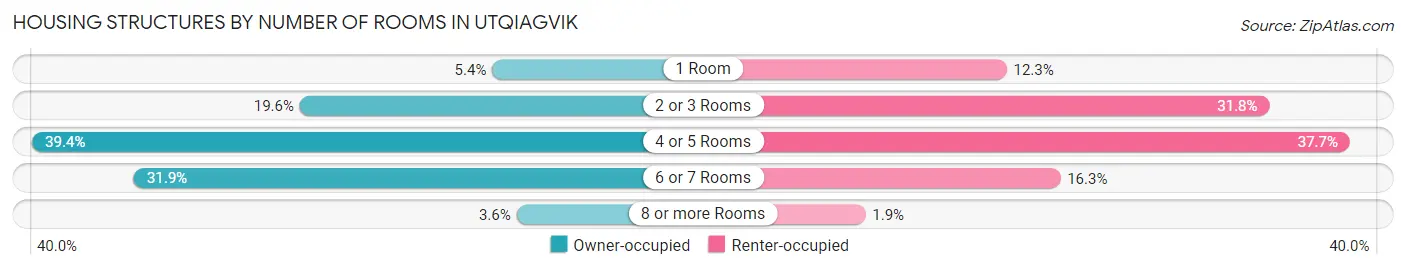
| Number of Rooms | Owner-occupied | Renter-occupied |
| 1 Room | 33 (5.4%) | 118 (12.3%) |
| 2 or 3 Rooms | 120 (19.6%) | 304 (31.8%) |
| 4 or 5 Rooms | 241 (39.4%) | 361 (37.7%) |
| 6 or 7 Rooms | 195 (31.9%) | 156 (16.3%) |
| 8 or more Rooms | 22 (3.6%) | 18 (1.9%) |
| Total | 611 (100.0%) | 957 (100.0%) |
Housing Structure by Heating Type in Utqiagvik
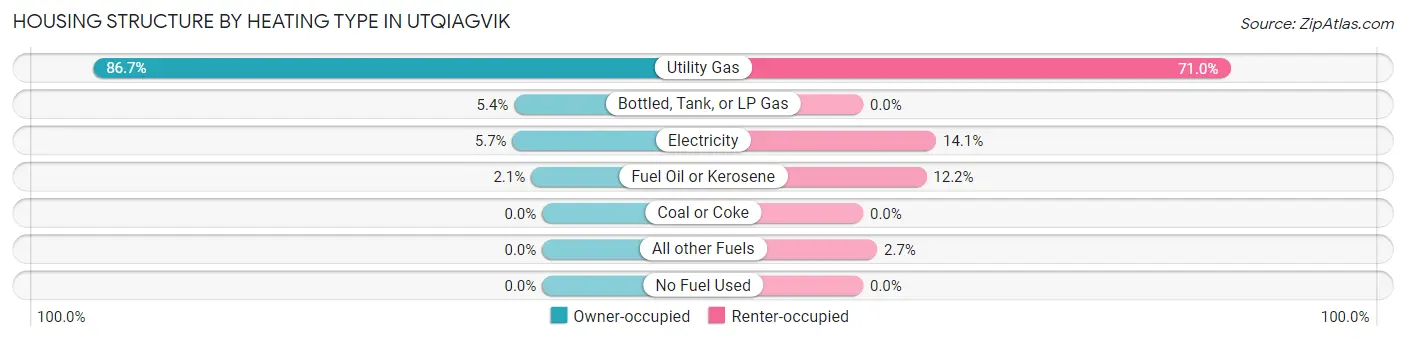
| Heating Type | Owner-occupied | Renter-occupied |
| Utility Gas | 530 (86.7%) | 679 (71.0%) |
| Bottled, Tank, or LP Gas | 33 (5.4%) | 0 (0.0%) |
| Electricity | 35 (5.7%) | 135 (14.1%) |
| Fuel Oil or Kerosene | 13 (2.1%) | 117 (12.2%) |
| Coal or Coke | 0 (0.0%) | 0 (0.0%) |
| All other Fuels | 0 (0.0%) | 26 (2.7%) |
| No Fuel Used | 0 (0.0%) | 0 (0.0%) |
| Total | 611 (100.0%) | 957 (100.0%) |
Household Vehicle Usage in Utqiagvik
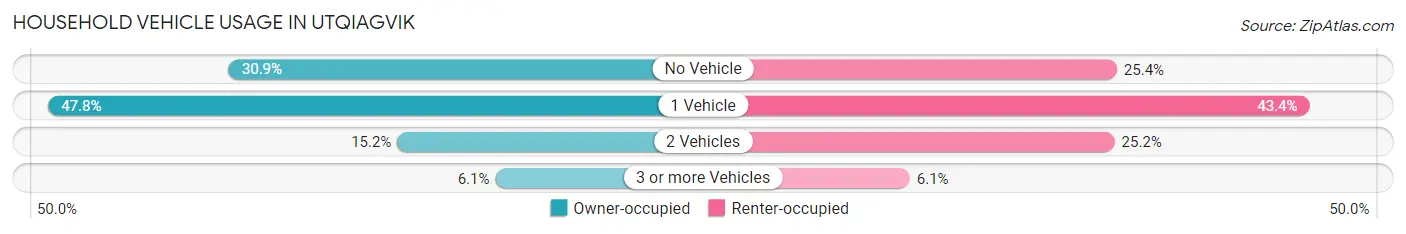
| Vehicles per Household | Owner-occupied | Renter-occupied |
| No Vehicle | 189 (30.9%) | 243 (25.4%) |
| 1 Vehicle | 292 (47.8%) | 415 (43.4%) |
| 2 Vehicles | 93 (15.2%) | 241 (25.2%) |
| 3 or more Vehicles | 37 (6.1%) | 58 (6.1%) |
| Total | 611 (100.0%) | 957 (100.0%) |
Real Estate & Mortgages in Utqiagvik
Real Estate and Mortgage Overview in Utqiagvik
| Characteristic | Without Mortgage | With Mortgage |
| Housing Units | 331 | 280 |
| Median Property Value | $189,800 | $307,800 |
| Median Household Income | $49,181 | $100 |
| Monthly Housing Costs | $336 | $0 |
| Real Estate Taxes | $2,319 | $181 |
Property Value by Mortgage Status in Utqiagvik
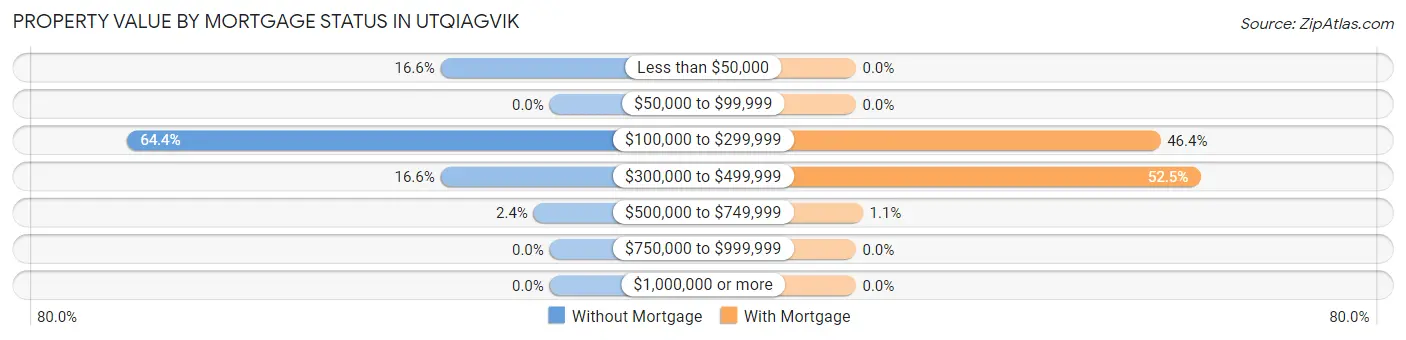
| Property Value | Without Mortgage | With Mortgage |
| Less than $50,000 | 55 (16.6%) | 0 (0.0%) |
| $50,000 to $99,999 | 0 (0.0%) | 0 (0.0%) |
| $100,000 to $299,999 | 213 (64.3%) | 130 (46.4%) |
| $300,000 to $499,999 | 55 (16.6%) | 147 (52.5%) |
| $500,000 to $749,999 | 8 (2.4%) | 3 (1.1%) |
| $750,000 to $999,999 | 0 (0.0%) | 0 (0.0%) |
| $1,000,000 or more | 0 (0.0%) | 0 (0.0%) |
| Total | 331 (100.0%) | 280 (100.0%) |
Household Income by Mortgage Status in Utqiagvik
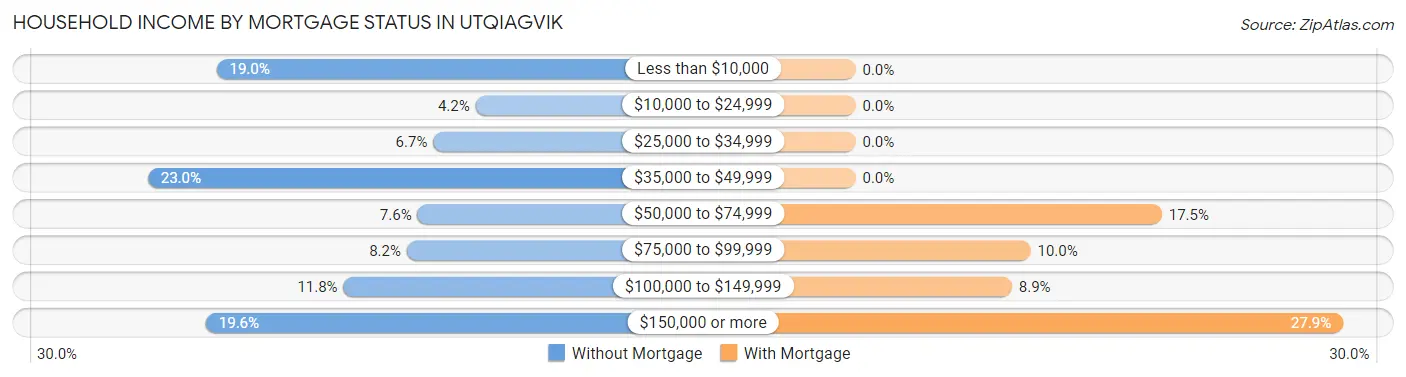
| Household Income | Without Mortgage | With Mortgage |
| Less than $10,000 | 63 (19.0%) | 0 (0.0%) |
| $10,000 to $24,999 | 14 (4.2%) | 0 (0.0%) |
| $25,000 to $34,999 | 22 (6.7%) | 0 (0.0%) |
| $35,000 to $49,999 | 76 (23.0%) | 0 (0.0%) |
| $50,000 to $74,999 | 25 (7.5%) | 49 (17.5%) |
| $75,000 to $99,999 | 27 (8.2%) | 28 (10.0%) |
| $100,000 to $149,999 | 39 (11.8%) | 25 (8.9%) |
| $150,000 or more | 65 (19.6%) | 78 (27.9%) |
| Total | 331 (100.0%) | 280 (100.0%) |
Property Value to Household Income Ratio in Utqiagvik
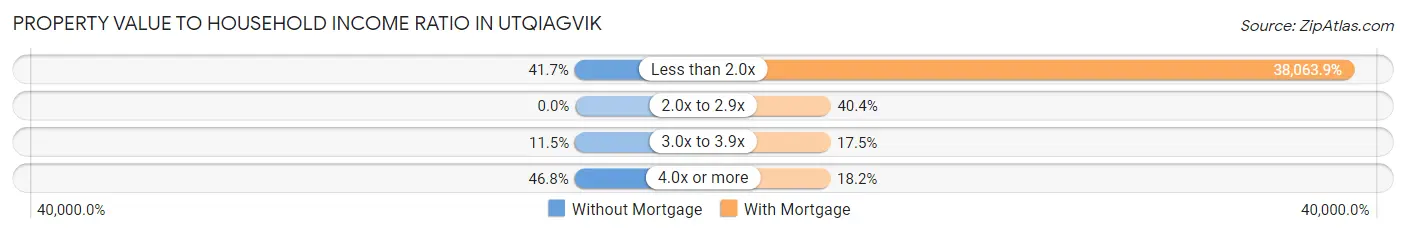
| Value-to-Income Ratio | Without Mortgage | With Mortgage |
| Less than 2.0x | 138 (41.7%) | 106,579 (38,063.9%) |
| 2.0x to 2.9x | 0 (0.0%) | 113 (40.4%) |
| 3.0x to 3.9x | 38 (11.5%) | 49 (17.5%) |
| 4.0x or more | 155 (46.8%) | 51 (18.2%) |
| Total | 331 (100.0%) | 280 (100.0%) |
Real Estate Taxes by Mortgage Status in Utqiagvik
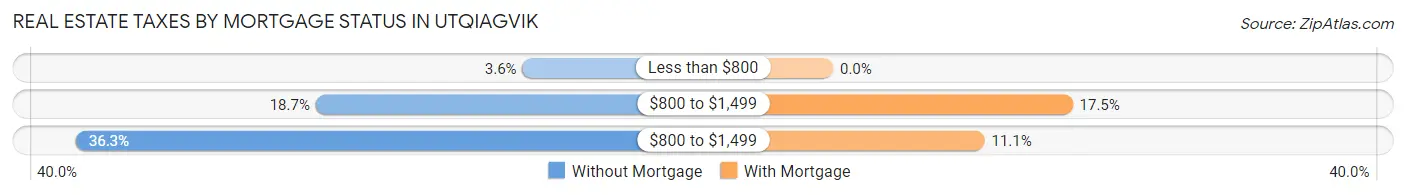
| Property Taxes | Without Mortgage | With Mortgage |
| Less than $800 | 12 (3.6%) | 0 (0.0%) |
| $800 to $1,499 | 62 (18.7%) | 49 (17.5%) |
| $800 to $1,499 | 120 (36.2%) | 31 (11.1%) |
| Total | 331 (100.0%) | 280 (100.0%) |
Health & Disability in Utqiagvik
Health Insurance Coverage by Age in Utqiagvik
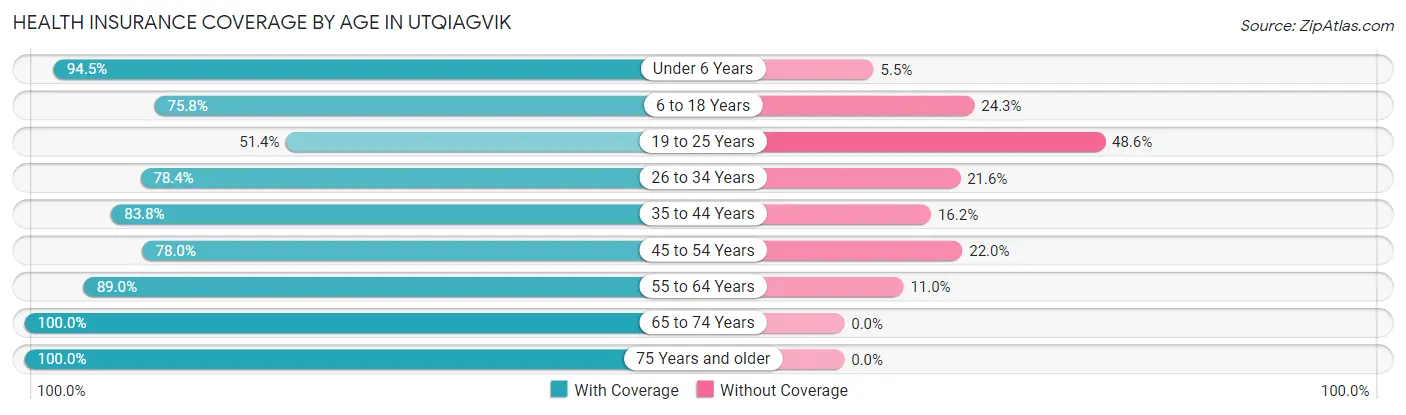
| Age Bracket | With Coverage | Without Coverage |
| Under 6 Years | 363 (94.5%) | 21 (5.5%) |
| 6 to 18 Years | 887 (75.7%) | 284 (24.2%) |
| 19 to 25 Years | 263 (51.4%) | 249 (48.6%) |
| 26 to 34 Years | 497 (78.4%) | 137 (21.6%) |
| 35 to 44 Years | 446 (83.8%) | 86 (16.2%) |
| 45 to 54 Years | 365 (78.0%) | 103 (22.0%) |
| 55 to 64 Years | 581 (89.0%) | 72 (11.0%) |
| 65 to 74 Years | 400 (100.0%) | 0 (0.0%) |
| 75 Years and older | 111 (100.0%) | 0 (0.0%) |
| Total | 3,913 (80.4%) | 952 (19.6%) |
Health Insurance Coverage by Citizenship Status in Utqiagvik
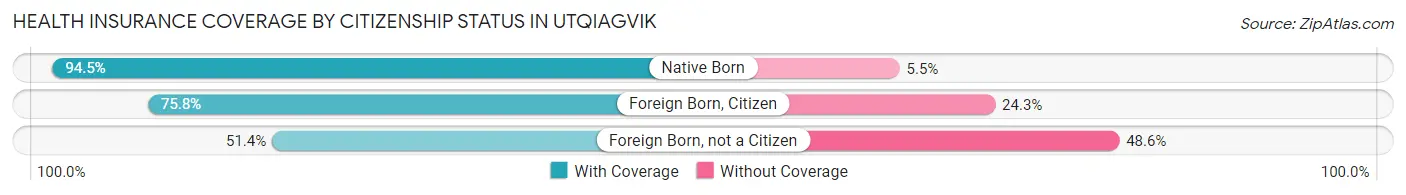
| Citizenship Status | With Coverage | Without Coverage |
| Native Born | 363 (94.5%) | 21 (5.5%) |
| Foreign Born, Citizen | 887 (75.7%) | 284 (24.2%) |
| Foreign Born, not a Citizen | 263 (51.4%) | 249 (48.6%) |
Health Insurance Coverage by Household Income in Utqiagvik
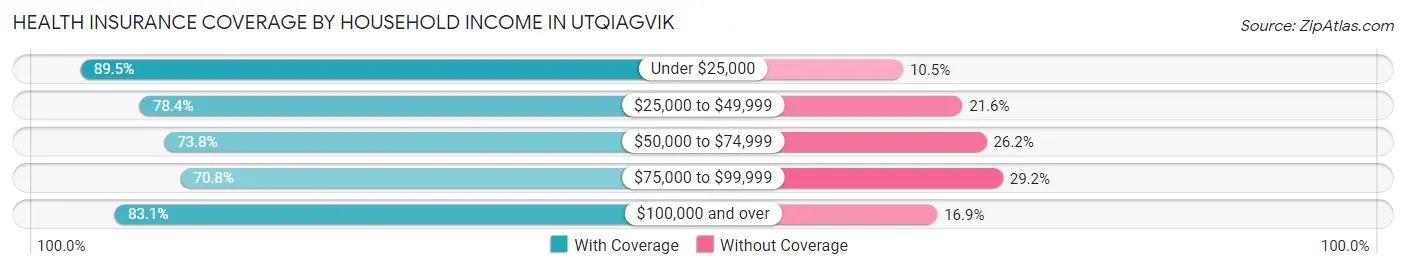
| Household Income | With Coverage | Without Coverage |
| Under $25,000 | 272 (89.5%) | 32 (10.5%) |
| $25,000 to $49,999 | 420 (78.4%) | 116 (21.6%) |
| $50,000 to $74,999 | 443 (73.8%) | 157 (26.2%) |
| $75,000 to $99,999 | 327 (70.8%) | 135 (29.2%) |
| $100,000 and over | 2,349 (83.1%) | 479 (16.9%) |
Public vs Private Health Insurance Coverage by Age in Utqiagvik
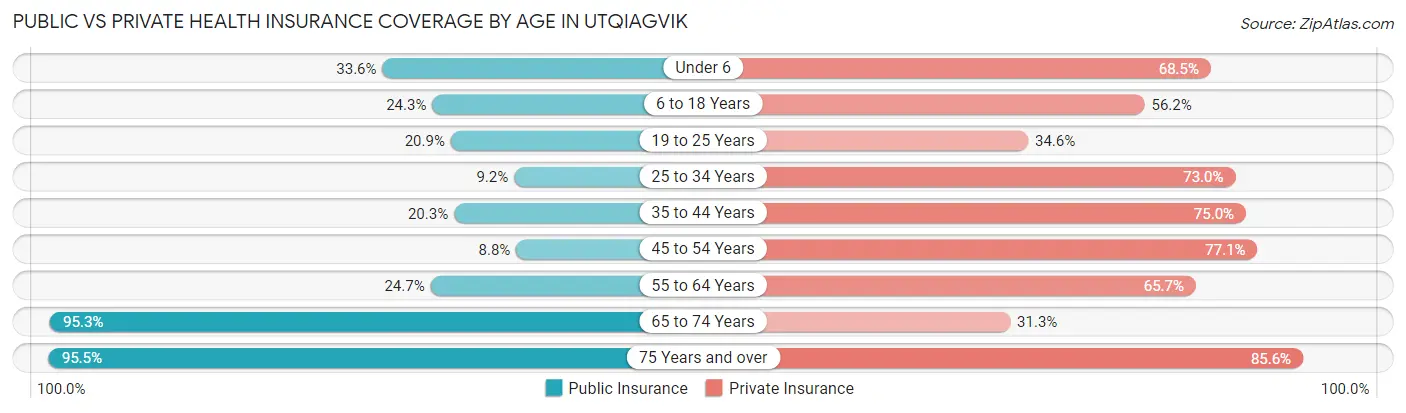
| Age Bracket | Public Insurance | Private Insurance |
| Under 6 | 129 (33.6%) | 263 (68.5%) |
| 6 to 18 Years | 285 (24.3%) | 658 (56.2%) |
| 19 to 25 Years | 107 (20.9%) | 177 (34.6%) |
| 25 to 34 Years | 58 (9.1%) | 463 (73.0%) |
| 35 to 44 Years | 108 (20.3%) | 399 (75.0%) |
| 45 to 54 Years | 41 (8.8%) | 361 (77.1%) |
| 55 to 64 Years | 161 (24.7%) | 429 (65.7%) |
| 65 to 74 Years | 381 (95.3%) | 125 (31.2%) |
| 75 Years and over | 106 (95.5%) | 95 (85.6%) |
| Total | 1,376 (28.3%) | 2,970 (61.1%) |
Disability Status by Sex by Age in Utqiagvik
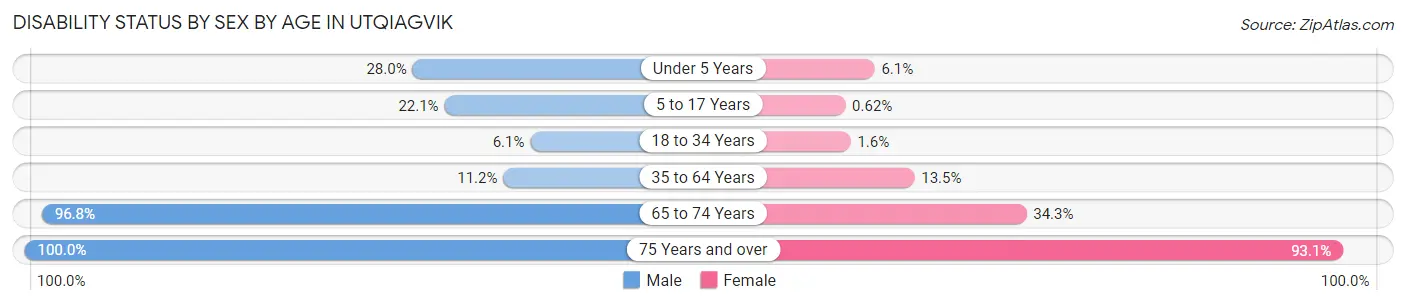
| Age Bracket | Male | Female |
| Under 5 Years | 42 (28.0%) | 10 (6.1%) |
| 5 to 17 Years | 128 (22.1%) | 4 (0.6%) |
| 18 to 34 Years | 41 (6.1%) | 8 (1.6%) |
| 35 to 64 Years | 94 (11.2%) | 109 (13.5%) |
| 65 to 74 Years | 212 (96.8%) | 62 (34.3%) |
| 75 Years and over | 39 (100.0%) | 67 (93.1%) |
Disability Class by Sex by Age in Utqiagvik
Disability Class: Hearing Difficulty
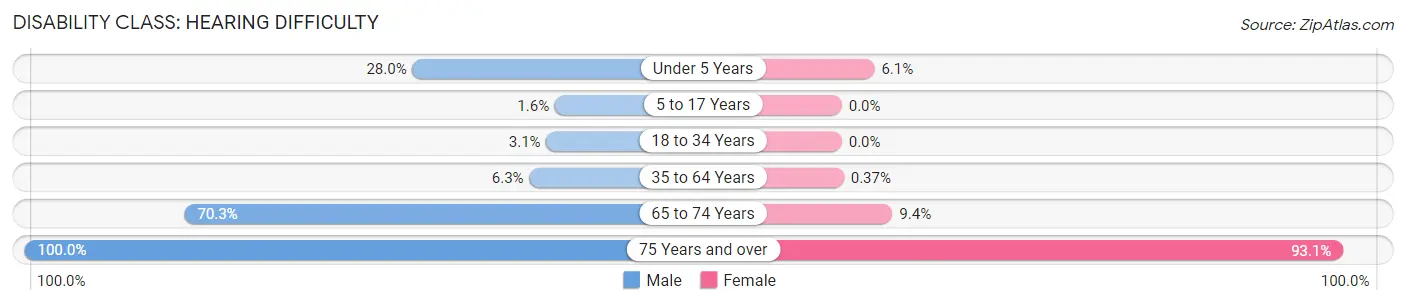
| Age Bracket | Male | Female |
| Under 5 Years | 42 (28.0%) | 10 (6.1%) |
| 5 to 17 Years | 9 (1.5%) | 0 (0.0%) |
| 18 to 34 Years | 21 (3.1%) | 0 (0.0%) |
| 35 to 64 Years | 53 (6.3%) | 3 (0.4%) |
| 65 to 74 Years | 154 (70.3%) | 17 (9.4%) |
| 75 Years and over | 39 (100.0%) | 67 (93.1%) |
Disability Class: Vision Difficulty
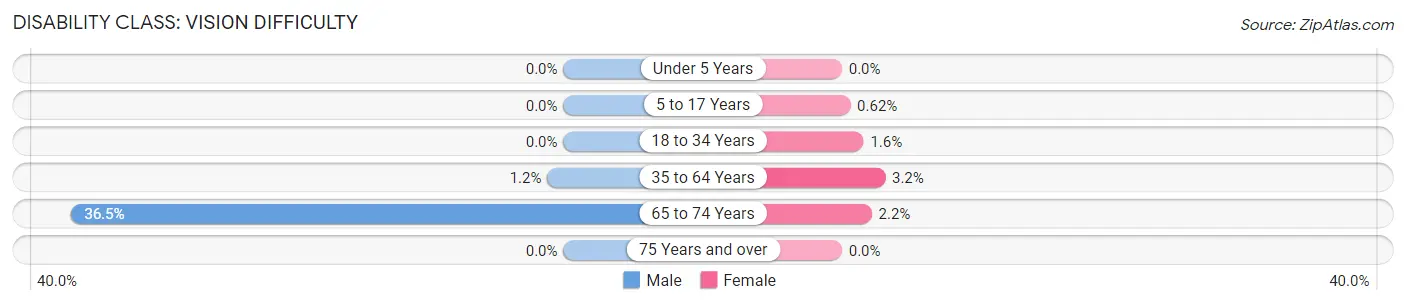
| Age Bracket | Male | Female |
| Under 5 Years | 0 (0.0%) | 0 (0.0%) |
| 5 to 17 Years | 0 (0.0%) | 4 (0.6%) |
| 18 to 34 Years | 0 (0.0%) | 8 (1.6%) |
| 35 to 64 Years | 10 (1.2%) | 26 (3.2%) |
| 65 to 74 Years | 80 (36.5%) | 4 (2.2%) |
| 75 Years and over | 0 (0.0%) | 0 (0.0%) |
Disability Class: Cognitive Difficulty
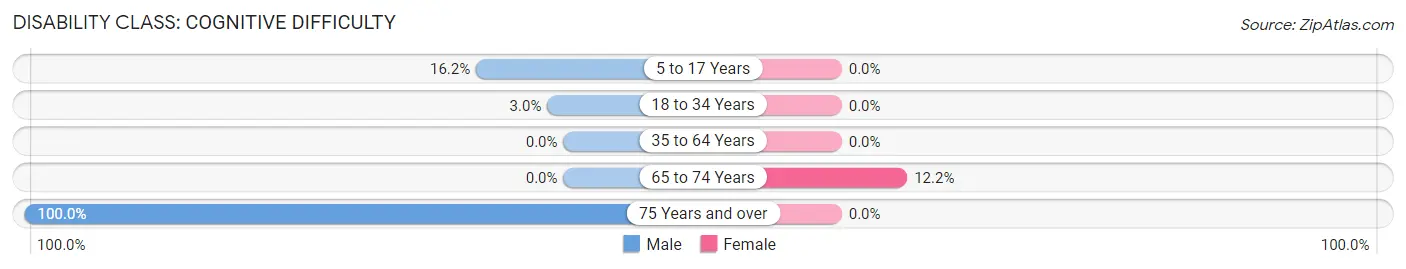
| Age Bracket | Male | Female |
| 5 to 17 Years | 94 (16.2%) | 0 (0.0%) |
| 18 to 34 Years | 20 (3.0%) | 0 (0.0%) |
| 35 to 64 Years | 0 (0.0%) | 0 (0.0%) |
| 65 to 74 Years | 0 (0.0%) | 22 (12.1%) |
| 75 Years and over | 39 (100.0%) | 0 (0.0%) |
Disability Class: Ambulatory Difficulty
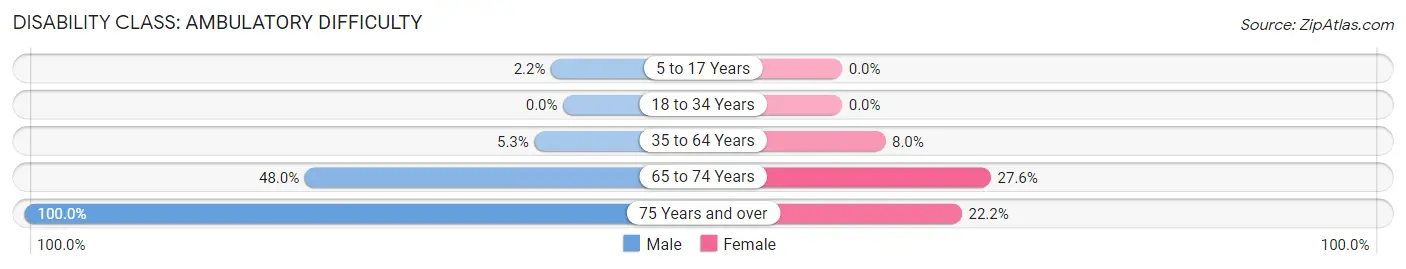
| Age Bracket | Male | Female |
| 5 to 17 Years | 13 (2.2%) | 0 (0.0%) |
| 18 to 34 Years | 0 (0.0%) | 0 (0.0%) |
| 35 to 64 Years | 45 (5.3%) | 65 (8.0%) |
| 65 to 74 Years | 105 (47.9%) | 50 (27.6%) |
| 75 Years and over | 39 (100.0%) | 16 (22.2%) |
Disability Class: Self-Care Difficulty
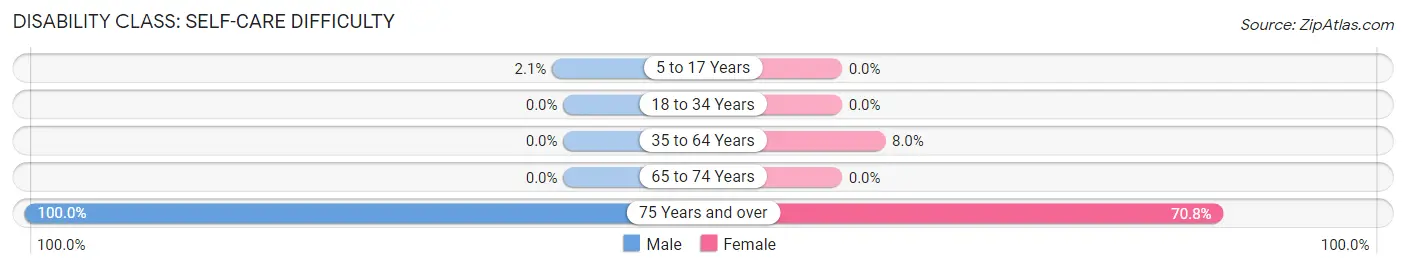
| Age Bracket | Male | Female |
| 5 to 17 Years | 12 (2.1%) | 0 (0.0%) |
| 18 to 34 Years | 0 (0.0%) | 0 (0.0%) |
| 35 to 64 Years | 0 (0.0%) | 65 (8.0%) |
| 65 to 74 Years | 0 (0.0%) | 0 (0.0%) |
| 75 Years and over | 39 (100.0%) | 51 (70.8%) |
Technology Access in Utqiagvik
Computing Device Access in Utqiagvik
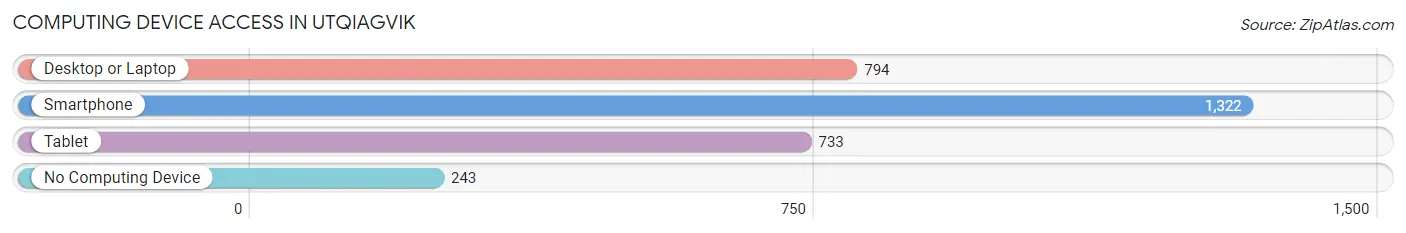
| Device Type | # Households | % Households |
| Desktop or Laptop | 794 | 50.6% |
| Smartphone | 1,322 | 84.3% |
| Tablet | 733 | 46.8% |
| No Computing Device | 243 | 15.5% |
| Total | 1,568 | 100.0% |
Internet Access in Utqiagvik
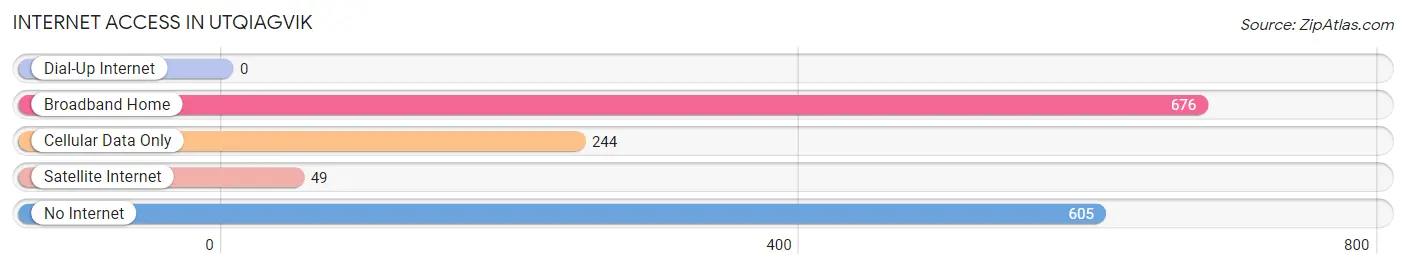
| Internet Type | # Households | % Households |
| Dial-Up Internet | 0 | 0.0% |
| Broadband Home | 676 | 43.1% |
| Cellular Data Only | 244 | 15.6% |
| Satellite Internet | 49 | 3.1% |
| No Internet | 605 | 38.6% |
| Total | 1,568 | 100.0% |
Utqiagvik Summary
Utqiagvik, AK is a city located in the North Slope Borough of Alaska. It is the northernmost city in the United States and is located on the Chukchi Sea coast of the Arctic Ocean. Utqiagvik is the largest city in the North Slope Borough and is home to approximately 4,000 people.
History
Utqiagvik has a long and rich history that dates back thousands of years. The area has been inhabited by the Inupiat people for centuries, and the city was originally known as Barrow. The name was changed to Utqiagvik in 2016, which is the traditional Iñupiaq name for the area.
The first Europeans to visit the area were Russian explorers in the late 18th century. They established a trading post in the area and began trading with the local Inupiat people. In 1881, the United States purchased Alaska from Russia and the area became part of the United States.
In the early 20th century, the United States government began to establish a presence in the area. The U.S. Army built a military base in the area in 1941 and the U.S. Air Force established an air base in the area in 1952.
Geography
Utqiagvik is located on the Chukchi Sea coast of the Arctic Ocean. The city is located on a flat coastal plain and is surrounded by mountains to the east and west. The city is located at the northernmost point of Alaska and is the northernmost city in the United States.
The climate in Utqiagvik is cold and dry, with temperatures rarely rising above freezing. The city experiences long, dark winters and short, cool summers. The average annual temperature is -7.2°C (19.0°F).
Economy
The economy of Utqiagvik is largely based on oil and gas production. The city is home to several oil and gas companies, including ConocoPhillips, BP, and ExxonMobil. The city also has a fishing industry, with several fish processing plants located in the area.
The city is also home to several government agencies, including the North Slope Borough, the Alaska Department of Fish and Game, and the National Oceanic and Atmospheric Administration.
Demographics
As of the 2010 census, the population of Utqiagvik was 4,212. The population is predominantly Iñupiaq, with 85.7% of the population identifying as such. The city also has a small population of non-Iñupiaq residents, including White (7.2%), Asian (2.2%), and Hispanic (1.2%) residents.
The median household income in Utqiagvik is $76,944, which is significantly higher than the national median of $50,046. The median home value in the city is $250,000, which is also significantly higher than the national median of $184,700.
Conclusion
Utqiagvik is a city located in the North Slope Borough of Alaska. It is the northernmost city in the United States and is home to approximately 4,000 people. The city has a long and rich history that dates back thousands of years and is home to several oil and gas companies. The population is predominantly Iñupiaq, with 85.7% of the population identifying as such. The economy of Utqiagvik is largely based on oil and gas production, fishing, and government agencies. The median household income in Utqiagvik is significantly higher than the national median, and the median home value is also significantly higher than the national median.
Common Questions
What is Per Capita Income in Utqiagvik?
Per Capita income in Utqiagvik is $38,852.
What is the Median Family Income in Utqiagvik?
Median Family Income in Utqiagvik is $105,116.
What is the Median Household income in Utqiagvik?
Median Household Income in Utqiagvik is $86,810.
What is Income or Wage Gap in Utqiagvik?
Income or Wage Gap in Utqiagvik is 8.3%.
Women in Utqiagvik earn 91.7 cents for every dollar earned by a man.
What is Inequality or Gini Index in Utqiagvik?
Inequality or Gini Index in Utqiagvik is 0.45.
What is the Total Population of Utqiagvik?
Total Population of Utqiagvik is 4,876.
What is the Total Male Population of Utqiagvik?
Total Male Population of Utqiagvik is 2,504.
What is the Total Female Population of Utqiagvik?
Total Female Population of Utqiagvik is 2,372.
What is the Ratio of Males per 100 Females in Utqiagvik?
There are 105.56 Males per 100 Females in Utqiagvik.
What is the Ratio of Females per 100 Males in Utqiagvik?
There are 94.73 Females per 100 Males in Utqiagvik.
What is the Median Population Age in Utqiagvik?
Median Population Age in Utqiagvik is 30.7 Years.
What is the Average Family Size in Utqiagvik
Average Family Size in Utqiagvik is 3.6 People.
What is the Average Household Size in Utqiagvik
Average Household Size in Utqiagvik is 3.0 People.
How Large is the Labor Force in Utqiagvik?
There are 2,363 People in the Labor Forcein in Utqiagvik.
What is the Percentage of People in the Labor Force in Utqiagvik?
65.9% of People are in the Labor Force in Utqiagvik.
What is the Unemployment Rate in Utqiagvik?
Unemployment Rate in Utqiagvik is 11.5%.