Salamatof, AK Map & Demographics
Salamatof Map
Salamatof Overview
$24,377
PER CAPITA INCOME
$106,250
AVG FAMILY INCOME
$63,750
AVG HOUSEHOLD INCOME
27.3%
WAGE / INCOME GAP [ % ]
72.7¢/ $1
WAGE / INCOME GAP [ $ ]
0.46
INEQUALITY / GINI INDEX
1,189
TOTAL POPULATION
805
MALE POPULATION
384
FEMALE POPULATION
209.64
MALES / 100 FEMALES
47.70
FEMALES / 100 MALES
40.6
MEDIAN AGE
3.6
AVG FAMILY SIZE
2.9
AVG HOUSEHOLD SIZE
429
LABOR FORCE [ PEOPLE ]
39.5%
PERCENT IN LABOR FORCE
31.8%
UNEMPLOYMENT RATE
Income in Salamatof
Income Overview in Salamatof
Per Capita Income in Salamatof is $24,377, while median incomes of families and households are $106,250 and $63,750 respectively.
| Characteristic | Number | Measure |
| Per Capita Income | 1,189 | $24,377 |
| Median Family Income | 189 | $106,250 |
| Mean Family Income | 189 | $109,369 |
| Median Household Income | 298 | $63,750 |
| Mean Household Income | 298 | $86,156 |
| Income Deficit | 189 | $0 |
| Wage / Income Gap (%) | 1,189 | 27.27% |
| Wage / Income Gap ($) | 1,189 | 72.73¢ per $1 |
| Gini / Inequality Index | 1,189 | 0.46 |
Earnings by Sex in Salamatof
Average Earnings in Salamatof are $35,536, $32,727 for men and $45,000 for women, a difference of 27.3%.
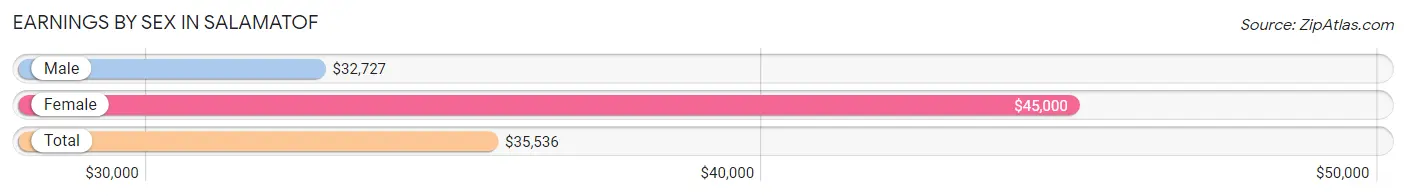
| Sex | Number | Average Earnings |
| Male | 300 (69.4%) | $32,727 |
| Female | 132 (30.6%) | $45,000 |
| Total | 432 (100.0%) | $35,536 |
Earnings by Sex by Income Bracket in Salamatof
The most common earnings brackets in Salamatof are $2,500 to $4,999 for men (88 | 29.3%) and $55,000 to $64,999 for women (17 | 12.9%).
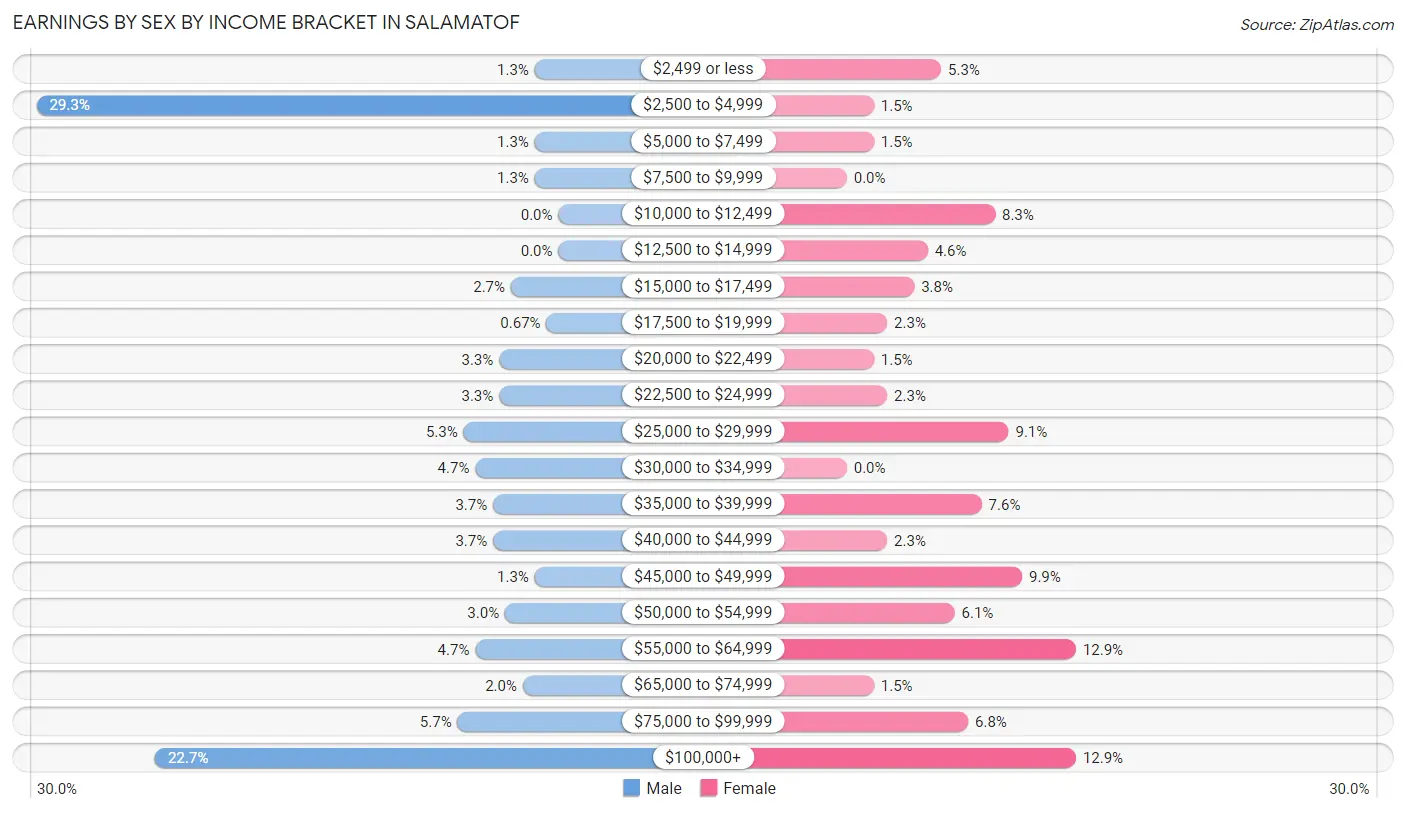
| Income | Male | Female |
| $2,499 or less | 4 (1.3%) | 7 (5.3%) |
| $2,500 to $4,999 | 88 (29.3%) | 2 (1.5%) |
| $5,000 to $7,499 | 4 (1.3%) | 2 (1.5%) |
| $7,500 to $9,999 | 4 (1.3%) | 0 (0.0%) |
| $10,000 to $12,499 | 0 (0.0%) | 11 (8.3%) |
| $12,500 to $14,999 | 0 (0.0%) | 6 (4.5%) |
| $15,000 to $17,499 | 8 (2.7%) | 5 (3.8%) |
| $17,500 to $19,999 | 2 (0.7%) | 3 (2.3%) |
| $20,000 to $22,499 | 10 (3.3%) | 2 (1.5%) |
| $22,500 to $24,999 | 10 (3.3%) | 3 (2.3%) |
| $25,000 to $29,999 | 16 (5.3%) | 12 (9.1%) |
| $30,000 to $34,999 | 14 (4.7%) | 0 (0.0%) |
| $35,000 to $39,999 | 11 (3.7%) | 10 (7.6%) |
| $40,000 to $44,999 | 11 (3.7%) | 3 (2.3%) |
| $45,000 to $49,999 | 4 (1.3%) | 13 (9.9%) |
| $50,000 to $54,999 | 9 (3.0%) | 8 (6.1%) |
| $55,000 to $64,999 | 14 (4.7%) | 17 (12.9%) |
| $65,000 to $74,999 | 6 (2.0%) | 2 (1.5%) |
| $75,000 to $99,999 | 17 (5.7%) | 9 (6.8%) |
| $100,000+ | 68 (22.7%) | 17 (12.9%) |
| Total | 300 (100.0%) | 132 (100.0%) |
Earnings by Sex by Educational Attainment in Salamatof
Average earnings in Salamatof are $62,750 for men and $47,778 for women, a difference of 23.9%. Men with an educational attainment of college or associate's degree enjoy the highest average annual earnings of $93,333, while those with less than high school education earn the least with $33,594. Women with an educational attainment of bachelor's degree earn the most with the average annual earnings of $75,500, while those with high school diploma education have the smallest earnings of $46,250.
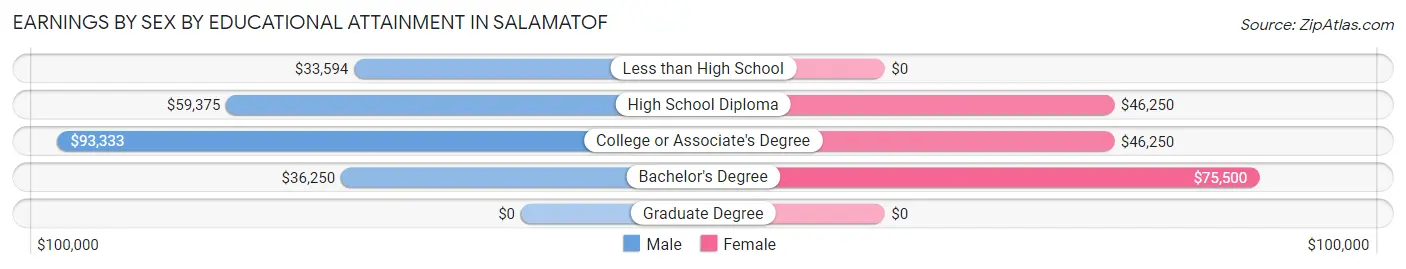
| Educational Attainment | Male Income | Female Income |
| Less than High School | $33,594 | $0 |
| High School Diploma | $59,375 | $46,250 |
| College or Associate's Degree | $93,333 | $46,250 |
| Bachelor's Degree | $36,250 | $75,500 |
| Graduate Degree | - | - |
| Total | $62,750 | $47,778 |
Family Income in Salamatof
Family Income Brackets in Salamatof
According to the Salamatof family income data, there are 53 families falling into the $100,000 to $149,999 income range, which is the most common income bracket and makes up 28.0% of all families. Conversely, the $15,000 to $24,999 income bracket is the least frequent group with only 1 families (0.5%) belonging to this category.
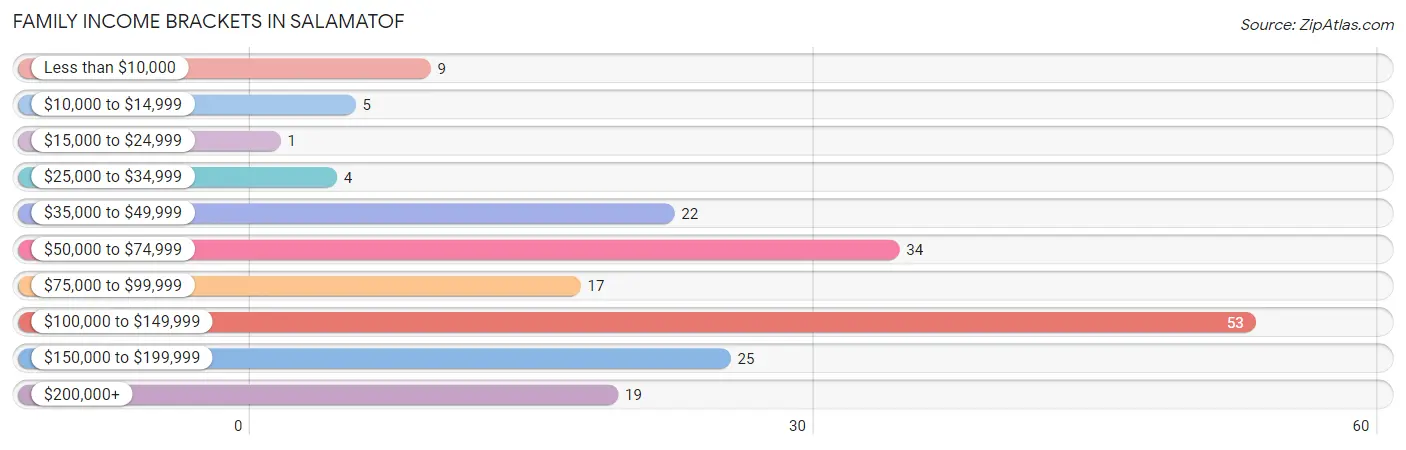
| Income Bracket | # Families | % Families |
| Less than $10,000 | 9 | 4.8% |
| $10,000 to $14,999 | 5 | 2.6% |
| $15,000 to $24,999 | 1 | 0.5% |
| $25,000 to $34,999 | 4 | 2.1% |
| $35,000 to $49,999 | 22 | 11.6% |
| $50,000 to $74,999 | 34 | 18.0% |
| $75,000 to $99,999 | 17 | 9.0% |
| $100,000 to $149,999 | 53 | 28.0% |
| $150,000 to $199,999 | 25 | 13.2% |
| $200,000+ | 19 | 10.1% |
Family Income by Famaliy Size in Salamatof
3-person families (28 | 14.8%) account for the highest median family income in Salamatof with $187,500 per family, while 3-person families (28 | 14.8%) have the highest median income of $62,500 per family member.
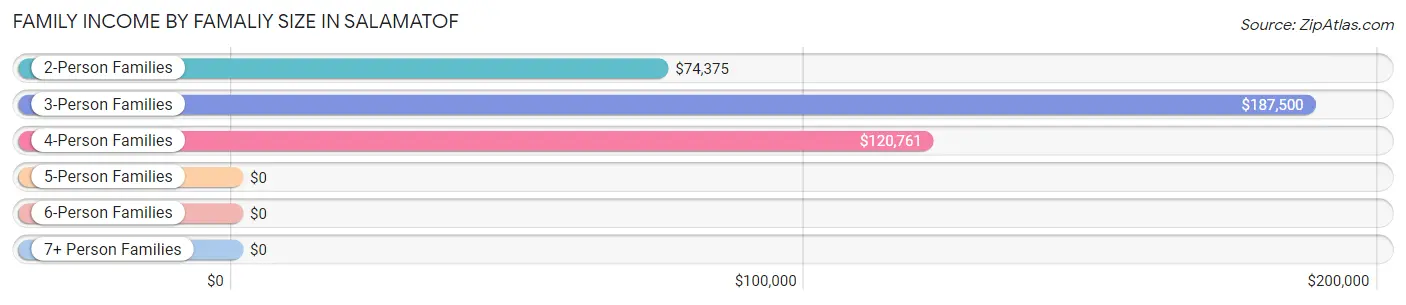
| Income Bracket | # Families | Median Income |
| 2-Person Families | 99 (52.4%) | $74,375 |
| 3-Person Families | 28 (14.8%) | $187,500 |
| 4-Person Families | 40 (21.2%) | $120,761 |
| 5-Person Families | 14 (7.4%) | $0 |
| 6-Person Families | 5 (2.6%) | $0 |
| 7+ Person Families | 3 (1.6%) | $0 |
| Total | 189 (100.0%) | $106,250 |
Family Income by Number of Earners in Salamatof
The median family income in Salamatof is $106,250, with families comprising 3+ earners (12) having the highest median family income of $206,250, while families with no earners (43) have the lowest median family income of $47,917, accounting for 6.4% and 22.8% of families, respectively.
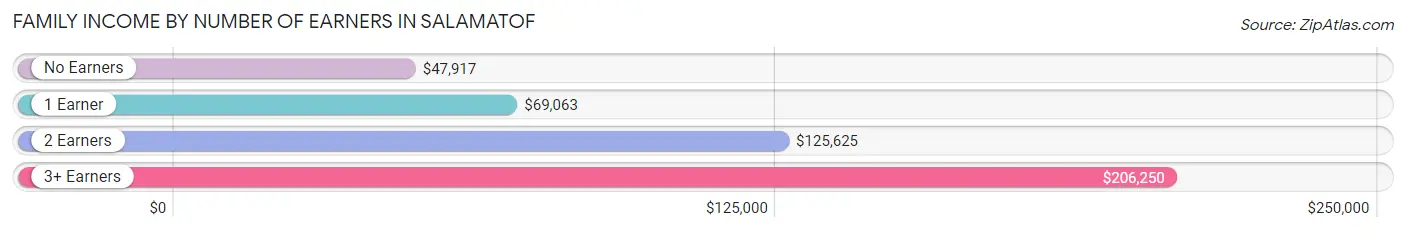
| Number of Earners | # Families | Median Income |
| No Earners | 43 (22.8%) | $47,917 |
| 1 Earner | 57 (30.2%) | $69,063 |
| 2 Earners | 77 (40.7%) | $125,625 |
| 3+ Earners | 12 (6.4%) | $206,250 |
| Total | 189 (100.0%) | $106,250 |
Household Income in Salamatof
Household Income Brackets in Salamatof
With 62 households falling in the category, the $100,000 to $149,999 income range is the most frequent in Salamatof, accounting for 20.8% of all households. In contrast, only 14 households (4.7%) fall into the $25,000 to $34,999 income bracket, making it the least populous group.
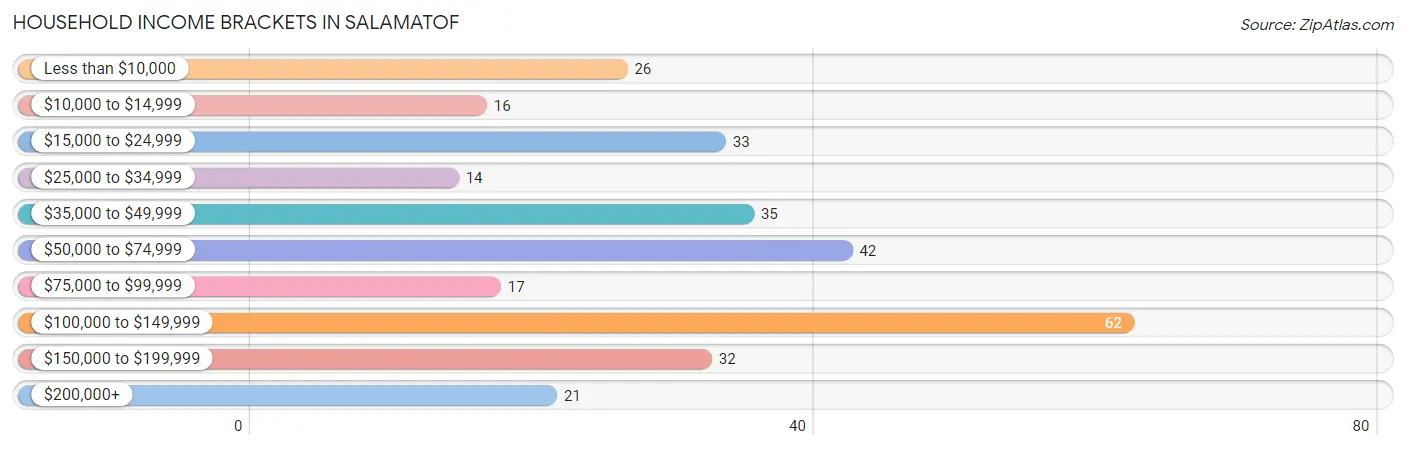
| Income Bracket | # Households | % Households |
| Less than $10,000 | 26 | 8.7% |
| $10,000 to $14,999 | 16 | 5.4% |
| $15,000 to $24,999 | 33 | 11.1% |
| $25,000 to $34,999 | 14 | 4.7% |
| $35,000 to $49,999 | 35 | 11.7% |
| $50,000 to $74,999 | 42 | 14.1% |
| $75,000 to $99,999 | 17 | 5.7% |
| $100,000 to $149,999 | 62 | 20.8% |
| $150,000 to $199,999 | 32 | 10.7% |
| $200,000+ | 21 | 7.0% |
Household Income by Householder Age in Salamatof
The median household income in Salamatof is $63,750, with the highest median household income of $92,917 found in the 25 to 44 years age bracket for the primary householder. A total of 37 households (12.4%) fall into this category.
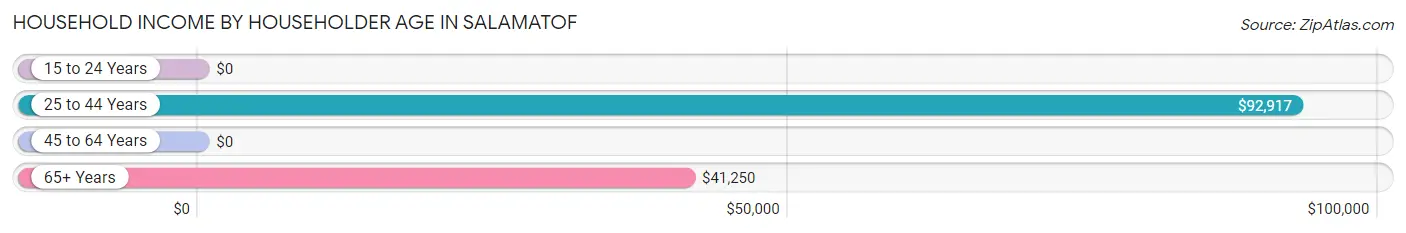
| Income Bracket | # Households | Median Income |
| 15 to 24 Years | 0 (0.0%) | $0 |
| 25 to 44 Years | 37 (12.4%) | $92,917 |
| 45 to 64 Years | 154 (51.7%) | $0 |
| 65+ Years | 107 (35.9%) | $41,250 |
| Total | 298 (100.0%) | $63,750 |
Poverty in Salamatof
Income Below Poverty by Sex and Age in Salamatof
With 12.8% poverty level for males and 14.1% for females among the residents of Salamatof, 16 and 17 year old males and 5 year old females are the most vulnerable to poverty, with 9 males (50.0%) and 2 females (100.0%) in their respective age groups living below the poverty level.
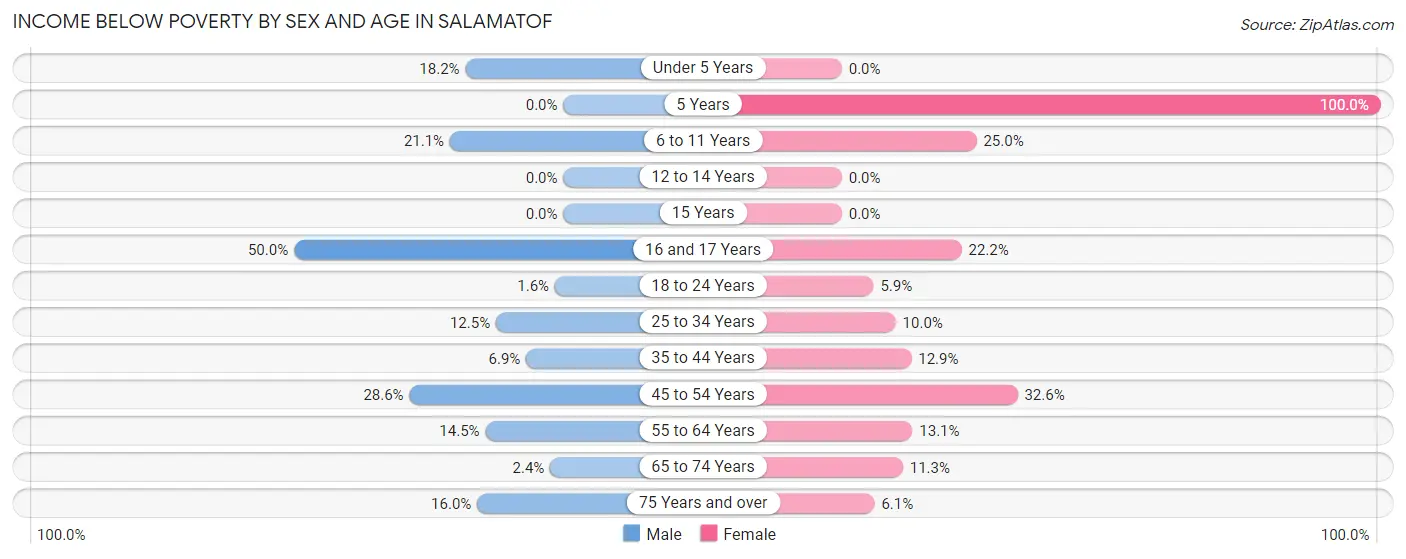
| Age Bracket | Male | Female |
| Under 5 Years | 4 (18.2%) | 0 (0.0%) |
| 5 Years | 0 (0.0%) | 2 (100.0%) |
| 6 to 11 Years | 4 (21.0%) | 5 (25.0%) |
| 12 to 14 Years | 0 (0.0%) | 0 (0.0%) |
| 15 Years | 0 (0.0%) | 0 (0.0%) |
| 16 and 17 Years | 9 (50.0%) | 2 (22.2%) |
| 18 to 24 Years | 2 (1.6%) | 3 (5.9%) |
| 25 to 34 Years | 5 (12.5%) | 2 (10.0%) |
| 35 to 44 Years | 2 (6.9%) | 4 (12.9%) |
| 45 to 54 Years | 18 (28.6%) | 15 (32.6%) |
| 55 to 64 Years | 11 (14.5%) | 11 (13.1%) |
| 65 to 74 Years | 1 (2.4%) | 6 (11.3%) |
| 75 Years and over | 4 (16.0%) | 2 (6.1%) |
| Total | 60 (12.8%) | 52 (14.1%) |
Income Above Poverty by Sex and Age in Salamatof
According to the poverty statistics in Salamatof, males aged 5 years and females aged under 5 years are the age groups that are most secure financially, with 100.0% of males and 100.0% of females in these age groups living above the poverty line.
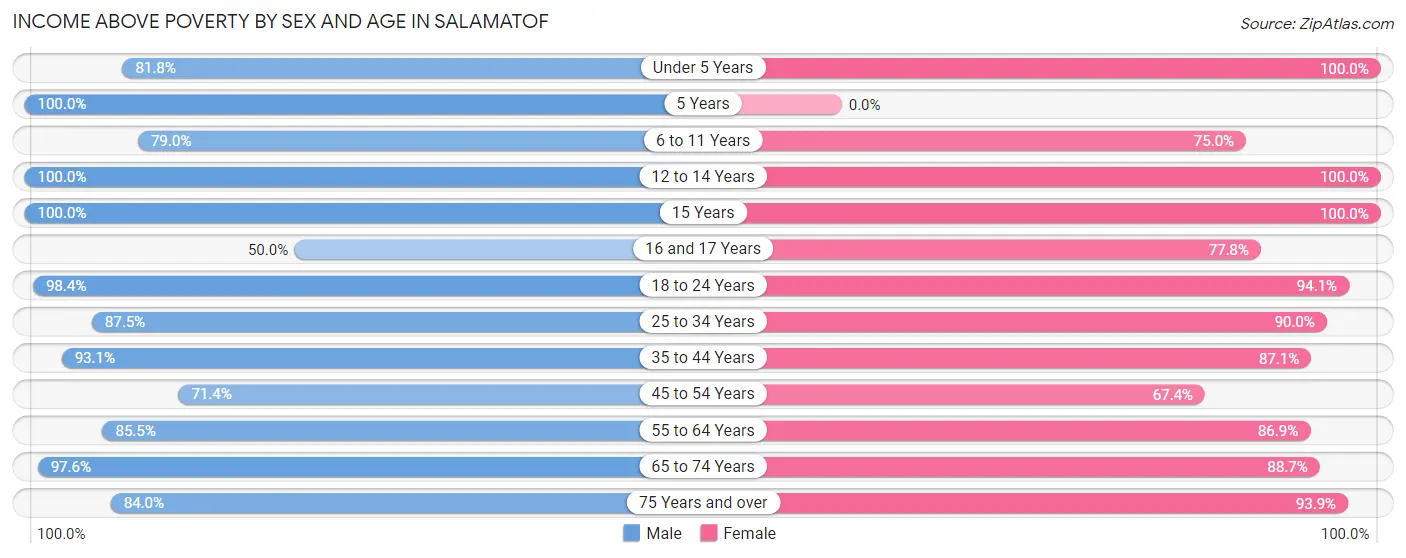
| Age Bracket | Male | Female |
| Under 5 Years | 18 (81.8%) | 16 (100.0%) |
| 5 Years | 2 (100.0%) | 0 (0.0%) |
| 6 to 11 Years | 15 (78.9%) | 15 (75.0%) |
| 12 to 14 Years | 5 (100.0%) | 4 (100.0%) |
| 15 Years | 2 (100.0%) | 1 (100.0%) |
| 16 and 17 Years | 9 (50.0%) | 7 (77.8%) |
| 18 to 24 Years | 126 (98.4%) | 48 (94.1%) |
| 25 to 34 Years | 35 (87.5%) | 18 (90.0%) |
| 35 to 44 Years | 27 (93.1%) | 27 (87.1%) |
| 45 to 54 Years | 45 (71.4%) | 31 (67.4%) |
| 55 to 64 Years | 65 (85.5%) | 73 (86.9%) |
| 65 to 74 Years | 40 (97.6%) | 47 (88.7%) |
| 75 Years and over | 21 (84.0%) | 31 (93.9%) |
| Total | 410 (87.2%) | 318 (86.0%) |
Income Below Poverty Among Married-Couple Families in Salamatof
The poverty statistics for married-couple families in Salamatof show that 6.9% or 11 of the total 159 families live below the poverty line. Families with no children have the highest poverty rate of 7.8%, comprising of 9 families. On the other hand, families with 3 or 4 children have the lowest poverty rate of 0.0%, which includes 0 families.
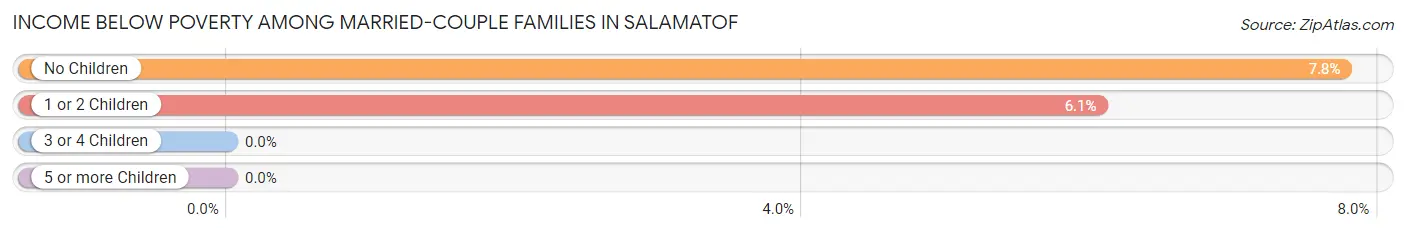
| Children | Above Poverty | Below Poverty |
| No Children | 107 (92.2%) | 9 (7.8%) |
| 1 or 2 Children | 31 (93.9%) | 2 (6.1%) |
| 3 or 4 Children | 10 (100.0%) | 0 (0.0%) |
| 5 or more Children | 0 (0.0%) | 0 (0.0%) |
| Total | 148 (93.1%) | 11 (6.9%) |
Income Below Poverty Among Single-Parent Households in Salamatof
According to the poverty data in Salamatof, 15.4% or 2 single-father households and 11.8% or 2 single-mother households are living below the poverty line. Among single-father households, those with 3 or 4 children have the highest poverty rate, with 2 households (50.0%) experiencing poverty. Likewise, among single-mother households, those with 1 or 2 children have the highest poverty rate, with 2 households (18.2%) falling below the poverty line.
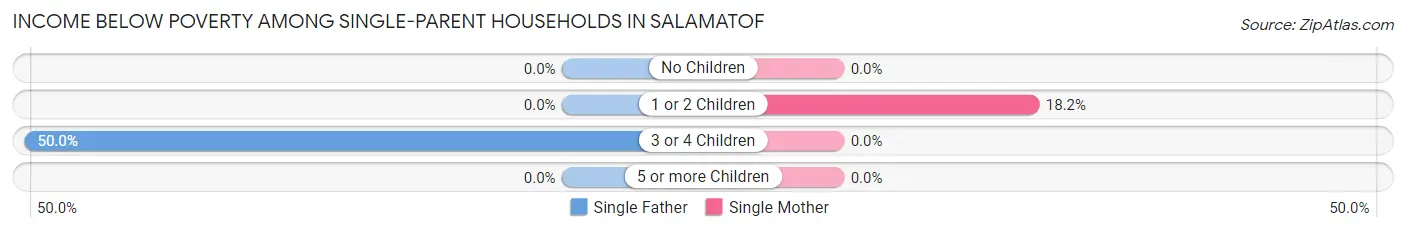
| Children | Single Father | Single Mother |
| No Children | 0 (0.0%) | 0 (0.0%) |
| 1 or 2 Children | 0 (0.0%) | 2 (18.2%) |
| 3 or 4 Children | 2 (50.0%) | 0 (0.0%) |
| 5 or more Children | 0 (0.0%) | 0 (0.0%) |
| Total | 2 (15.4%) | 2 (11.8%) |
Income Below Poverty Among Married-Couple vs Single-Parent Households in Salamatof
The poverty data for Salamatof shows that 11 of the married-couple family households (6.9%) and 4 of the single-parent households (13.3%) are living below the poverty level. Within the married-couple family households, those with no children have the highest poverty rate, with 9 households (7.8%) falling below the poverty line. Among the single-parent households, those with 3 or 4 children have the highest poverty rate, with 2 household (50.0%) living below poverty.
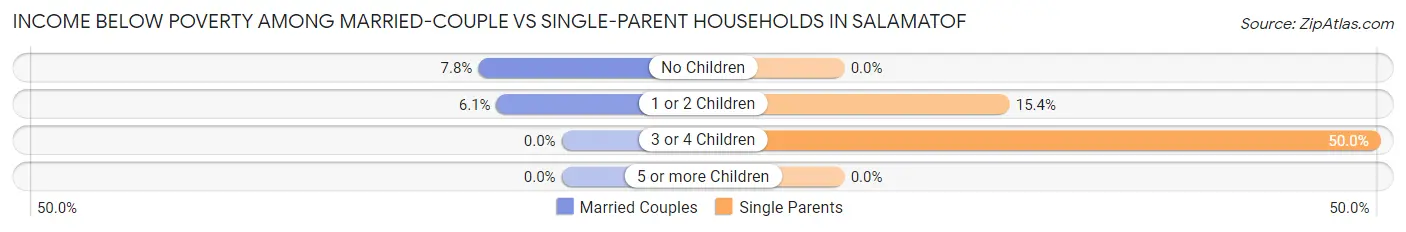
| Children | Married-Couple Families | Single-Parent Households |
| No Children | 9 (7.8%) | 0 (0.0%) |
| 1 or 2 Children | 2 (6.1%) | 2 (15.4%) |
| 3 or 4 Children | 0 (0.0%) | 2 (50.0%) |
| 5 or more Children | 0 (0.0%) | 0 (0.0%) |
| Total | 11 (6.9%) | 4 (13.3%) |
Race in Salamatof
The most populous races in Salamatof are White / Caucasian (861 | 72.4%), Native / Alaskan (188 | 15.8%), and Two or more Races (99 | 8.3%).
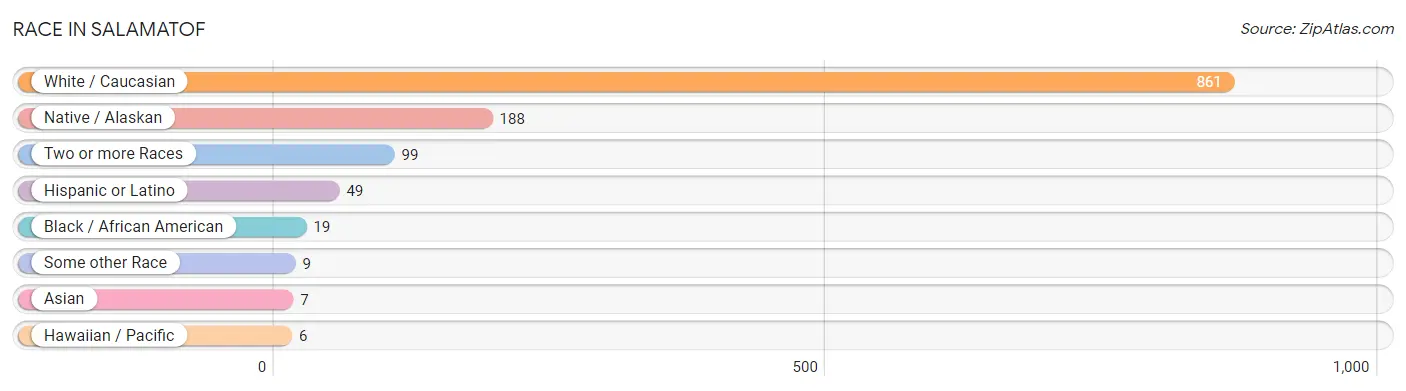
| Race | # Population | % Population |
| Asian | 7 | 0.6% |
| Black / African American | 19 | 1.6% |
| Hawaiian / Pacific | 6 | 0.5% |
| Hispanic or Latino | 49 | 4.1% |
| Native / Alaskan | 188 | 15.8% |
| White / Caucasian | 861 | 72.4% |
| Two or more Races | 99 | 8.3% |
| Some other Race | 9 | 0.8% |
| Total | 1,189 | 100.0% |
Ancestry in Salamatof
The most populous ancestries reported in Salamatof are German (236 | 19.9%), Scottish (154 | 13.0%), Alaska Native (128 | 10.8%), Irish (115 | 9.7%), and English (84 | 7.1%), together accounting for 60.3% of all Salamatof residents.
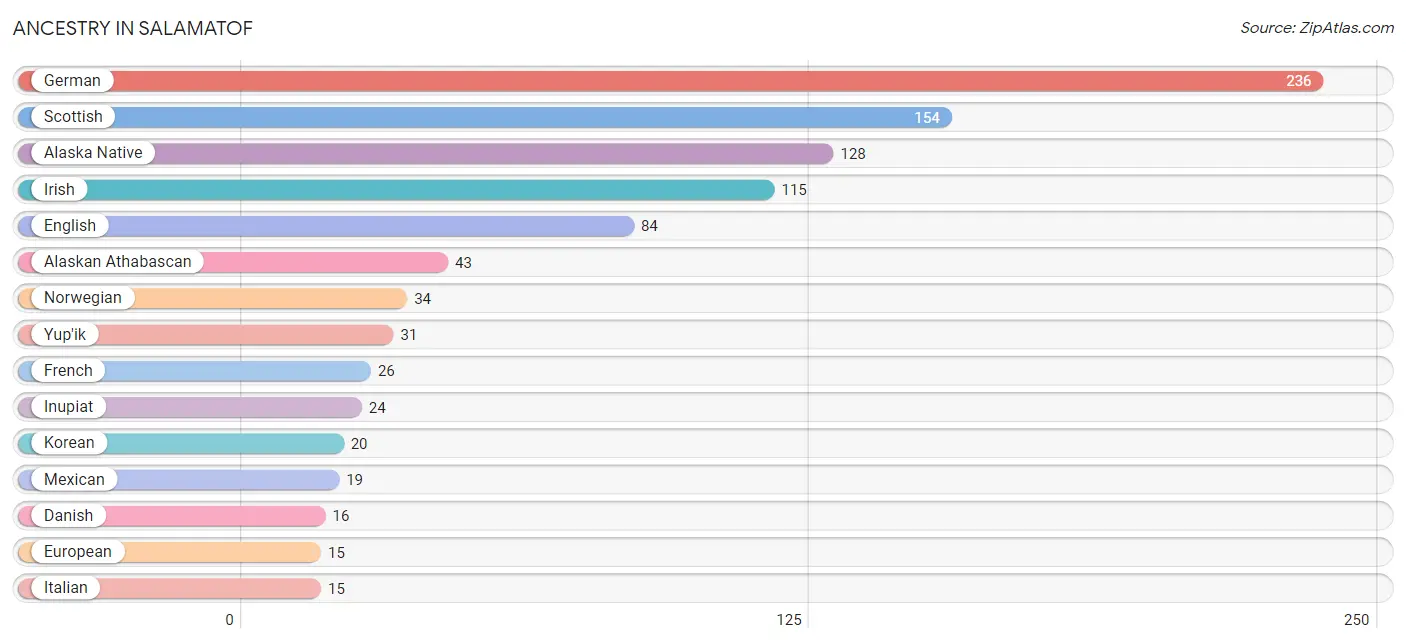
| Ancestry | # Population | % Population |
| Alaska Native | 128 | 10.8% |
| Alaskan Athabascan | 43 | 3.6% |
| Aleut | 10 | 0.8% |
| American | 14 | 1.2% |
| Apache | 3 | 0.3% |
| Bhutanese | 3 | 0.3% |
| Blackfeet | 1 | 0.1% |
| British | 7 | 0.6% |
| Cherokee | 6 | 0.5% |
| Chippewa | 3 | 0.3% |
| Colombian | 1 | 0.1% |
| Croatian | 2 | 0.2% |
| Cuban | 11 | 0.9% |
| Czech | 10 | 0.8% |
| Danish | 16 | 1.3% |
| Dutch | 10 | 0.8% |
| English | 84 | 7.1% |
| European | 15 | 1.3% |
| Finnish | 4 | 0.3% |
| French | 26 | 2.2% |
| French American Indian | 1 | 0.1% |
| French Canadian | 11 | 0.9% |
| German | 236 | 19.9% |
| Inupiat | 24 | 2.0% |
| Irish | 115 | 9.7% |
| Italian | 15 | 1.3% |
| Korean | 20 | 1.7% |
| Lithuanian | 2 | 0.2% |
| Mexican | 19 | 1.6% |
| Native Hawaiian | 9 | 0.8% |
| Norwegian | 34 | 2.9% |
| Polish | 4 | 0.3% |
| Portuguese | 5 | 0.4% |
| Puget Sound Salish | 4 | 0.3% |
| Russian | 5 | 0.4% |
| Scandinavian | 6 | 0.5% |
| Scotch-Irish | 14 | 1.2% |
| Scottish | 154 | 13.0% |
| Serbian | 2 | 0.2% |
| Slovak | 2 | 0.2% |
| South American | 1 | 0.1% |
| Spanish | 11 | 0.9% |
| Sri Lankan | 4 | 0.3% |
| Swedish | 6 | 0.5% |
| Swiss | 10 | 0.8% |
| Tlingit-Haida | 1 | 0.1% |
| Tsimshian | 1 | 0.1% |
| Ukrainian | 3 | 0.3% |
| Welsh | 9 | 0.8% |
| Yugoslavian | 7 | 0.6% |
| Yup'ik | 31 | 2.6% | View All 51 Rows |
Immigrants in Salamatof
The most numerous immigrant groups reported in Salamatof came from Asia (7 | 0.6%), Philippines (7 | 0.6%), South Eastern Asia (7 | 0.6%), Europe (4 | 0.3%), and Eastern Europe (2 | 0.2%), together accounting for 2.3% of all Salamatof residents.
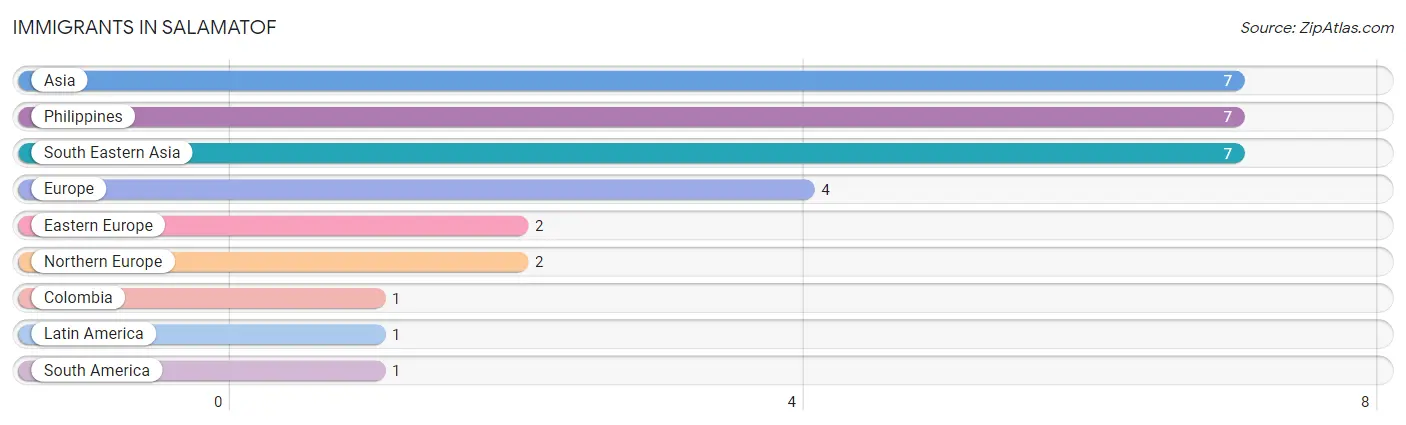
| Immigration Origin | # Population | % Population |
| Asia | 7 | 0.6% |
| Colombia | 1 | 0.1% |
| Eastern Europe | 2 | 0.2% |
| Europe | 4 | 0.3% |
| Latin America | 1 | 0.1% |
| Northern Europe | 2 | 0.2% |
| Philippines | 7 | 0.6% |
| South America | 1 | 0.1% |
| South Eastern Asia | 7 | 0.6% | View All 9 Rows |
Sex and Age in Salamatof
Sex and Age in Salamatof
The most populous age groups in Salamatof are 20 to 24 Years (120 | 14.9%) for men and 55 to 59 Years (54 | 14.1%) for women.
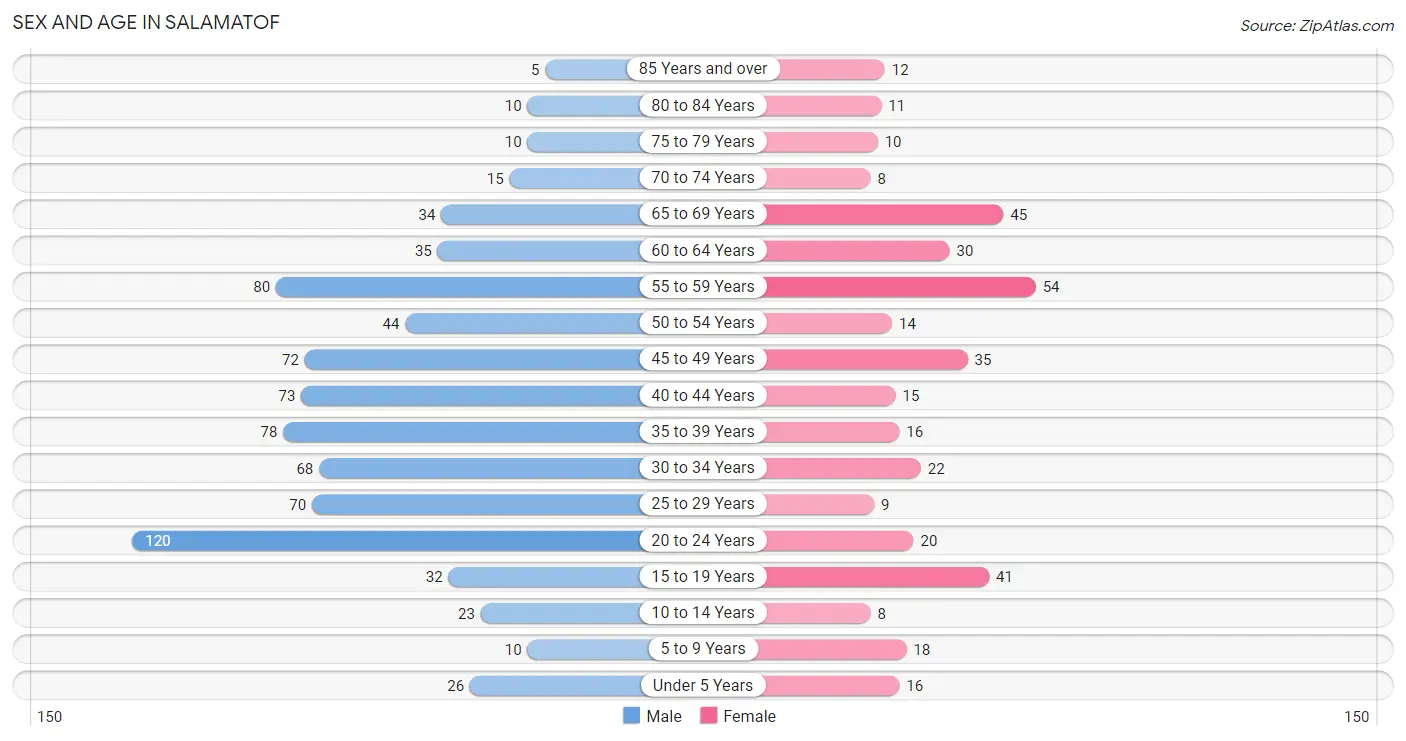
| Age Bracket | Male | Female |
| Under 5 Years | 26 (3.2%) | 16 (4.2%) |
| 5 to 9 Years | 10 (1.2%) | 18 (4.7%) |
| 10 to 14 Years | 23 (2.9%) | 8 (2.1%) |
| 15 to 19 Years | 32 (4.0%) | 41 (10.7%) |
| 20 to 24 Years | 120 (14.9%) | 20 (5.2%) |
| 25 to 29 Years | 70 (8.7%) | 9 (2.3%) |
| 30 to 34 Years | 68 (8.5%) | 22 (5.7%) |
| 35 to 39 Years | 78 (9.7%) | 16 (4.2%) |
| 40 to 44 Years | 73 (9.1%) | 15 (3.9%) |
| 45 to 49 Years | 72 (8.9%) | 35 (9.1%) |
| 50 to 54 Years | 44 (5.5%) | 14 (3.6%) |
| 55 to 59 Years | 80 (9.9%) | 54 (14.1%) |
| 60 to 64 Years | 35 (4.3%) | 30 (7.8%) |
| 65 to 69 Years | 34 (4.2%) | 45 (11.7%) |
| 70 to 74 Years | 15 (1.9%) | 8 (2.1%) |
| 75 to 79 Years | 10 (1.2%) | 10 (2.6%) |
| 80 to 84 Years | 10 (1.2%) | 11 (2.9%) |
| 85 Years and over | 5 (0.6%) | 12 (3.1%) |
| Total | 805 (100.0%) | 384 (100.0%) |
Families and Households in Salamatof
Median Family Size in Salamatof
The median family size in Salamatof is 3.56 persons per family, with single male/father families (13 | 6.9%) accounting for the largest median family size of 3.62 persons per family. On the other hand, married-couple families (159 | 84.1%) represent the smallest median family size with 3.55 persons per family.
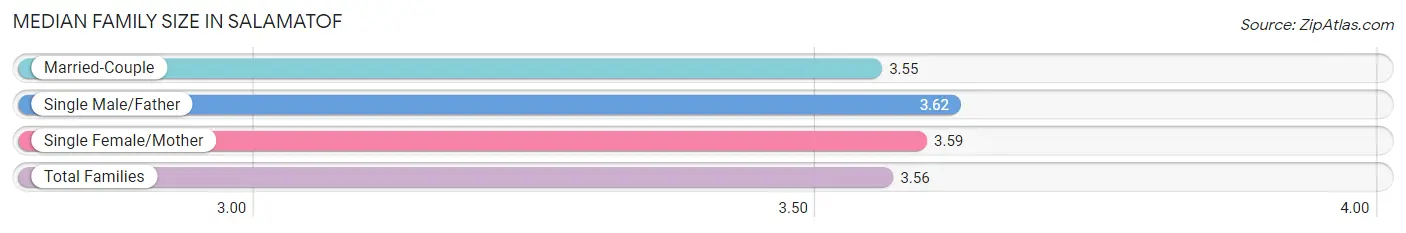
| Family Type | # Families | Family Size |
| Married-Couple | 159 (84.1%) | 3.55 |
| Single Male/Father | 13 (6.9%) | 3.62 |
| Single Female/Mother | 17 (9.0%) | 3.59 |
| Total Families | 189 (100.0%) | 3.56 |
Median Household Size in Salamatof
The median household size in Salamatof is 2.85 persons per household, with single male/father households (13 | 4.4%) accounting for the largest median household size of 5.23 persons per household. non-family households (109 | 36.6%) represent the smallest median household size with 1.19 persons per household.
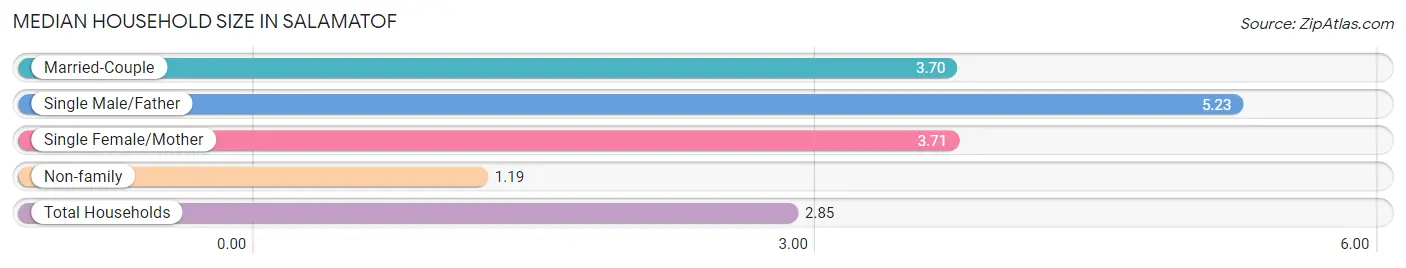
| Household Type | # Households | Household Size |
| Married-Couple | 159 (53.4%) | 3.70 |
| Single Male/Father | 13 (4.4%) | 5.23 |
| Single Female/Mother | 17 (5.7%) | 3.71 |
| Non-family | 109 (36.6%) | 1.19 |
| Total Households | 298 (100.0%) | 2.85 |
Household Size by Marriage Status in Salamatof
Out of a total of 298 households in Salamatof, 189 (63.4%) are family households, while 109 (36.6%) are nonfamily households. The most numerous type of family households are 2-person households, comprising 94, and the most common type of nonfamily households are 1-person households, comprising 88.
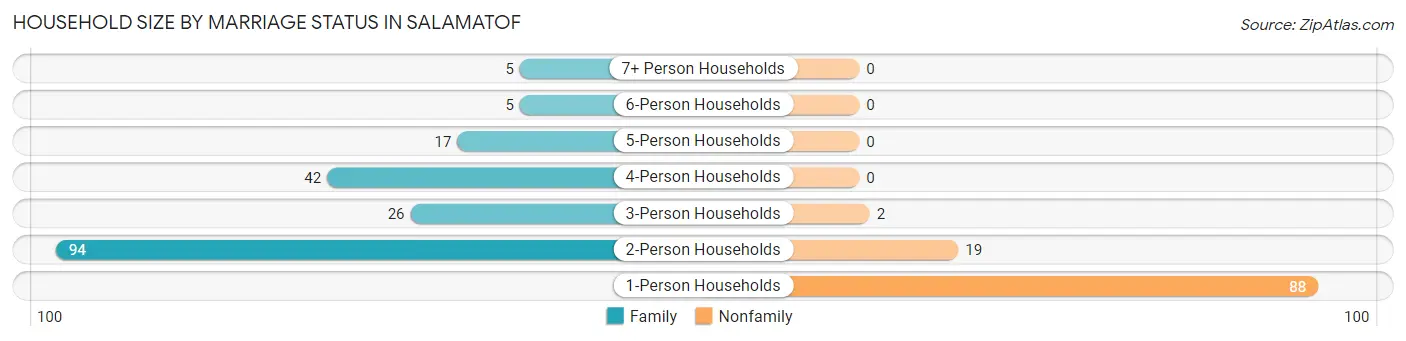
| Household Size | Family Households | Nonfamily Households |
| 1-Person Households | - | 88 (29.5%) |
| 2-Person Households | 94 (31.5%) | 19 (6.4%) |
| 3-Person Households | 26 (8.7%) | 2 (0.7%) |
| 4-Person Households | 42 (14.1%) | 0 (0.0%) |
| 5-Person Households | 17 (5.7%) | 0 (0.0%) |
| 6-Person Households | 5 (1.7%) | 0 (0.0%) |
| 7+ Person Households | 5 (1.7%) | 0 (0.0%) |
| Total | 189 (63.4%) | 109 (36.6%) |
Female Fertility in Salamatof
Fertility by Age in Salamatof
Average fertility rate in Salamatof is 12.0 births per 1,000 women. Women in the age bracket of 20 to 34 years have the highest fertility rate with 39.0 births per 1,000 women. Women in the age bracket of 20 to 34 years acount for 100.0% of all women with births.
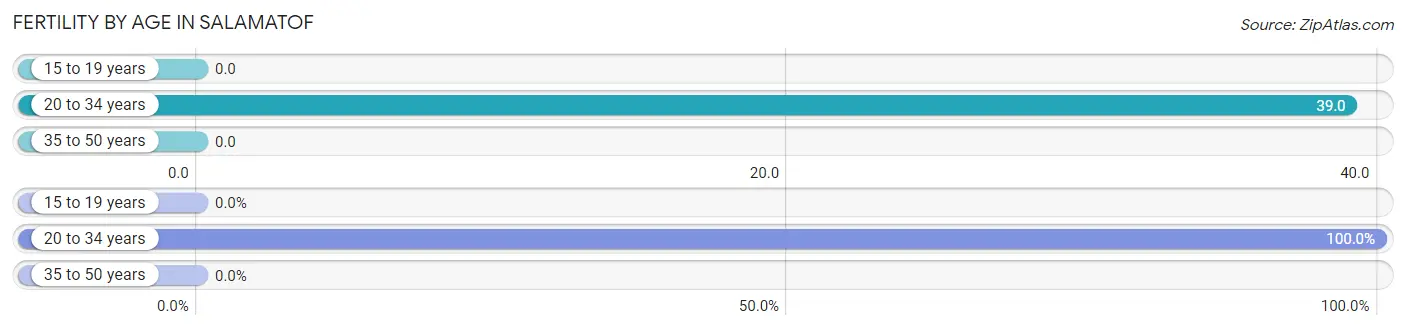
| Age Bracket | Women with Births | Births / 1,000 Women |
| 15 to 19 years | 0 (0.0%) | 0.0 |
| 20 to 34 years | 2 (100.0%) | 39.0 |
| 35 to 50 years | 0 (0.0%) | 0.0 |
| Total | 2 (100.0%) | 12.0 |
Fertility by Age by Marriage Status in Salamatof
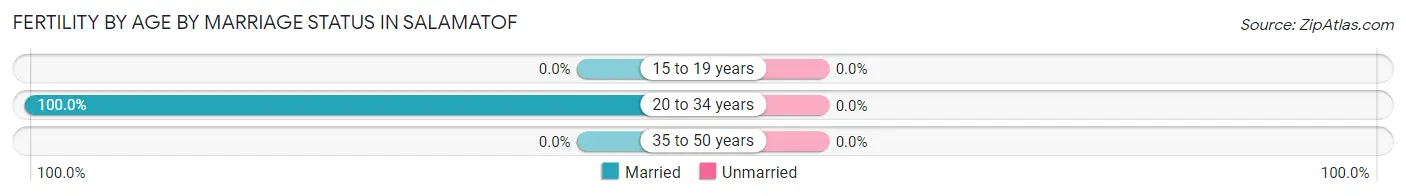
| Age Bracket | Married | Unmarried |
| 15 to 19 years | 0 (0.0%) | 0 (0.0%) |
| 20 to 34 years | 2 (100.0%) | 0 (0.0%) |
| 35 to 50 years | 0 (0.0%) | 0 (0.0%) |
| Total | 2 (100.0%) | 0 (0.0%) |
Fertility by Education in Salamatof
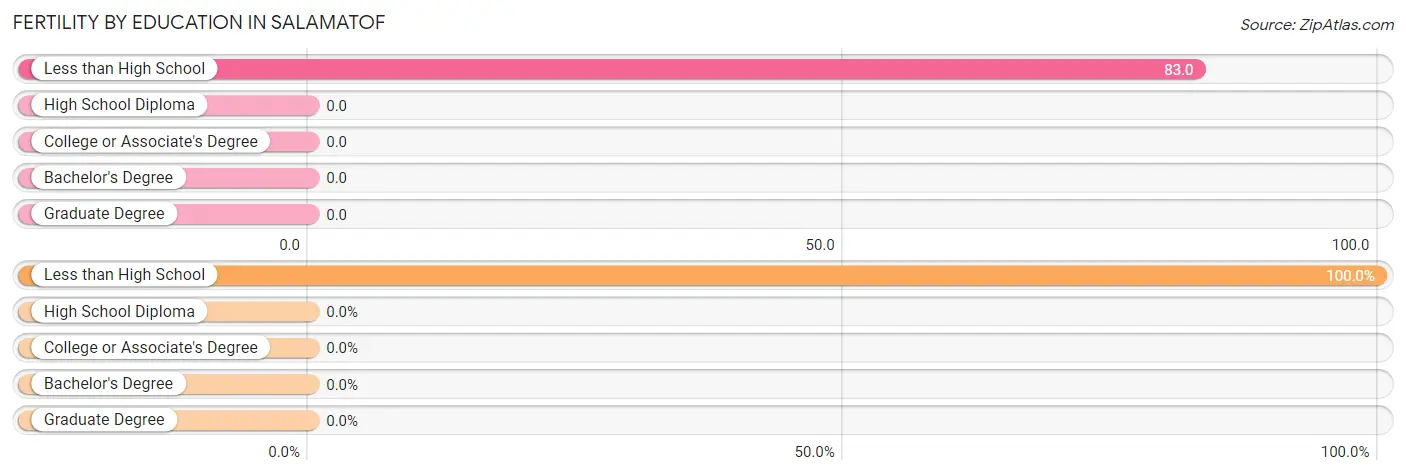
| Educational Attainment | Women with Births | Births / 1,000 Women |
| Less than High School | 2 (100.0%) | 83.0 |
| High School Diploma | 0 (0.0%) | 0.0 |
| College or Associate's Degree | 0 (0.0%) | 0.0 |
| Bachelor's Degree | 0 (0.0%) | 0.0 |
| Graduate Degree | 0 (0.0%) | 0.0 |
| Total | 2 (100.0%) | 12.0 |
Fertility by Education by Marriage Status in Salamatof
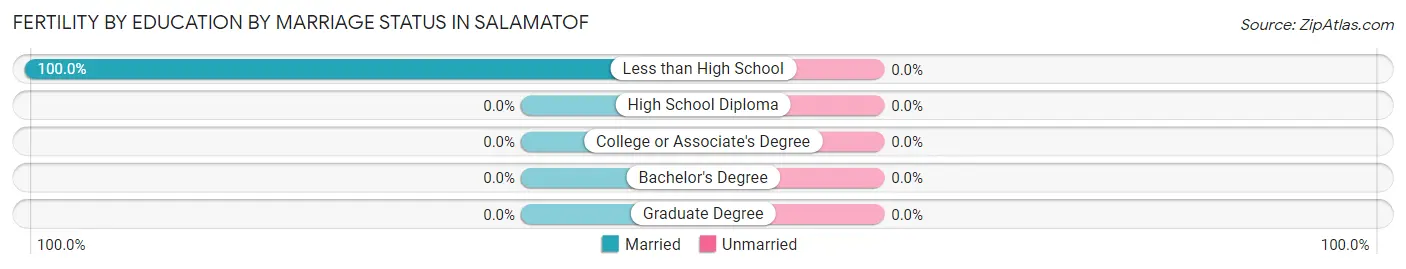
| Educational Attainment | Married | Unmarried |
| Less than High School | 2 (100.0%) | 0 (0.0%) |
| High School Diploma | 0 (0.0%) | 0 (0.0%) |
| College or Associate's Degree | 0 (0.0%) | 0 (0.0%) |
| Bachelor's Degree | 0 (0.0%) | 0 (0.0%) |
| Graduate Degree | 0 (0.0%) | 0 (0.0%) |
| Total | 2 (100.0%) | 0 (0.0%) |
Employment Characteristics in Salamatof
Employment by Class of Employer in Salamatof
Among the 280 employed individuals in Salamatof, private company employees (184 | 65.7%), not-for-profit organizations (22 | 7.9%), and federal government employees (19 | 6.8%) make up the most common classes of employment.
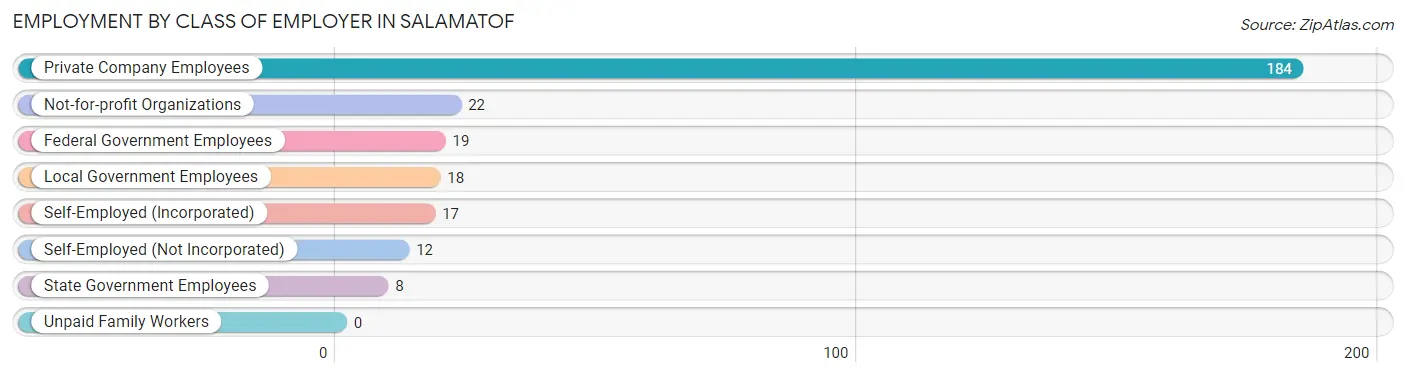
| Employer Class | # Employees | % Employees |
| Private Company Employees | 184 | 65.7% |
| Self-Employed (Incorporated) | 17 | 6.1% |
| Self-Employed (Not Incorporated) | 12 | 4.3% |
| Not-for-profit Organizations | 22 | 7.9% |
| Local Government Employees | 18 | 6.4% |
| State Government Employees | 8 | 2.9% |
| Federal Government Employees | 19 | 6.8% |
| Unpaid Family Workers | 0 | 0.0% |
| Total | 280 | 100.0% |
Employment Status by Age in Salamatof
According to the labor force statistics for Salamatof, out of the total population over 16 years of age (1,085), 39.5% or 429 individuals are in the labor force, with 31.8% or 136 of them unemployed. The age group with the highest labor force participation rate is 20 to 24 years, with 80.7% or 113 individuals in the labor force. Within the labor force, the 16 to 19 years age range has the highest percentage of unemployed individuals, with 79.5% or 31 of them being unemployed.
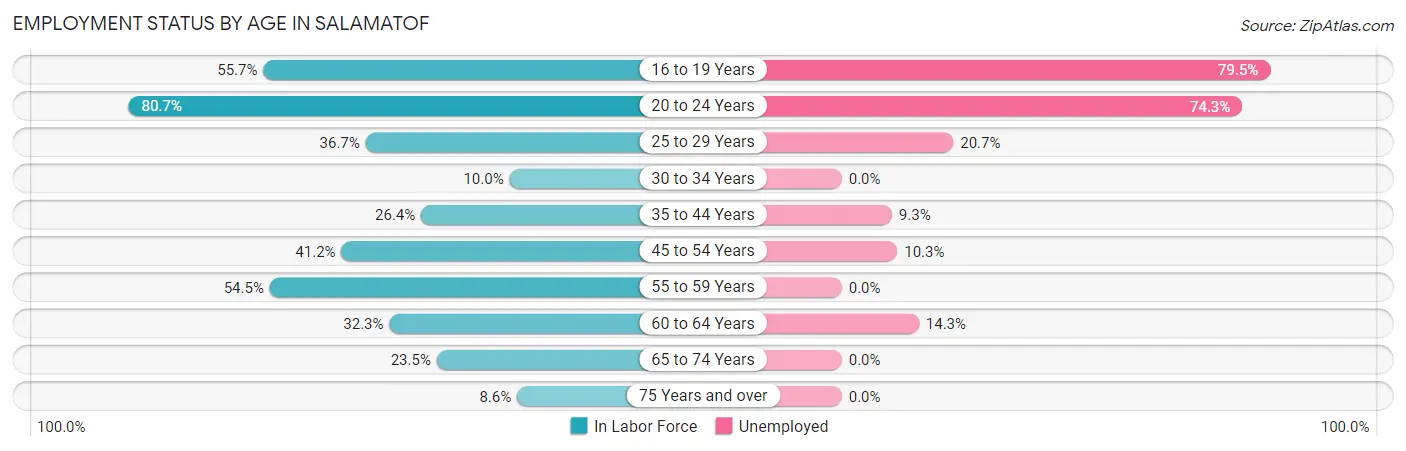
| Age Bracket | In Labor Force | Unemployed |
| 16 to 19 Years | 39 (55.7%) | 31 (79.5%) |
| 20 to 24 Years | 113 (80.7%) | 84 (74.3%) |
| 25 to 29 Years | 29 (36.7%) | 6 (20.7%) |
| 30 to 34 Years | 9 (10.0%) | 0 (0.0%) |
| 35 to 44 Years | 48 (26.4%) | 4 (9.3%) |
| 45 to 54 Years | 68 (41.2%) | 7 (10.3%) |
| 55 to 59 Years | 73 (54.5%) | 0 (0.0%) |
| 60 to 64 Years | 21 (32.3%) | 3 (14.3%) |
| 65 to 74 Years | 24 (23.5%) | 0 (0.0%) |
| 75 Years and over | 5 (8.6%) | 0 (0.0%) |
| Total | 429 (39.5%) | 136 (31.8%) |
Employment Status by Educational Attainment in Salamatof
According to labor force statistics for Salamatof, 34.7% of individuals (248) out of the total population between 25 and 64 years of age (715) are in the labor force, with 8.2% or 20 of them being unemployed. The group with the highest labor force participation rate are those with the educational attainment of college / associate degree, with 52.3% or 112 individuals in the labor force. Within the labor force, individuals with college / associate degree education have the highest percentage of unemployment, with 9.8% or 11 of them being unemployed.
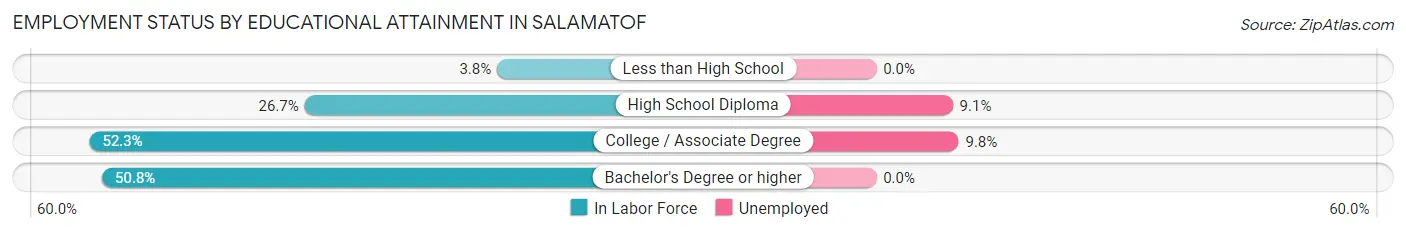
| Educational Attainment | In Labor Force | Unemployed |
| Less than High School | 2 (3.8%) | 0 (0.0%) |
| High School Diploma | 104 (26.7%) | 35 (9.1%) |
| College / Associate Degree | 112 (52.3%) | 21 (9.8%) |
| Bachelor's Degree or higher | 30 (50.8%) | 0 (0.0%) |
| Total | 248 (34.7%) | 59 (8.2%) |
Employment Occupations by Sex in Salamatof
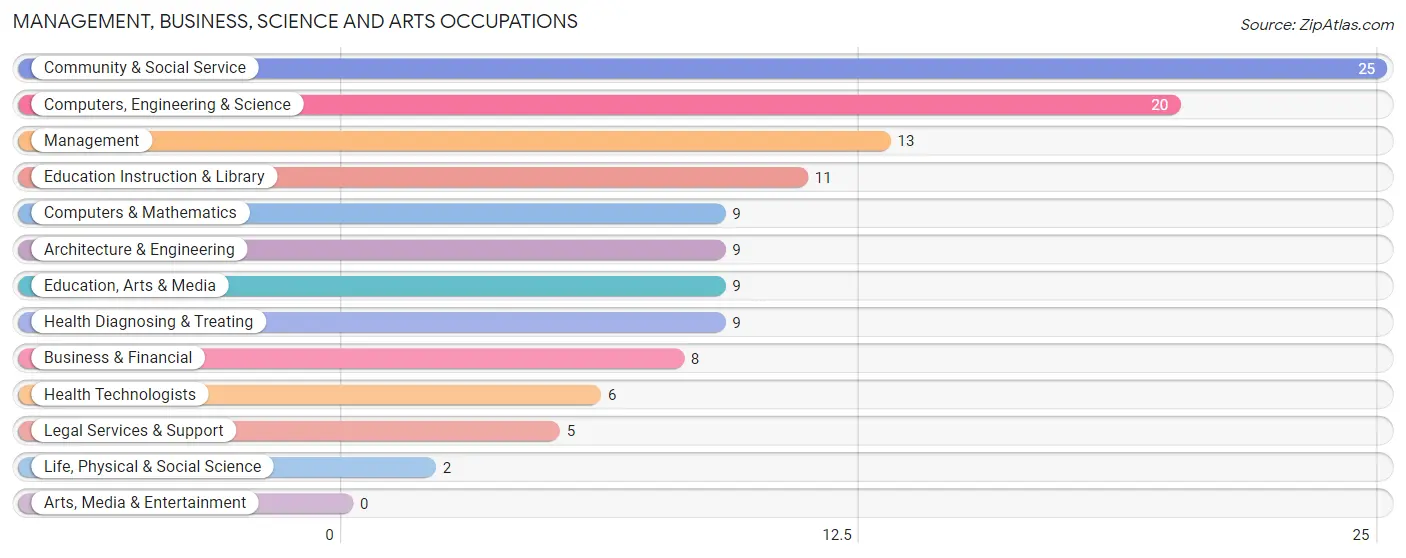
Management, Business, Science and Arts Occupations
The most common Management, Business, Science and Arts occupations in Salamatof are Community & Social Service (25 | 8.6%), Computers, Engineering & Science (20 | 6.9%), Management (13 | 4.5%), Education Instruction & Library (11 | 3.8%), and Computers & Mathematics (9 | 3.1%).
Management, Business, Science and Arts Occupations by Sex
Within the Management, Business, Science and Arts occupations in Salamatof, the most male-oriented occupations are Computers & Mathematics (100.0%), Life, Physical & Social Science (100.0%), and Legal Services & Support (100.0%), while the most female-oriented occupations are Business & Financial (100.0%), Education Instruction & Library (81.8%), and Architecture & Engineering (77.8%).
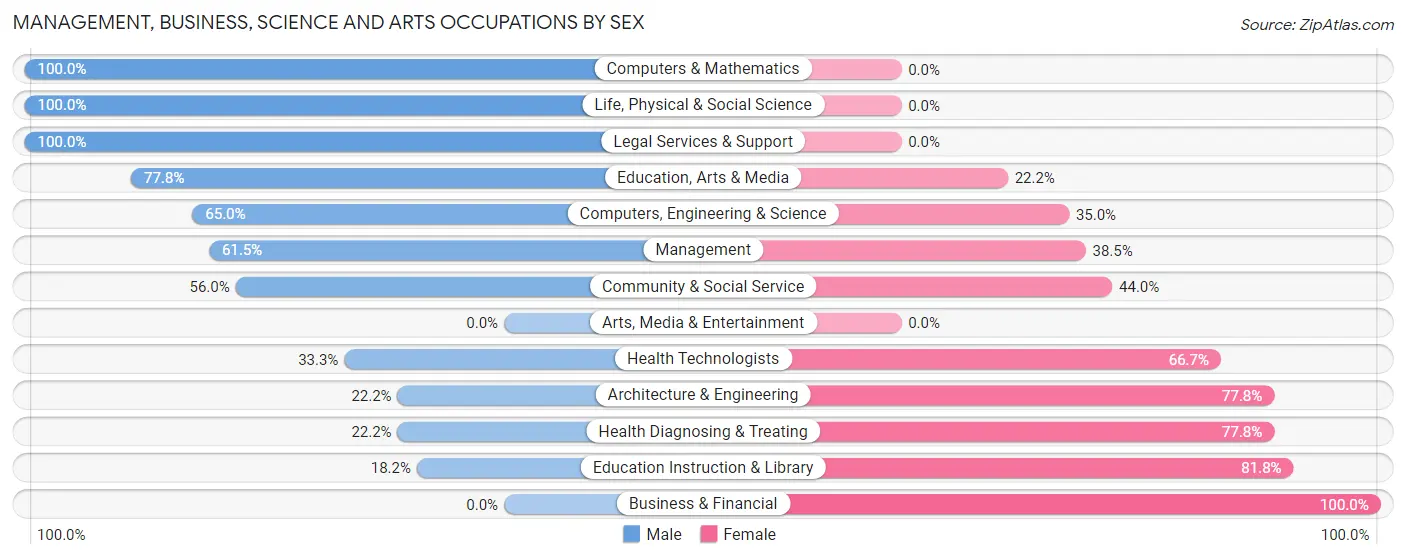
| Occupation | Male | Female |
| Management | 8 (61.5%) | 5 (38.5%) |
| Business & Financial | 0 (0.0%) | 8 (100.0%) |
| Computers, Engineering & Science | 13 (65.0%) | 7 (35.0%) |
| Computers & Mathematics | 9 (100.0%) | 0 (0.0%) |
| Architecture & Engineering | 2 (22.2%) | 7 (77.8%) |
| Life, Physical & Social Science | 2 (100.0%) | 0 (0.0%) |
| Community & Social Service | 14 (56.0%) | 11 (44.0%) |
| Education, Arts & Media | 7 (77.8%) | 2 (22.2%) |
| Legal Services & Support | 5 (100.0%) | 0 (0.0%) |
| Education Instruction & Library | 2 (18.2%) | 9 (81.8%) |
| Arts, Media & Entertainment | 0 (0.0%) | 0 (0.0%) |
| Health Diagnosing & Treating | 2 (22.2%) | 7 (77.8%) |
| Health Technologists | 2 (33.3%) | 4 (66.7%) |
| Total (Category) | 37 (49.3%) | 38 (50.7%) |
| Total (Overall) | 177 (61.3%) | 112 (38.8%) |
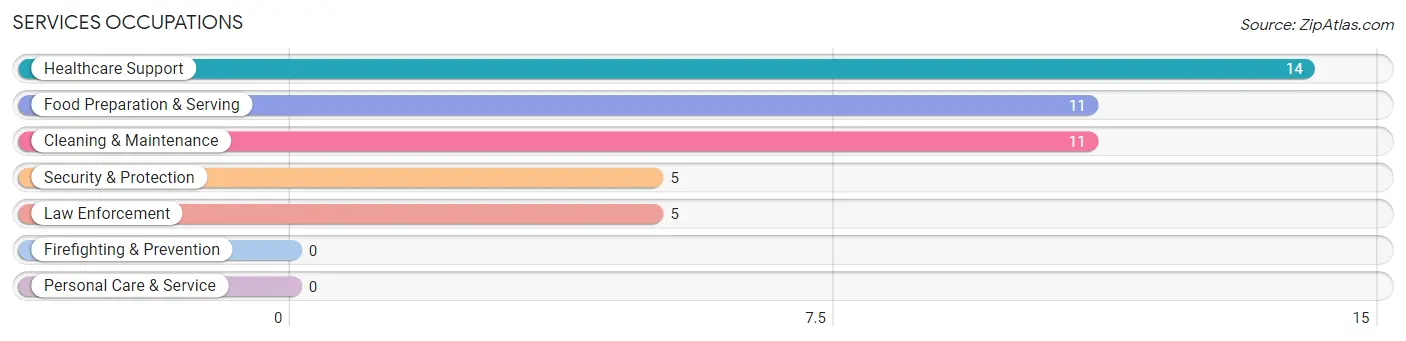
Services Occupations
The most common Services occupations in Salamatof are Healthcare Support (14 | 4.8%), Food Preparation & Serving (11 | 3.8%), Cleaning & Maintenance (11 | 3.8%), Security & Protection (5 | 1.7%), and Law Enforcement (5 | 1.7%).
Services Occupations by Sex
Within the Services occupations in Salamatof, the most male-oriented occupations are Security & Protection (100.0%), Law Enforcement (100.0%), and Cleaning & Maintenance (90.9%), while the most female-oriented occupations are Healthcare Support (78.6%), Food Preparation & Serving (54.5%), and Cleaning & Maintenance (9.1%).
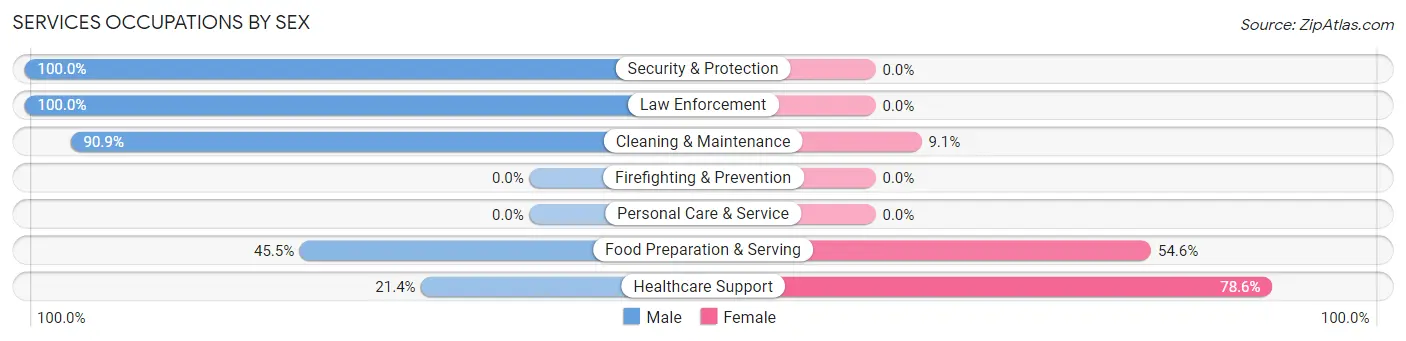
| Occupation | Male | Female |
| Healthcare Support | 3 (21.4%) | 11 (78.6%) |
| Security & Protection | 5 (100.0%) | 0 (0.0%) |
| Firefighting & Prevention | 0 (0.0%) | 0 (0.0%) |
| Law Enforcement | 5 (100.0%) | 0 (0.0%) |
| Food Preparation & Serving | 5 (45.5%) | 6 (54.5%) |
| Cleaning & Maintenance | 10 (90.9%) | 1 (9.1%) |
| Personal Care & Service | 0 (0.0%) | 0 (0.0%) |
| Total (Category) | 23 (56.1%) | 18 (43.9%) |
| Total (Overall) | 177 (61.3%) | 112 (38.8%) |
Sales and Office Occupations
The most common Sales and Office occupations in Salamatof are Office & Administration (50 | 17.3%), and Sales & Related (23 | 8.0%).
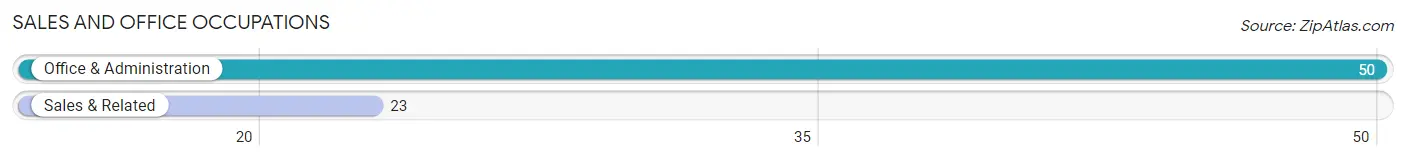
Sales and Office Occupations by Sex
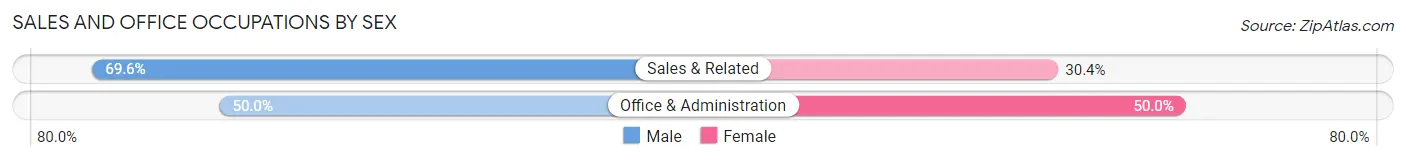
| Occupation | Male | Female |
| Sales & Related | 16 (69.6%) | 7 (30.4%) |
| Office & Administration | 25 (50.0%) | 25 (50.0%) |
| Total (Category) | 41 (56.2%) | 32 (43.8%) |
| Total (Overall) | 177 (61.3%) | 112 (38.8%) |
Natural Resources, Construction and Maintenance Occupations
The most common Natural Resources, Construction and Maintenance occupations in Salamatof are Construction & Extraction (35 | 12.1%), and Installation, Maintenance & Repair (12 | 4.2%).
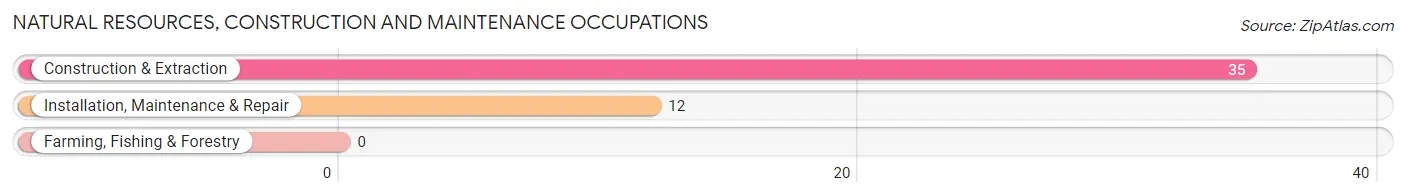
Natural Resources, Construction and Maintenance Occupations by Sex
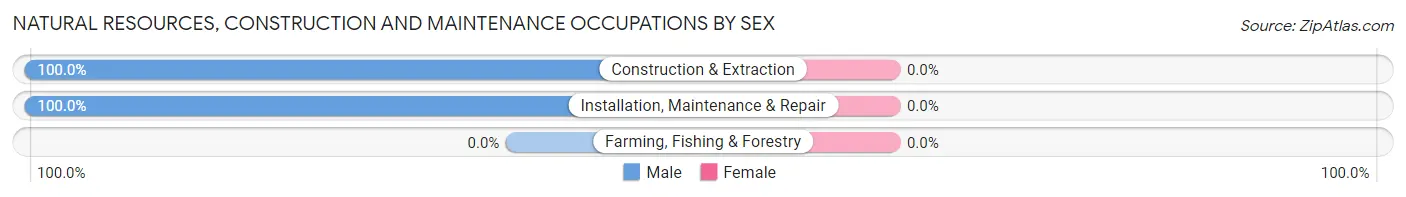
| Occupation | Male | Female |
| Farming, Fishing & Forestry | 0 (0.0%) | 0 (0.0%) |
| Construction & Extraction | 35 (100.0%) | 0 (0.0%) |
| Installation, Maintenance & Repair | 12 (100.0%) | 0 (0.0%) |
| Total (Category) | 47 (100.0%) | 0 (0.0%) |
| Total (Overall) | 177 (61.3%) | 112 (38.8%) |
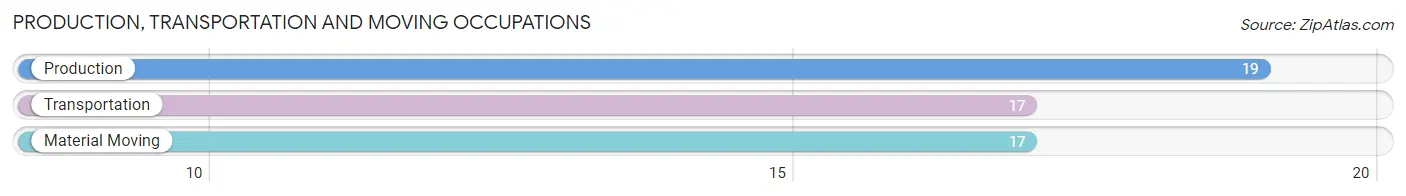
Production, Transportation and Moving Occupations
The most common Production, Transportation and Moving occupations in Salamatof are Production (19 | 6.6%), Transportation (17 | 5.9%), and Material Moving (17 | 5.9%).
Production, Transportation and Moving Occupations by Sex
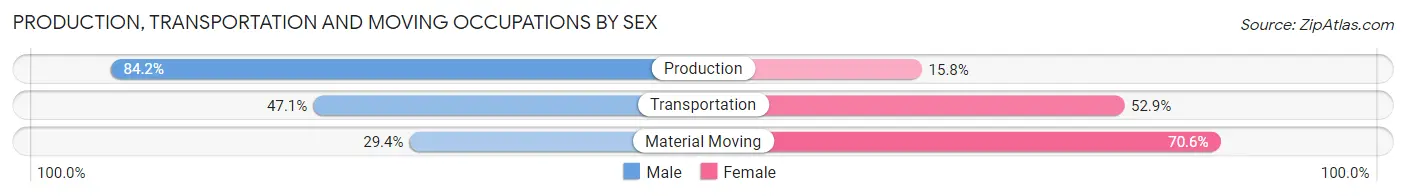
| Occupation | Male | Female |
| Production | 16 (84.2%) | 3 (15.8%) |
| Transportation | 8 (47.1%) | 9 (52.9%) |
| Material Moving | 5 (29.4%) | 12 (70.6%) |
| Total (Category) | 29 (54.7%) | 24 (45.3%) |
| Total (Overall) | 177 (61.3%) | 112 (38.8%) |
Employment Industries by Sex in Salamatof
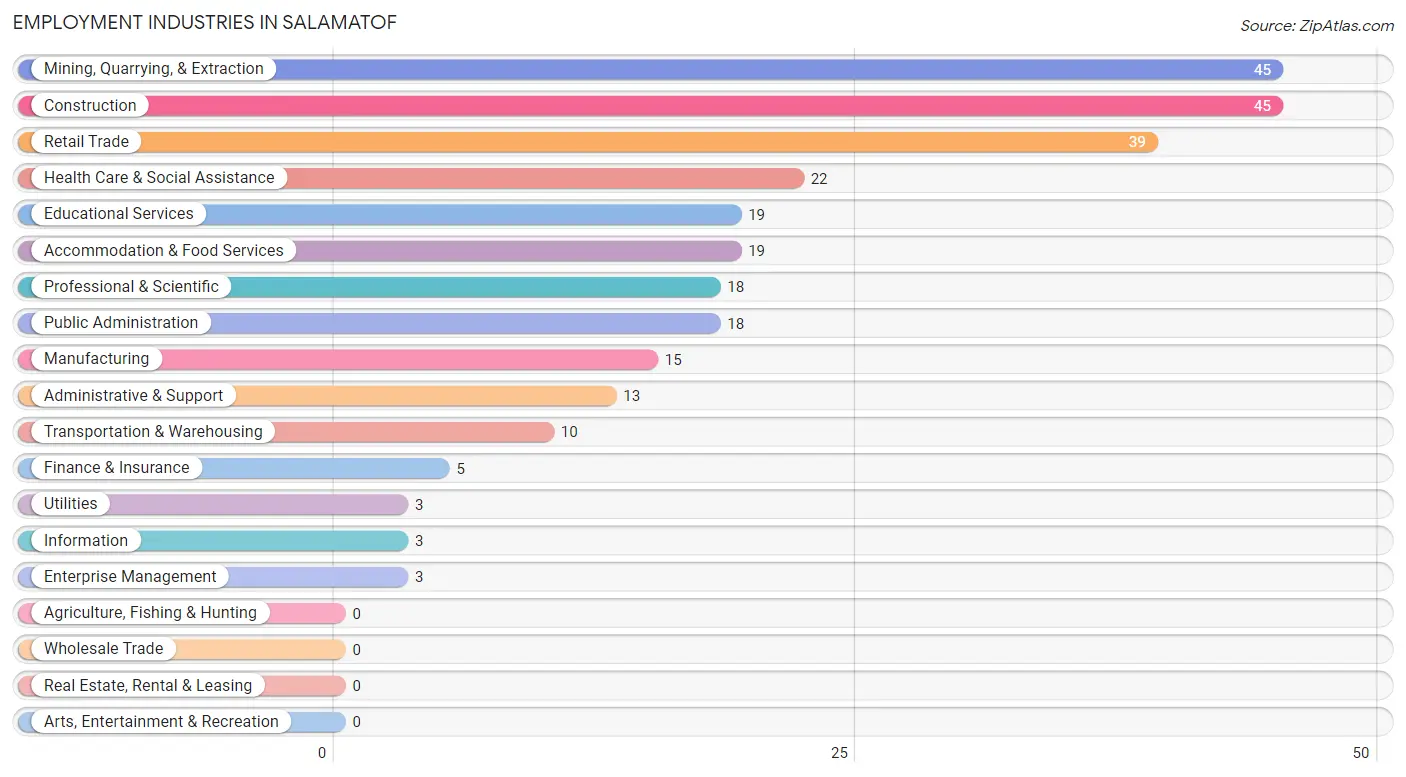
Employment Industries in Salamatof
The major employment industries in Salamatof include Mining, Quarrying, & Extraction (45 | 15.6%), Construction (45 | 15.6%), Retail Trade (39 | 13.5%), Health Care & Social Assistance (22 | 7.6%), and Educational Services (19 | 6.6%).
Employment Industries by Sex in Salamatof
The Salamatof industries that see more men than women are Utilities (100.0%), Finance & Insurance (100.0%), and Enterprise Management (100.0%), whereas the industries that tend to have a higher number of women are Information (100.0%), Accommodation & Food Services (73.7%), and Health Care & Social Assistance (72.7%).
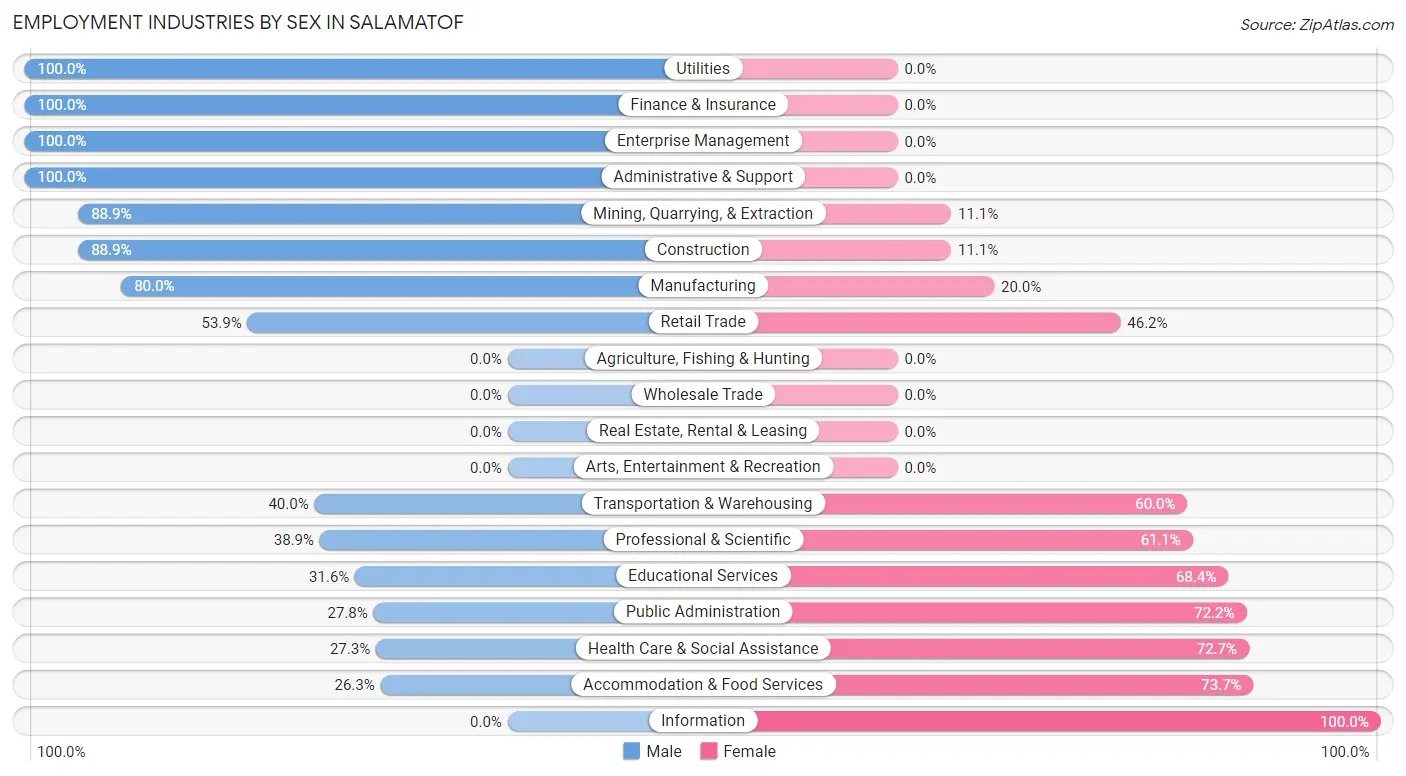
| Industry | Male | Female |
| Agriculture, Fishing & Hunting | 0 (0.0%) | 0 (0.0%) |
| Mining, Quarrying, & Extraction | 40 (88.9%) | 5 (11.1%) |
| Construction | 40 (88.9%) | 5 (11.1%) |
| Manufacturing | 12 (80.0%) | 3 (20.0%) |
| Wholesale Trade | 0 (0.0%) | 0 (0.0%) |
| Retail Trade | 21 (53.8%) | 18 (46.2%) |
| Transportation & Warehousing | 4 (40.0%) | 6 (60.0%) |
| Utilities | 3 (100.0%) | 0 (0.0%) |
| Information | 0 (0.0%) | 3 (100.0%) |
| Finance & Insurance | 5 (100.0%) | 0 (0.0%) |
| Real Estate, Rental & Leasing | 0 (0.0%) | 0 (0.0%) |
| Professional & Scientific | 7 (38.9%) | 11 (61.1%) |
| Enterprise Management | 3 (100.0%) | 0 (0.0%) |
| Administrative & Support | 13 (100.0%) | 0 (0.0%) |
| Educational Services | 6 (31.6%) | 13 (68.4%) |
| Health Care & Social Assistance | 6 (27.3%) | 16 (72.7%) |
| Arts, Entertainment & Recreation | 0 (0.0%) | 0 (0.0%) |
| Accommodation & Food Services | 5 (26.3%) | 14 (73.7%) |
| Public Administration | 5 (27.8%) | 13 (72.2%) |
| Total | 177 (61.3%) | 112 (38.8%) |
Education in Salamatof
School Enrollment in Salamatof
The most common levels of schooling among the 144 students in Salamatof are college / undergraduate (34 | 23.6%), high school (33 | 22.9%), and middle school (29 | 20.1%).
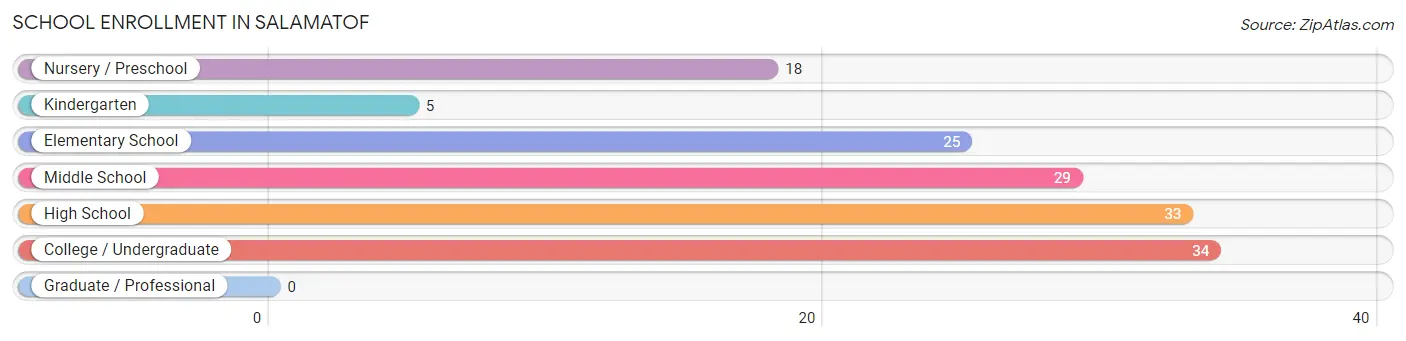
| School Level | # Students | % Students |
| Nursery / Preschool | 18 | 12.5% |
| Kindergarten | 5 | 3.5% |
| Elementary School | 25 | 17.4% |
| Middle School | 29 | 20.1% |
| High School | 33 | 22.9% |
| College / Undergraduate | 34 | 23.6% |
| Graduate / Professional | 0 | 0.0% |
| Total | 144 | 100.0% |
School Enrollment by Age by Funding Source in Salamatof
Out of a total of 144 students who are enrolled in schools in Salamatof, 43 (29.9%) attend a private institution, while the remaining 101 (70.1%) are enrolled in public schools. The age group of 20 to 24 year olds has the highest likelihood of being enrolled in private schools, with 3 (42.9% in the age bracket) enrolled. Conversely, the age group of 18 to 19 year olds has the lowest likelihood of being enrolled in a private school, with 2 (100.0% in the age bracket) attending a public institution.
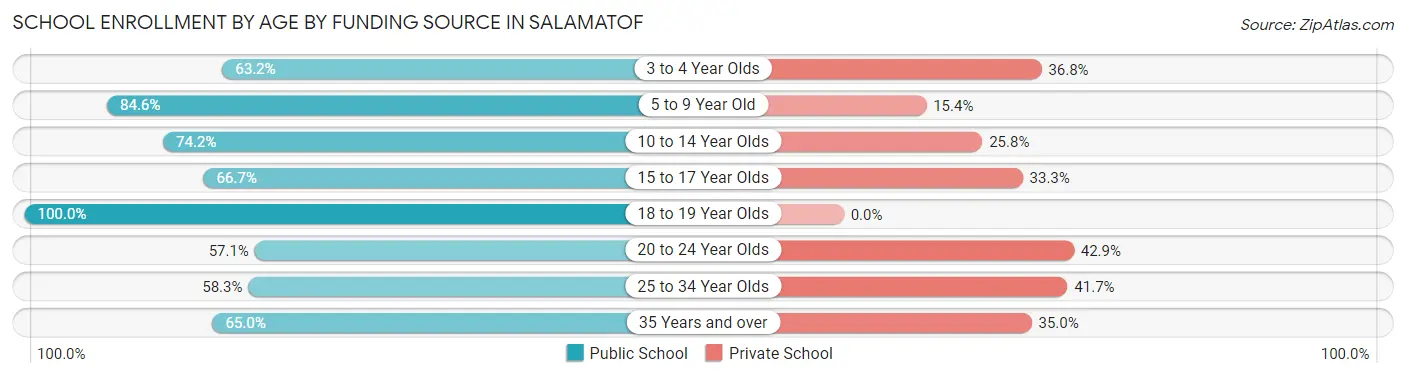
| Age Bracket | Public School | Private School |
| 3 to 4 Year Olds | 12 (63.2%) | 7 (36.8%) |
| 5 to 9 Year Old | 22 (84.6%) | 4 (15.4%) |
| 10 to 14 Year Olds | 23 (74.2%) | 8 (25.8%) |
| 15 to 17 Year Olds | 18 (66.7%) | 9 (33.3%) |
| 18 to 19 Year Olds | 2 (100.0%) | 0 (0.0%) |
| 20 to 24 Year Olds | 4 (57.1%) | 3 (42.9%) |
| 25 to 34 Year Olds | 7 (58.3%) | 5 (41.7%) |
| 35 Years and over | 13 (65.0%) | 7 (35.0%) |
| Total | 101 (70.1%) | 43 (29.9%) |
Educational Attainment by Field of Study in Salamatof
Liberal arts & history (25 | 24.3%), arts & humanities (15 | 14.6%), engineering (13 | 12.6%), education (13 | 12.6%), and physical & health sciences (8 | 7.8%) are the most common fields of study among 103 individuals in Salamatof who have obtained a bachelor's degree or higher.
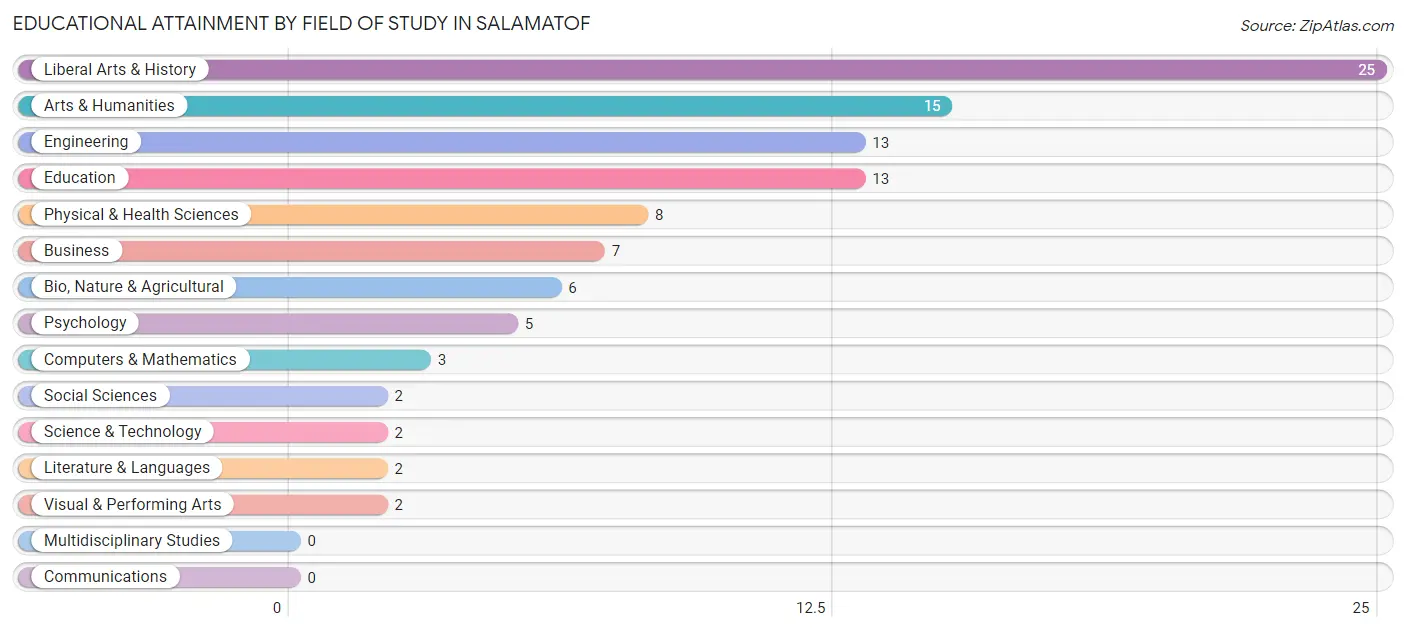
| Field of Study | # Graduates | % Graduates |
| Computers & Mathematics | 3 | 2.9% |
| Bio, Nature & Agricultural | 6 | 5.8% |
| Physical & Health Sciences | 8 | 7.8% |
| Psychology | 5 | 4.9% |
| Social Sciences | 2 | 1.9% |
| Engineering | 13 | 12.6% |
| Multidisciplinary Studies | 0 | 0.0% |
| Science & Technology | 2 | 1.9% |
| Business | 7 | 6.8% |
| Education | 13 | 12.6% |
| Literature & Languages | 2 | 1.9% |
| Liberal Arts & History | 25 | 24.3% |
| Visual & Performing Arts | 2 | 1.9% |
| Communications | 0 | 0.0% |
| Arts & Humanities | 15 | 14.6% |
| Total | 103 | 100.0% |
Transportation & Commute in Salamatof
Vehicle Availability by Sex in Salamatof
The most prevalent vehicle ownership categories in Salamatof are males with 2 vehicles (43, accounting for 25.9%) and females with 2 vehicles (38, making up 37.7%).
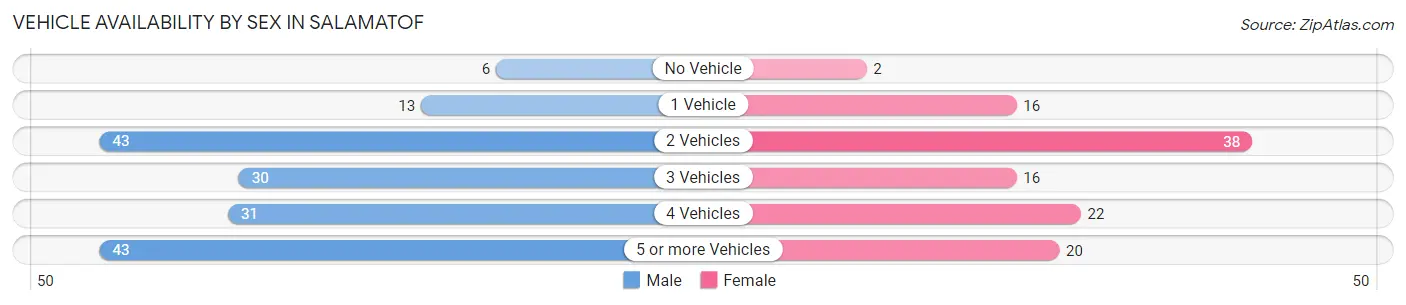
| Vehicles Available | Male | Female |
| No Vehicle | 6 (3.6%) | 2 (1.8%) |
| 1 Vehicle | 13 (7.8%) | 16 (14.0%) |
| 2 Vehicles | 43 (25.9%) | 38 (33.3%) |
| 3 Vehicles | 30 (18.1%) | 16 (14.0%) |
| 4 Vehicles | 31 (18.7%) | 22 (19.3%) |
| 5 or more Vehicles | 43 (25.9%) | 20 (17.5%) |
| Total | 166 (100.0%) | 114 (100.0%) |
Commute Time in Salamatof
The most frequently occuring commute durations in Salamatof are 30 to 34 minutes (50 commuters, 19.8%), 15 to 19 minutes (37 commuters, 14.6%), and 90 or more minutes (34 commuters, 13.4%).
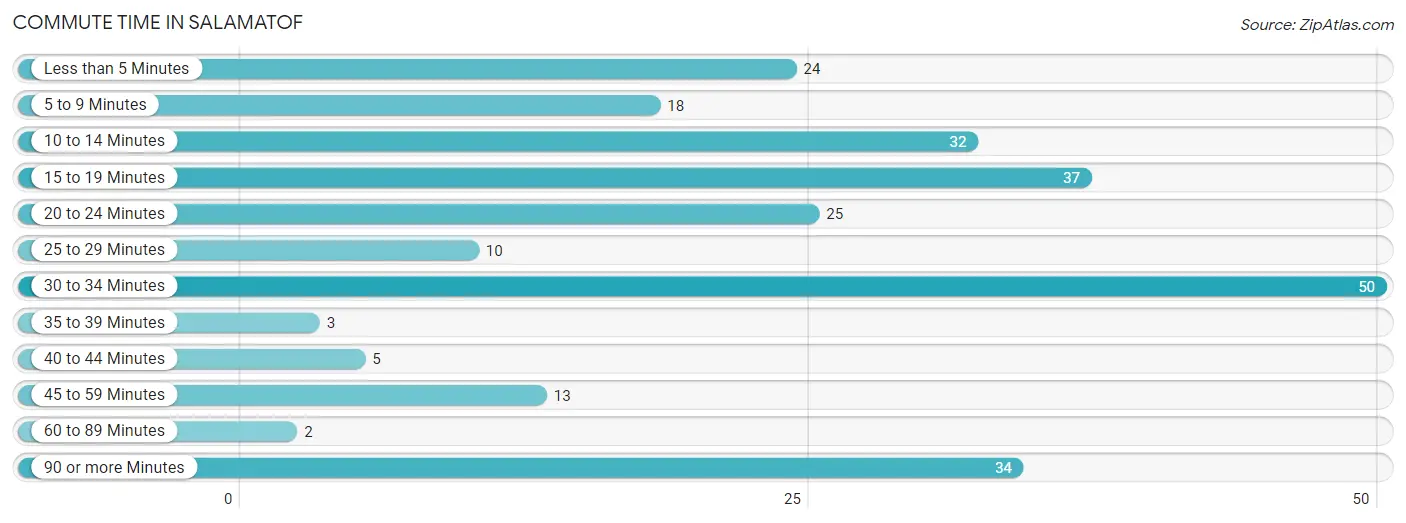
| Commute Time | # Commuters | % Commuters |
| Less than 5 Minutes | 24 | 9.5% |
| 5 to 9 Minutes | 18 | 7.1% |
| 10 to 14 Minutes | 32 | 12.7% |
| 15 to 19 Minutes | 37 | 14.6% |
| 20 to 24 Minutes | 25 | 9.9% |
| 25 to 29 Minutes | 10 | 4.0% |
| 30 to 34 Minutes | 50 | 19.8% |
| 35 to 39 Minutes | 3 | 1.2% |
| 40 to 44 Minutes | 5 | 2.0% |
| 45 to 59 Minutes | 13 | 5.1% |
| 60 to 89 Minutes | 2 | 0.8% |
| 90 or more Minutes | 34 | 13.4% |
Commute Time by Sex in Salamatof
The most common commute times in Salamatof are 90 or more minutes (33 commuters, 22.0%) for males and 15 to 19 minutes (19 commuters, 18.4%) for females.
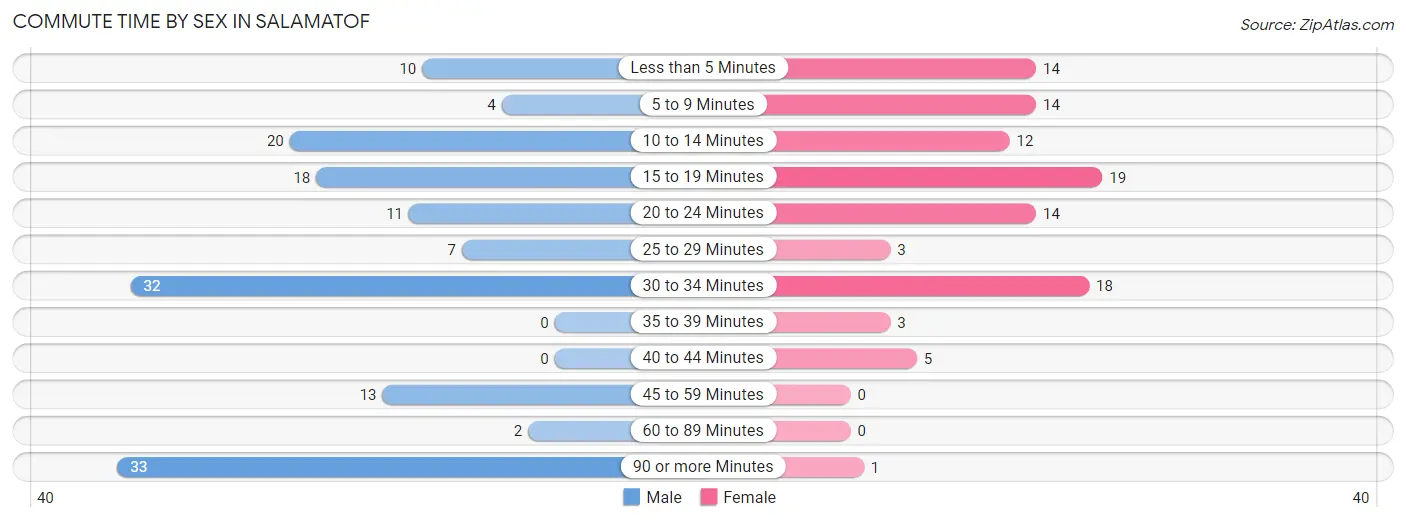
| Commute Time | Male | Female |
| Less than 5 Minutes | 10 (6.7%) | 14 (13.6%) |
| 5 to 9 Minutes | 4 (2.7%) | 14 (13.6%) |
| 10 to 14 Minutes | 20 (13.3%) | 12 (11.7%) |
| 15 to 19 Minutes | 18 (12.0%) | 19 (18.4%) |
| 20 to 24 Minutes | 11 (7.3%) | 14 (13.6%) |
| 25 to 29 Minutes | 7 (4.7%) | 3 (2.9%) |
| 30 to 34 Minutes | 32 (21.3%) | 18 (17.5%) |
| 35 to 39 Minutes | 0 (0.0%) | 3 (2.9%) |
| 40 to 44 Minutes | 0 (0.0%) | 5 (4.9%) |
| 45 to 59 Minutes | 13 (8.7%) | 0 (0.0%) |
| 60 to 89 Minutes | 2 (1.3%) | 0 (0.0%) |
| 90 or more Minutes | 33 (22.0%) | 1 (1.0%) |
Time of Departure to Work by Sex in Salamatof
The most frequent times of departure to work in Salamatof are 6:30 AM to 6:59 AM (30, 20.0%) for males and 7:30 AM to 7:59 AM (21, 20.4%) for females.
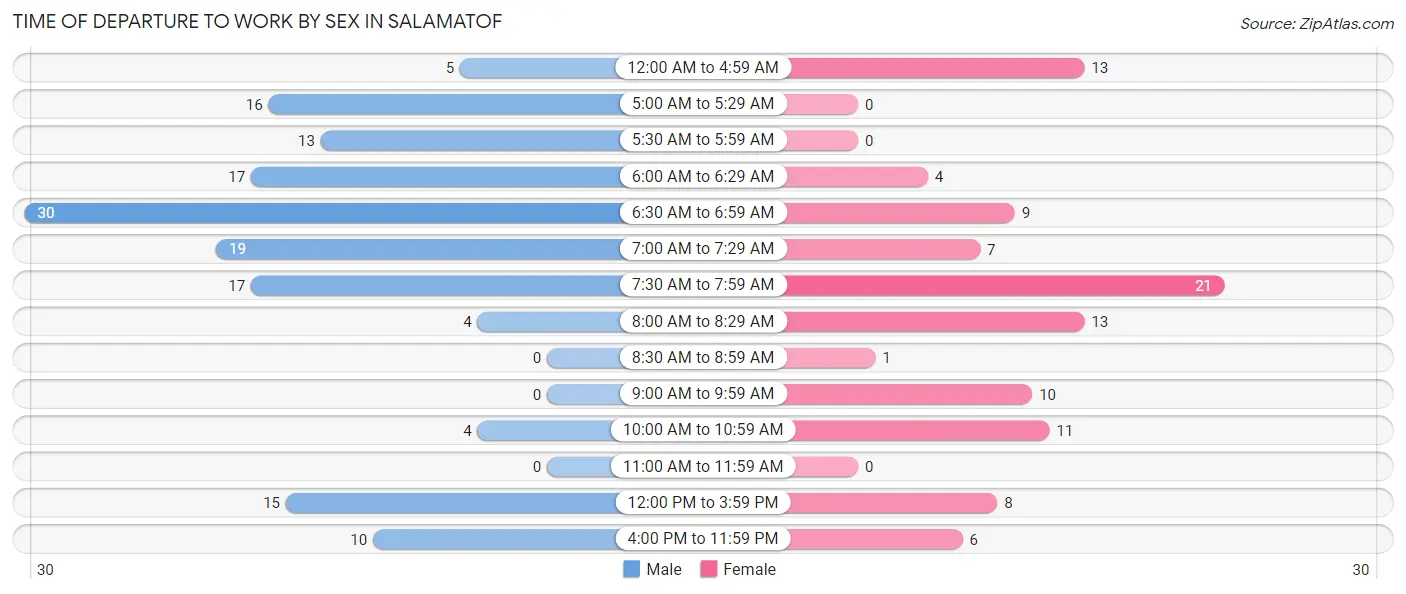
| Time of Departure | Male | Female |
| 12:00 AM to 4:59 AM | 5 (3.3%) | 13 (12.6%) |
| 5:00 AM to 5:29 AM | 16 (10.7%) | 0 (0.0%) |
| 5:30 AM to 5:59 AM | 13 (8.7%) | 0 (0.0%) |
| 6:00 AM to 6:29 AM | 17 (11.3%) | 4 (3.9%) |
| 6:30 AM to 6:59 AM | 30 (20.0%) | 9 (8.7%) |
| 7:00 AM to 7:29 AM | 19 (12.7%) | 7 (6.8%) |
| 7:30 AM to 7:59 AM | 17 (11.3%) | 21 (20.4%) |
| 8:00 AM to 8:29 AM | 4 (2.7%) | 13 (12.6%) |
| 8:30 AM to 8:59 AM | 0 (0.0%) | 1 (1.0%) |
| 9:00 AM to 9:59 AM | 0 (0.0%) | 10 (9.7%) |
| 10:00 AM to 10:59 AM | 4 (2.7%) | 11 (10.7%) |
| 11:00 AM to 11:59 AM | 0 (0.0%) | 0 (0.0%) |
| 12:00 PM to 3:59 PM | 15 (10.0%) | 8 (7.8%) |
| 4:00 PM to 11:59 PM | 10 (6.7%) | 6 (5.8%) |
| Total | 150 (100.0%) | 103 (100.0%) |
Housing Occupancy in Salamatof
Occupancy by Ownership in Salamatof
Of the total 298 dwellings in Salamatof, owner-occupied units account for 218 (73.2%), while renter-occupied units make up 80 (26.9%).
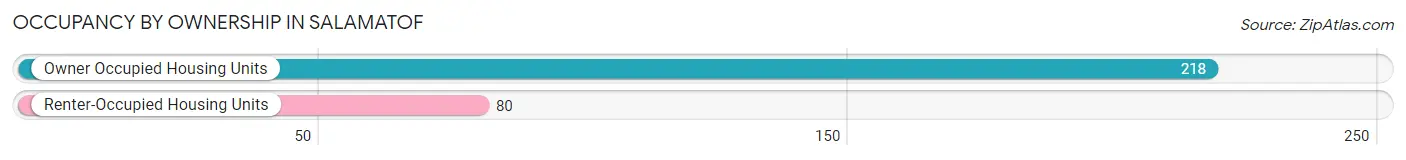
| Occupancy | # Housing Units | % Housing Units |
| Owner Occupied Housing Units | 218 | 73.2% |
| Renter-Occupied Housing Units | 80 | 26.9% |
| Total Occupied Housing Units | 298 | 100.0% |
Occupancy by Household Size in Salamatof
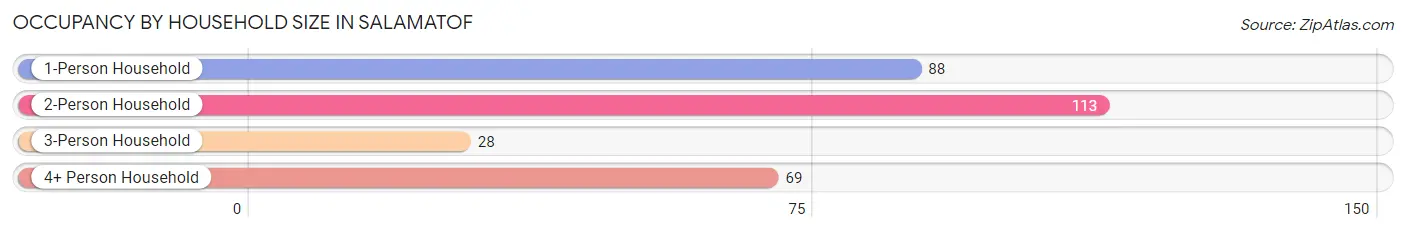
| Household Size | # Housing Units | % Housing Units |
| 1-Person Household | 88 | 29.5% |
| 2-Person Household | 113 | 37.9% |
| 3-Person Household | 28 | 9.4% |
| 4+ Person Household | 69 | 23.2% |
| Total Housing Units | 298 | 100.0% |
Occupancy by Ownership by Household Size in Salamatof
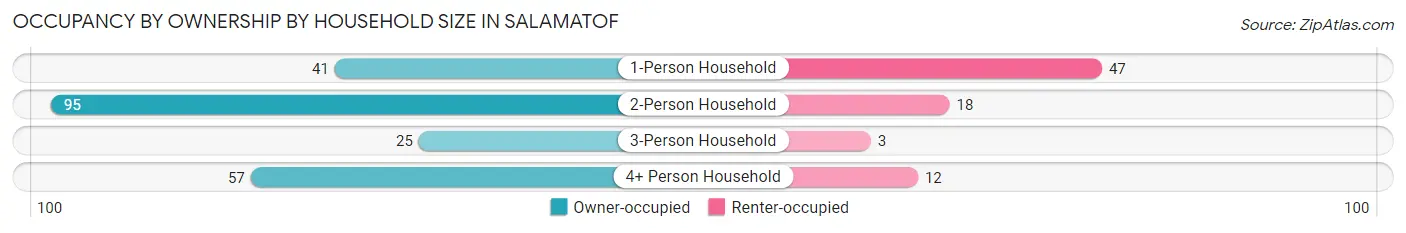
| Household Size | Owner-occupied | Renter-occupied |
| 1-Person Household | 41 (46.6%) | 47 (53.4%) |
| 2-Person Household | 95 (84.1%) | 18 (15.9%) |
| 3-Person Household | 25 (89.3%) | 3 (10.7%) |
| 4+ Person Household | 57 (82.6%) | 12 (17.4%) |
| Total Housing Units | 218 (73.2%) | 80 (26.9%) |
Occupancy by Educational Attainment in Salamatof
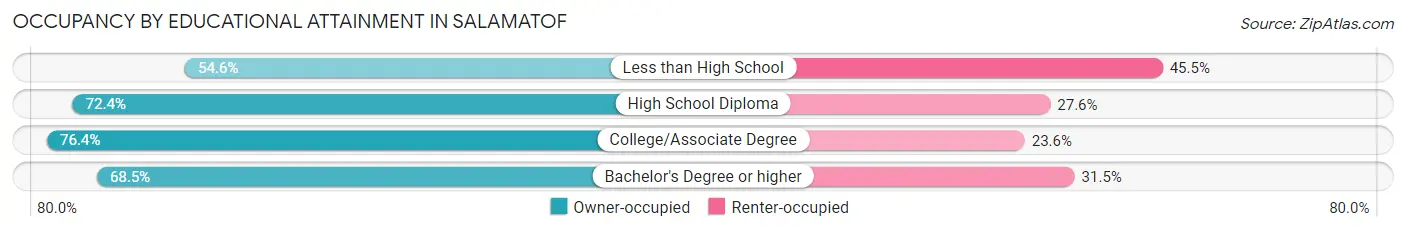
| Household Size | Owner-occupied | Renter-occupied |
| Less than High School | 6 (54.5%) | 5 (45.5%) |
| High School Diploma | 55 (72.4%) | 21 (27.6%) |
| College/Associate Degree | 120 (76.4%) | 37 (23.6%) |
| Bachelor's Degree or higher | 37 (68.5%) | 17 (31.5%) |
Occupancy by Age of Householder in Salamatof
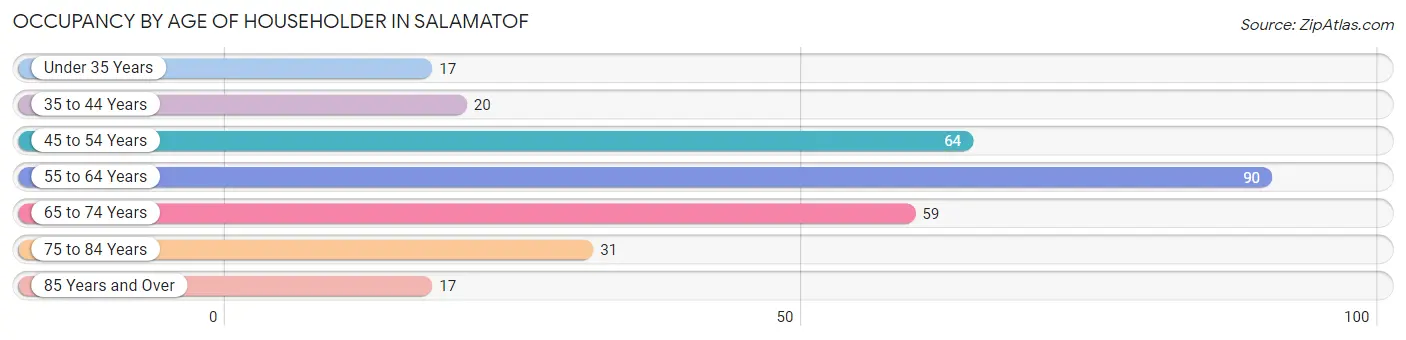
| Age Bracket | # Households | % Households |
| Under 35 Years | 17 | 5.7% |
| 35 to 44 Years | 20 | 6.7% |
| 45 to 54 Years | 64 | 21.5% |
| 55 to 64 Years | 90 | 30.2% |
| 65 to 74 Years | 59 | 19.8% |
| 75 to 84 Years | 31 | 10.4% |
| 85 Years and Over | 17 | 5.7% |
| Total | 298 | 100.0% |
Housing Finances in Salamatof
Median Income by Occupancy in Salamatof
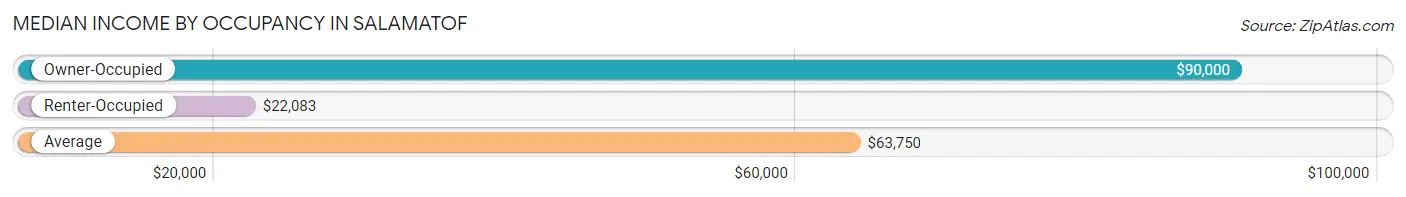
| Occupancy Type | # Households | Median Income |
| Owner-Occupied | 218 (73.2%) | $90,000 |
| Renter-Occupied | 80 (26.9%) | $22,083 |
| Average | 298 (100.0%) | $63,750 |
Occupancy by Householder Income Bracket in Salamatof
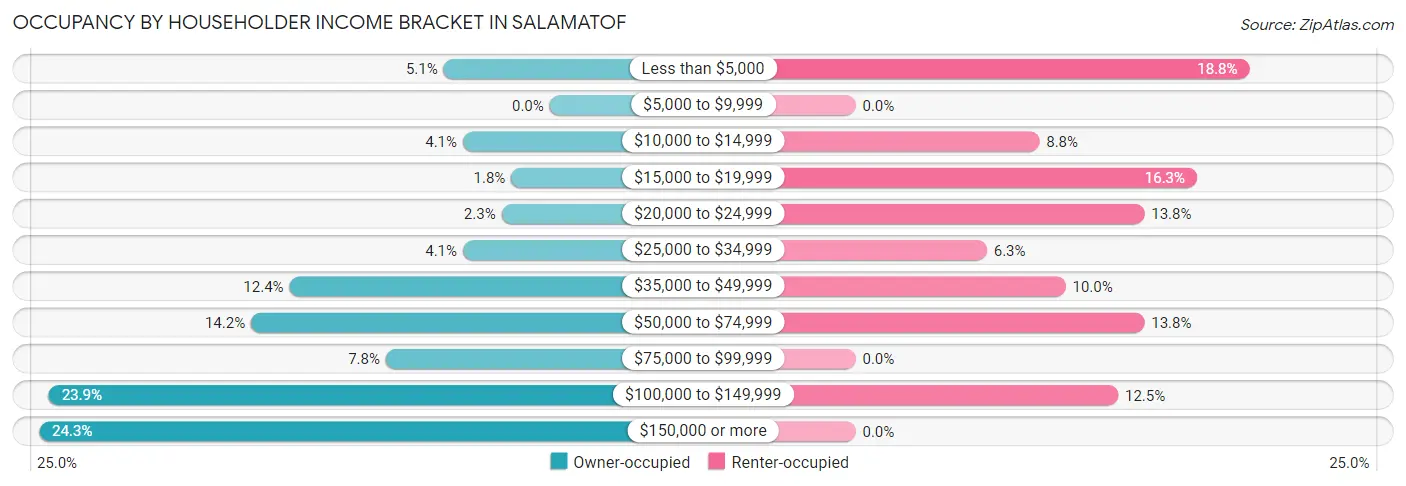
| Income Bracket | Owner-occupied | Renter-occupied |
| Less than $5,000 | 11 (5.1%) | 15 (18.8%) |
| $5,000 to $9,999 | 0 (0.0%) | 0 (0.0%) |
| $10,000 to $14,999 | 9 (4.1%) | 7 (8.7%) |
| $15,000 to $19,999 | 4 (1.8%) | 13 (16.3%) |
| $20,000 to $24,999 | 5 (2.3%) | 11 (13.8%) |
| $25,000 to $34,999 | 9 (4.1%) | 5 (6.2%) |
| $35,000 to $49,999 | 27 (12.4%) | 8 (10.0%) |
| $50,000 to $74,999 | 31 (14.2%) | 11 (13.8%) |
| $75,000 to $99,999 | 17 (7.8%) | 0 (0.0%) |
| $100,000 to $149,999 | 52 (23.8%) | 10 (12.5%) |
| $150,000 or more | 53 (24.3%) | 0 (0.0%) |
| Total | 218 (100.0%) | 80 (100.0%) |
Monthly Housing Cost Tiers in Salamatof
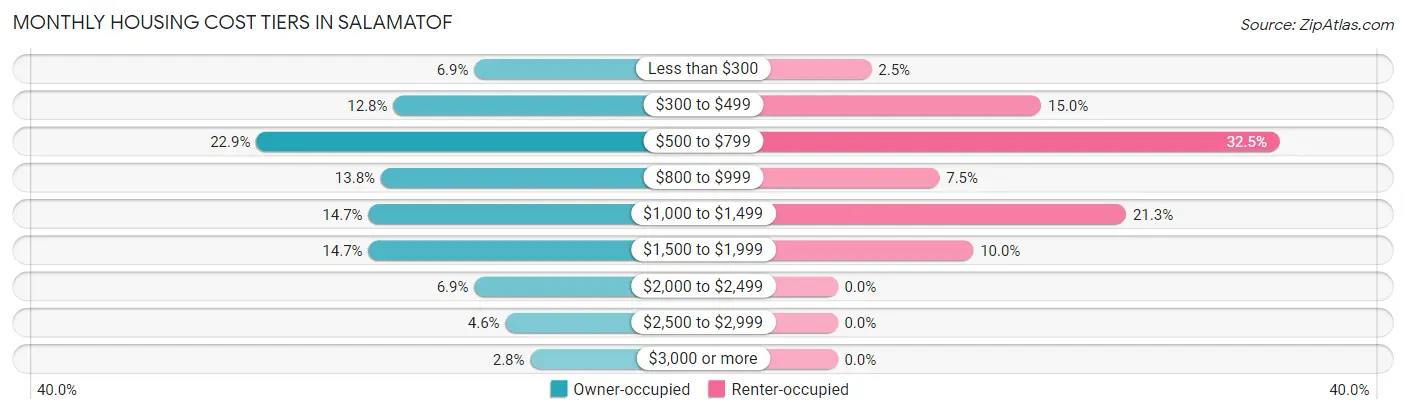
| Monthly Cost | Owner-occupied | Renter-occupied |
| Less than $300 | 15 (6.9%) | 2 (2.5%) |
| $300 to $499 | 28 (12.8%) | 12 (15.0%) |
| $500 to $799 | 50 (22.9%) | 26 (32.5%) |
| $800 to $999 | 30 (13.8%) | 6 (7.5%) |
| $1,000 to $1,499 | 32 (14.7%) | 17 (21.2%) |
| $1,500 to $1,999 | 32 (14.7%) | 8 (10.0%) |
| $2,000 to $2,499 | 15 (6.9%) | 0 (0.0%) |
| $2,500 to $2,999 | 10 (4.6%) | 0 (0.0%) |
| $3,000 or more | 6 (2.8%) | 0 (0.0%) |
| Total | 218 (100.0%) | 80 (100.0%) |
Physical Housing Characteristics in Salamatof
Housing Structures in Salamatof
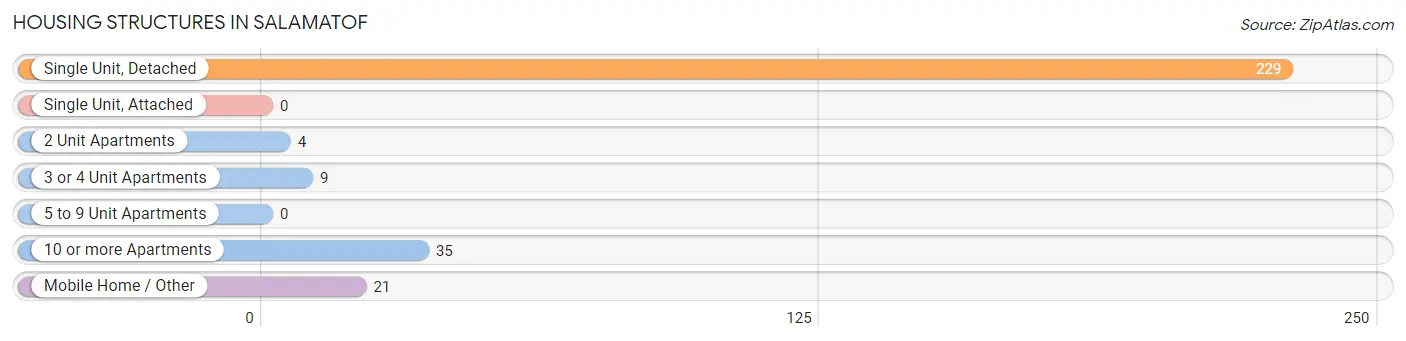
| Structure Type | # Housing Units | % Housing Units |
| Single Unit, Detached | 229 | 76.8% |
| Single Unit, Attached | 0 | 0.0% |
| 2 Unit Apartments | 4 | 1.3% |
| 3 or 4 Unit Apartments | 9 | 3.0% |
| 5 to 9 Unit Apartments | 0 | 0.0% |
| 10 or more Apartments | 35 | 11.7% |
| Mobile Home / Other | 21 | 7.0% |
| Total | 298 | 100.0% |
Housing Structures by Occupancy in Salamatof
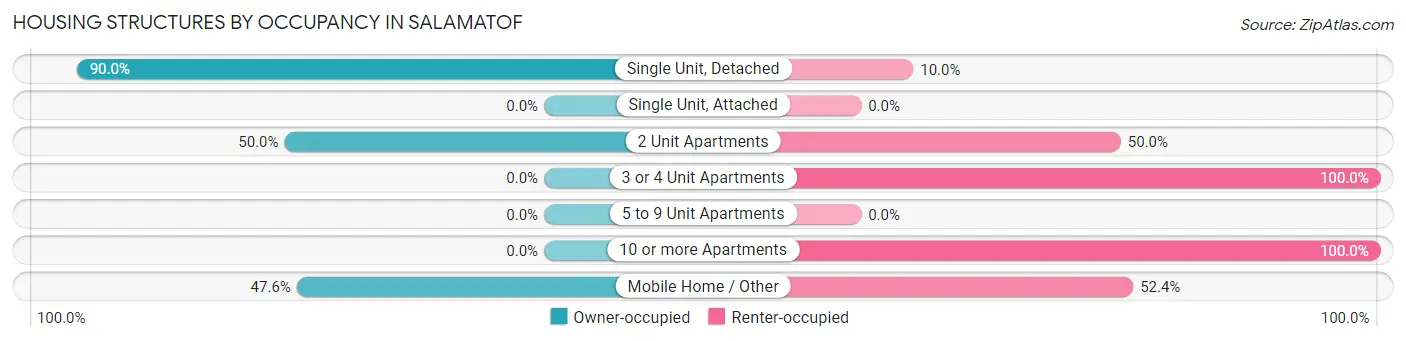
| Structure Type | Owner-occupied | Renter-occupied |
| Single Unit, Detached | 206 (90.0%) | 23 (10.0%) |
| Single Unit, Attached | 0 (0.0%) | 0 (0.0%) |
| 2 Unit Apartments | 2 (50.0%) | 2 (50.0%) |
| 3 or 4 Unit Apartments | 0 (0.0%) | 9 (100.0%) |
| 5 to 9 Unit Apartments | 0 (0.0%) | 0 (0.0%) |
| 10 or more Apartments | 0 (0.0%) | 35 (100.0%) |
| Mobile Home / Other | 10 (47.6%) | 11 (52.4%) |
| Total | 218 (73.2%) | 80 (26.9%) |
Housing Structures by Number of Rooms in Salamatof
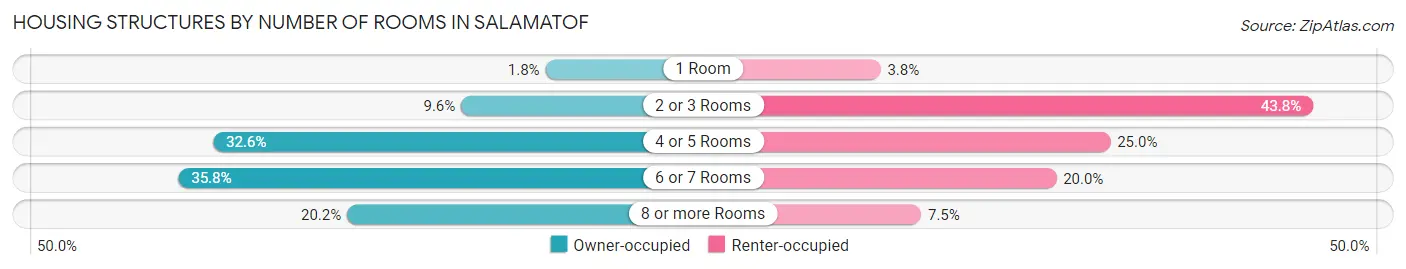
| Number of Rooms | Owner-occupied | Renter-occupied |
| 1 Room | 4 (1.8%) | 3 (3.7%) |
| 2 or 3 Rooms | 21 (9.6%) | 35 (43.8%) |
| 4 or 5 Rooms | 71 (32.6%) | 20 (25.0%) |
| 6 or 7 Rooms | 78 (35.8%) | 16 (20.0%) |
| 8 or more Rooms | 44 (20.2%) | 6 (7.5%) |
| Total | 218 (100.0%) | 80 (100.0%) |
Housing Structure by Heating Type in Salamatof
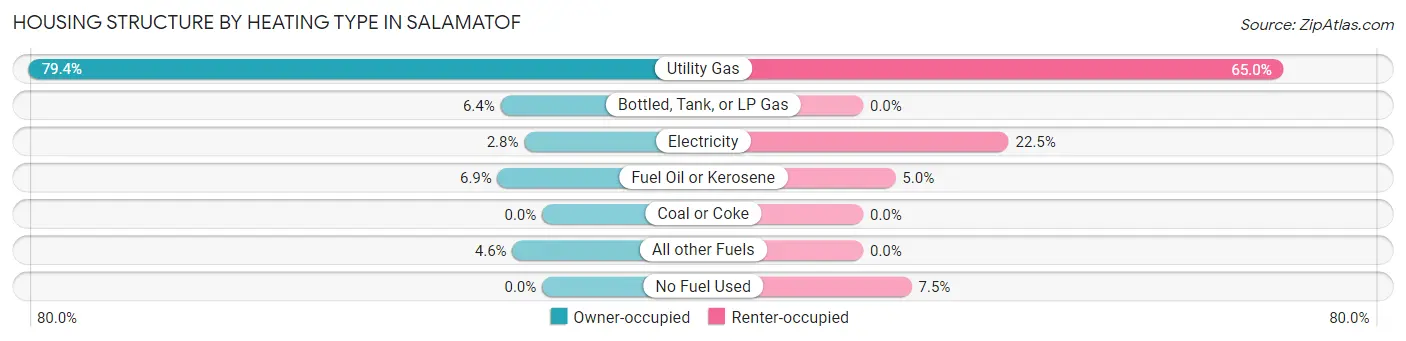
| Heating Type | Owner-occupied | Renter-occupied |
| Utility Gas | 173 (79.4%) | 52 (65.0%) |
| Bottled, Tank, or LP Gas | 14 (6.4%) | 0 (0.0%) |
| Electricity | 6 (2.8%) | 18 (22.5%) |
| Fuel Oil or Kerosene | 15 (6.9%) | 4 (5.0%) |
| Coal or Coke | 0 (0.0%) | 0 (0.0%) |
| All other Fuels | 10 (4.6%) | 0 (0.0%) |
| No Fuel Used | 0 (0.0%) | 6 (7.5%) |
| Total | 218 (100.0%) | 80 (100.0%) |
Household Vehicle Usage in Salamatof
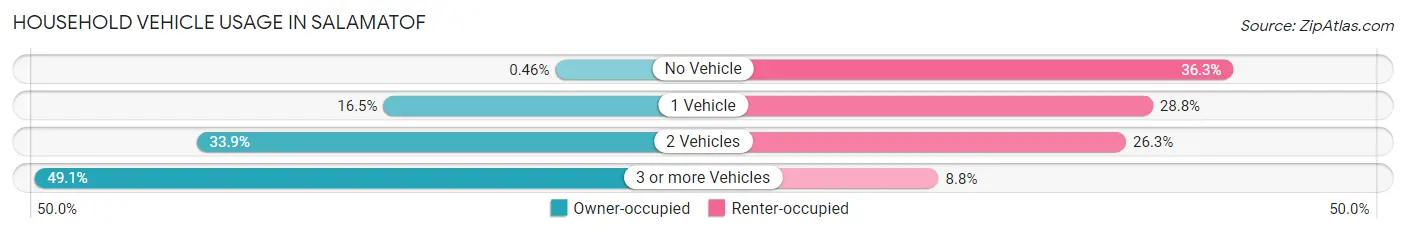
| Vehicles per Household | Owner-occupied | Renter-occupied |
| No Vehicle | 1 (0.5%) | 29 (36.2%) |
| 1 Vehicle | 36 (16.5%) | 23 (28.7%) |
| 2 Vehicles | 74 (33.9%) | 21 (26.3%) |
| 3 or more Vehicles | 107 (49.1%) | 7 (8.7%) |
| Total | 218 (100.0%) | 80 (100.0%) |
Real Estate & Mortgages in Salamatof
Real Estate and Mortgage Overview in Salamatof
| Characteristic | Without Mortgage | With Mortgage |
| Housing Units | 129 | 89 |
| Median Property Value | $321,900 | $267,400 |
| Median Household Income | $79,375 | $35 |
| Monthly Housing Costs | $646 | $2 |
| Real Estate Taxes | $3,000 | $9 |
Property Value by Mortgage Status in Salamatof
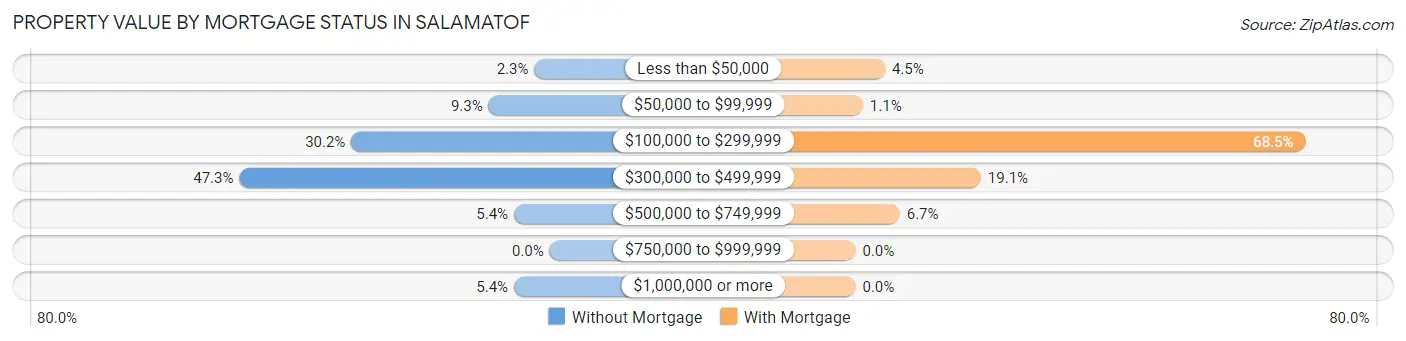
| Property Value | Without Mortgage | With Mortgage |
| Less than $50,000 | 3 (2.3%) | 4 (4.5%) |
| $50,000 to $99,999 | 12 (9.3%) | 1 (1.1%) |
| $100,000 to $299,999 | 39 (30.2%) | 61 (68.5%) |
| $300,000 to $499,999 | 61 (47.3%) | 17 (19.1%) |
| $500,000 to $749,999 | 7 (5.4%) | 6 (6.7%) |
| $750,000 to $999,999 | 0 (0.0%) | 0 (0.0%) |
| $1,000,000 or more | 7 (5.4%) | 0 (0.0%) |
| Total | 129 (100.0%) | 89 (100.0%) |
Household Income by Mortgage Status in Salamatof
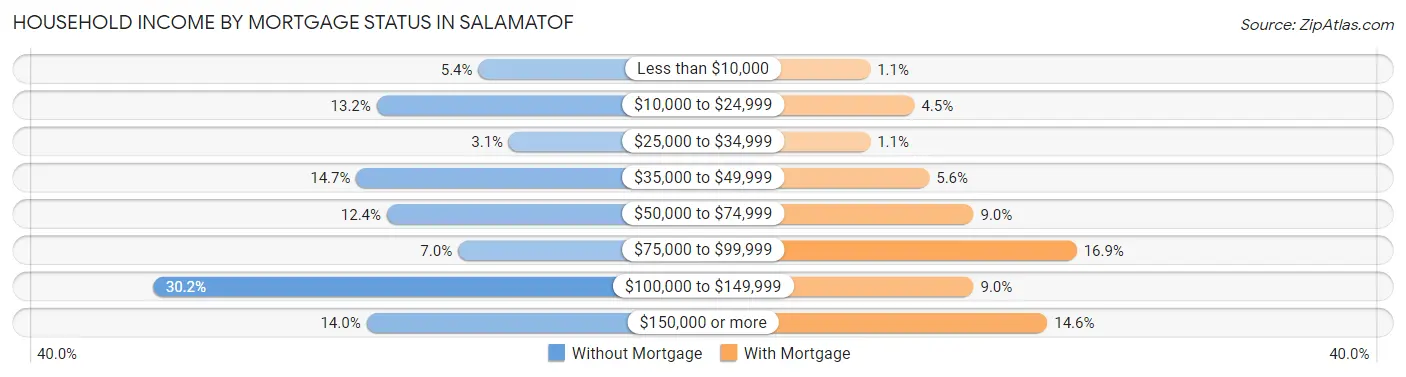
| Household Income | Without Mortgage | With Mortgage |
| Less than $10,000 | 7 (5.4%) | 1 (1.1%) |
| $10,000 to $24,999 | 17 (13.2%) | 4 (4.5%) |
| $25,000 to $34,999 | 4 (3.1%) | 1 (1.1%) |
| $35,000 to $49,999 | 19 (14.7%) | 5 (5.6%) |
| $50,000 to $74,999 | 16 (12.4%) | 8 (9.0%) |
| $75,000 to $99,999 | 9 (7.0%) | 15 (16.9%) |
| $100,000 to $149,999 | 39 (30.2%) | 8 (9.0%) |
| $150,000 or more | 18 (14.0%) | 13 (14.6%) |
| Total | 129 (100.0%) | 89 (100.0%) |
Property Value to Household Income Ratio in Salamatof
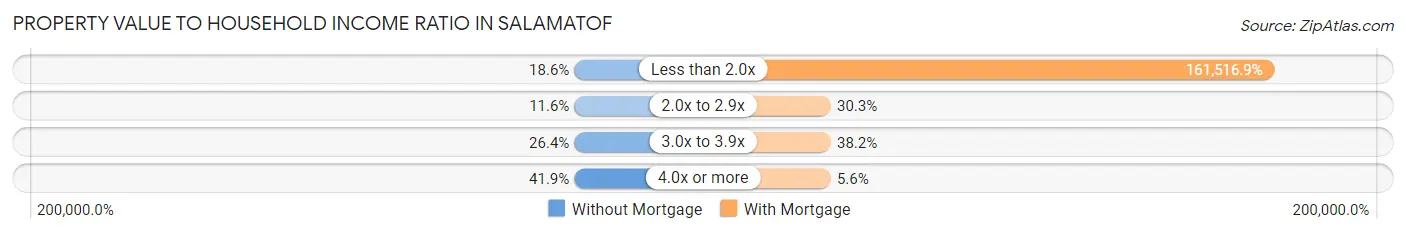
| Value-to-Income Ratio | Without Mortgage | With Mortgage |
| Less than 2.0x | 24 (18.6%) | 143,750 (161,516.8%) |
| 2.0x to 2.9x | 15 (11.6%) | 27 (30.3%) |
| 3.0x to 3.9x | 34 (26.4%) | 34 (38.2%) |
| 4.0x or more | 54 (41.9%) | 5 (5.6%) |
| Total | 129 (100.0%) | 89 (100.0%) |
Real Estate Taxes by Mortgage Status in Salamatof
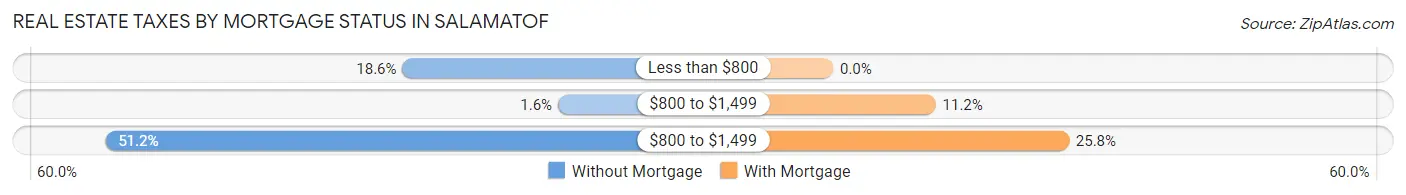
| Property Taxes | Without Mortgage | With Mortgage |
| Less than $800 | 24 (18.6%) | 0 (0.0%) |
| $800 to $1,499 | 2 (1.5%) | 10 (11.2%) |
| $800 to $1,499 | 66 (51.2%) | 23 (25.8%) |
| Total | 129 (100.0%) | 89 (100.0%) |
Health & Disability in Salamatof
Health Insurance Coverage by Age in Salamatof
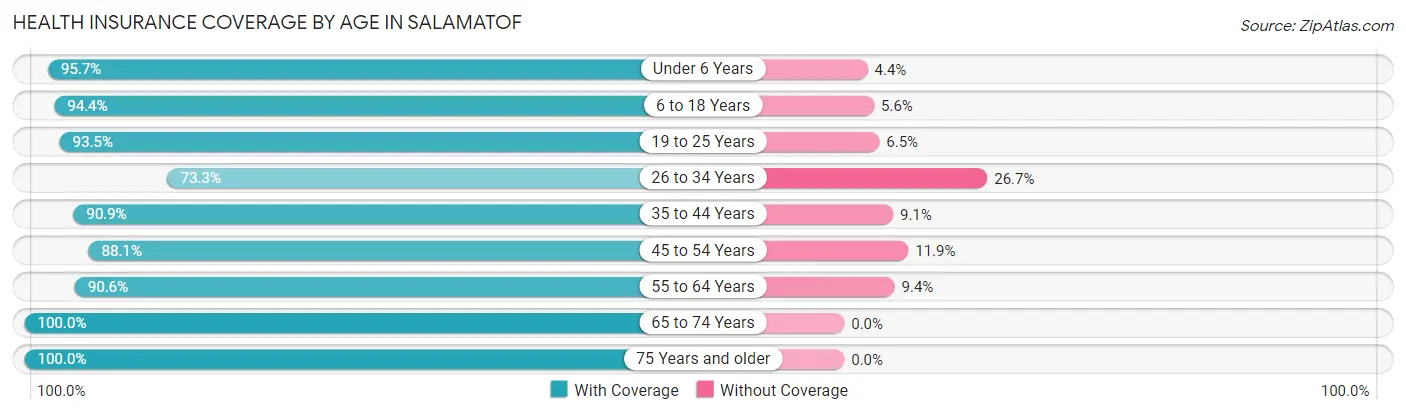
| Age Bracket | With Coverage | Without Coverage |
| Under 6 Years | 44 (95.7%) | 2 (4.3%) |
| 6 to 18 Years | 119 (94.4%) | 7 (5.6%) |
| 19 to 25 Years | 143 (93.5%) | 10 (6.5%) |
| 26 to 34 Years | 33 (73.3%) | 12 (26.7%) |
| 35 to 44 Years | 50 (90.9%) | 5 (9.1%) |
| 45 to 54 Years | 96 (88.1%) | 13 (11.9%) |
| 55 to 64 Years | 145 (90.6%) | 15 (9.4%) |
| 65 to 74 Years | 94 (100.0%) | 0 (0.0%) |
| 75 Years and older | 58 (100.0%) | 0 (0.0%) |
| Total | 782 (92.4%) | 64 (7.6%) |
Health Insurance Coverage by Citizenship Status in Salamatof
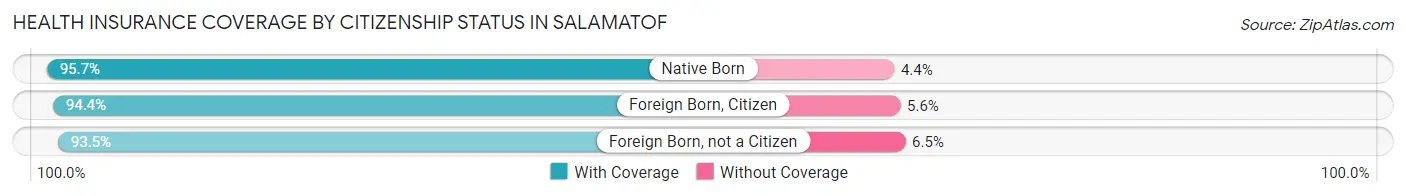
| Citizenship Status | With Coverage | Without Coverage |
| Native Born | 44 (95.7%) | 2 (4.3%) |
| Foreign Born, Citizen | 119 (94.4%) | 7 (5.6%) |
| Foreign Born, not a Citizen | 143 (93.5%) | 10 (6.5%) |
Health Insurance Coverage by Household Income in Salamatof
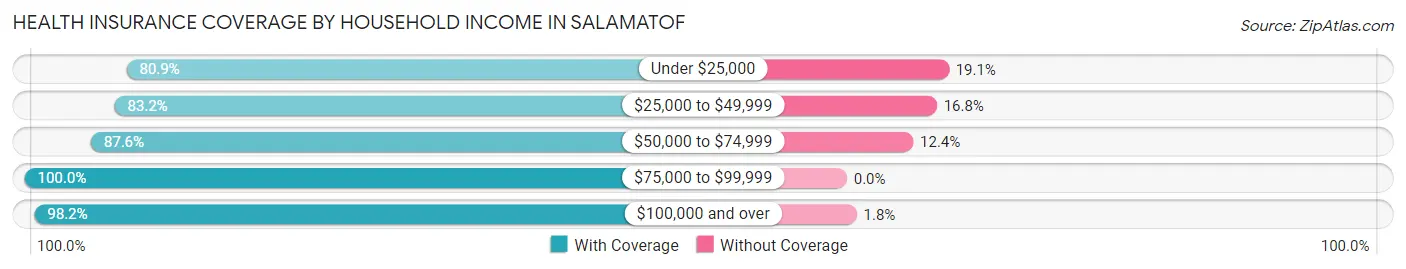
| Household Income | With Coverage | Without Coverage |
| Under $25,000 | 89 (80.9%) | 21 (19.1%) |
| $25,000 to $49,999 | 79 (83.2%) | 16 (16.8%) |
| $50,000 to $74,999 | 134 (87.6%) | 19 (12.4%) |
| $75,000 to $99,999 | 50 (100.0%) | 0 (0.0%) |
| $100,000 and over | 429 (98.2%) | 8 (1.8%) |
Public vs Private Health Insurance Coverage by Age in Salamatof
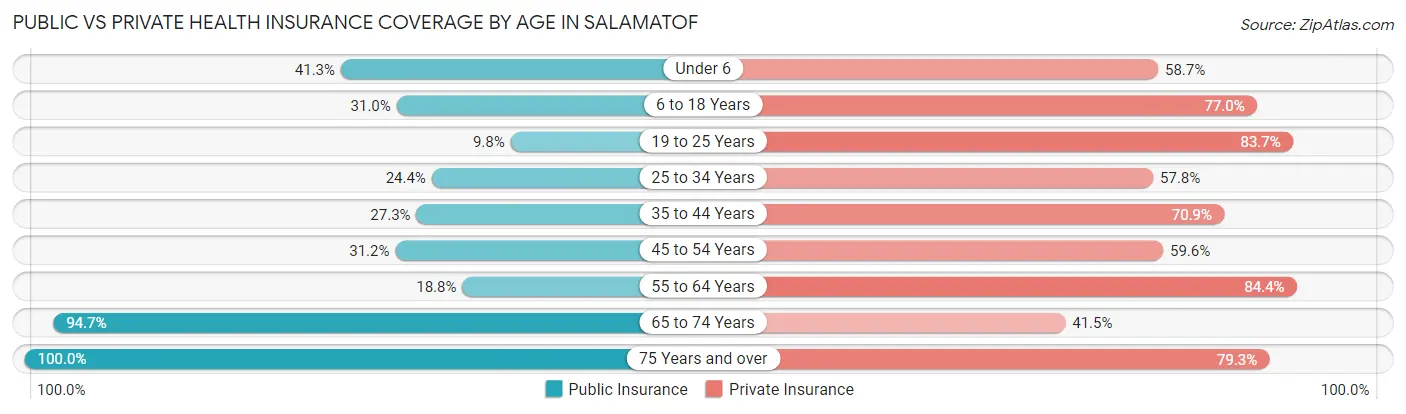
| Age Bracket | Public Insurance | Private Insurance |
| Under 6 | 19 (41.3%) | 27 (58.7%) |
| 6 to 18 Years | 39 (30.9%) | 97 (77.0%) |
| 19 to 25 Years | 15 (9.8%) | 128 (83.7%) |
| 25 to 34 Years | 11 (24.4%) | 26 (57.8%) |
| 35 to 44 Years | 15 (27.3%) | 39 (70.9%) |
| 45 to 54 Years | 34 (31.2%) | 65 (59.6%) |
| 55 to 64 Years | 30 (18.8%) | 135 (84.4%) |
| 65 to 74 Years | 89 (94.7%) | 39 (41.5%) |
| 75 Years and over | 58 (100.0%) | 46 (79.3%) |
| Total | 310 (36.6%) | 602 (71.2%) |
Disability Status by Sex by Age in Salamatof
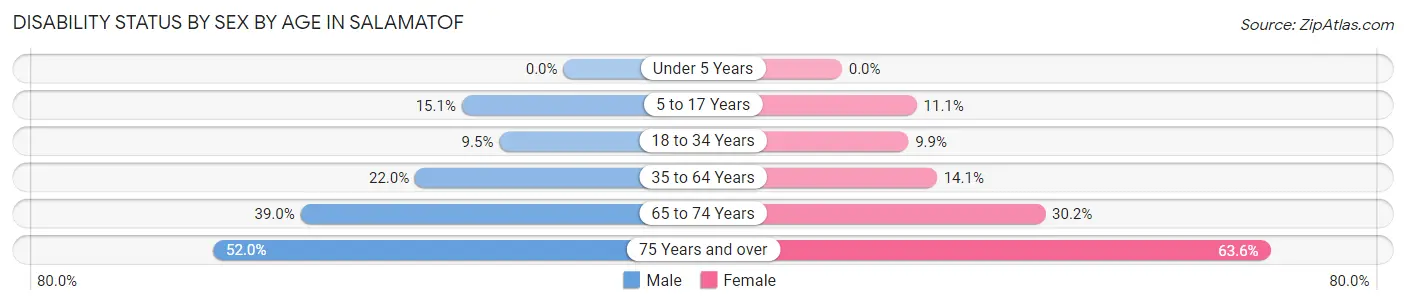
| Age Bracket | Male | Female |
| Under 5 Years | 0 (0.0%) | 0 (0.0%) |
| 5 to 17 Years | 8 (15.1%) | 4 (11.1%) |
| 18 to 34 Years | 16 (9.5%) | 7 (9.9%) |
| 35 to 64 Years | 37 (22.0%) | 22 (14.1%) |
| 65 to 74 Years | 16 (39.0%) | 16 (30.2%) |
| 75 Years and over | 13 (52.0%) | 21 (63.6%) |
Disability Class by Sex by Age in Salamatof
Disability Class: Hearing Difficulty
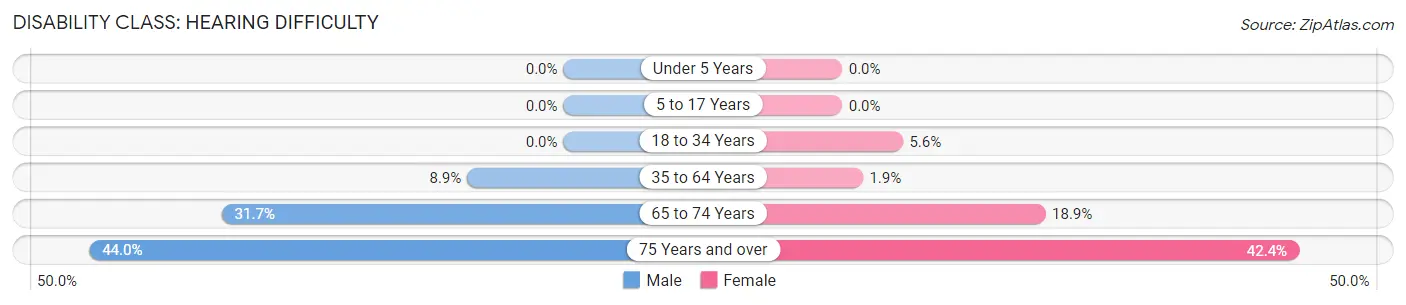
| Age Bracket | Male | Female |
| Under 5 Years | 0 (0.0%) | 0 (0.0%) |
| 5 to 17 Years | 0 (0.0%) | 0 (0.0%) |
| 18 to 34 Years | 0 (0.0%) | 4 (5.6%) |
| 35 to 64 Years | 15 (8.9%) | 3 (1.9%) |
| 65 to 74 Years | 13 (31.7%) | 10 (18.9%) |
| 75 Years and over | 11 (44.0%) | 14 (42.4%) |
Disability Class: Vision Difficulty
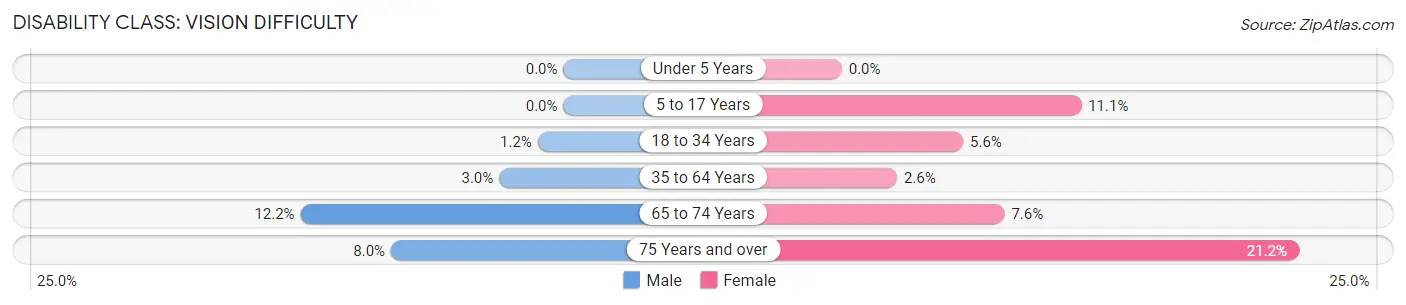
| Age Bracket | Male | Female |
| Under 5 Years | 0 (0.0%) | 0 (0.0%) |
| 5 to 17 Years | 0 (0.0%) | 4 (11.1%) |
| 18 to 34 Years | 2 (1.2%) | 4 (5.6%) |
| 35 to 64 Years | 5 (3.0%) | 4 (2.6%) |
| 65 to 74 Years | 5 (12.2%) | 4 (7.5%) |
| 75 Years and over | 2 (8.0%) | 7 (21.2%) |
Disability Class: Cognitive Difficulty
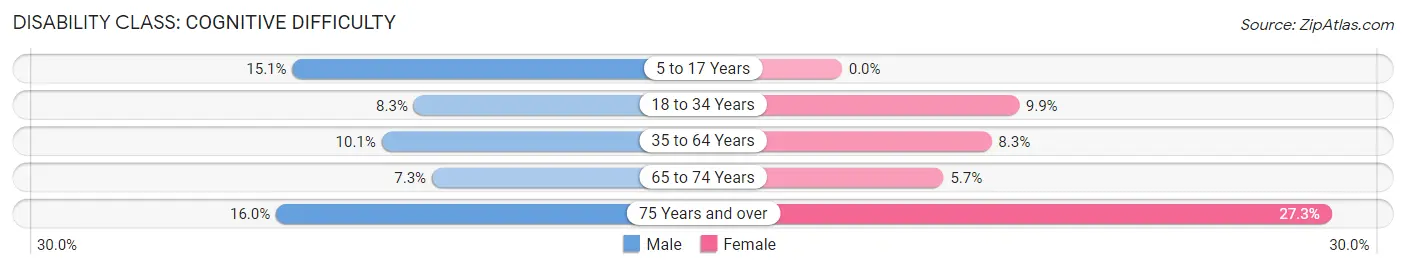
| Age Bracket | Male | Female |
| 5 to 17 Years | 8 (15.1%) | 0 (0.0%) |
| 18 to 34 Years | 14 (8.3%) | 7 (9.9%) |
| 35 to 64 Years | 17 (10.1%) | 13 (8.3%) |
| 65 to 74 Years | 3 (7.3%) | 3 (5.7%) |
| 75 Years and over | 4 (16.0%) | 9 (27.3%) |
Disability Class: Ambulatory Difficulty
| Age Bracket | Male | Female |
| 5 to 17 Years | 0 (0.0%) | 0 (0.0%) |
| 18 to 34 Years | 5 (3.0%) | 7 (9.9%) |
| 35 to 64 Years | 21 (12.5%) | 10 (6.4%) |
| 65 to 74 Years | 4 (9.8%) | 10 (18.9%) |
| 75 Years and over | 4 (16.0%) | 16 (48.5%) |
Disability Class: Self-Care Difficulty
| Age Bracket | Male | Female |
| 5 to 17 Years | 0 (0.0%) | 0 (0.0%) |
| 18 to 34 Years | 5 (3.0%) | 4 (5.6%) |
| 35 to 64 Years | 8 (4.8%) | 0 (0.0%) |
| 65 to 74 Years | 1 (2.4%) | 4 (7.5%) |
| 75 Years and over | 2 (8.0%) | 4 (12.1%) |
Technology Access in Salamatof
Computing Device Access in Salamatof
| Device Type | # Households | % Households |
| Desktop or Laptop | 223 | 74.8% |
| Smartphone | 260 | 87.3% |
| Tablet | 161 | 54.0% |
| No Computing Device | 13 | 4.4% |
| Total | 298 | 100.0% |
Internet Access in Salamatof
| Internet Type | # Households | % Households |
| Dial-Up Internet | 0 | 0.0% |
| Broadband Home | 137 | 46.0% |
| Cellular Data Only | 97 | 32.6% |
| Satellite Internet | 27 | 9.1% |
| No Internet | 40 | 13.4% |
| Total | 298 | 100.0% |
Salamatof Summary
Salamatof is a small unincorporated community located in Kenai Peninsula Borough, Alaska. It is situated on the western shore of Cook Inlet, approximately 25 miles south of Kenai and 25 miles north of Homer. The community is accessible by boat or floatplane, and is home to approximately 50 year-round residents.
History
Salamatof was first settled in the late 1800s by Russian fur traders. The community was named after the nearby Salamatof Creek, which was named after a Russian fur trader named Salamatof. The creek was a popular spot for fishing and hunting, and the community grew around it.
In the early 1900s, the community was home to a salmon cannery, which provided employment for many of the residents. The cannery closed in the 1950s, and the community has since become a popular spot for sport fishing and hunting.
Geography
Salamatof is located on the western shore of Cook Inlet, approximately 25 miles south of Kenai and 25 miles north of Homer. The community is surrounded by mountains and is situated on a small bay. The bay is a popular spot for fishing and hunting, and is home to a variety of wildlife, including moose, bear, and waterfowl.
The climate in Salamatof is mild and temperate, with average temperatures ranging from the mid-30s in the winter to the mid-60s in the summer. The area receives an average of 20 inches of precipitation per year, with most of it falling in the form of snow.
Economy
The economy of Salamatof is largely based on fishing and hunting. The community is home to a number of commercial fishing operations, and sport fishing and hunting are popular activities in the area. The community also has a small general store, which provides basic supplies to the residents.
Demographics
As of the 2010 census, the population of Salamatof was 50. The racial makeup of the community was 95.0% White, 0.0% African American, 0.0% Native American, 0.0% Asian, 0.0% Pacific Islander, 0.0% from other races, and 5.0% from two or more races.
The median household income in Salamatof was $45,000, and the median family income was $50,000. The per capita income was $20,000. The unemployment rate was 8.3%.
Conclusion
Salamatof is a small unincorporated community located on the western shore of Cook Inlet in Alaska. It is home to approximately 50 year-round residents, and the economy is largely based on fishing and hunting. The community is surrounded by mountains and is a popular spot for sport fishing and hunting. The median household income in Salamatof was $45,000, and the median family income was $50,000. The per capita income was $20,000. The unemployment rate was 8.3%.
Common Questions
What is Per Capita Income in Salamatof?
Per Capita income in Salamatof is $24,377.
What is the Median Family Income in Salamatof?
Median Family Income in Salamatof is $106,250.
What is the Median Household income in Salamatof?
Median Household Income in Salamatof is $63,750.
What is Income or Wage Gap in Salamatof?
Income or Wage Gap in Salamatof is 27.3%.
Women in Salamatof earn 72.7 cents for every dollar earned by a man.
What is Inequality or Gini Index in Salamatof?
Inequality or Gini Index in Salamatof is 0.46.
What is the Total Population of Salamatof?
Total Population of Salamatof is 1,189.
What is the Total Male Population of Salamatof?
Total Male Population of Salamatof is 805.
What is the Total Female Population of Salamatof?
Total Female Population of Salamatof is 384.
What is the Ratio of Males per 100 Females in Salamatof?
There are 209.64 Males per 100 Females in Salamatof.
What is the Ratio of Females per 100 Males in Salamatof?
There are 47.70 Females per 100 Males in Salamatof.
What is the Median Population Age in Salamatof?
Median Population Age in Salamatof is 40.6 Years.
What is the Average Family Size in Salamatof
Average Family Size in Salamatof is 3.6 People.
What is the Average Household Size in Salamatof
Average Household Size in Salamatof is 2.9 People.
How Large is the Labor Force in Salamatof?
There are 429 People in the Labor Forcein in Salamatof.
What is the Percentage of People in the Labor Force in Salamatof?
39.5% of People are in the Labor Force in Salamatof.
What is the Unemployment Rate in Salamatof?
Unemployment Rate in Salamatof is 31.8%.