Shishmaref, AK Map & Demographics
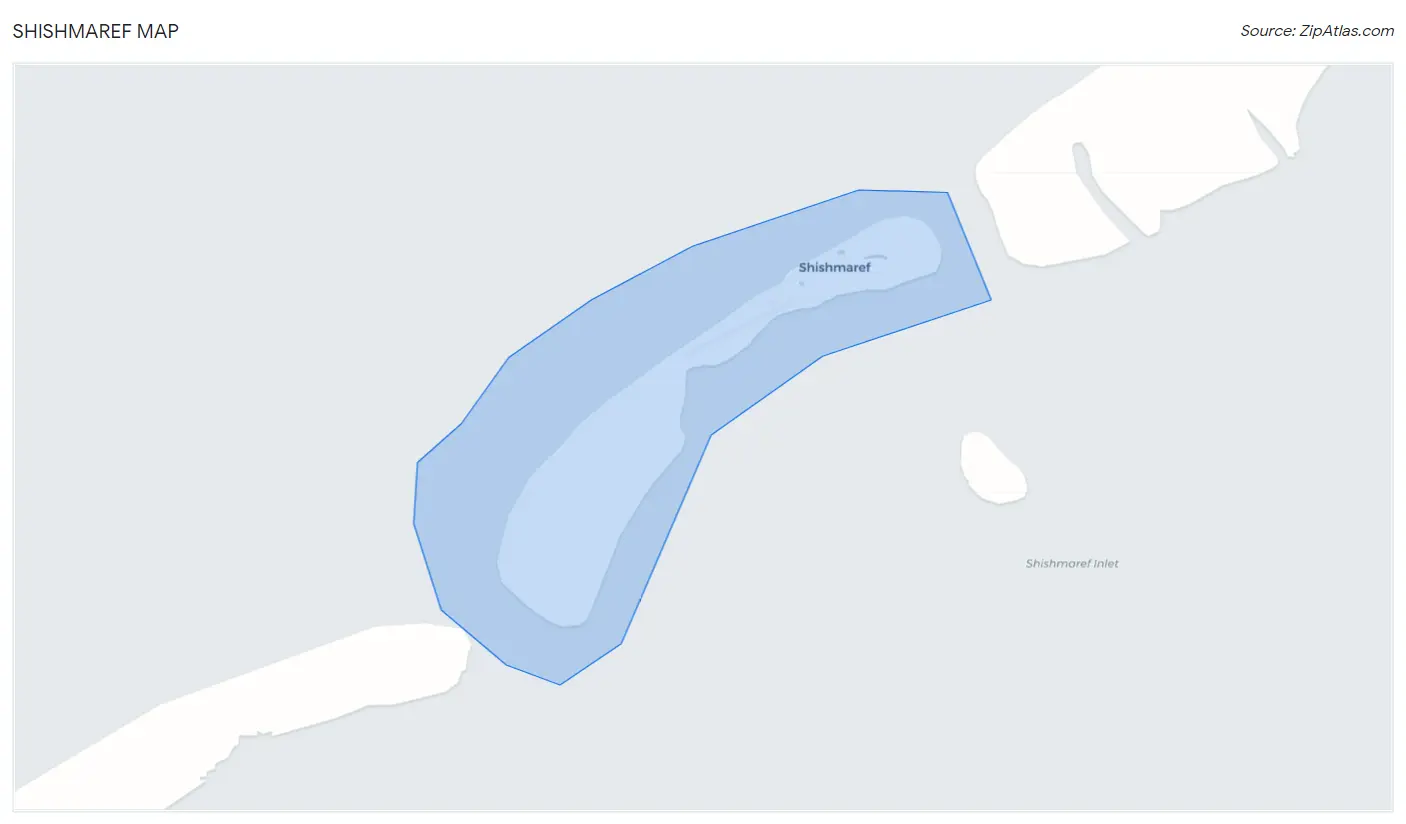
Shishmaref Map
Shishmaref Overview
$17,896
PER CAPITA INCOME
$49,722
AVG FAMILY INCOME
$56,875
AVG HOUSEHOLD INCOME
23.6%
WAGE / INCOME GAP [ % ]
76.4¢/ $1
WAGE / INCOME GAP [ $ ]
$12,114
FAMILY INCOME DEFICIT
0.43
INEQUALITY / GINI INDEX
568
TOTAL POPULATION
331
MALE POPULATION
237
FEMALE POPULATION
139.66
MALES / 100 FEMALES
71.60
FEMALES / 100 MALES
30.2
MEDIAN AGE
4.0
AVG FAMILY SIZE
3.8
AVG HOUSEHOLD SIZE
194
LABOR FORCE [ PEOPLE ]
52.3%
PERCENT IN LABOR FORCE
28.4%
UNEMPLOYMENT RATE
Shishmaref Zip Codes
Shishmaref Area Codes
Income in Shishmaref
Income Overview in Shishmaref
Per Capita Income in Shishmaref is $17,896, while median incomes of families and households are $49,722 and $56,875 respectively.
| Characteristic | Number | Measure |
| Per Capita Income | 568 | $17,896 |
| Median Family Income | 126 | $49,722 |
| Mean Family Income | 126 | $61,883 |
| Median Household Income | 150 | $56,875 |
| Mean Household Income | 150 | $74,253 |
| Income Deficit | 126 | $12,114 |
| Wage / Income Gap (%) | 568 | 23.61% |
| Wage / Income Gap ($) | 568 | 76.39¢ per $1 |
| Gini / Inequality Index | 568 | 0.43 |
Earnings by Sex in Shishmaref
Average Earnings in Shishmaref are $22,574, $18,500 for men and $24,219 for women, a difference of 23.6%.
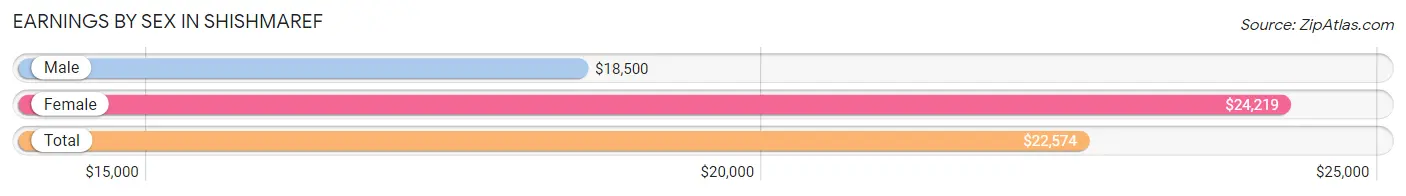
| Sex | Number | Average Earnings |
| Male | 132 (59.7%) | $18,500 |
| Female | 89 (40.3%) | $24,219 |
| Total | 221 (100.0%) | $22,574 |
Earnings by Sex by Income Bracket in Shishmaref
The most common earnings brackets in Shishmaref are $2,499 or less for men (28 | 21.2%) and $2,499 or less for women (10 | 11.2%).
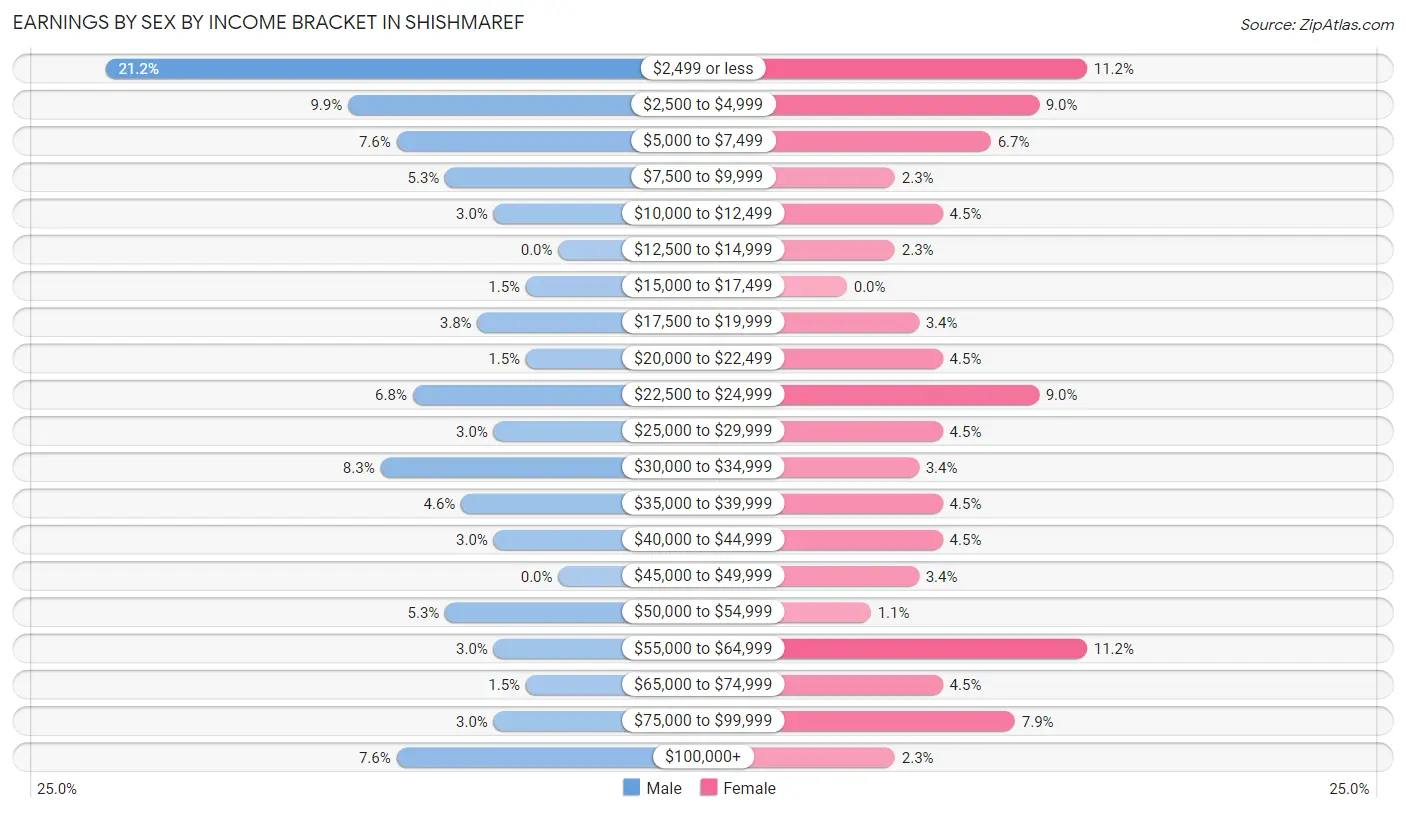
| Income | Male | Female |
| $2,499 or less | 28 (21.2%) | 10 (11.2%) |
| $2,500 to $4,999 | 13 (9.9%) | 8 (9.0%) |
| $5,000 to $7,499 | 10 (7.6%) | 6 (6.7%) |
| $7,500 to $9,999 | 7 (5.3%) | 2 (2.2%) |
| $10,000 to $12,499 | 4 (3.0%) | 4 (4.5%) |
| $12,500 to $14,999 | 0 (0.0%) | 2 (2.2%) |
| $15,000 to $17,499 | 2 (1.5%) | 0 (0.0%) |
| $17,500 to $19,999 | 5 (3.8%) | 3 (3.4%) |
| $20,000 to $22,499 | 2 (1.5%) | 4 (4.5%) |
| $22,500 to $24,999 | 9 (6.8%) | 8 (9.0%) |
| $25,000 to $29,999 | 4 (3.0%) | 4 (4.5%) |
| $30,000 to $34,999 | 11 (8.3%) | 3 (3.4%) |
| $35,000 to $39,999 | 6 (4.5%) | 4 (4.5%) |
| $40,000 to $44,999 | 4 (3.0%) | 4 (4.5%) |
| $45,000 to $49,999 | 0 (0.0%) | 3 (3.4%) |
| $50,000 to $54,999 | 7 (5.3%) | 1 (1.1%) |
| $55,000 to $64,999 | 4 (3.0%) | 10 (11.2%) |
| $65,000 to $74,999 | 2 (1.5%) | 4 (4.5%) |
| $75,000 to $99,999 | 4 (3.0%) | 7 (7.9%) |
| $100,000+ | 10 (7.6%) | 2 (2.2%) |
| Total | 132 (100.0%) | 89 (100.0%) |
Earnings by Sex by Educational Attainment in Shishmaref
Average earnings in Shishmaref are $19,250 for men and $29,375 for women, a difference of 34.5%. Men with an educational attainment of less than high school enjoy the highest average annual earnings of $18,750, while those with less than high school education earn the least with $18,750. Women with an educational attainment of graduate degree earn the most with the average annual earnings of $81,250, while those with high school diploma education have the smallest earnings of $19,583.
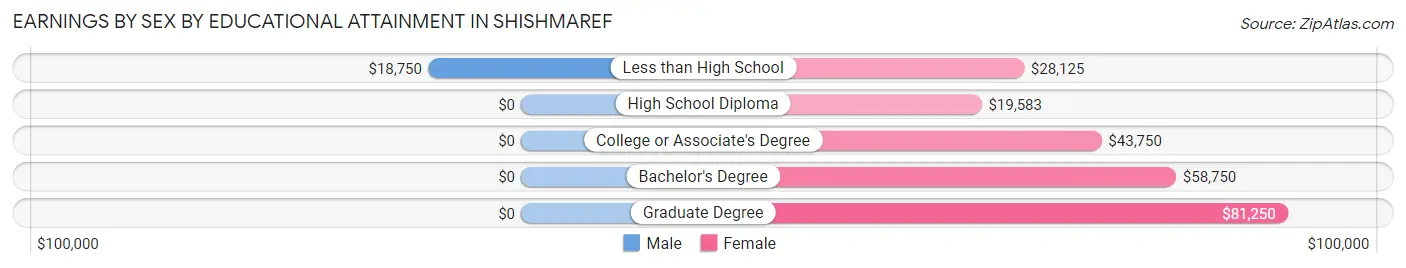
| Educational Attainment | Male Income | Female Income |
| Less than High School | $18,750 | $28,125 |
| High School Diploma | - | - |
| College or Associate's Degree | - | - |
| Bachelor's Degree | - | - |
| Graduate Degree | - | - |
| Total | $19,250 | $29,375 |
Family Income in Shishmaref
Family Income Brackets in Shishmaref
According to the Shishmaref family income data, there are 27 families falling into the $50,000 to $74,999 income range, which is the most common income bracket and makes up 21.4% of all families. Conversely, the $200,000+ income bracket is the least frequent group with only 4 families (3.2%) belonging to this category.
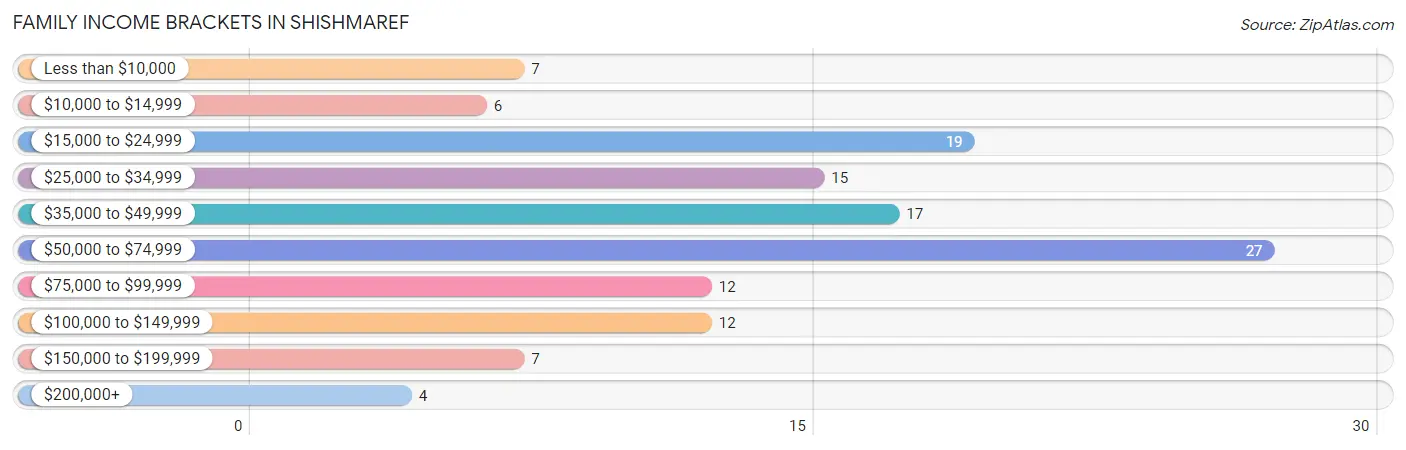
| Income Bracket | # Families | % Families |
| Less than $10,000 | 7 | 5.6% |
| $10,000 to $14,999 | 6 | 4.8% |
| $15,000 to $24,999 | 19 | 15.1% |
| $25,000 to $34,999 | 15 | 11.9% |
| $35,000 to $49,999 | 17 | 13.5% |
| $50,000 to $74,999 | 27 | 21.4% |
| $75,000 to $99,999 | 12 | 9.5% |
| $100,000 to $149,999 | 12 | 9.5% |
| $150,000 to $199,999 | 7 | 5.6% |
| $200,000+ | 4 | 3.2% |
Family Income by Famaliy Size in Shishmaref
6-person families (7 | 5.6%) account for the highest median family income in Shishmaref with $101,875 per family, while 2-person families (23 | 18.2%) have the highest median income of $28,820 per family member.
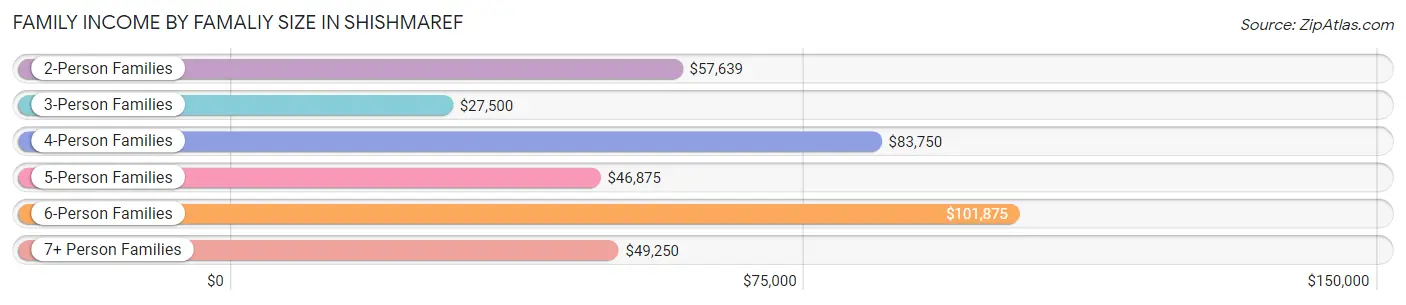
| Income Bracket | # Families | Median Income |
| 2-Person Families | 23 (18.2%) | $57,639 |
| 3-Person Families | 30 (23.8%) | $27,500 |
| 4-Person Families | 22 (17.5%) | $83,750 |
| 5-Person Families | 23 (18.2%) | $46,875 |
| 6-Person Families | 7 (5.6%) | $101,875 |
| 7+ Person Families | 21 (16.7%) | $49,250 |
| Total | 126 (100.0%) | $49,722 |
Family Income by Number of Earners in Shishmaref
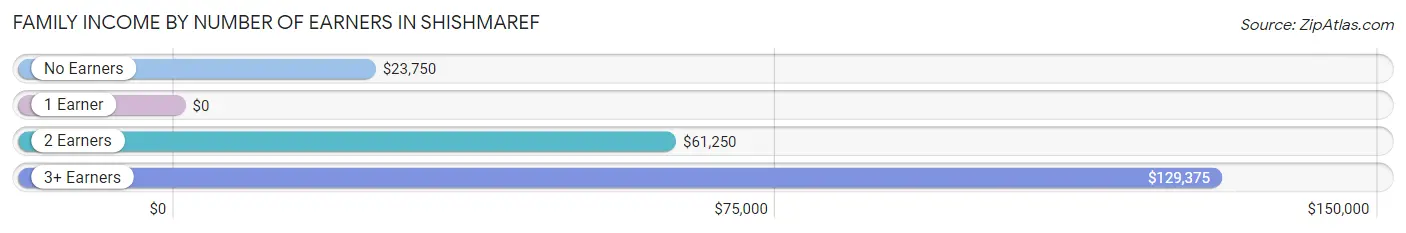
| Number of Earners | # Families | Median Income |
| No Earners | 18 (14.3%) | $23,750 |
| 1 Earner | 55 (43.6%) | $0 |
| 2 Earners | 30 (23.8%) | $61,250 |
| 3+ Earners | 23 (18.2%) | $129,375 |
| Total | 126 (100.0%) | $49,722 |
Household Income in Shishmaref
Household Income Brackets in Shishmaref
With 26 households falling in the category, the $50,000 to $74,999 income range is the most frequent in Shishmaref, accounting for 17.3% of all households. In contrast, only 5 households (3.3%) fall into the $10,000 to $14,999 income bracket, making it the least populous group.
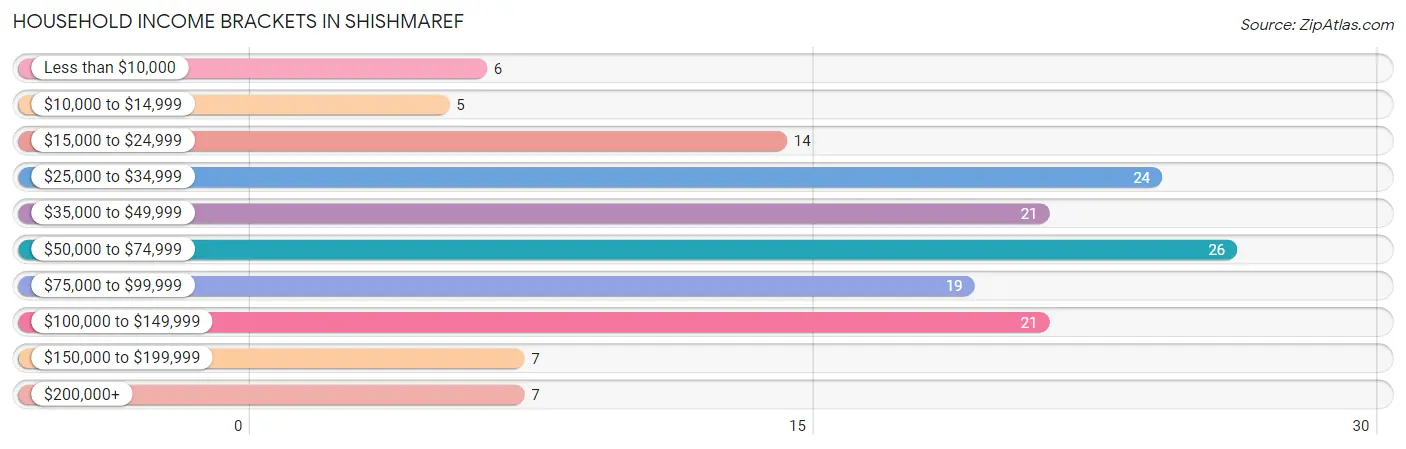
| Income Bracket | # Households | % Households |
| Less than $10,000 | 6 | 4.0% |
| $10,000 to $14,999 | 5 | 3.3% |
| $15,000 to $24,999 | 14 | 9.3% |
| $25,000 to $34,999 | 24 | 16.0% |
| $35,000 to $49,999 | 21 | 14.0% |
| $50,000 to $74,999 | 26 | 17.3% |
| $75,000 to $99,999 | 19 | 12.7% |
| $100,000 to $149,999 | 21 | 14.0% |
| $150,000 to $199,999 | 7 | 4.7% |
| $200,000+ | 7 | 4.7% |
Household Income by Householder Age in Shishmaref
The median household income in Shishmaref is $56,875, with the highest median household income of $62,500 found in the 65+ years age bracket for the primary householder. A total of 38 households (25.3%) fall into this category. Meanwhile, the 15 to 24 years age bracket for the primary householder has the lowest median household income of $0, with 5 households (3.3%) in this group.
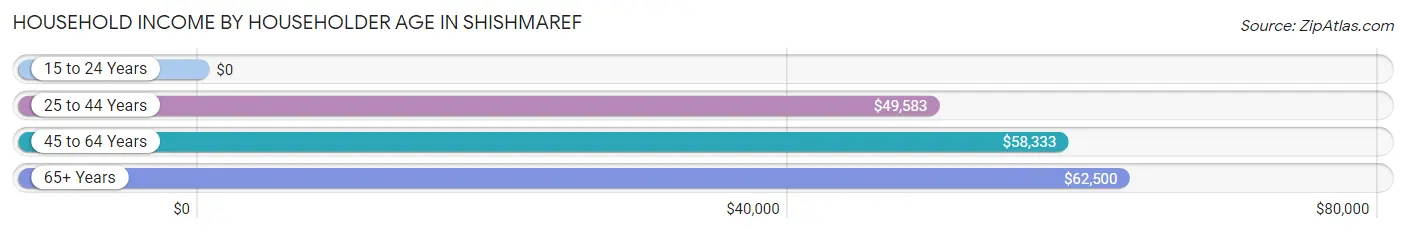
| Income Bracket | # Households | Median Income |
| 15 to 24 Years | 5 (3.3%) | $0 |
| 25 to 44 Years | 37 (24.7%) | $49,583 |
| 45 to 64 Years | 70 (46.7%) | $58,333 |
| 65+ Years | 38 (25.3%) | $62,500 |
| Total | 150 (100.0%) | $56,875 |
Poverty in Shishmaref
Income Below Poverty by Sex and Age in Shishmaref
With 30.8% poverty level for males and 32.5% for females among the residents of Shishmaref, 5 year old males and 5 year old females are the most vulnerable to poverty, with 4 males (66.7%) and 4 females (100.0%) in their respective age groups living below the poverty level.
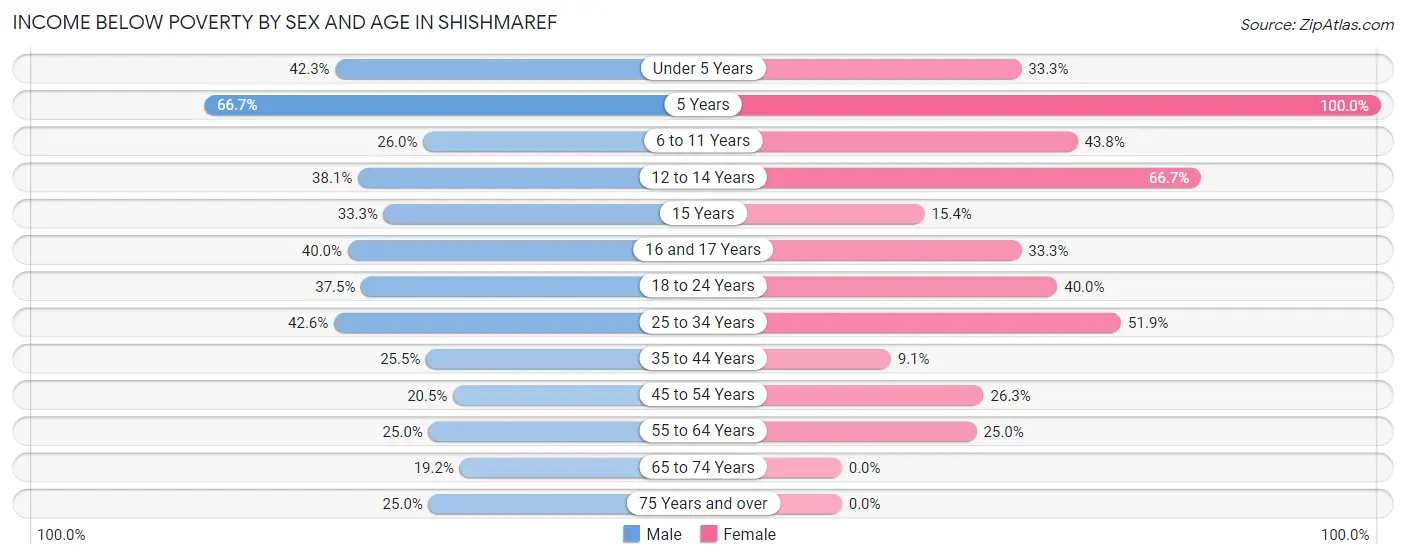
| Age Bracket | Male | Female |
| Under 5 Years | 11 (42.3%) | 8 (33.3%) |
| 5 Years | 4 (66.7%) | 4 (100.0%) |
| 6 to 11 Years | 13 (26.0%) | 14 (43.8%) |
| 12 to 14 Years | 8 (38.1%) | 10 (66.7%) |
| 15 Years | 2 (33.3%) | 2 (15.4%) |
| 16 and 17 Years | 4 (40.0%) | 2 (33.3%) |
| 18 to 24 Years | 6 (37.5%) | 6 (40.0%) |
| 25 to 34 Years | 20 (42.5%) | 14 (51.8%) |
| 35 to 44 Years | 14 (25.5%) | 2 (9.1%) |
| 45 to 54 Years | 9 (20.4%) | 10 (26.3%) |
| 55 to 64 Years | 4 (25.0%) | 5 (25.0%) |
| 65 to 74 Years | 5 (19.2%) | 0 (0.0%) |
| 75 Years and over | 2 (25.0%) | 0 (0.0%) |
| Total | 102 (30.8%) | 77 (32.5%) |
Income Above Poverty by Sex and Age in Shishmaref
According to the poverty statistics in Shishmaref, males aged 65 to 74 years and females aged 65 to 74 years are the age groups that are most secure financially, with 80.8% of males and 100.0% of females in these age groups living above the poverty line.
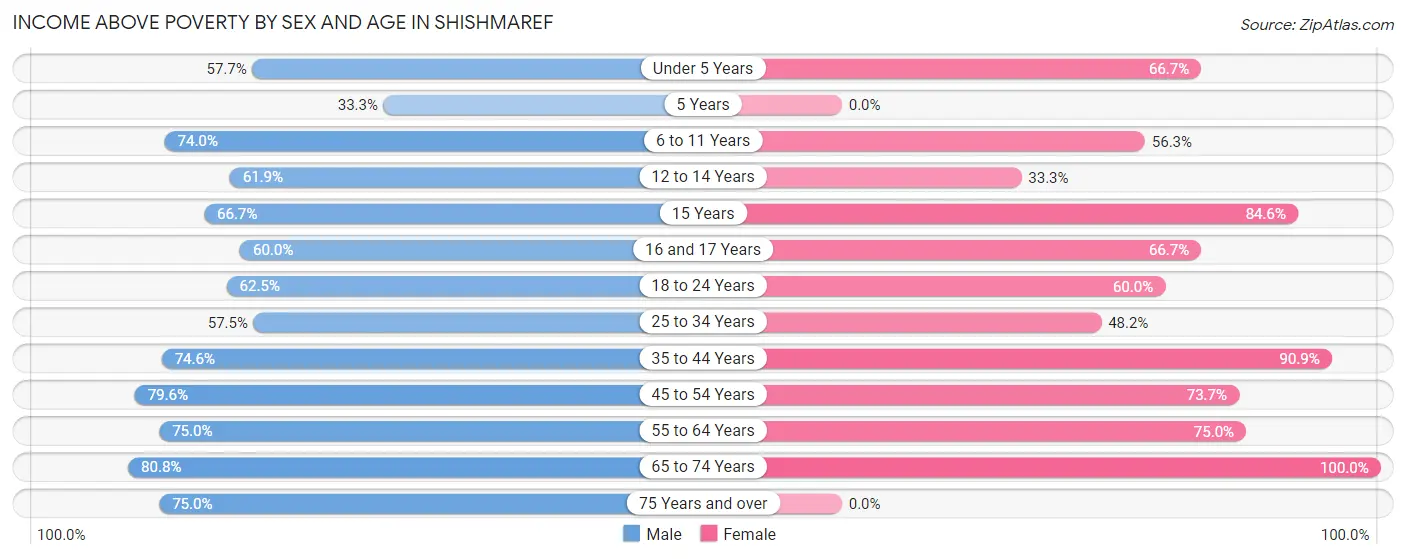
| Age Bracket | Male | Female |
| Under 5 Years | 15 (57.7%) | 16 (66.7%) |
| 5 Years | 2 (33.3%) | 0 (0.0%) |
| 6 to 11 Years | 37 (74.0%) | 18 (56.2%) |
| 12 to 14 Years | 13 (61.9%) | 5 (33.3%) |
| 15 Years | 4 (66.7%) | 11 (84.6%) |
| 16 and 17 Years | 6 (60.0%) | 4 (66.7%) |
| 18 to 24 Years | 10 (62.5%) | 9 (60.0%) |
| 25 to 34 Years | 27 (57.5%) | 13 (48.1%) |
| 35 to 44 Years | 41 (74.6%) | 20 (90.9%) |
| 45 to 54 Years | 35 (79.5%) | 28 (73.7%) |
| 55 to 64 Years | 12 (75.0%) | 15 (75.0%) |
| 65 to 74 Years | 21 (80.8%) | 21 (100.0%) |
| 75 Years and over | 6 (75.0%) | 0 (0.0%) |
| Total | 229 (69.2%) | 160 (67.5%) |
Income Below Poverty Among Married-Couple Families in Shishmaref
The poverty statistics for married-couple families in Shishmaref show that 14.0% or 7 of the total 50 families live below the poverty line. Families with 3 or 4 children have the highest poverty rate of 30.8%, comprising of 4 families. On the other hand, families with no children have the lowest poverty rate of 0.0%, which includes 0 families.
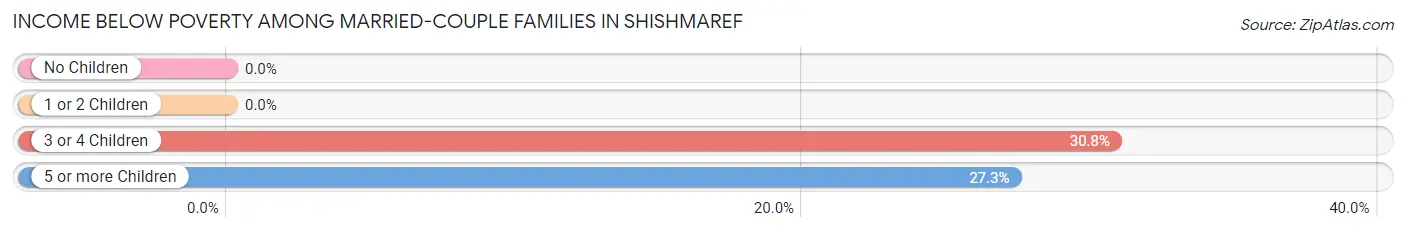
| Children | Above Poverty | Below Poverty |
| No Children | 9 (100.0%) | 0 (0.0%) |
| 1 or 2 Children | 17 (100.0%) | 0 (0.0%) |
| 3 or 4 Children | 9 (69.2%) | 4 (30.8%) |
| 5 or more Children | 8 (72.7%) | 3 (27.3%) |
| Total | 43 (86.0%) | 7 (14.0%) |
Income Below Poverty Among Single-Parent Households in Shishmaref
According to the poverty data in Shishmaref, 37.5% or 15 single-father households and 36.1% or 13 single-mother households are living below the poverty line. Among single-father households, those with 5 or more children have the highest poverty rate, with 2 households (100.0%) experiencing poverty. Likewise, among single-mother households, those with 3 or 4 children have the highest poverty rate, with 5 households (71.4%) falling below the poverty line.
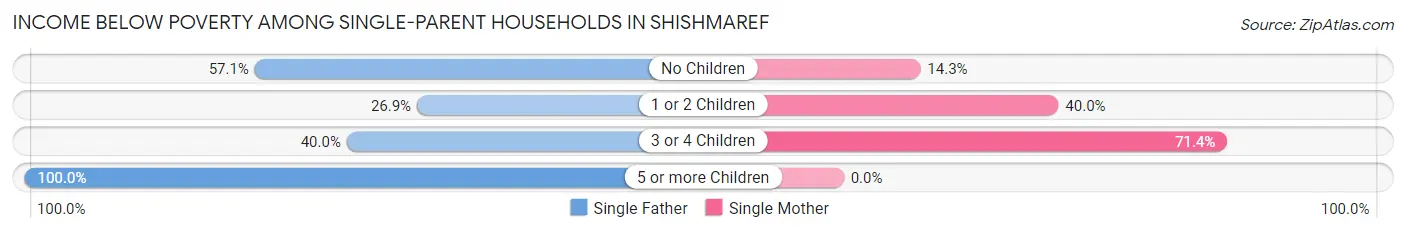
| Children | Single Father | Single Mother |
| No Children | 4 (57.1%) | 2 (14.3%) |
| 1 or 2 Children | 7 (26.9%) | 6 (40.0%) |
| 3 or 4 Children | 2 (40.0%) | 5 (71.4%) |
| 5 or more Children | 2 (100.0%) | 0 (0.0%) |
| Total | 15 (37.5%) | 13 (36.1%) |
Income Below Poverty Among Married-Couple vs Single-Parent Households in Shishmaref
The poverty data for Shishmaref shows that 7 of the married-couple family households (14.0%) and 28 of the single-parent households (36.8%) are living below the poverty level. Within the married-couple family households, those with 3 or 4 children have the highest poverty rate, with 4 households (30.8%) falling below the poverty line. Among the single-parent households, those with 5 or more children have the highest poverty rate, with 2 household (100.0%) living below poverty.
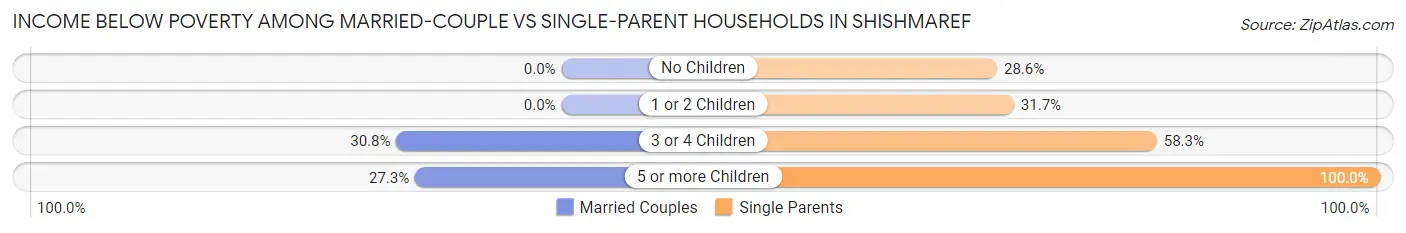
| Children | Married-Couple Families | Single-Parent Households |
| No Children | 0 (0.0%) | 6 (28.6%) |
| 1 or 2 Children | 0 (0.0%) | 13 (31.7%) |
| 3 or 4 Children | 4 (30.8%) | 7 (58.3%) |
| 5 or more Children | 3 (27.3%) | 2 (100.0%) |
| Total | 7 (14.0%) | 28 (36.8%) |
Race in Shishmaref
The most populous races in Shishmaref are Native / Alaskan (534 | 94.0%), Asian (12 | 2.1%), and White / Caucasian (12 | 2.1%).
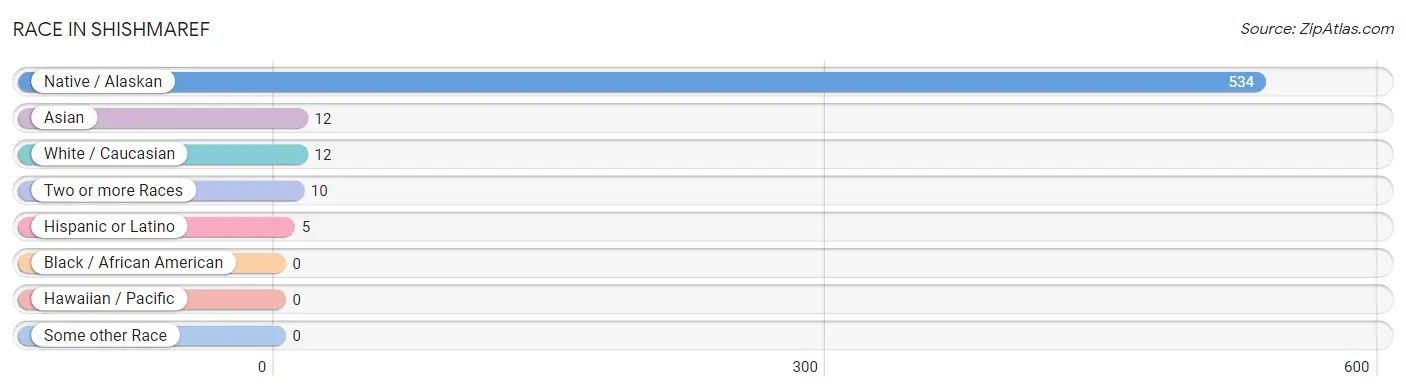
| Race | # Population | % Population |
| Asian | 12 | 2.1% |
| Black / African American | 0 | 0.0% |
| Hawaiian / Pacific | 0 | 0.0% |
| Hispanic or Latino | 5 | 0.9% |
| Native / Alaskan | 534 | 94.0% |
| White / Caucasian | 12 | 2.1% |
| Two or more Races | 10 | 1.8% |
| Some other Race | 0 | 0.0% |
| Total | 568 | 100.0% |
Ancestry in Shishmaref
The most populous ancestries reported in Shishmaref are Inupiat (538 | 94.7%), Korean (12 | 2.1%), Irish (11 | 1.9%), Burmese (10 | 1.8%), and German (5 | 0.9%), together accounting for 101.4% of all Shishmaref residents.
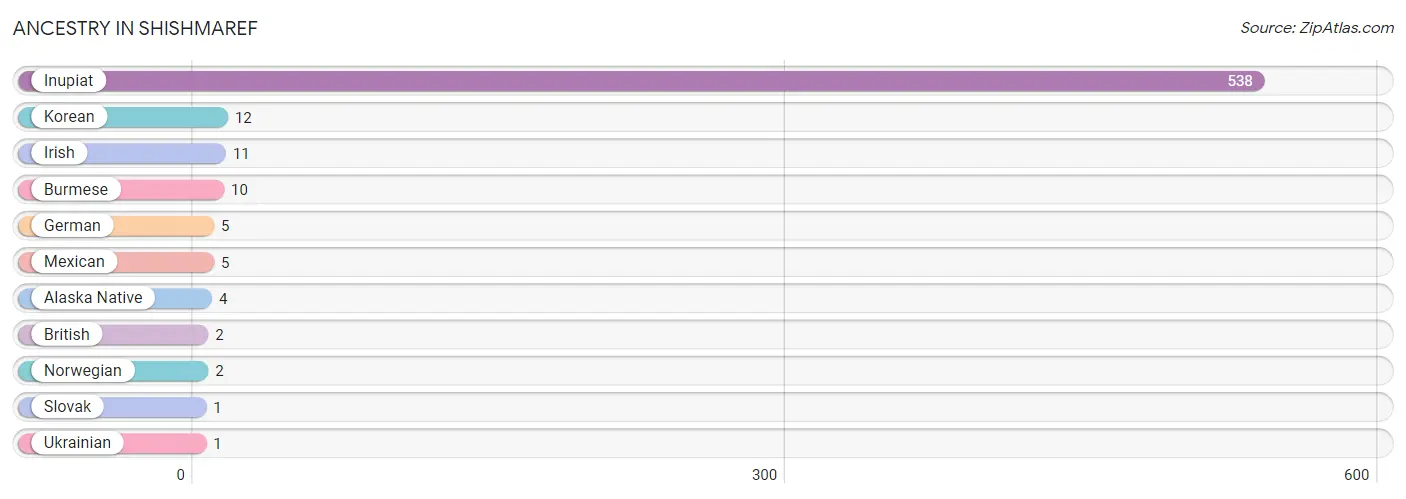
| Ancestry | # Population | % Population |
| Alaska Native | 4 | 0.7% |
| British | 2 | 0.4% |
| Burmese | 10 | 1.8% |
| German | 5 | 0.9% |
| Inupiat | 538 | 94.7% |
| Irish | 11 | 1.9% |
| Korean | 12 | 2.1% |
| Mexican | 5 | 0.9% |
| Norwegian | 2 | 0.4% |
| Slovak | 1 | 0.2% |
| Ukrainian | 1 | 0.2% | View All 11 Rows |
Immigrants in Shishmaref
The most numerous immigrant groups reported in Shishmaref came from Asia (12 | 2.1%), Philippines (12 | 2.1%), and South Eastern Asia (12 | 2.1%), together accounting for 6.3% of all Shishmaref residents.
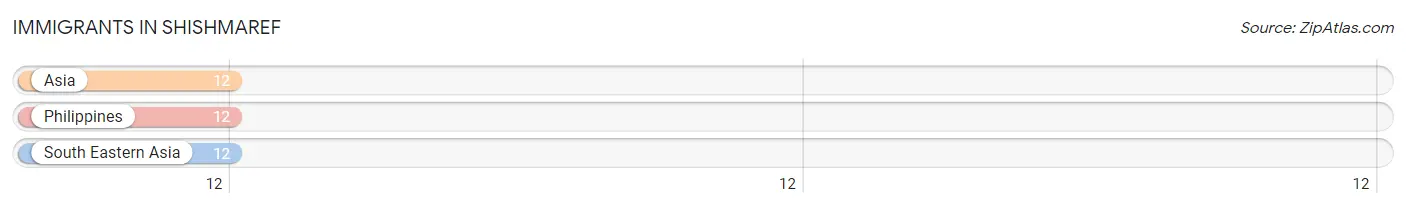
| Immigration Origin | # Population | % Population |
| Asia | 12 | 2.1% |
| Philippines | 12 | 2.1% |
| South Eastern Asia | 12 | 2.1% | View All 3 Rows |
Sex and Age in Shishmaref
Sex and Age in Shishmaref
The most populous age groups in Shishmaref are 10 to 14 Years (45 | 13.6%) for men and 5 to 9 Years (30 | 12.7%) for women.
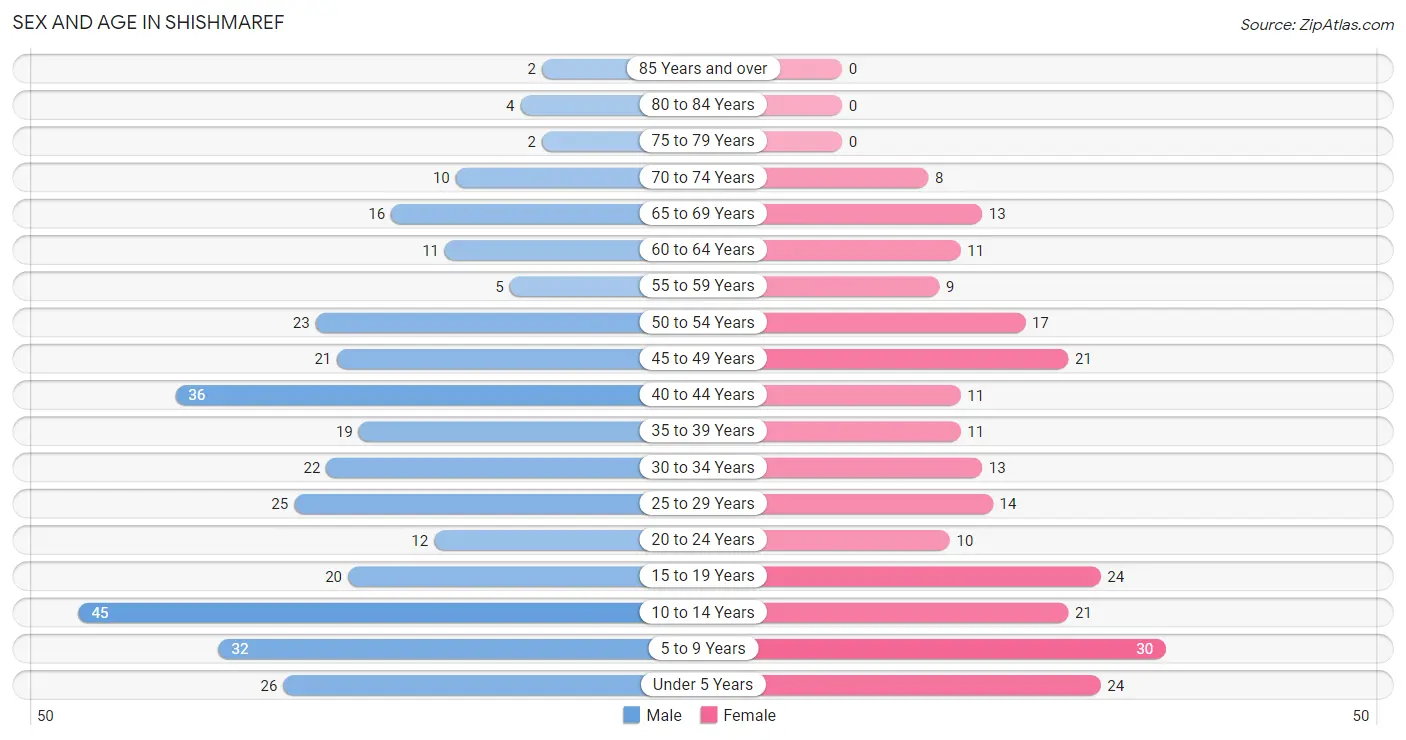
| Age Bracket | Male | Female |
| Under 5 Years | 26 (7.9%) | 24 (10.1%) |
| 5 to 9 Years | 32 (9.7%) | 30 (12.7%) |
| 10 to 14 Years | 45 (13.6%) | 21 (8.9%) |
| 15 to 19 Years | 20 (6.0%) | 24 (10.1%) |
| 20 to 24 Years | 12 (3.6%) | 10 (4.2%) |
| 25 to 29 Years | 25 (7.5%) | 14 (5.9%) |
| 30 to 34 Years | 22 (6.7%) | 13 (5.5%) |
| 35 to 39 Years | 19 (5.7%) | 11 (4.6%) |
| 40 to 44 Years | 36 (10.9%) | 11 (4.6%) |
| 45 to 49 Years | 21 (6.3%) | 21 (8.9%) |
| 50 to 54 Years | 23 (7.0%) | 17 (7.2%) |
| 55 to 59 Years | 5 (1.5%) | 9 (3.8%) |
| 60 to 64 Years | 11 (3.3%) | 11 (4.6%) |
| 65 to 69 Years | 16 (4.8%) | 13 (5.5%) |
| 70 to 74 Years | 10 (3.0%) | 8 (3.4%) |
| 75 to 79 Years | 2 (0.6%) | 0 (0.0%) |
| 80 to 84 Years | 4 (1.2%) | 0 (0.0%) |
| 85 Years and over | 2 (0.6%) | 0 (0.0%) |
| Total | 331 (100.0%) | 237 (100.0%) |
Families and Households in Shishmaref
Median Family Size in Shishmaref
The median family size in Shishmaref is 4.05 persons per family, with married-couple families (50 | 39.7%) accounting for the largest median family size of 5.38 persons per family. On the other hand, single female/mother families (36 | 28.6%) represent the smallest median family size with 3.08 persons per family.
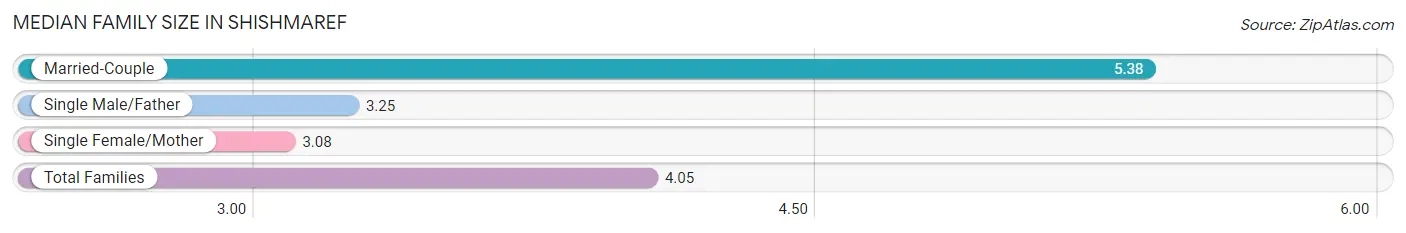
| Family Type | # Families | Family Size |
| Married-Couple | 50 (39.7%) | 5.38 |
| Single Male/Father | 40 (31.8%) | 3.25 |
| Single Female/Mother | 36 (28.6%) | 3.08 |
| Total Families | 126 (100.0%) | 4.05 |
Median Household Size in Shishmaref
The median household size in Shishmaref is 3.79 persons per household, with married-couple households (50 | 33.3%) accounting for the largest median household size of 5.46 persons per household. non-family households (24 | 16.0%) represent the smallest median household size with 1.17 persons per household.

| Household Type | # Households | Household Size |
| Married-Couple | 50 (33.3%) | 5.46 |
| Single Male/Father | 40 (26.7%) | 3.65 |
| Single Female/Mother | 36 (24.0%) | 3.36 |
| Non-family | 24 (16.0%) | 1.17 |
| Total Households | 150 (100.0%) | 3.79 |
Household Size by Marriage Status in Shishmaref
Out of a total of 150 households in Shishmaref, 126 (84.0%) are family households, while 24 (16.0%) are nonfamily households. The most numerous type of family households are 3-person households, comprising 29, and the most common type of nonfamily households are 1-person households, comprising 18.
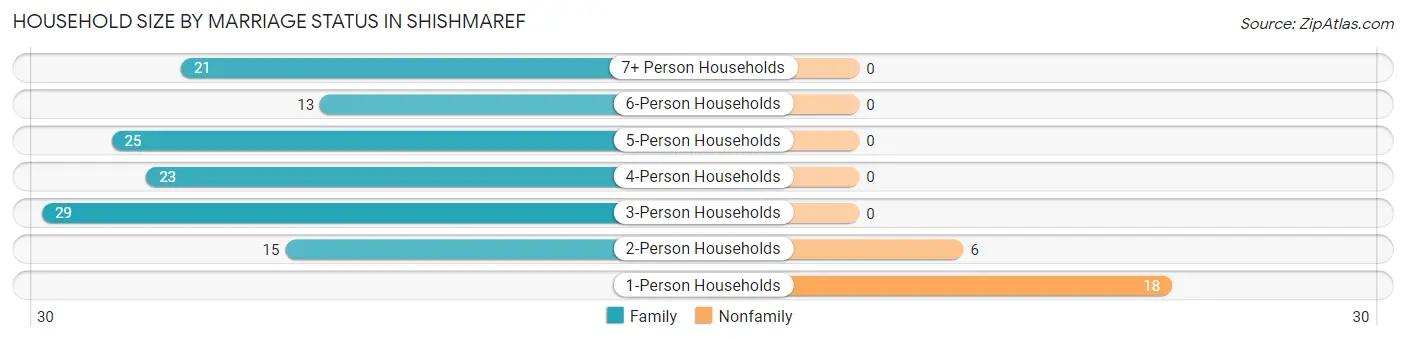
| Household Size | Family Households | Nonfamily Households |
| 1-Person Households | - | 18 (12.0%) |
| 2-Person Households | 15 (10.0%) | 6 (4.0%) |
| 3-Person Households | 29 (19.3%) | 0 (0.0%) |
| 4-Person Households | 23 (15.3%) | 0 (0.0%) |
| 5-Person Households | 25 (16.7%) | 0 (0.0%) |
| 6-Person Households | 13 (8.7%) | 0 (0.0%) |
| 7+ Person Households | 21 (14.0%) | 0 (0.0%) |
| Total | 126 (84.0%) | 24 (16.0%) |
Female Fertility in Shishmaref
Fertility by Age in Shishmaref
Average fertility rate in Shishmaref is 55.0 births per 1,000 women. Women in the age bracket of 20 to 34 years have the highest fertility rate with 108.0 births per 1,000 women. Women in the age bracket of 20 to 34 years acount for 66.7% of all women with births.
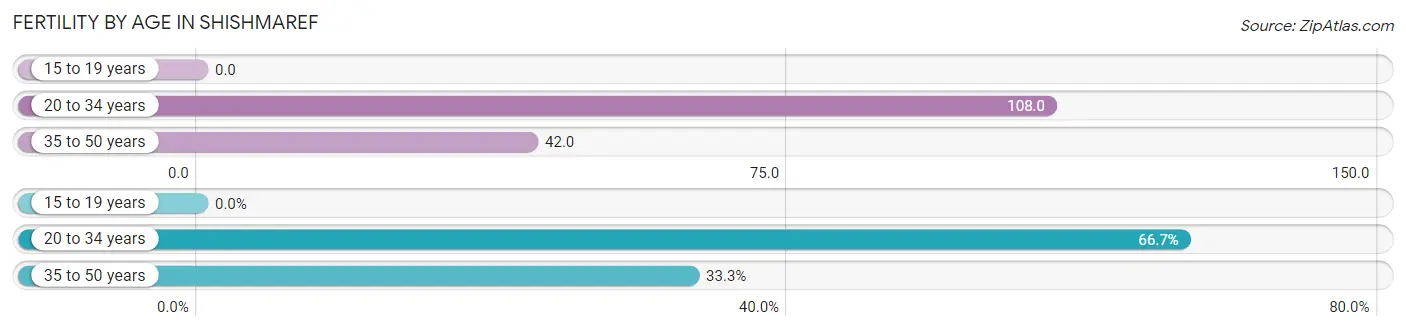
| Age Bracket | Women with Births | Births / 1,000 Women |
| 15 to 19 years | 0 (0.0%) | 0.0 |
| 20 to 34 years | 4 (66.7%) | 108.0 |
| 35 to 50 years | 2 (33.3%) | 42.0 |
| Total | 6 (100.0%) | 55.0 |
Fertility by Age by Marriage Status in Shishmaref
33.3% of women with births (6) in Shishmaref are married. The highest percentage of unmarried women with births falls into 20 to 34 years age bracket with 100.0% of them unmarried at the time of birth, while the lowest percentage of unmarried women with births belong to 35 to 50 years age bracket with 0.0% of them unmarried.
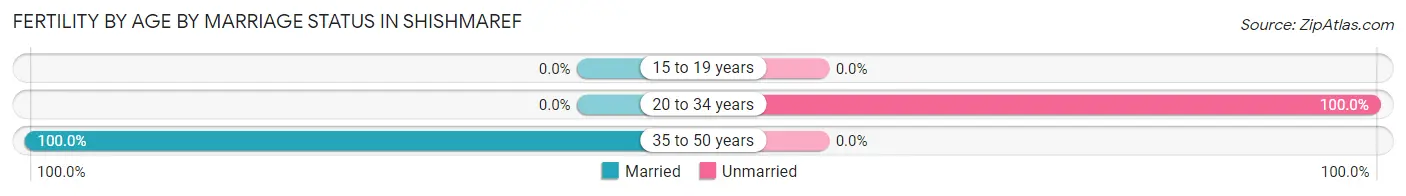
| Age Bracket | Married | Unmarried |
| 15 to 19 years | 0 (0.0%) | 0 (0.0%) |
| 20 to 34 years | 0 (0.0%) | 4 (100.0%) |
| 35 to 50 years | 2 (100.0%) | 0 (0.0%) |
| Total | 2 (33.3%) | 4 (66.7%) |
Fertility by Education in Shishmaref
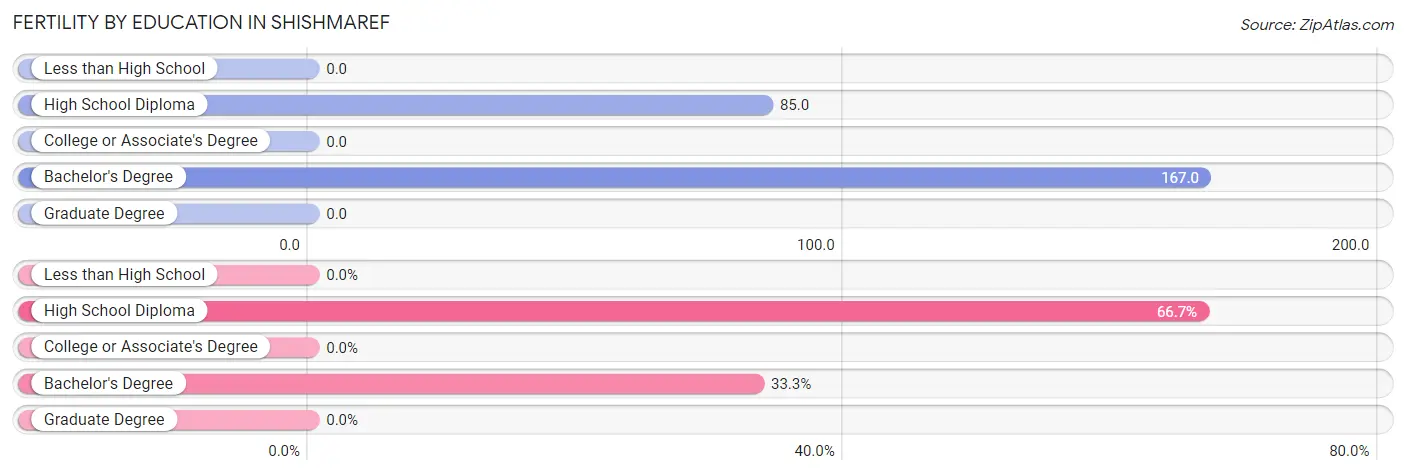
| Educational Attainment | Women with Births | Births / 1,000 Women |
| Less than High School | 0 (0.0%) | 0.0 |
| High School Diploma | 4 (66.7%) | 85.0 |
| College or Associate's Degree | 0 (0.0%) | 0.0 |
| Bachelor's Degree | 2 (33.3%) | 167.0 |
| Graduate Degree | 0 (0.0%) | 0.0 |
| Total | 6 (100.0%) | 55.0 |
Fertility by Education by Marriage Status in Shishmaref
66.7% of women with births in Shishmaref are unmarried. Women with the educational attainment of bachelor's degree are most likely to be married with 100.0% of them married at childbirth, while women with the educational attainment of high school diploma are least likely to be married with 100.0% of them unmarried at childbirth.
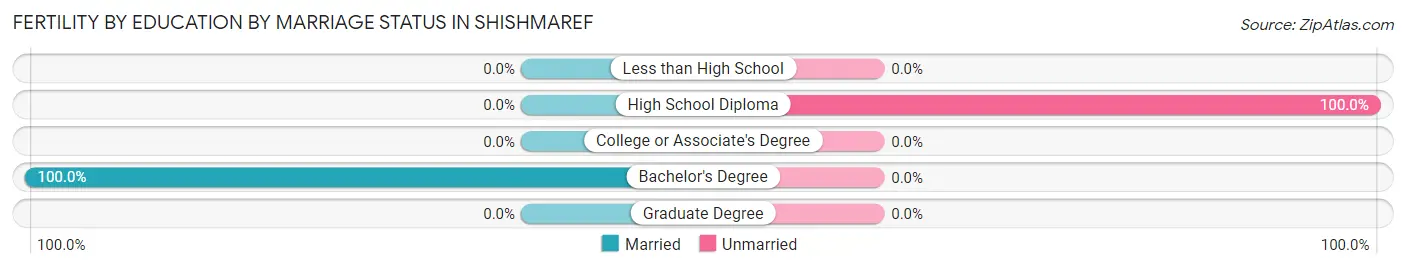
| Educational Attainment | Married | Unmarried |
| Less than High School | 0 (0.0%) | 0 (0.0%) |
| High School Diploma | 0 (0.0%) | 4 (100.0%) |
| College or Associate's Degree | 0 (0.0%) | 0 (0.0%) |
| Bachelor's Degree | 2 (100.0%) | 0 (0.0%) |
| Graduate Degree | 0 (0.0%) | 0 (0.0%) |
| Total | 2 (33.3%) | 4 (66.7%) |
Employment Characteristics in Shishmaref
Employment by Class of Employer in Shishmaref
Among the 131 employed individuals in Shishmaref, state government employees (49 | 37.4%), local government employees (40 | 30.5%), and private company employees (27 | 20.6%) make up the most common classes of employment.
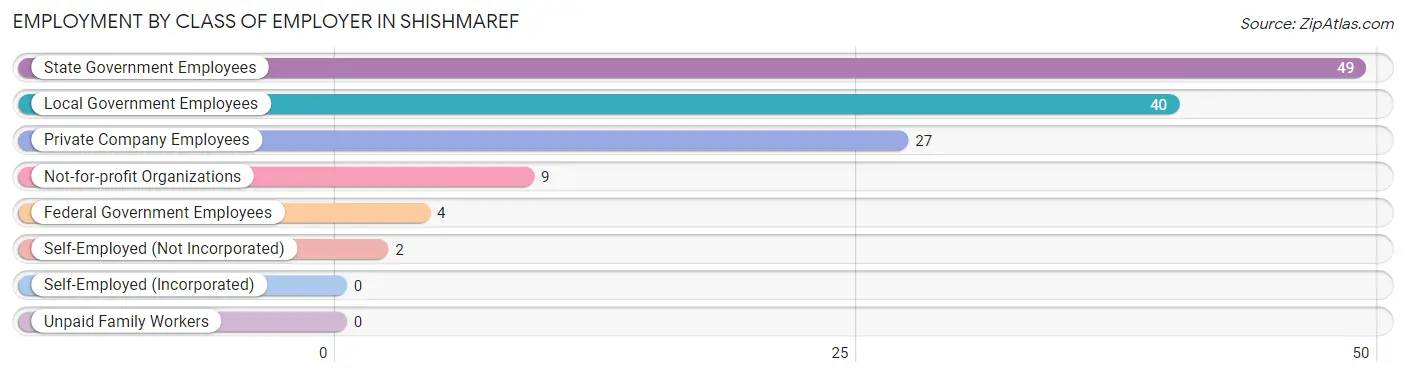
| Employer Class | # Employees | % Employees |
| Private Company Employees | 27 | 20.6% |
| Self-Employed (Incorporated) | 0 | 0.0% |
| Self-Employed (Not Incorporated) | 2 | 1.5% |
| Not-for-profit Organizations | 9 | 6.9% |
| Local Government Employees | 40 | 30.5% |
| State Government Employees | 49 | 37.4% |
| Federal Government Employees | 4 | 3.0% |
| Unpaid Family Workers | 0 | 0.0% |
| Total | 131 | 100.0% |
Employment Status by Age in Shishmaref
According to the labor force statistics for Shishmaref, out of the total population over 16 years of age (371), 52.3% or 194 individuals are in the labor force, with 28.4% or 55 of them unemployed. The age group with the highest labor force participation rate is 55 to 59 years, with 85.7% or 12 individuals in the labor force. Within the labor force, the 20 to 24 years age range has the highest percentage of unemployed individuals, with 44.4% or 8 of them being unemployed.
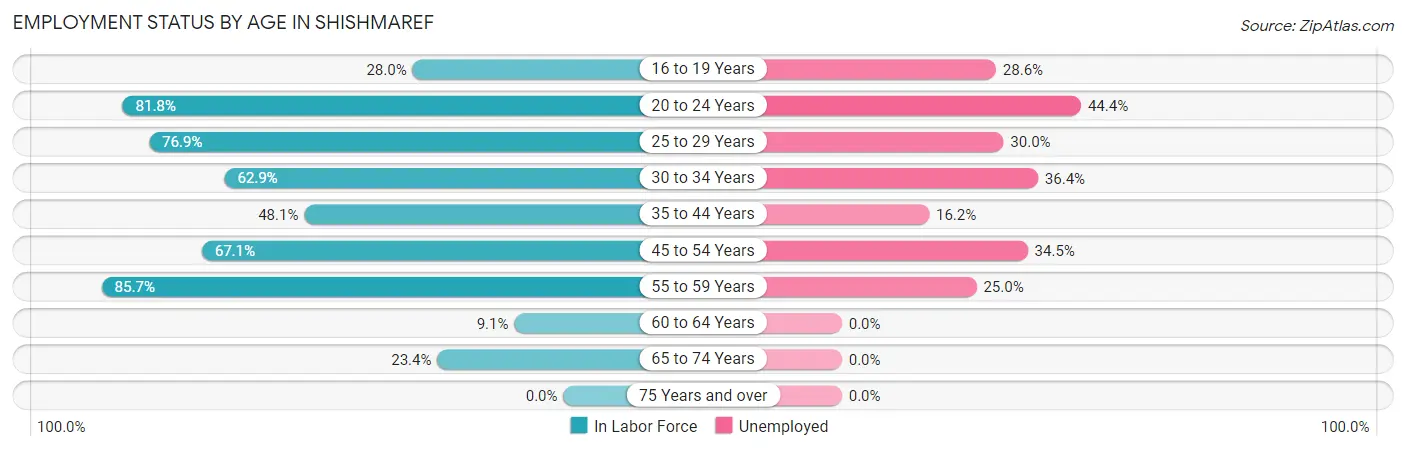
| Age Bracket | In Labor Force | Unemployed |
| 16 to 19 Years | 7 (28.0%) | 2 (28.6%) |
| 20 to 24 Years | 18 (81.8%) | 8 (44.4%) |
| 25 to 29 Years | 30 (76.9%) | 9 (30.0%) |
| 30 to 34 Years | 22 (62.9%) | 8 (36.4%) |
| 35 to 44 Years | 37 (48.1%) | 6 (16.2%) |
| 45 to 54 Years | 55 (67.1%) | 19 (34.5%) |
| 55 to 59 Years | 12 (85.7%) | 3 (25.0%) |
| 60 to 64 Years | 2 (9.1%) | 0 (0.0%) |
| 65 to 74 Years | 11 (23.4%) | 0 (0.0%) |
| 75 Years and over | 0 (0.0%) | 0 (0.0%) |
| Total | 194 (52.3%) | 55 (28.4%) |
Employment Status by Educational Attainment in Shishmaref
According to labor force statistics for Shishmaref, 58.7% of individuals (158) out of the total population between 25 and 64 years of age (269) are in the labor force, with 28.5% or 45 of them being unemployed. The group with the highest labor force participation rate are those with the educational attainment of bachelor's degree or higher, with 85.2% or 23 individuals in the labor force. Within the labor force, individuals with less than high school education have the highest percentage of unemployment, with 58.8% or 10 of them being unemployed.
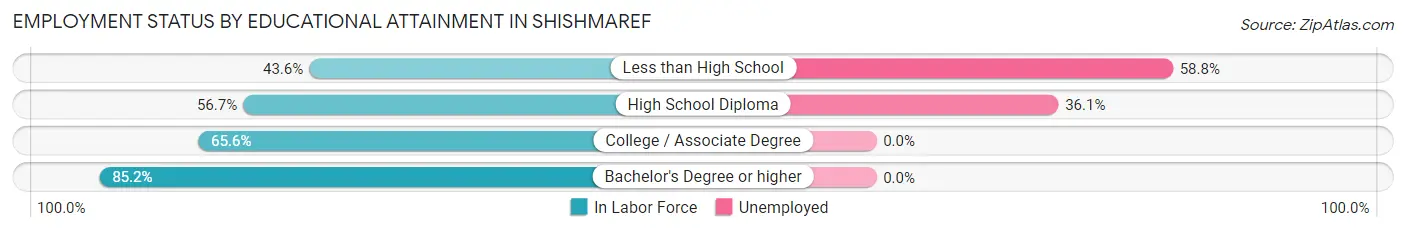
| Educational Attainment | In Labor Force | Unemployed |
| Less than High School | 17 (43.6%) | 23 (58.8%) |
| High School Diploma | 97 (56.7%) | 62 (36.1%) |
| College / Associate Degree | 21 (65.6%) | 0 (0.0%) |
| Bachelor's Degree or higher | 23 (85.2%) | 0 (0.0%) |
| Total | 158 (58.7%) | 77 (28.5%) |
Employment Occupations by Sex in Shishmaref
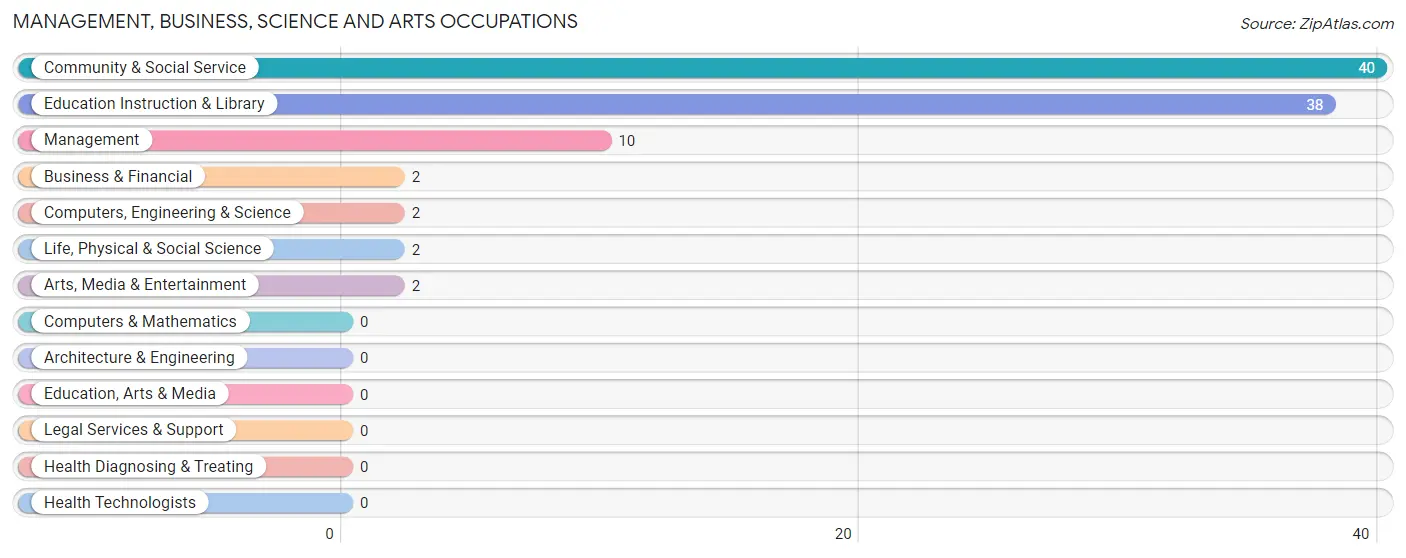
Management, Business, Science and Arts Occupations
The most common Management, Business, Science and Arts occupations in Shishmaref are Community & Social Service (40 | 28.8%), Education Instruction & Library (38 | 27.3%), Management (10 | 7.2%), Business & Financial (2 | 1.4%), and Computers, Engineering & Science (2 | 1.4%).
Management, Business, Science and Arts Occupations by Sex
Within the Management, Business, Science and Arts occupations in Shishmaref, the most male-oriented occupations are Management (60.0%), Education Instruction & Library (21.0%), and Community & Social Service (20.0%), while the most female-oriented occupations are Business & Financial (100.0%), Computers, Engineering & Science (100.0%), and Life, Physical & Social Science (100.0%).
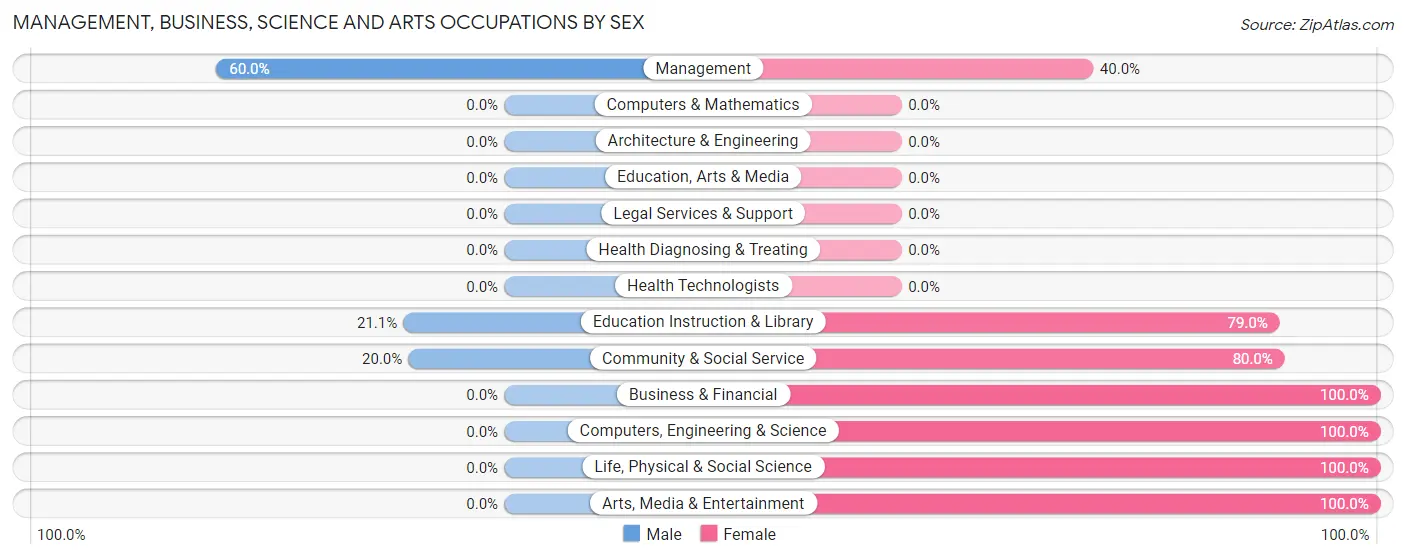
| Occupation | Male | Female |
| Management | 6 (60.0%) | 4 (40.0%) |
| Business & Financial | 0 (0.0%) | 2 (100.0%) |
| Computers, Engineering & Science | 0 (0.0%) | 2 (100.0%) |
| Computers & Mathematics | 0 (0.0%) | 0 (0.0%) |
| Architecture & Engineering | 0 (0.0%) | 0 (0.0%) |
| Life, Physical & Social Science | 0 (0.0%) | 2 (100.0%) |
| Community & Social Service | 8 (20.0%) | 32 (80.0%) |
| Education, Arts & Media | 0 (0.0%) | 0 (0.0%) |
| Legal Services & Support | 0 (0.0%) | 0 (0.0%) |
| Education Instruction & Library | 8 (21.0%) | 30 (78.9%) |
| Arts, Media & Entertainment | 0 (0.0%) | 2 (100.0%) |
| Health Diagnosing & Treating | 0 (0.0%) | 0 (0.0%) |
| Health Technologists | 0 (0.0%) | 0 (0.0%) |
| Total (Category) | 14 (25.9%) | 40 (74.1%) |
| Total (Overall) | 61 (43.9%) | 78 (56.1%) |
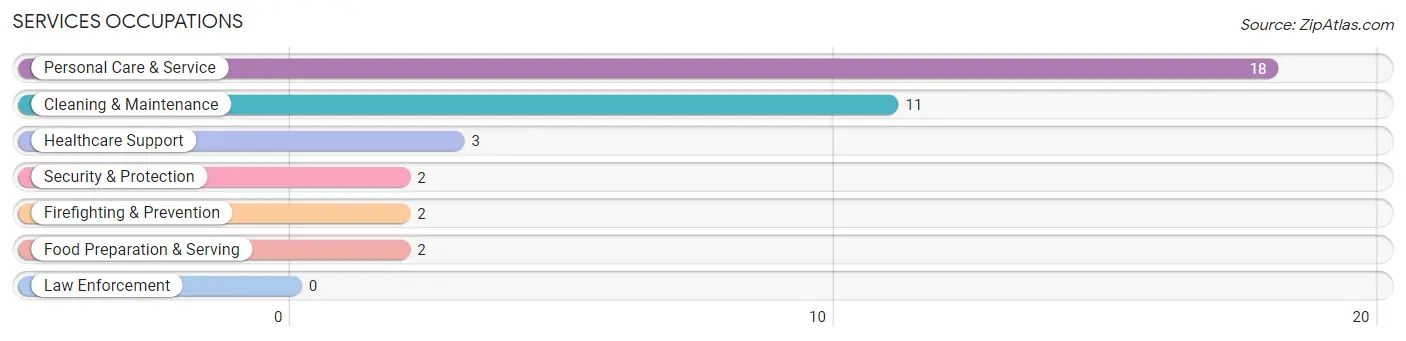
Services Occupations
The most common Services occupations in Shishmaref are Personal Care & Service (18 | 13.0%), Cleaning & Maintenance (11 | 7.9%), Healthcare Support (3 | 2.2%), Security & Protection (2 | 1.4%), and Firefighting & Prevention (2 | 1.4%).
Services Occupations by Sex
Within the Services occupations in Shishmaref, the most male-oriented occupations are Cleaning & Maintenance (63.6%), and Personal Care & Service (38.9%), while the most female-oriented occupations are Healthcare Support (100.0%), Security & Protection (100.0%), and Firefighting & Prevention (100.0%).
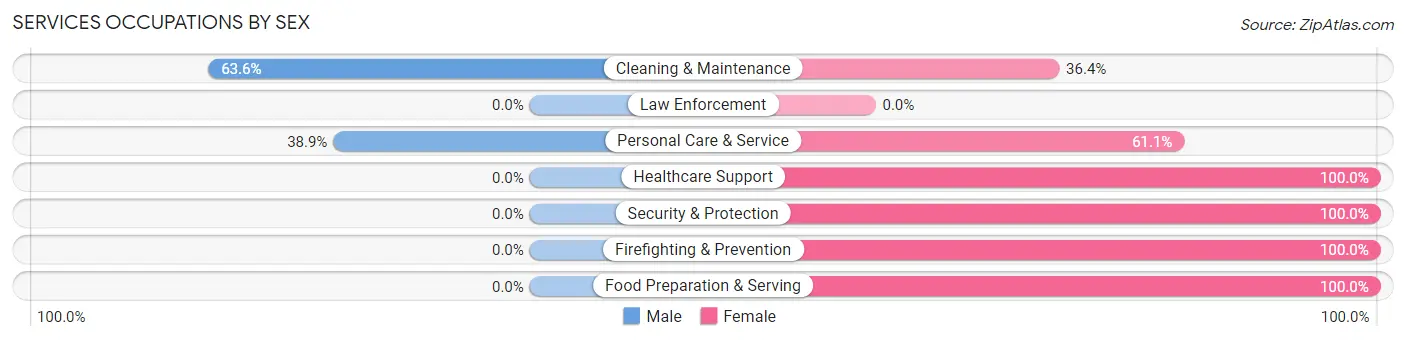
| Occupation | Male | Female |
| Healthcare Support | 0 (0.0%) | 3 (100.0%) |
| Security & Protection | 0 (0.0%) | 2 (100.0%) |
| Firefighting & Prevention | 0 (0.0%) | 2 (100.0%) |
| Law Enforcement | 0 (0.0%) | 0 (0.0%) |
| Food Preparation & Serving | 0 (0.0%) | 2 (100.0%) |
| Cleaning & Maintenance | 7 (63.6%) | 4 (36.4%) |
| Personal Care & Service | 7 (38.9%) | 11 (61.1%) |
| Total (Category) | 14 (38.9%) | 22 (61.1%) |
| Total (Overall) | 61 (43.9%) | 78 (56.1%) |
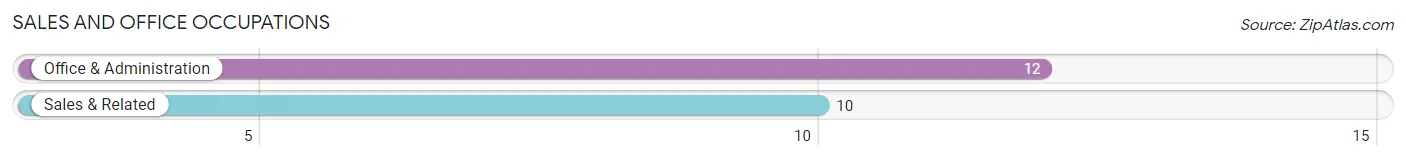
Sales and Office Occupations
The most common Sales and Office occupations in Shishmaref are Office & Administration (12 | 8.6%), and Sales & Related (10 | 7.2%).
Sales and Office Occupations by Sex
| Occupation | Male | Female |
| Sales & Related | 7 (70.0%) | 3 (30.0%) |
| Office & Administration | 4 (33.3%) | 8 (66.7%) |
| Total (Category) | 11 (50.0%) | 11 (50.0%) |
| Total (Overall) | 61 (43.9%) | 78 (56.1%) |
Natural Resources, Construction and Maintenance Occupations
The most common Natural Resources, Construction and Maintenance occupations in Shishmaref are Installation, Maintenance & Repair (3 | 2.2%), and Construction & Extraction (2 | 1.4%).
Natural Resources, Construction and Maintenance Occupations by Sex
| Occupation | Male | Female |
| Farming, Fishing & Forestry | 0 (0.0%) | 0 (0.0%) |
| Construction & Extraction | 2 (100.0%) | 0 (0.0%) |
| Installation, Maintenance & Repair | 3 (100.0%) | 0 (0.0%) |
| Total (Category) | 5 (100.0%) | 0 (0.0%) |
| Total (Overall) | 61 (43.9%) | 78 (56.1%) |
Production, Transportation and Moving Occupations
The most common Production, Transportation and Moving occupations in Shishmaref are Production (10 | 7.2%), Transportation (7 | 5.0%), and Material Moving (5 | 3.6%).
Production, Transportation and Moving Occupations by Sex
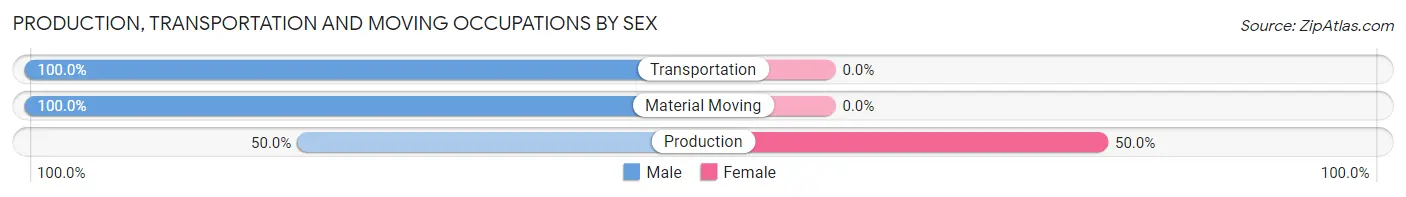
| Occupation | Male | Female |
| Production | 5 (50.0%) | 5 (50.0%) |
| Transportation | 7 (100.0%) | 0 (0.0%) |
| Material Moving | 5 (100.0%) | 0 (0.0%) |
| Total (Category) | 17 (77.3%) | 5 (22.7%) |
| Total (Overall) | 61 (43.9%) | 78 (56.1%) |
Employment Industries by Sex in Shishmaref
Employment Industries in Shishmaref
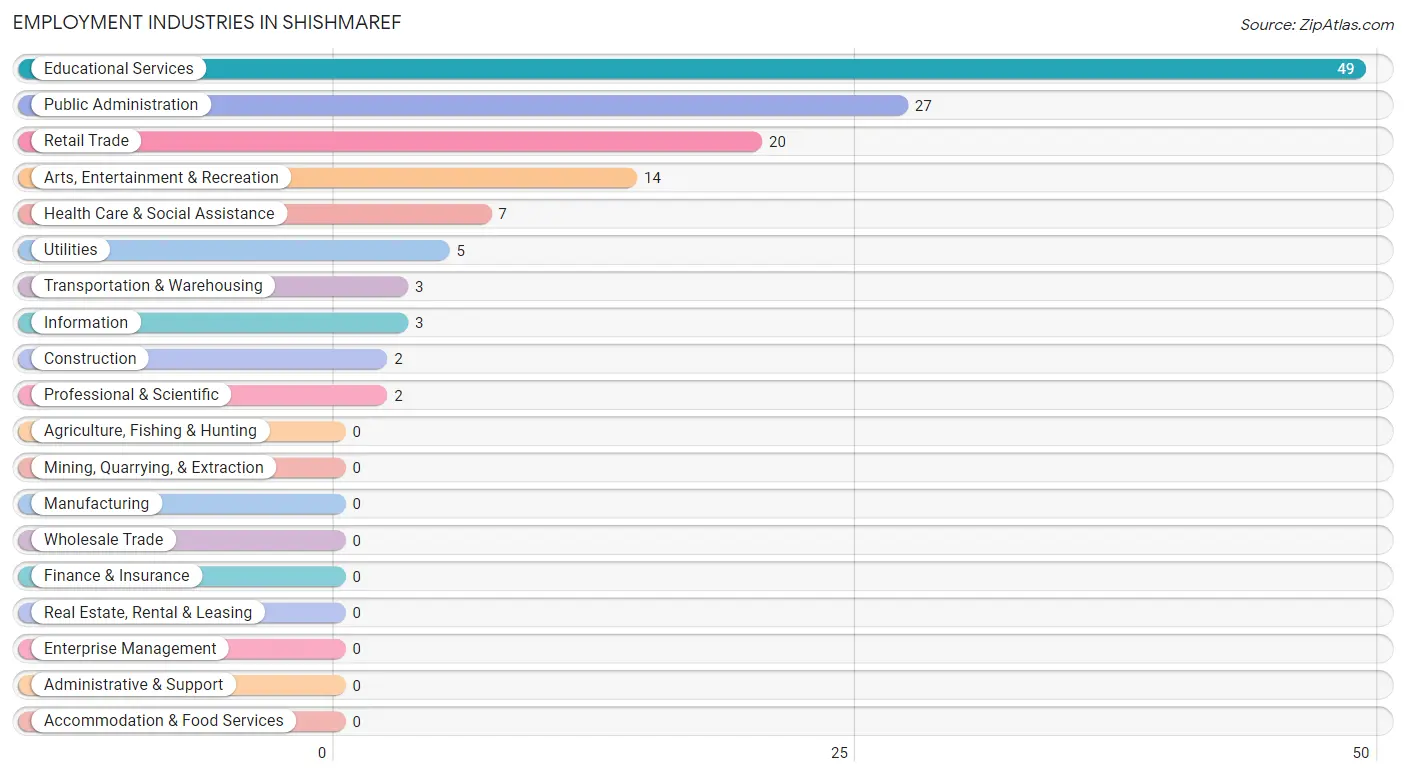
The major employment industries in Shishmaref include Educational Services (49 | 35.2%), Public Administration (27 | 19.4%), Retail Trade (20 | 14.4%), Arts, Entertainment & Recreation (14 | 10.1%), and Health Care & Social Assistance (7 | 5.0%).
Employment Industries by Sex in Shishmaref
The Shishmaref industries that see more men than women are Construction (100.0%), Utilities (100.0%), and Information (100.0%), whereas the industries that tend to have a higher number of women are Professional & Scientific (100.0%), Health Care & Social Assistance (100.0%), and Transportation & Warehousing (66.7%).
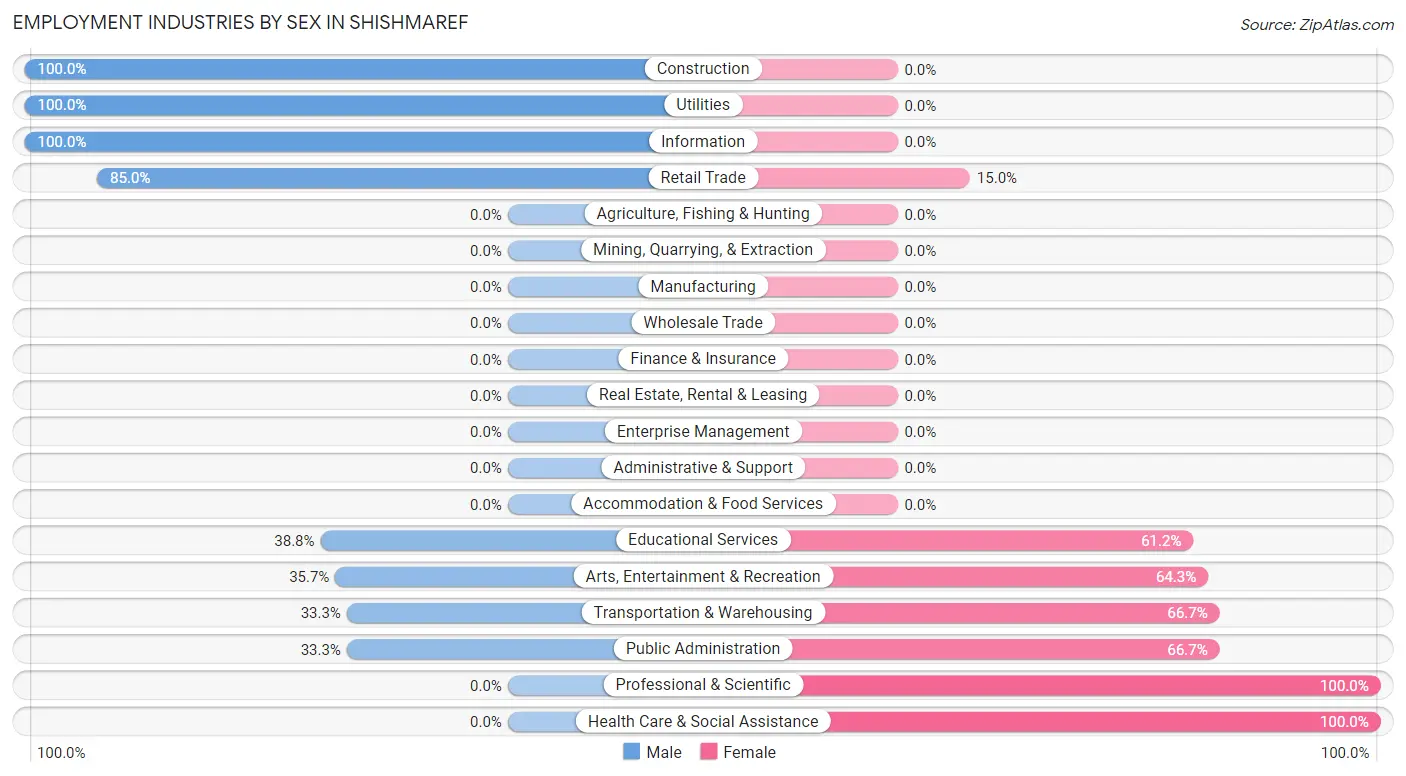
| Industry | Male | Female |
| Agriculture, Fishing & Hunting | 0 (0.0%) | 0 (0.0%) |
| Mining, Quarrying, & Extraction | 0 (0.0%) | 0 (0.0%) |
| Construction | 2 (100.0%) | 0 (0.0%) |
| Manufacturing | 0 (0.0%) | 0 (0.0%) |
| Wholesale Trade | 0 (0.0%) | 0 (0.0%) |
| Retail Trade | 17 (85.0%) | 3 (15.0%) |
| Transportation & Warehousing | 1 (33.3%) | 2 (66.7%) |
| Utilities | 5 (100.0%) | 0 (0.0%) |
| Information | 3 (100.0%) | 0 (0.0%) |
| Finance & Insurance | 0 (0.0%) | 0 (0.0%) |
| Real Estate, Rental & Leasing | 0 (0.0%) | 0 (0.0%) |
| Professional & Scientific | 0 (0.0%) | 2 (100.0%) |
| Enterprise Management | 0 (0.0%) | 0 (0.0%) |
| Administrative & Support | 0 (0.0%) | 0 (0.0%) |
| Educational Services | 19 (38.8%) | 30 (61.2%) |
| Health Care & Social Assistance | 0 (0.0%) | 7 (100.0%) |
| Arts, Entertainment & Recreation | 5 (35.7%) | 9 (64.3%) |
| Accommodation & Food Services | 0 (0.0%) | 0 (0.0%) |
| Public Administration | 9 (33.3%) | 18 (66.7%) |
| Total | 61 (43.9%) | 78 (56.1%) |
Education in Shishmaref
School Enrollment in Shishmaref
The most common levels of schooling among the 197 students in Shishmaref are middle school (61 | 31.0%), elementary school (49 | 24.9%), and high school (41 | 20.8%).
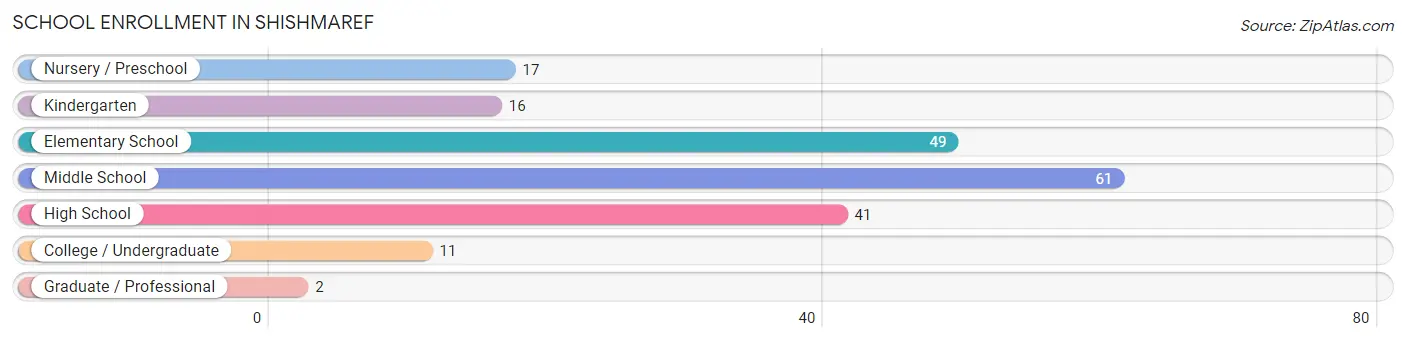
| School Level | # Students | % Students |
| Nursery / Preschool | 17 | 8.6% |
| Kindergarten | 16 | 8.1% |
| Elementary School | 49 | 24.9% |
| Middle School | 61 | 31.0% |
| High School | 41 | 20.8% |
| College / Undergraduate | 11 | 5.6% |
| Graduate / Professional | 2 | 1.0% |
| Total | 197 | 100.0% |
School Enrollment by Age by Funding Source in Shishmaref
Out of a total of 197 students who are enrolled in schools in Shishmaref, 6 (3.0%) attend a private institution, while the remaining 191 (97.0%) are enrolled in public schools. The age group of 35 years and over has the highest likelihood of being enrolled in private schools, with 2 (20.0% in the age bracket) enrolled. Conversely, the age group of 5 to 9 year old has the lowest likelihood of being enrolled in a private school, with 62 (100.0% in the age bracket) attending a public institution.
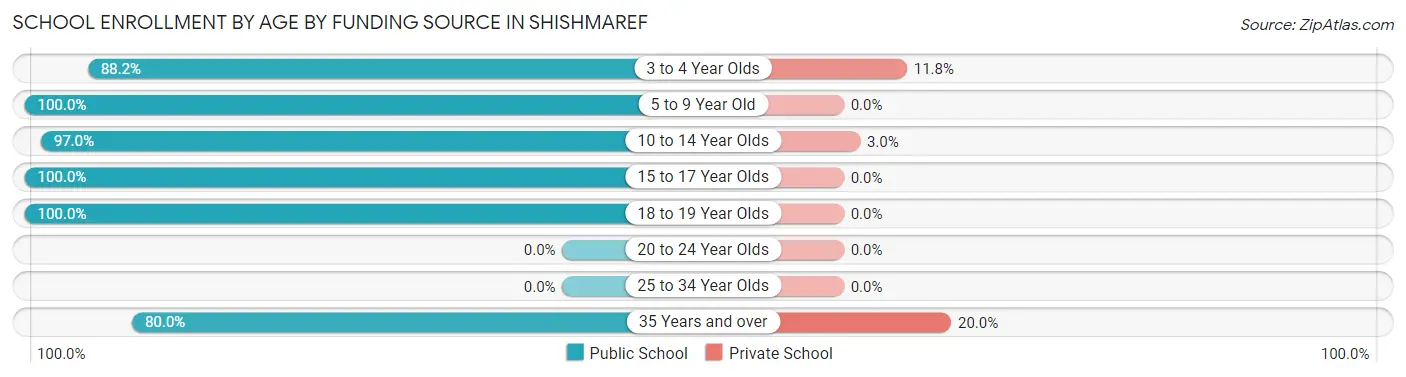
| Age Bracket | Public School | Private School |
| 3 to 4 Year Olds | 15 (88.2%) | 2 (11.8%) |
| 5 to 9 Year Old | 62 (100.0%) | 0 (0.0%) |
| 10 to 14 Year Olds | 64 (97.0%) | 2 (3.0%) |
| 15 to 17 Year Olds | 35 (100.0%) | 0 (0.0%) |
| 18 to 19 Year Olds | 7 (100.0%) | 0 (0.0%) |
| 20 to 24 Year Olds | 0 (0.0%) | 0 (0.0%) |
| 25 to 34 Year Olds | 0 (0.0%) | 0 (0.0%) |
| 35 Years and over | 8 (80.0%) | 2 (20.0%) |
| Total | 191 (97.0%) | 6 (3.0%) |
Educational Attainment by Field of Study in Shishmaref
Education (16 | 55.2%), liberal arts & history (5 | 17.2%), engineering (4 | 13.8%), social sciences (2 | 6.9%), and visual & performing arts (2 | 6.9%) are the most common fields of study among 29 individuals in Shishmaref who have obtained a bachelor's degree or higher.
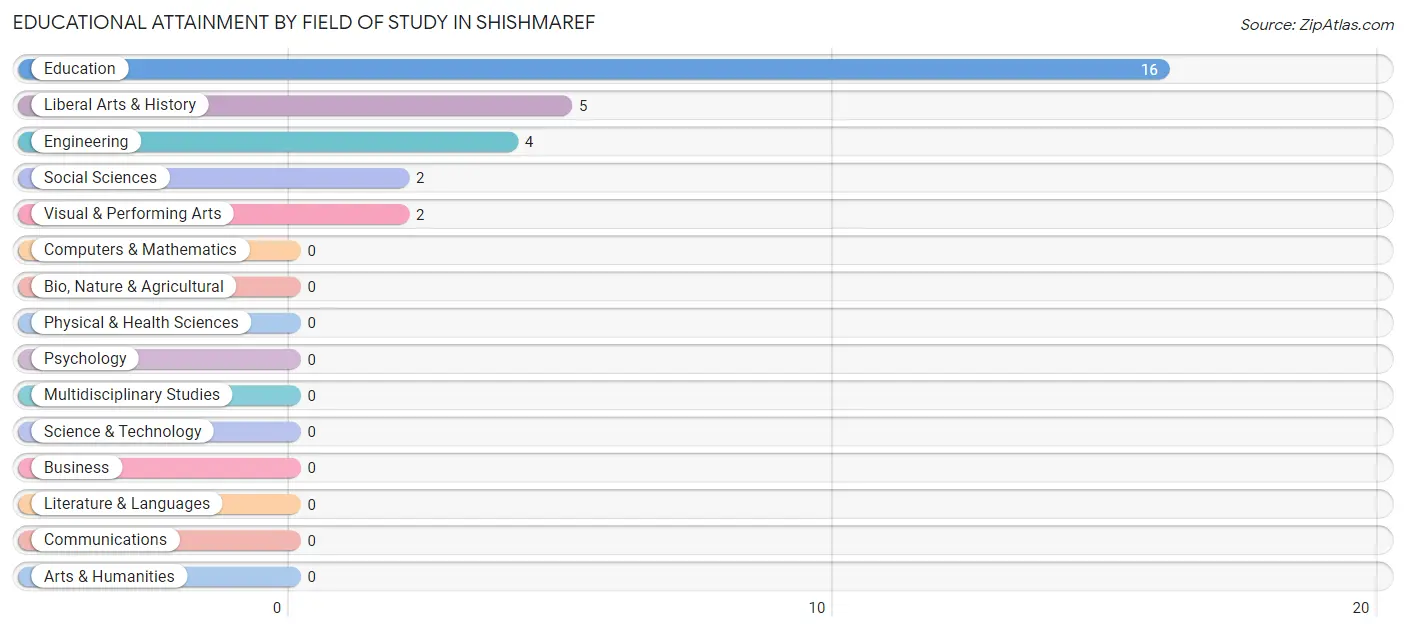
| Field of Study | # Graduates | % Graduates |
| Computers & Mathematics | 0 | 0.0% |
| Bio, Nature & Agricultural | 0 | 0.0% |
| Physical & Health Sciences | 0 | 0.0% |
| Psychology | 0 | 0.0% |
| Social Sciences | 2 | 6.9% |
| Engineering | 4 | 13.8% |
| Multidisciplinary Studies | 0 | 0.0% |
| Science & Technology | 0 | 0.0% |
| Business | 0 | 0.0% |
| Education | 16 | 55.2% |
| Literature & Languages | 0 | 0.0% |
| Liberal Arts & History | 5 | 17.2% |
| Visual & Performing Arts | 2 | 6.9% |
| Communications | 0 | 0.0% |
| Arts & Humanities | 0 | 0.0% |
| Total | 29 | 100.0% |
Transportation & Commute in Shishmaref
Vehicle Availability by Sex in Shishmaref
The most prevalent vehicle ownership categories in Shishmaref are males with no vehicle (47, accounting for 82.5%) and females with no vehicle (72, making up 63.5%).
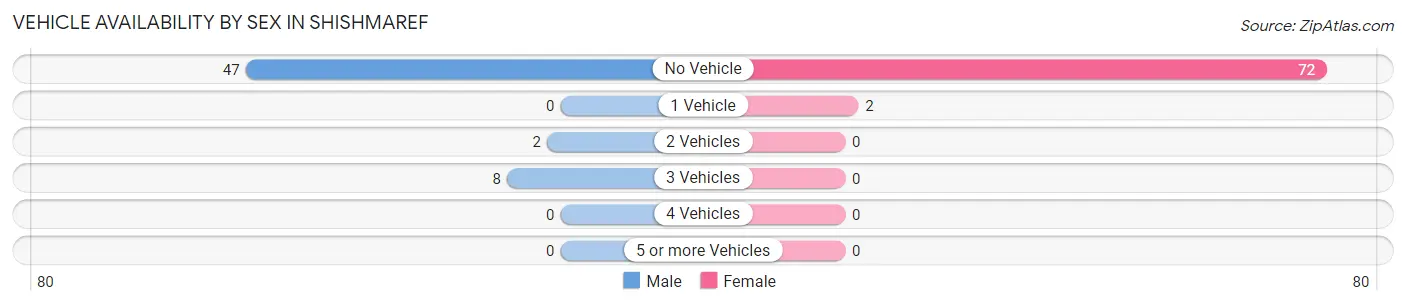
| Vehicles Available | Male | Female |
| No Vehicle | 47 (82.5%) | 72 (97.3%) |
| 1 Vehicle | 0 (0.0%) | 2 (2.7%) |
| 2 Vehicles | 2 (3.5%) | 0 (0.0%) |
| 3 Vehicles | 8 (14.0%) | 0 (0.0%) |
| 4 Vehicles | 0 (0.0%) | 0 (0.0%) |
| 5 or more Vehicles | 0 (0.0%) | 0 (0.0%) |
| Total | 57 (100.0%) | 74 (100.0%) |
Commute Time in Shishmaref
The most frequently occuring commute durations in Shishmaref are less than 5 minutes (79 commuters, 62.2%), 5 to 9 minutes (30 commuters, 23.6%), and 10 to 14 minutes (11 commuters, 8.7%).
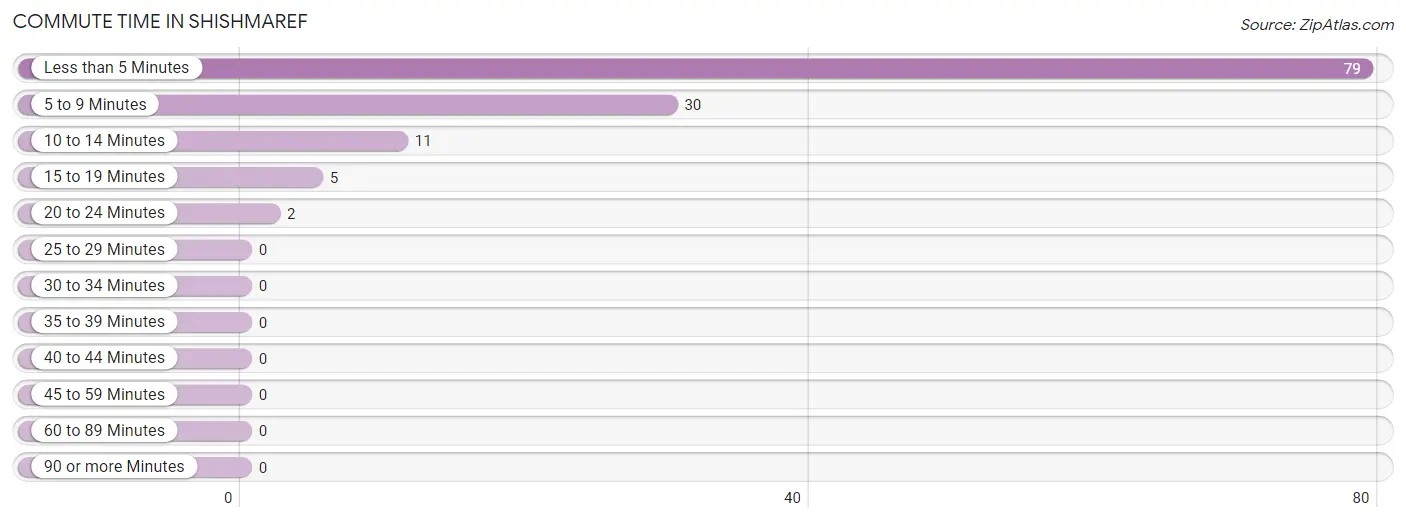
| Commute Time | # Commuters | % Commuters |
| Less than 5 Minutes | 79 | 62.2% |
| 5 to 9 Minutes | 30 | 23.6% |
| 10 to 14 Minutes | 11 | 8.7% |
| 15 to 19 Minutes | 5 | 3.9% |
| 20 to 24 Minutes | 2 | 1.6% |
| 25 to 29 Minutes | 0 | 0.0% |
| 30 to 34 Minutes | 0 | 0.0% |
| 35 to 39 Minutes | 0 | 0.0% |
| 40 to 44 Minutes | 0 | 0.0% |
| 45 to 59 Minutes | 0 | 0.0% |
| 60 to 89 Minutes | 0 | 0.0% |
| 90 or more Minutes | 0 | 0.0% |
Commute Time by Sex in Shishmaref
The most common commute times in Shishmaref are less than 5 minutes (31 commuters, 58.5%) for males and less than 5 minutes (48 commuters, 64.9%) for females.
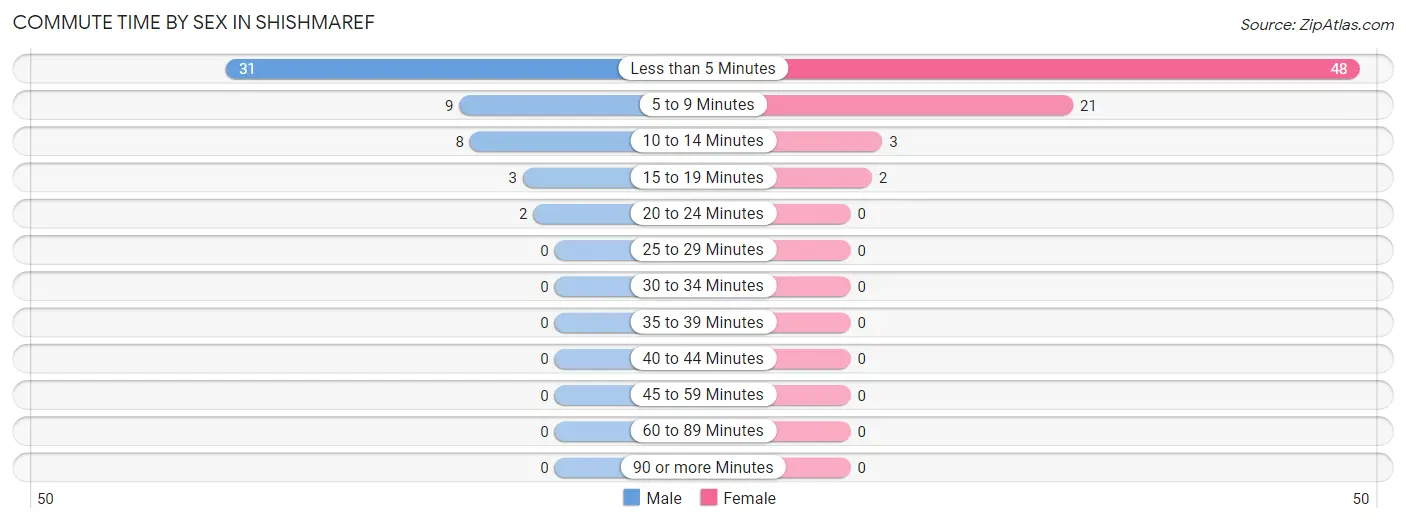
| Commute Time | Male | Female |
| Less than 5 Minutes | 31 (58.5%) | 48 (64.9%) |
| 5 to 9 Minutes | 9 (17.0%) | 21 (28.4%) |
| 10 to 14 Minutes | 8 (15.1%) | 3 (4.1%) |
| 15 to 19 Minutes | 3 (5.7%) | 2 (2.7%) |
| 20 to 24 Minutes | 2 (3.8%) | 0 (0.0%) |
| 25 to 29 Minutes | 0 (0.0%) | 0 (0.0%) |
| 30 to 34 Minutes | 0 (0.0%) | 0 (0.0%) |
| 35 to 39 Minutes | 0 (0.0%) | 0 (0.0%) |
| 40 to 44 Minutes | 0 (0.0%) | 0 (0.0%) |
| 45 to 59 Minutes | 0 (0.0%) | 0 (0.0%) |
| 60 to 89 Minutes | 0 (0.0%) | 0 (0.0%) |
| 90 or more Minutes | 0 (0.0%) | 0 (0.0%) |
Time of Departure to Work by Sex in Shishmaref
The most frequent times of departure to work in Shishmaref are 8:30 AM to 8:59 AM (15, 28.3%) for males and 8:30 AM to 8:59 AM (23, 31.1%) for females.
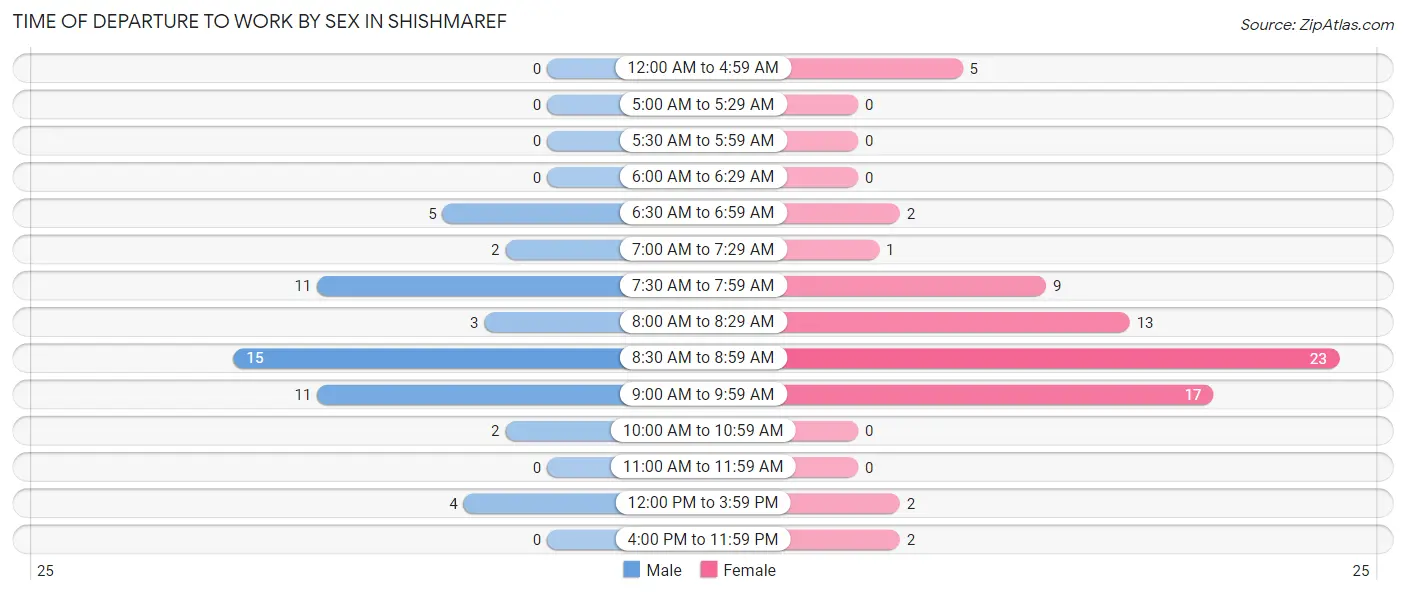
| Time of Departure | Male | Female |
| 12:00 AM to 4:59 AM | 0 (0.0%) | 5 (6.8%) |
| 5:00 AM to 5:29 AM | 0 (0.0%) | 0 (0.0%) |
| 5:30 AM to 5:59 AM | 0 (0.0%) | 0 (0.0%) |
| 6:00 AM to 6:29 AM | 0 (0.0%) | 0 (0.0%) |
| 6:30 AM to 6:59 AM | 5 (9.4%) | 2 (2.7%) |
| 7:00 AM to 7:29 AM | 2 (3.8%) | 1 (1.3%) |
| 7:30 AM to 7:59 AM | 11 (20.7%) | 9 (12.2%) |
| 8:00 AM to 8:29 AM | 3 (5.7%) | 13 (17.6%) |
| 8:30 AM to 8:59 AM | 15 (28.3%) | 23 (31.1%) |
| 9:00 AM to 9:59 AM | 11 (20.7%) | 17 (23.0%) |
| 10:00 AM to 10:59 AM | 2 (3.8%) | 0 (0.0%) |
| 11:00 AM to 11:59 AM | 0 (0.0%) | 0 (0.0%) |
| 12:00 PM to 3:59 PM | 4 (7.5%) | 2 (2.7%) |
| 4:00 PM to 11:59 PM | 0 (0.0%) | 2 (2.7%) |
| Total | 53 (100.0%) | 74 (100.0%) |
Housing Occupancy in Shishmaref
Occupancy by Ownership in Shishmaref
Of the total 150 dwellings in Shishmaref, owner-occupied units account for 109 (72.7%), while renter-occupied units make up 41 (27.3%).
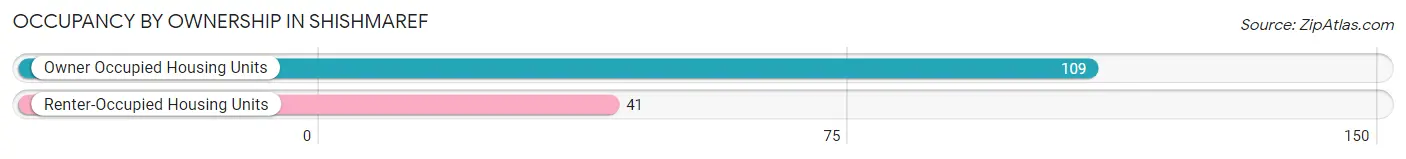
| Occupancy | # Housing Units | % Housing Units |
| Owner Occupied Housing Units | 109 | 72.7% |
| Renter-Occupied Housing Units | 41 | 27.3% |
| Total Occupied Housing Units | 150 | 100.0% |
Occupancy by Household Size in Shishmaref
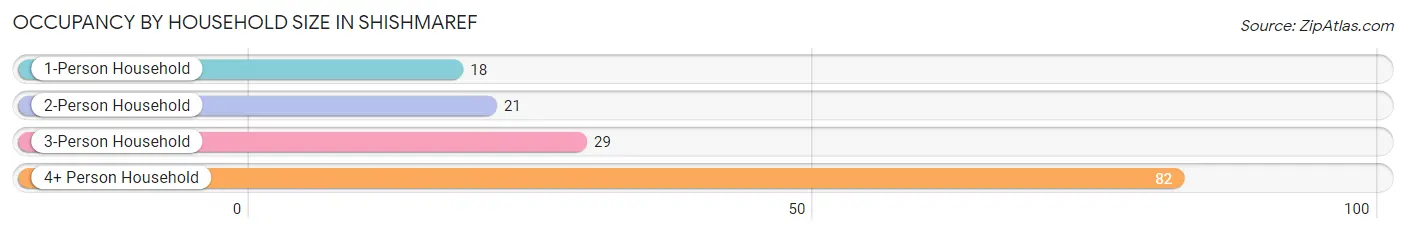
| Household Size | # Housing Units | % Housing Units |
| 1-Person Household | 18 | 12.0% |
| 2-Person Household | 21 | 14.0% |
| 3-Person Household | 29 | 19.3% |
| 4+ Person Household | 82 | 54.7% |
| Total Housing Units | 150 | 100.0% |
Occupancy by Ownership by Household Size in Shishmaref
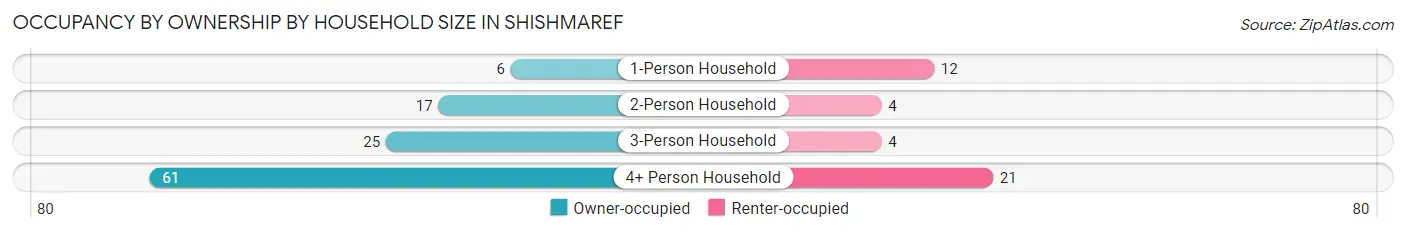
| Household Size | Owner-occupied | Renter-occupied |
| 1-Person Household | 6 (33.3%) | 12 (66.7%) |
| 2-Person Household | 17 (80.9%) | 4 (19.1%) |
| 3-Person Household | 25 (86.2%) | 4 (13.8%) |
| 4+ Person Household | 61 (74.4%) | 21 (25.6%) |
| Total Housing Units | 109 (72.7%) | 41 (27.3%) |
Occupancy by Educational Attainment in Shishmaref
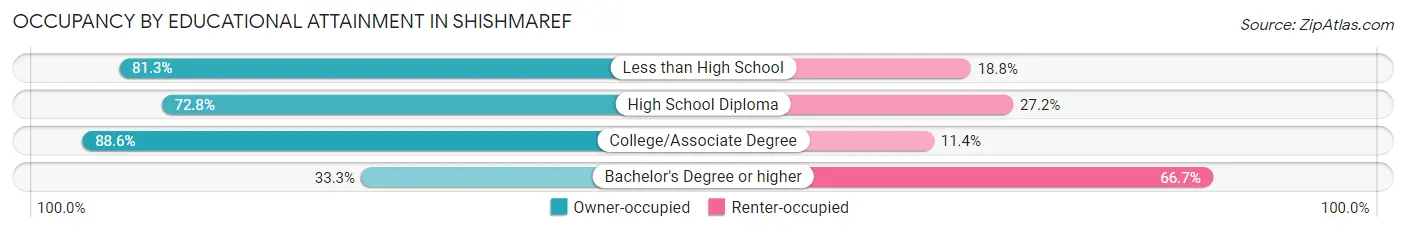
| Household Size | Owner-occupied | Renter-occupied |
| Less than High School | 13 (81.2%) | 3 (18.8%) |
| High School Diploma | 59 (72.8%) | 22 (27.2%) |
| College/Associate Degree | 31 (88.6%) | 4 (11.4%) |
| Bachelor's Degree or higher | 6 (33.3%) | 12 (66.7%) |
Occupancy by Age of Householder in Shishmaref
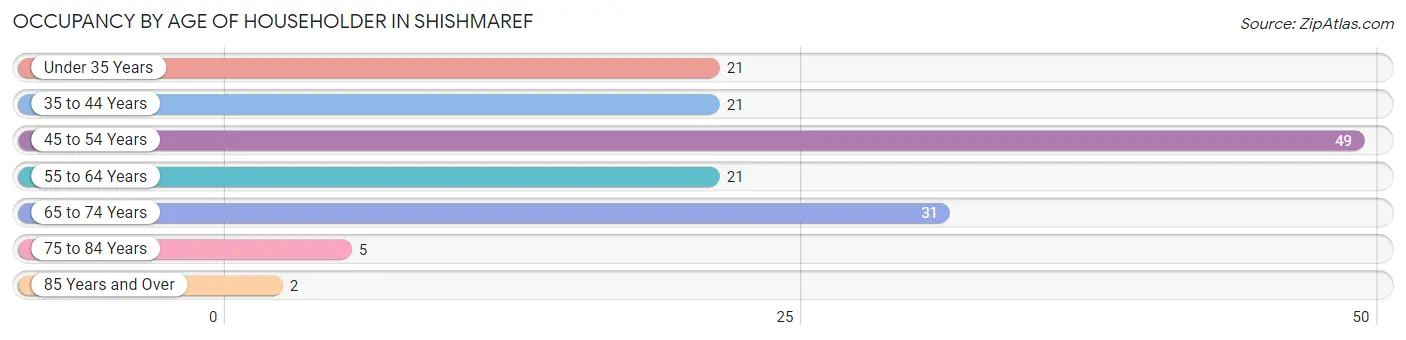
| Age Bracket | # Households | % Households |
| Under 35 Years | 21 | 14.0% |
| 35 to 44 Years | 21 | 14.0% |
| 45 to 54 Years | 49 | 32.7% |
| 55 to 64 Years | 21 | 14.0% |
| 65 to 74 Years | 31 | 20.7% |
| 75 to 84 Years | 5 | 3.3% |
| 85 Years and Over | 2 | 1.3% |
| Total | 150 | 100.0% |
Housing Finances in Shishmaref
Median Income by Occupancy in Shishmaref
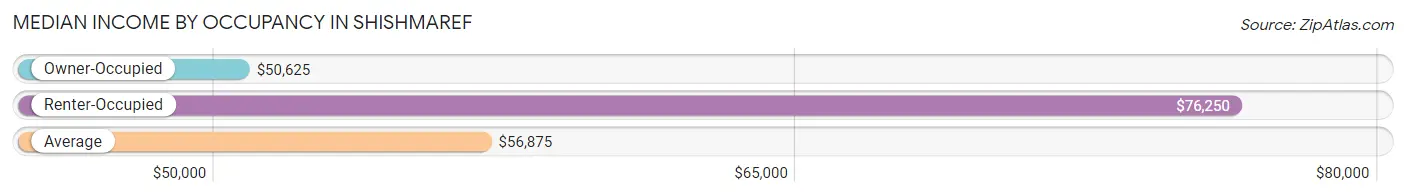
| Occupancy Type | # Households | Median Income |
| Owner-Occupied | 109 (72.7%) | $50,625 |
| Renter-Occupied | 41 (27.3%) | $76,250 |
| Average | 150 (100.0%) | $56,875 |
Occupancy by Householder Income Bracket in Shishmaref
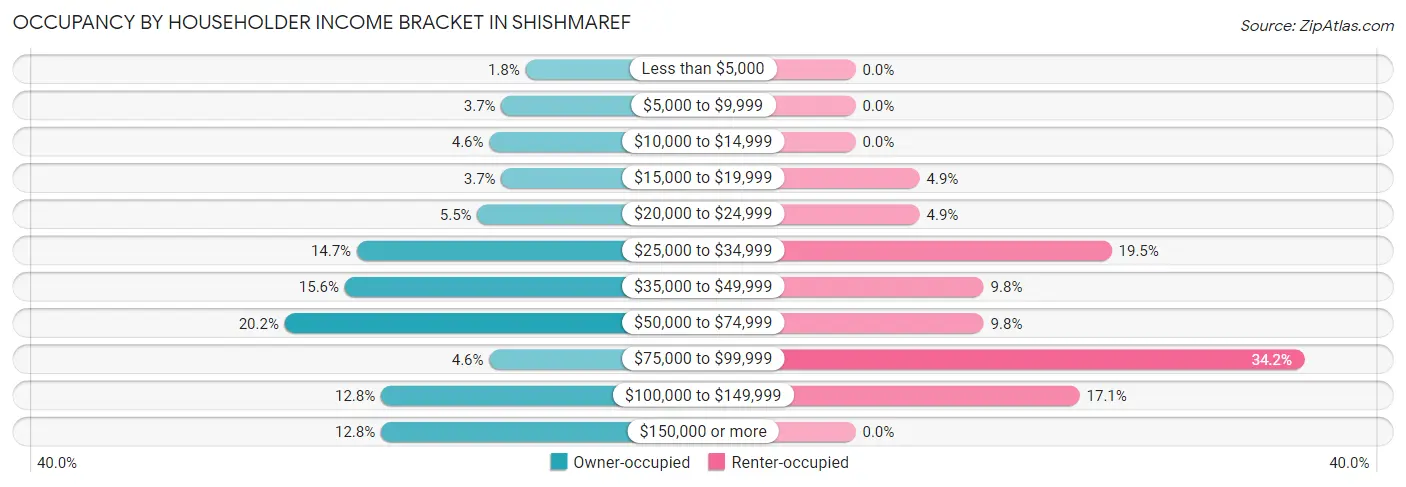
| Income Bracket | Owner-occupied | Renter-occupied |
| Less than $5,000 | 2 (1.8%) | 0 (0.0%) |
| $5,000 to $9,999 | 4 (3.7%) | 0 (0.0%) |
| $10,000 to $14,999 | 5 (4.6%) | 0 (0.0%) |
| $15,000 to $19,999 | 4 (3.7%) | 2 (4.9%) |
| $20,000 to $24,999 | 6 (5.5%) | 2 (4.9%) |
| $25,000 to $34,999 | 16 (14.7%) | 8 (19.5%) |
| $35,000 to $49,999 | 17 (15.6%) | 4 (9.8%) |
| $50,000 to $74,999 | 22 (20.2%) | 4 (9.8%) |
| $75,000 to $99,999 | 5 (4.6%) | 14 (34.2%) |
| $100,000 to $149,999 | 14 (12.8%) | 7 (17.1%) |
| $150,000 or more | 14 (12.8%) | 0 (0.0%) |
| Total | 109 (100.0%) | 41 (100.0%) |
Monthly Housing Cost Tiers in Shishmaref
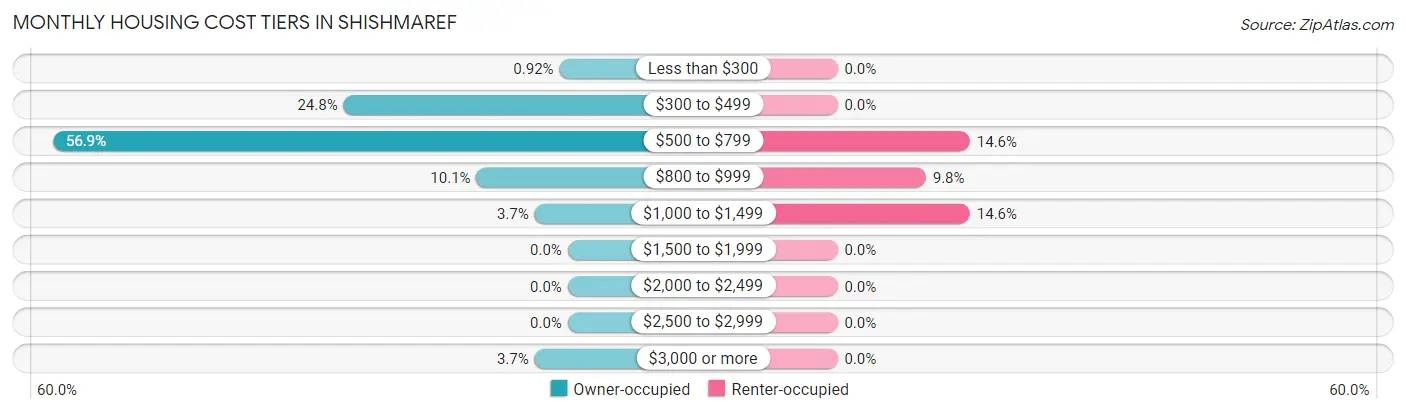
| Monthly Cost | Owner-occupied | Renter-occupied |
| Less than $300 | 1 (0.9%) | 0 (0.0%) |
| $300 to $499 | 27 (24.8%) | 0 (0.0%) |
| $500 to $799 | 62 (56.9%) | 6 (14.6%) |
| $800 to $999 | 11 (10.1%) | 4 (9.8%) |
| $1,000 to $1,499 | 4 (3.7%) | 6 (14.6%) |
| $1,500 to $1,999 | 0 (0.0%) | 0 (0.0%) |
| $2,000 to $2,499 | 0 (0.0%) | 0 (0.0%) |
| $2,500 to $2,999 | 0 (0.0%) | 0 (0.0%) |
| $3,000 or more | 4 (3.7%) | 0 (0.0%) |
| Total | 109 (100.0%) | 41 (100.0%) |
Physical Housing Characteristics in Shishmaref
Housing Structures in Shishmaref
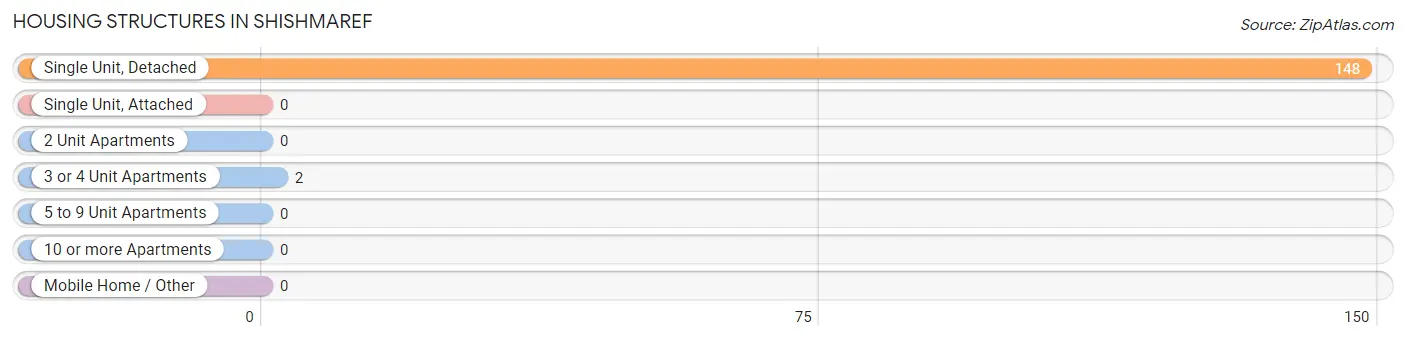
| Structure Type | # Housing Units | % Housing Units |
| Single Unit, Detached | 148 | 98.7% |
| Single Unit, Attached | 0 | 0.0% |
| 2 Unit Apartments | 0 | 0.0% |
| 3 or 4 Unit Apartments | 2 | 1.3% |
| 5 to 9 Unit Apartments | 0 | 0.0% |
| 10 or more Apartments | 0 | 0.0% |
| Mobile Home / Other | 0 | 0.0% |
| Total | 150 | 100.0% |
Housing Structures by Occupancy in Shishmaref
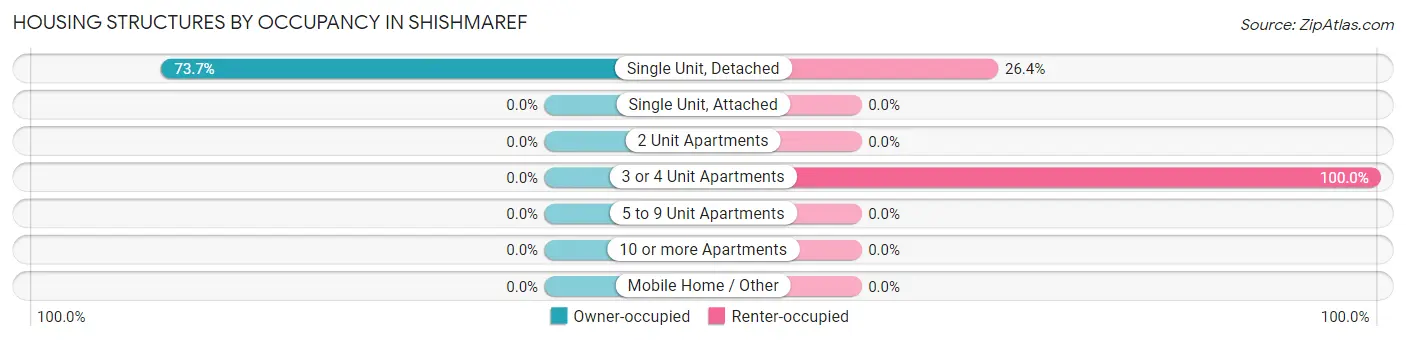
| Structure Type | Owner-occupied | Renter-occupied |
| Single Unit, Detached | 109 (73.7%) | 39 (26.4%) |
| Single Unit, Attached | 0 (0.0%) | 0 (0.0%) |
| 2 Unit Apartments | 0 (0.0%) | 0 (0.0%) |
| 3 or 4 Unit Apartments | 0 (0.0%) | 2 (100.0%) |
| 5 to 9 Unit Apartments | 0 (0.0%) | 0 (0.0%) |
| 10 or more Apartments | 0 (0.0%) | 0 (0.0%) |
| Mobile Home / Other | 0 (0.0%) | 0 (0.0%) |
| Total | 109 (72.7%) | 41 (27.3%) |
Housing Structures by Number of Rooms in Shishmaref
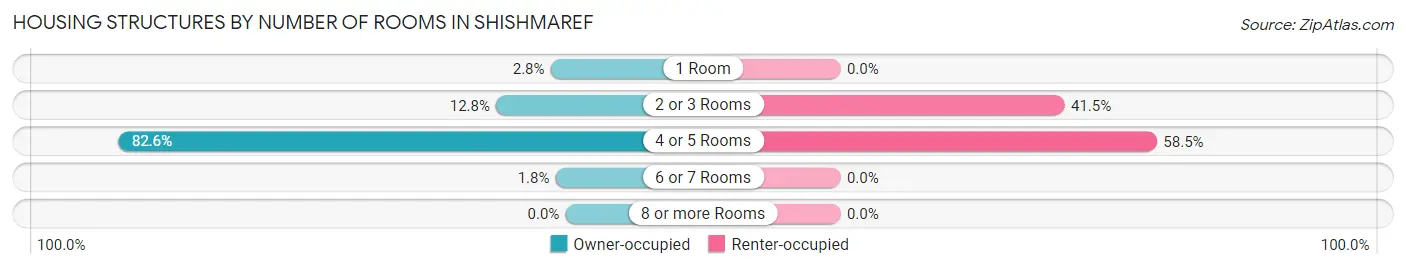
| Number of Rooms | Owner-occupied | Renter-occupied |
| 1 Room | 3 (2.8%) | 0 (0.0%) |
| 2 or 3 Rooms | 14 (12.8%) | 17 (41.5%) |
| 4 or 5 Rooms | 90 (82.6%) | 24 (58.5%) |
| 6 or 7 Rooms | 2 (1.8%) | 0 (0.0%) |
| 8 or more Rooms | 0 (0.0%) | 0 (0.0%) |
| Total | 109 (100.0%) | 41 (100.0%) |
Housing Structure by Heating Type in Shishmaref
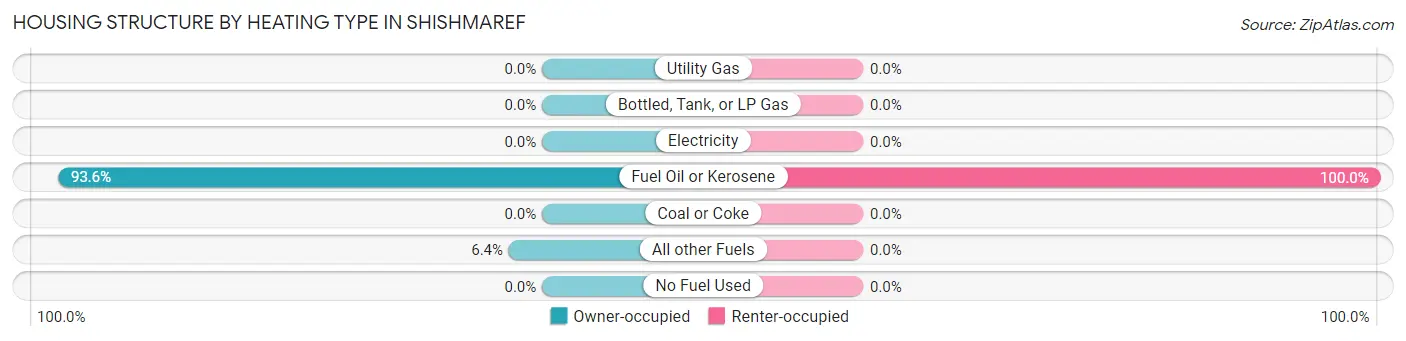
| Heating Type | Owner-occupied | Renter-occupied |
| Utility Gas | 0 (0.0%) | 0 (0.0%) |
| Bottled, Tank, or LP Gas | 0 (0.0%) | 0 (0.0%) |
| Electricity | 0 (0.0%) | 0 (0.0%) |
| Fuel Oil or Kerosene | 102 (93.6%) | 41 (100.0%) |
| Coal or Coke | 0 (0.0%) | 0 (0.0%) |
| All other Fuels | 7 (6.4%) | 0 (0.0%) |
| No Fuel Used | 0 (0.0%) | 0 (0.0%) |
| Total | 109 (100.0%) | 41 (100.0%) |
Household Vehicle Usage in Shishmaref
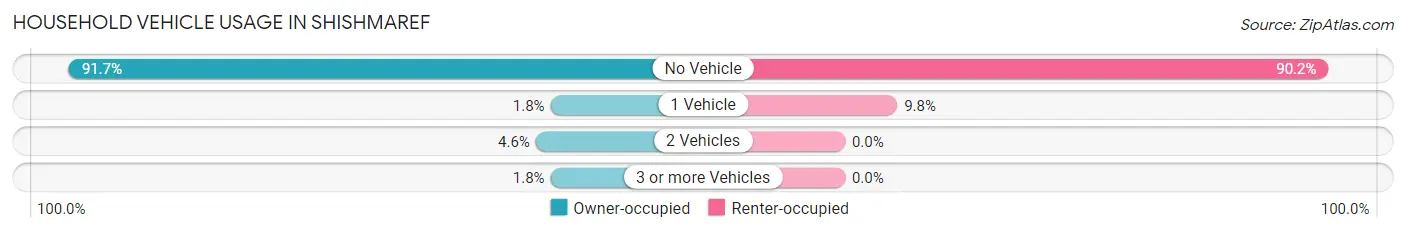
| Vehicles per Household | Owner-occupied | Renter-occupied |
| No Vehicle | 100 (91.7%) | 37 (90.2%) |
| 1 Vehicle | 2 (1.8%) | 4 (9.8%) |
| 2 Vehicles | 5 (4.6%) | 0 (0.0%) |
| 3 or more Vehicles | 2 (1.8%) | 0 (0.0%) |
| Total | 109 (100.0%) | 41 (100.0%) |
Real Estate & Mortgages in Shishmaref
Real Estate and Mortgage Overview in Shishmaref
| Characteristic | Without Mortgage | With Mortgage |
| Housing Units | 85 | 24 |
| Median Property Value | $110,600 | $233,300 |
| Median Household Income | $49,688 | $4 |
| Monthly Housing Costs | $547 | $4 |
| Real Estate Taxes | - | - |
Property Value by Mortgage Status in Shishmaref
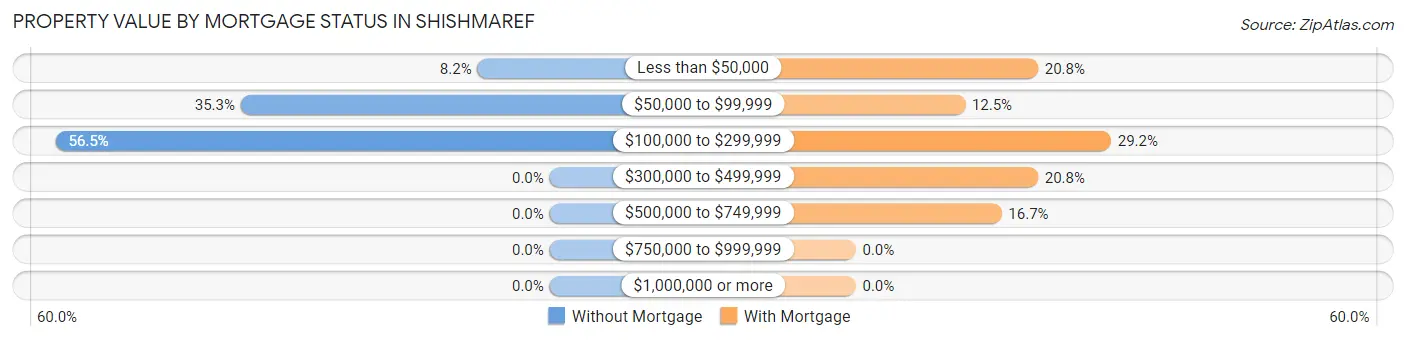
| Property Value | Without Mortgage | With Mortgage |
| Less than $50,000 | 7 (8.2%) | 5 (20.8%) |
| $50,000 to $99,999 | 30 (35.3%) | 3 (12.5%) |
| $100,000 to $299,999 | 48 (56.5%) | 7 (29.2%) |
| $300,000 to $499,999 | 0 (0.0%) | 5 (20.8%) |
| $500,000 to $749,999 | 0 (0.0%) | 4 (16.7%) |
| $750,000 to $999,999 | 0 (0.0%) | 0 (0.0%) |
| $1,000,000 or more | 0 (0.0%) | 0 (0.0%) |
| Total | 85 (100.0%) | 24 (100.0%) |
Household Income by Mortgage Status in Shishmaref
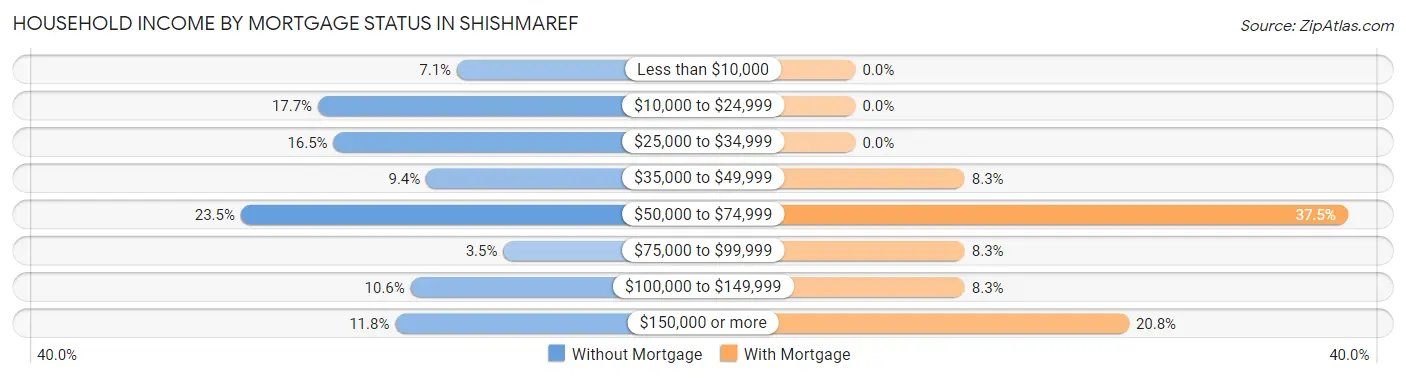
| Household Income | Without Mortgage | With Mortgage |
| Less than $10,000 | 6 (7.1%) | 0 (0.0%) |
| $10,000 to $24,999 | 15 (17.6%) | 0 (0.0%) |
| $25,000 to $34,999 | 14 (16.5%) | 0 (0.0%) |
| $35,000 to $49,999 | 8 (9.4%) | 2 (8.3%) |
| $50,000 to $74,999 | 20 (23.5%) | 9 (37.5%) |
| $75,000 to $99,999 | 3 (3.5%) | 2 (8.3%) |
| $100,000 to $149,999 | 9 (10.6%) | 2 (8.3%) |
| $150,000 or more | 10 (11.8%) | 5 (20.8%) |
| Total | 85 (100.0%) | 24 (100.0%) |
Property Value to Household Income Ratio in Shishmaref
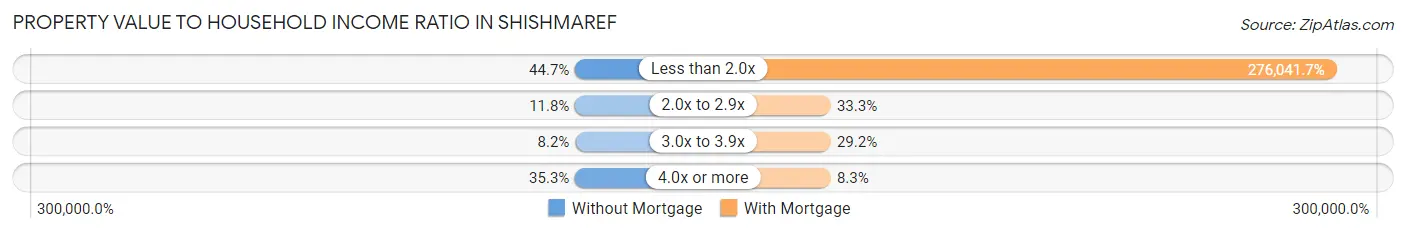
| Value-to-Income Ratio | Without Mortgage | With Mortgage |
| Less than 2.0x | 38 (44.7%) | 66,250 (276,041.7%) |
| 2.0x to 2.9x | 10 (11.8%) | 8 (33.3%) |
| 3.0x to 3.9x | 7 (8.2%) | 7 (29.2%) |
| 4.0x or more | 30 (35.3%) | 2 (8.3%) |
| Total | 85 (100.0%) | 24 (100.0%) |
Real Estate Taxes by Mortgage Status in Shishmaref
| Property Taxes | Without Mortgage | With Mortgage |
| Less than $800 | 0 (0.0%) | 0 (0.0%) |
| $800 to $1,499 | 0 (0.0%) | 0 (0.0%) |
| $800 to $1,499 | 0 (0.0%) | 0 (0.0%) |
| Total | 85 (100.0%) | 24 (100.0%) |
Health & Disability in Shishmaref
Health Insurance Coverage by Age in Shishmaref
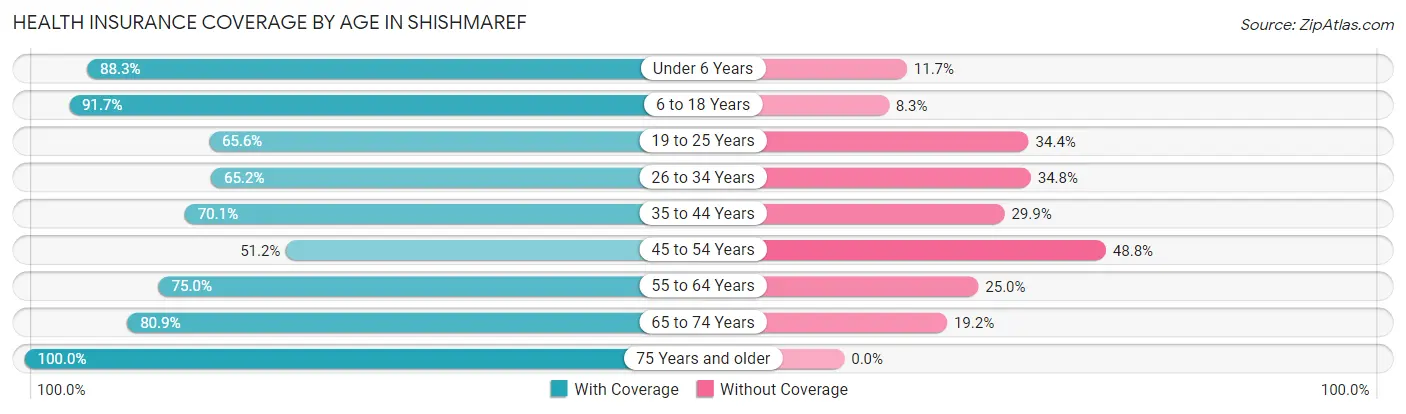
| Age Bracket | With Coverage | Without Coverage |
| Under 6 Years | 53 (88.3%) | 7 (11.7%) |
| 6 to 18 Years | 144 (91.7%) | 13 (8.3%) |
| 19 to 25 Years | 21 (65.6%) | 11 (34.4%) |
| 26 to 34 Years | 45 (65.2%) | 24 (34.8%) |
| 35 to 44 Years | 54 (70.1%) | 23 (29.9%) |
| 45 to 54 Years | 42 (51.2%) | 40 (48.8%) |
| 55 to 64 Years | 27 (75.0%) | 9 (25.0%) |
| 65 to 74 Years | 38 (80.8%) | 9 (19.2%) |
| 75 Years and older | 8 (100.0%) | 0 (0.0%) |
| Total | 432 (76.1%) | 136 (23.9%) |
Health Insurance Coverage by Citizenship Status in Shishmaref
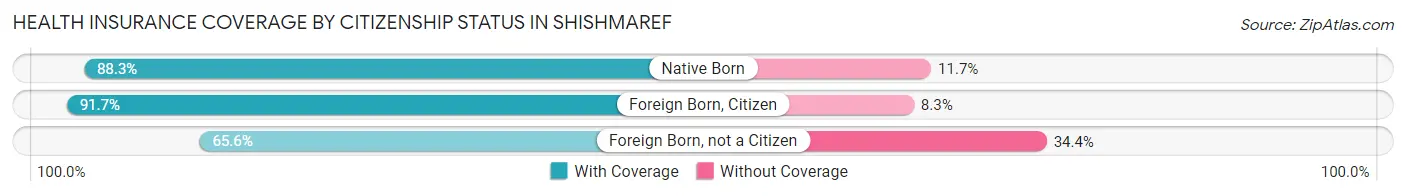
| Citizenship Status | With Coverage | Without Coverage |
| Native Born | 53 (88.3%) | 7 (11.7%) |
| Foreign Born, Citizen | 144 (91.7%) | 13 (8.3%) |
| Foreign Born, not a Citizen | 21 (65.6%) | 11 (34.4%) |
Health Insurance Coverage by Household Income in Shishmaref
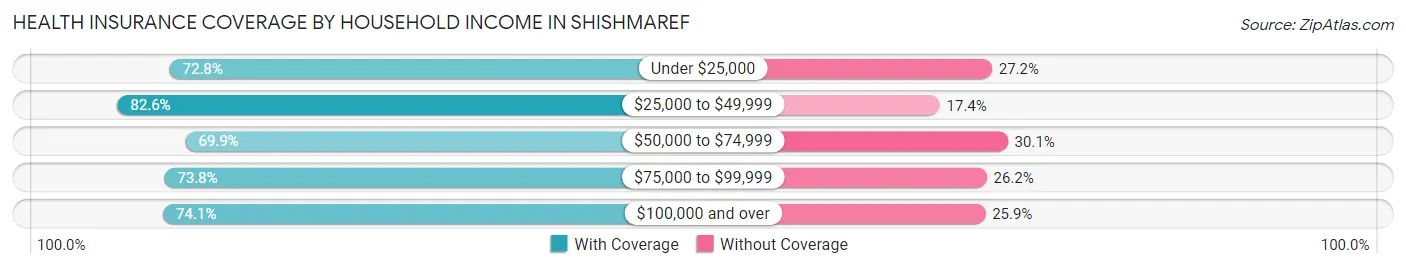
| Household Income | With Coverage | Without Coverage |
| Under $25,000 | 67 (72.8%) | 25 (27.2%) |
| $25,000 to $49,999 | 152 (82.6%) | 32 (17.4%) |
| $50,000 to $74,999 | 51 (69.9%) | 22 (30.1%) |
| $75,000 to $99,999 | 62 (73.8%) | 22 (26.2%) |
| $100,000 and over | 100 (74.1%) | 35 (25.9%) |
Public vs Private Health Insurance Coverage by Age in Shishmaref
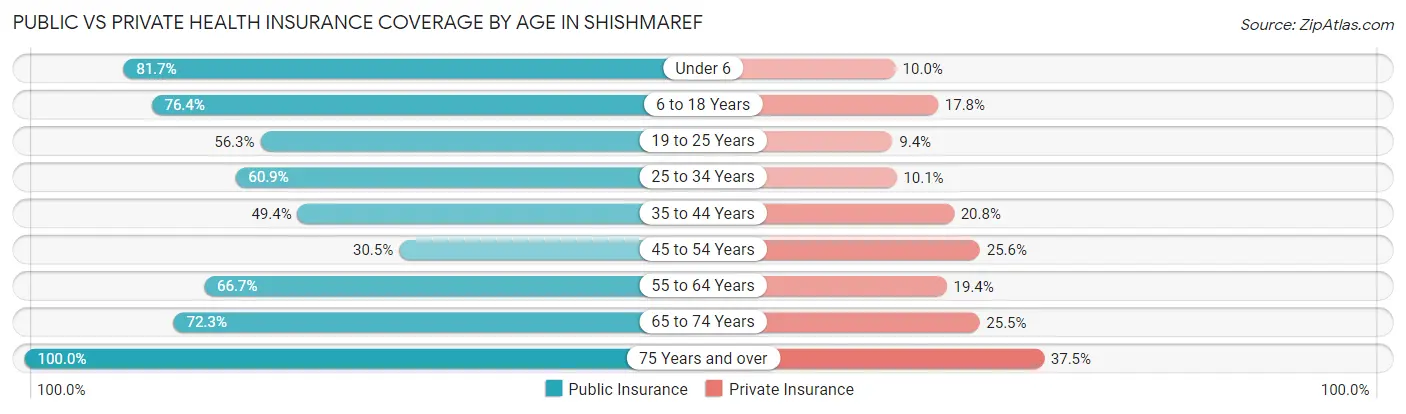
| Age Bracket | Public Insurance | Private Insurance |
| Under 6 | 49 (81.7%) | 6 (10.0%) |
| 6 to 18 Years | 120 (76.4%) | 28 (17.8%) |
| 19 to 25 Years | 18 (56.2%) | 3 (9.4%) |
| 25 to 34 Years | 42 (60.9%) | 7 (10.1%) |
| 35 to 44 Years | 38 (49.3%) | 16 (20.8%) |
| 45 to 54 Years | 25 (30.5%) | 21 (25.6%) |
| 55 to 64 Years | 24 (66.7%) | 7 (19.4%) |
| 65 to 74 Years | 34 (72.3%) | 12 (25.5%) |
| 75 Years and over | 8 (100.0%) | 3 (37.5%) |
| Total | 358 (63.0%) | 103 (18.1%) |
Disability Status by Sex by Age in Shishmaref
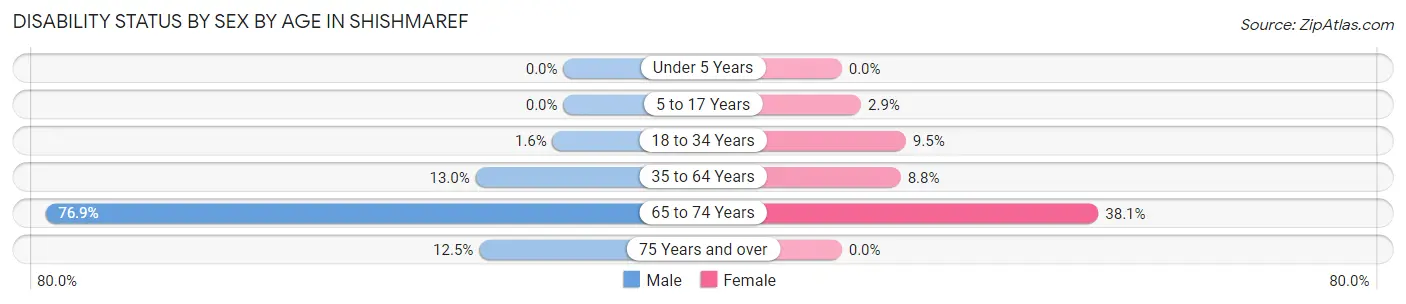
| Age Bracket | Male | Female |
| Under 5 Years | 0 (0.0%) | 0 (0.0%) |
| 5 to 17 Years | 0 (0.0%) | 2 (2.9%) |
| 18 to 34 Years | 1 (1.6%) | 4 (9.5%) |
| 35 to 64 Years | 15 (13.0%) | 7 (8.7%) |
| 65 to 74 Years | 20 (76.9%) | 8 (38.1%) |
| 75 Years and over | 1 (12.5%) | 0 (0.0%) |
Disability Class by Sex by Age in Shishmaref
Disability Class: Hearing Difficulty
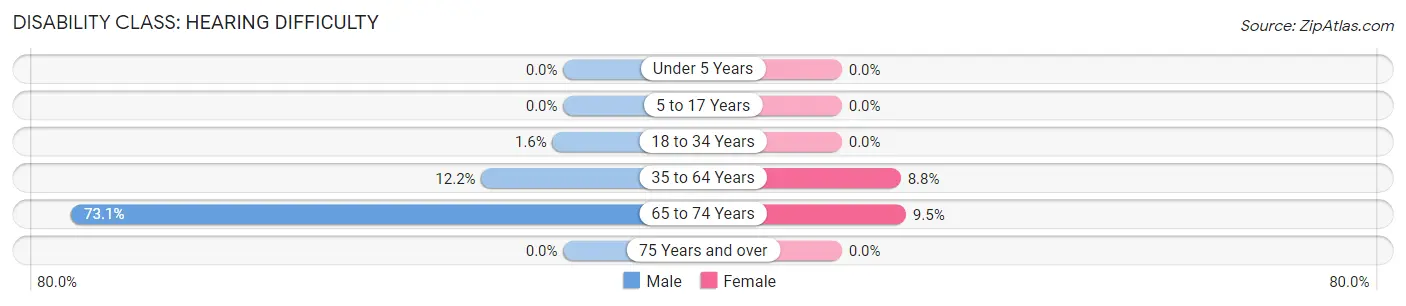
| Age Bracket | Male | Female |
| Under 5 Years | 0 (0.0%) | 0 (0.0%) |
| 5 to 17 Years | 0 (0.0%) | 0 (0.0%) |
| 18 to 34 Years | 1 (1.6%) | 0 (0.0%) |
| 35 to 64 Years | 14 (12.2%) | 7 (8.7%) |
| 65 to 74 Years | 19 (73.1%) | 2 (9.5%) |
| 75 Years and over | 0 (0.0%) | 0 (0.0%) |
Disability Class: Vision Difficulty
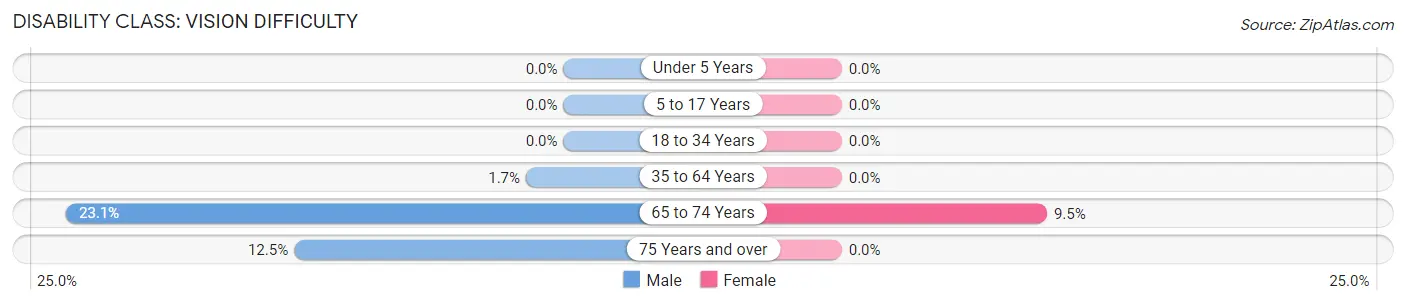
| Age Bracket | Male | Female |
| Under 5 Years | 0 (0.0%) | 0 (0.0%) |
| 5 to 17 Years | 0 (0.0%) | 0 (0.0%) |
| 18 to 34 Years | 0 (0.0%) | 0 (0.0%) |
| 35 to 64 Years | 2 (1.7%) | 0 (0.0%) |
| 65 to 74 Years | 6 (23.1%) | 2 (9.5%) |
| 75 Years and over | 1 (12.5%) | 0 (0.0%) |
Disability Class: Cognitive Difficulty
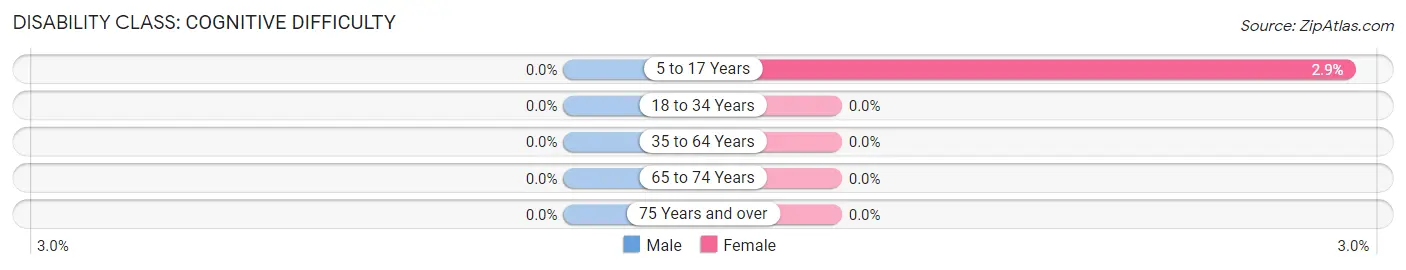
| Age Bracket | Male | Female |
| 5 to 17 Years | 0 (0.0%) | 2 (2.9%) |
| 18 to 34 Years | 0 (0.0%) | 0 (0.0%) |
| 35 to 64 Years | 0 (0.0%) | 0 (0.0%) |
| 65 to 74 Years | 0 (0.0%) | 0 (0.0%) |
| 75 Years and over | 0 (0.0%) | 0 (0.0%) |
Disability Class: Ambulatory Difficulty
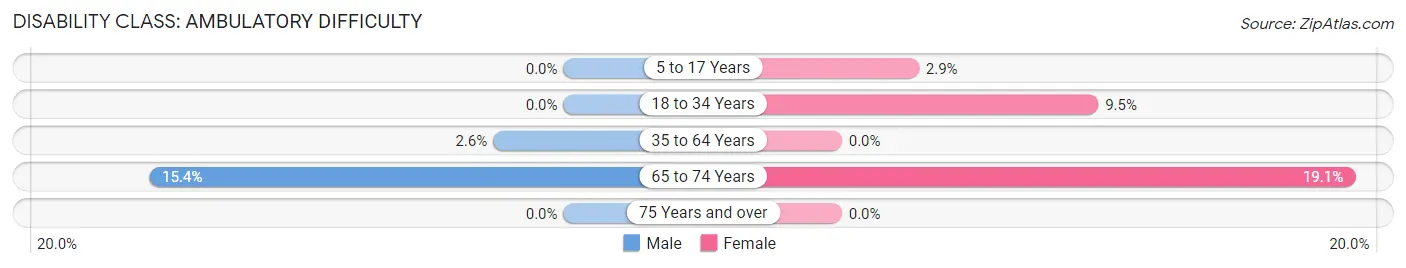
| Age Bracket | Male | Female |
| 5 to 17 Years | 0 (0.0%) | 2 (2.9%) |
| 18 to 34 Years | 0 (0.0%) | 4 (9.5%) |
| 35 to 64 Years | 3 (2.6%) | 0 (0.0%) |
| 65 to 74 Years | 4 (15.4%) | 4 (19.1%) |
| 75 Years and over | 0 (0.0%) | 0 (0.0%) |
Disability Class: Self-Care Difficulty
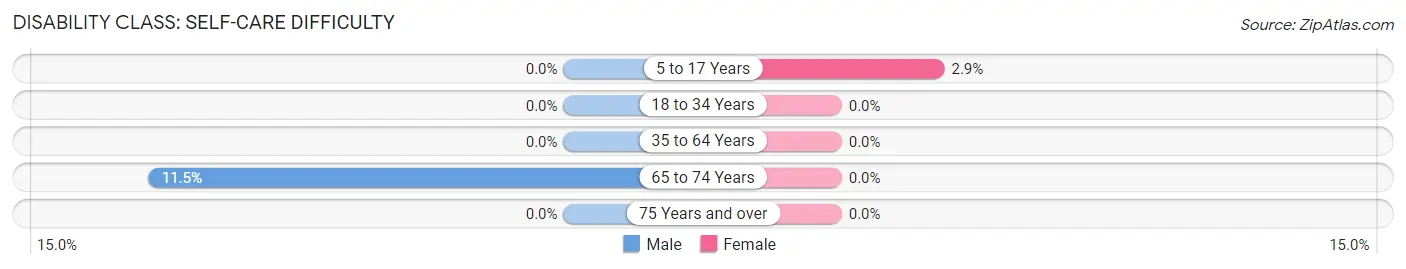
| Age Bracket | Male | Female |
| 5 to 17 Years | 0 (0.0%) | 2 (2.9%) |
| 18 to 34 Years | 0 (0.0%) | 0 (0.0%) |
| 35 to 64 Years | 0 (0.0%) | 0 (0.0%) |
| 65 to 74 Years | 3 (11.5%) | 0 (0.0%) |
| 75 Years and over | 0 (0.0%) | 0 (0.0%) |
Technology Access in Shishmaref
Computing Device Access in Shishmaref
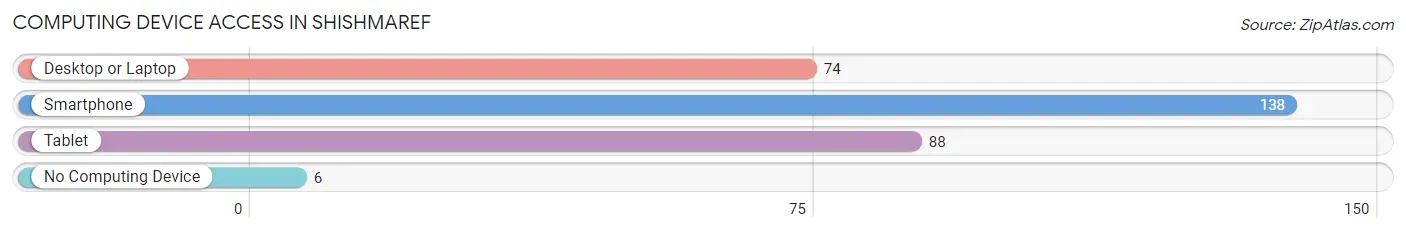
| Device Type | # Households | % Households |
| Desktop or Laptop | 74 | 49.3% |
| Smartphone | 138 | 92.0% |
| Tablet | 88 | 58.7% |
| No Computing Device | 6 | 4.0% |
| Total | 150 | 100.0% |
Internet Access in Shishmaref
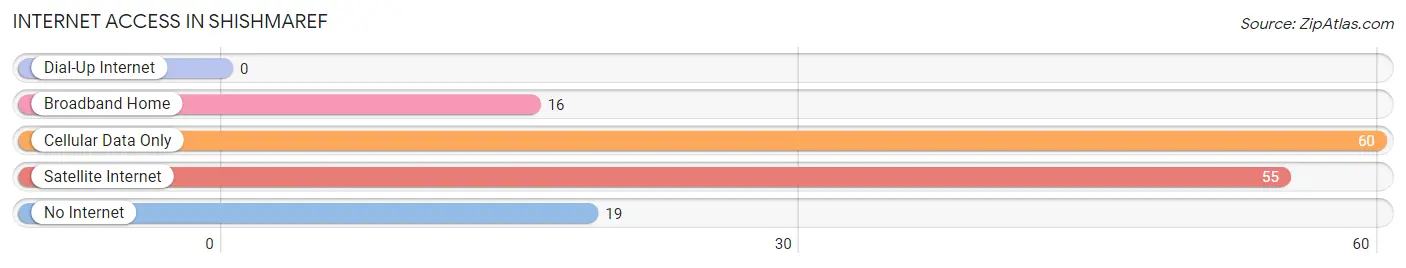
| Internet Type | # Households | % Households |
| Dial-Up Internet | 0 | 0.0% |
| Broadband Home | 16 | 10.7% |
| Cellular Data Only | 60 | 40.0% |
| Satellite Internet | 55 | 36.7% |
| No Internet | 19 | 12.7% |
| Total | 150 | 100.0% |
Shishmaref Summary
Shishmaref is a small Inupiat Eskimo village located on Sarichef Island in the Chukchi Sea, off the coast of Alaska. It is the northernmost community in the United States and is part of the Northwest Arctic Borough. The population of Shishmaref was 563 as of the 2010 census.
History
Shishmaref has been inhabited by the Inupiat people for centuries. The name Shishmaref is derived from the Inupiat word “shishmari” which means “edge of the sea.” The village was first recorded by Russian explorers in the late 1700s. In 1867, the United States purchased Alaska from Russia and Shishmaref became part of the United States.
In the early 1900s, Shishmaref was a traditional fishing and hunting village. The people of Shishmaref relied on the sea for their livelihood and the abundance of fish, seals, and whales provided them with food and clothing. In the 1950s, the U.S. Army Corps of Engineers built a sea wall to protect the village from storms and erosion.
Geography
Shishmaref is located on Sarichef Island, which is part of the Seward Peninsula. The island is approximately 5 miles long and 1 mile wide. It is surrounded by the Chukchi Sea and is connected to the mainland by a causeway. The terrain of the island is mostly tundra and is covered with low shrubs and grasses.
The climate of Shishmaref is subarctic and is characterized by long, cold winters and short, cool summers. The average temperature in January is -14°F and the average temperature in July is 54°F. The average annual precipitation is 11 inches.
Economy
The economy of Shishmaref is largely based on subsistence fishing and hunting. The people of Shishmaref rely on the sea for their livelihood and the abundance of fish, seals, and whales provide them with food and clothing. The village also has a small commercial fishing industry.
The village also receives income from tourism. Visitors come to Shishmaref to experience the traditional Inupiat culture and to observe the wildlife in the area. The village also receives income from the sale of arts and crafts.
Demographics
As of the 2010 census, the population of Shishmaref was 563. The population is predominantly Inupiat, with a small number of non-Native residents. The median age of the population is 33.7 years and the median household income is $41,250.
The majority of the population (90%) speaks English as their primary language. The remaining 10% speak Inupiaq, the traditional language of the Inupiat people. The majority of the population (90%) is Christian, with the remaining 10% following traditional Inupiat beliefs.
Conclusion
Shishmaref is a small Inupiat Eskimo village located on Sarichef Island in the Chukchi Sea, off the coast of Alaska. It is the northernmost community in the United States and is part of the Northwest Arctic Borough. The population of Shishmaref is predominantly Inupiat and the economy is largely based on subsistence fishing and hunting. The village also receives income from tourism and the sale of arts and crafts. Shishmaref is a unique and vibrant community that is deeply rooted in its traditional culture and way of life.
Common Questions
What is Per Capita Income in Shishmaref?
Per Capita income in Shishmaref is $17,896.
What is the Median Family Income in Shishmaref?
Median Family Income in Shishmaref is $49,722.
What is the Median Household income in Shishmaref?
Median Household Income in Shishmaref is $56,875.
What is Income or Wage Gap in Shishmaref?
Income or Wage Gap in Shishmaref is 23.6%.
Women in Shishmaref earn 76.4 cents for every dollar earned by a man.
What is Family Income Deficit in Shishmaref?
Family Income Deficit in Shishmaref is $12,114.
Families that are below poverty line in Shishmaref earn $12,114 less on average than the poverty threshold level.
What is Inequality or Gini Index in Shishmaref?
Inequality or Gini Index in Shishmaref is 0.43.
What is the Total Population of Shishmaref?
Total Population of Shishmaref is 568.
What is the Total Male Population of Shishmaref?
Total Male Population of Shishmaref is 331.
What is the Total Female Population of Shishmaref?
Total Female Population of Shishmaref is 237.
What is the Ratio of Males per 100 Females in Shishmaref?
There are 139.66 Males per 100 Females in Shishmaref.
What is the Ratio of Females per 100 Males in Shishmaref?
There are 71.60 Females per 100 Males in Shishmaref.
What is the Median Population Age in Shishmaref?
Median Population Age in Shishmaref is 30.2 Years.
What is the Average Family Size in Shishmaref
Average Family Size in Shishmaref is 4.0 People.
What is the Average Household Size in Shishmaref
Average Household Size in Shishmaref is 3.8 People.
How Large is the Labor Force in Shishmaref?
There are 194 People in the Labor Forcein in Shishmaref.
What is the Percentage of People in the Labor Force in Shishmaref?
52.3% of People are in the Labor Force in Shishmaref.
What is the Unemployment Rate in Shishmaref?
Unemployment Rate in Shishmaref is 28.4%.