Golovin, AK Map & Demographics
Golovin Map
Golovin Overview
$24,637
PER CAPITA INCOME
$66,875
AVG FAMILY INCOME
$54,167
AVG HOUSEHOLD INCOME
42.5%
WAGE / INCOME GAP [ % ]
57.5¢/ $1
WAGE / INCOME GAP [ $ ]
0.46
INEQUALITY / GINI INDEX
185
TOTAL POPULATION
115
MALE POPULATION
70
FEMALE POPULATION
164.29
MALES / 100 FEMALES
60.87
FEMALES / 100 MALES
28.8
MEDIAN AGE
3.2
AVG FAMILY SIZE
2.7
AVG HOUSEHOLD SIZE
97
LABOR FORCE [ PEOPLE ]
71.3%
PERCENT IN LABOR FORCE
16.5%
UNEMPLOYMENT RATE
Golovin Area Codes
Income in Golovin
Income Overview in Golovin
Per Capita Income in Golovin is $24,637, while median incomes of families and households are $66,875 and $54,167 respectively.
| Characteristic | Number | Measure |
| Per Capita Income | 185 | $24,637 |
| Median Family Income | 49 | $66,875 |
| Mean Family Income | 49 | $84,120 |
| Median Household Income | 68 | $54,167 |
| Mean Household Income | 68 | $67,859 |
| Income Deficit | 49 | $0 |
| Wage / Income Gap (%) | 185 | 42.49% |
| Wage / Income Gap ($) | 185 | 57.51¢ per $1 |
| Gini / Inequality Index | 185 | 0.46 |
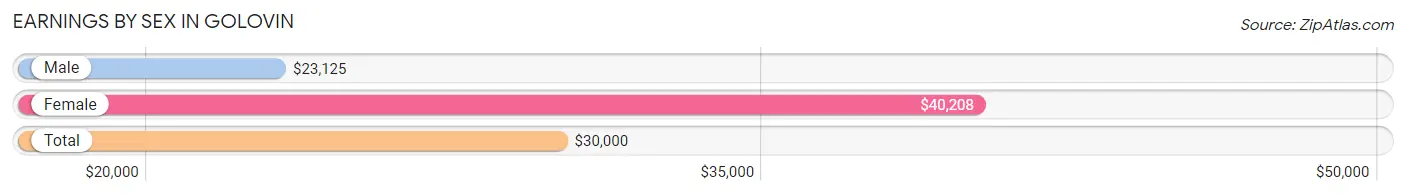
Earnings by Sex in Golovin
Average Earnings in Golovin are $30,000, $23,125 for men and $40,208 for women, a difference of 42.5%.
| Sex | Number | Average Earnings |
| Male | 63 (59.4%) | $23,125 |
| Female | 43 (40.6%) | $40,208 |
| Total | 106 (100.0%) | $30,000 |
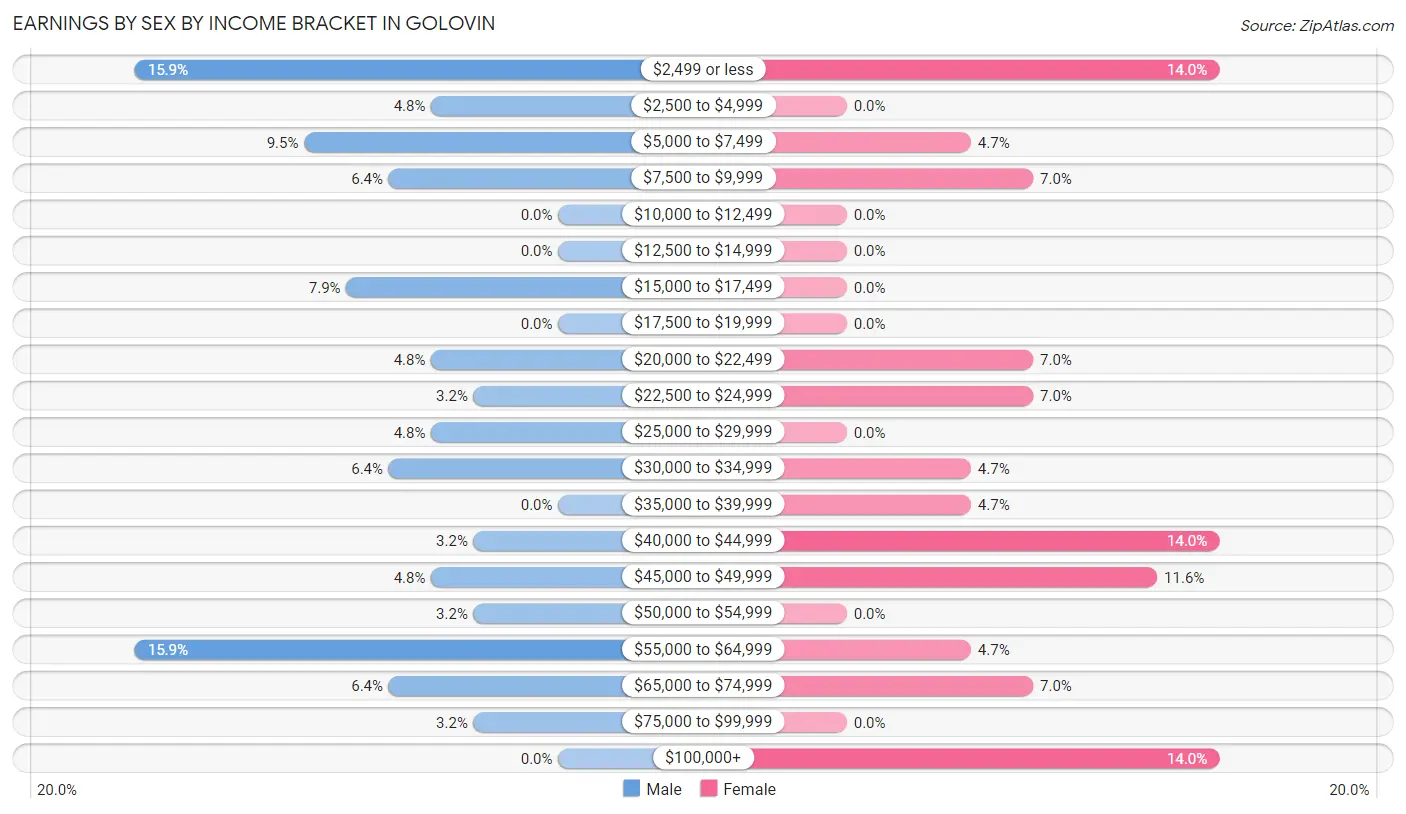
Earnings by Sex by Income Bracket in Golovin
The most common earnings brackets in Golovin are $2,499 or less for men (10 | 15.9%) and $2,499 or less for women (6 | 14.0%).
| Income | Male | Female |
| $2,499 or less | 10 (15.9%) | 6 (14.0%) |
| $2,500 to $4,999 | 3 (4.8%) | 0 (0.0%) |
| $5,000 to $7,499 | 6 (9.5%) | 2 (4.6%) |
| $7,500 to $9,999 | 4 (6.4%) | 3 (7.0%) |
| $10,000 to $12,499 | 0 (0.0%) | 0 (0.0%) |
| $12,500 to $14,999 | 0 (0.0%) | 0 (0.0%) |
| $15,000 to $17,499 | 5 (7.9%) | 0 (0.0%) |
| $17,500 to $19,999 | 0 (0.0%) | 0 (0.0%) |
| $20,000 to $22,499 | 3 (4.8%) | 3 (7.0%) |
| $22,500 to $24,999 | 2 (3.2%) | 3 (7.0%) |
| $25,000 to $29,999 | 3 (4.8%) | 0 (0.0%) |
| $30,000 to $34,999 | 4 (6.4%) | 2 (4.6%) |
| $35,000 to $39,999 | 0 (0.0%) | 2 (4.6%) |
| $40,000 to $44,999 | 2 (3.2%) | 6 (14.0%) |
| $45,000 to $49,999 | 3 (4.8%) | 5 (11.6%) |
| $50,000 to $54,999 | 2 (3.2%) | 0 (0.0%) |
| $55,000 to $64,999 | 10 (15.9%) | 2 (4.6%) |
| $65,000 to $74,999 | 4 (6.4%) | 3 (7.0%) |
| $75,000 to $99,999 | 2 (3.2%) | 0 (0.0%) |
| $100,000+ | 0 (0.0%) | 6 (14.0%) |
| Total | 63 (100.0%) | 43 (100.0%) |
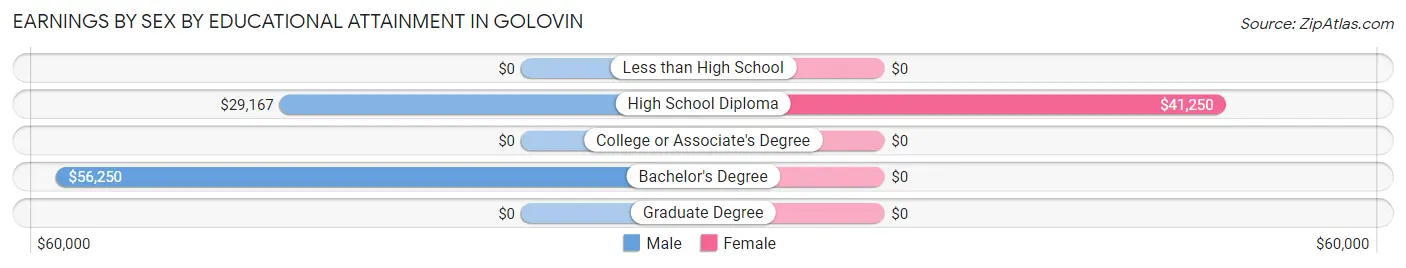
Earnings by Sex by Educational Attainment in Golovin
Average earnings in Golovin are $30,000 for men and $46,250 for women, a difference of 35.1%. Men with an educational attainment of bachelor's degree enjoy the highest average annual earnings of $56,250, while those with high school diploma education earn the least with $29,167. Women with an educational attainment of high school diploma earn the most with the average annual earnings of $41,250, while those with high school diploma education have the smallest earnings of $41,250.
| Educational Attainment | Male Income | Female Income |
| Less than High School | - | - |
| High School Diploma | $29,167 | $41,250 |
| College or Associate's Degree | - | - |
| Bachelor's Degree | $56,250 | $0 |
| Graduate Degree | - | - |
| Total | $30,000 | $46,250 |
Family Income in Golovin
Family Income Brackets in Golovin
According to the Golovin family income data, there are 15 families falling into the $50,000 to $74,999 income range, which is the most common income bracket and makes up 30.6% of all families.
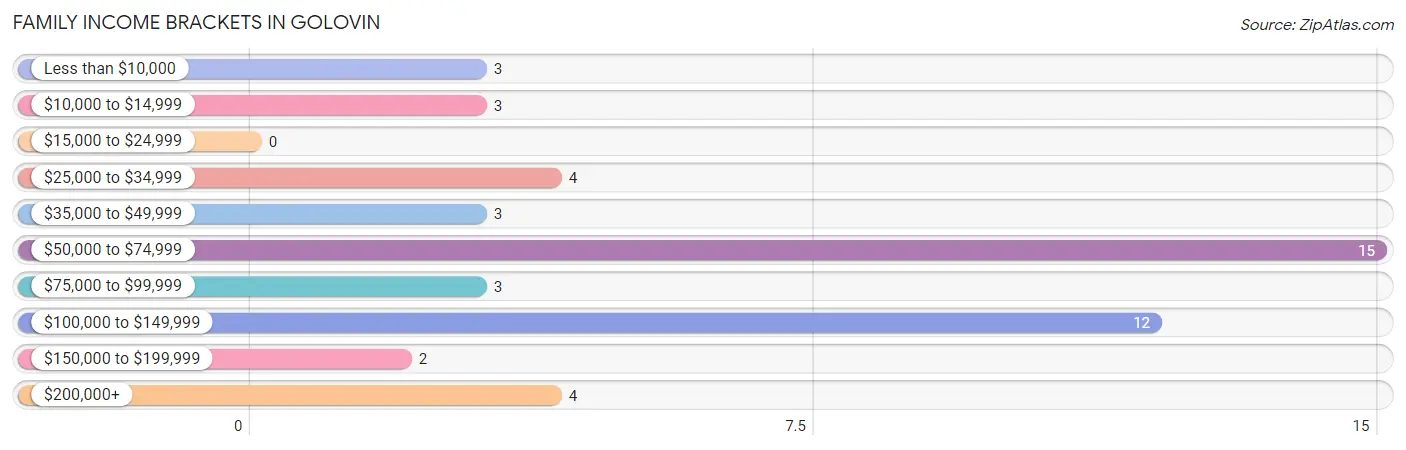
| Income Bracket | # Families | % Families |
| Less than $10,000 | 3 | 6.1% |
| $10,000 to $14,999 | 3 | 6.1% |
| $15,000 to $24,999 | 0 | 0.0% |
| $25,000 to $34,999 | 4 | 8.2% |
| $35,000 to $49,999 | 3 | 6.1% |
| $50,000 to $74,999 | 15 | 30.6% |
| $75,000 to $99,999 | 3 | 6.1% |
| $100,000 to $149,999 | 12 | 24.5% |
| $150,000 to $199,999 | 2 | 4.1% |
| $200,000+ | 4 | 8.2% |
Family Income by Famaliy Size in Golovin
3-person families (14 | 28.6%) account for the highest median family income in Golovin with $95,000 per family, while 3-person families (14 | 28.6%) have the highest median income of $31,667 per family member.
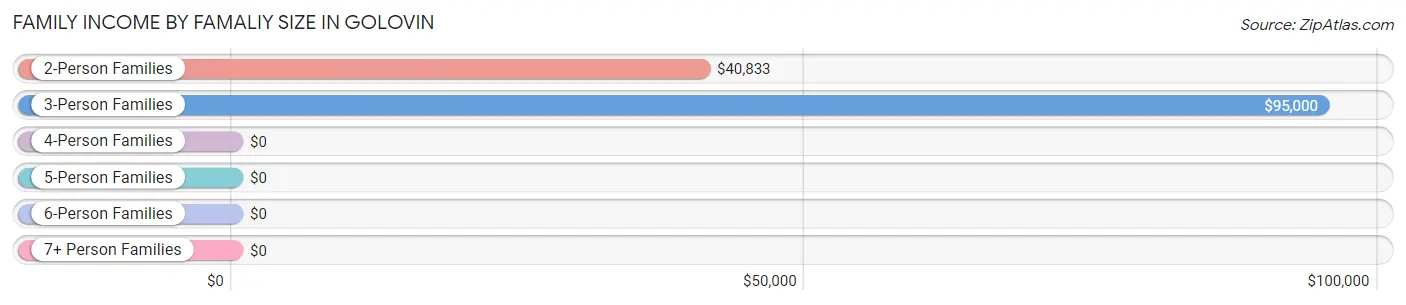
| Income Bracket | # Families | Median Income |
| 2-Person Families | 16 (32.7%) | $40,833 |
| 3-Person Families | 14 (28.6%) | $95,000 |
| 4-Person Families | 3 (6.1%) | $0 |
| 5-Person Families | 4 (8.2%) | $0 |
| 6-Person Families | 10 (20.4%) | $0 |
| 7+ Person Families | 2 (4.1%) | $0 |
| Total | 49 (100.0%) | $66,875 |
Family Income by Number of Earners in Golovin
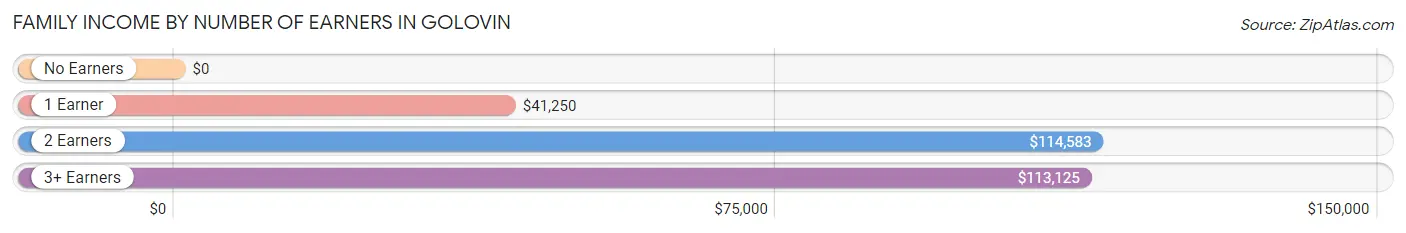
| Number of Earners | # Families | Median Income |
| No Earners | 0 (0.0%) | $0 |
| 1 Earner | 23 (46.9%) | $41,250 |
| 2 Earners | 11 (22.5%) | $114,583 |
| 3+ Earners | 15 (30.6%) | $113,125 |
| Total | 49 (100.0%) | $66,875 |
Household Income in Golovin
Household Income Brackets in Golovin
With 14 households falling in the category, the $50,000 to $74,999 income range is the most frequent in Golovin, accounting for 20.6% of all households. In contrast, only 2 households (2.9%) fall into the $150,000 to $199,999 income bracket, making it the least populous group.
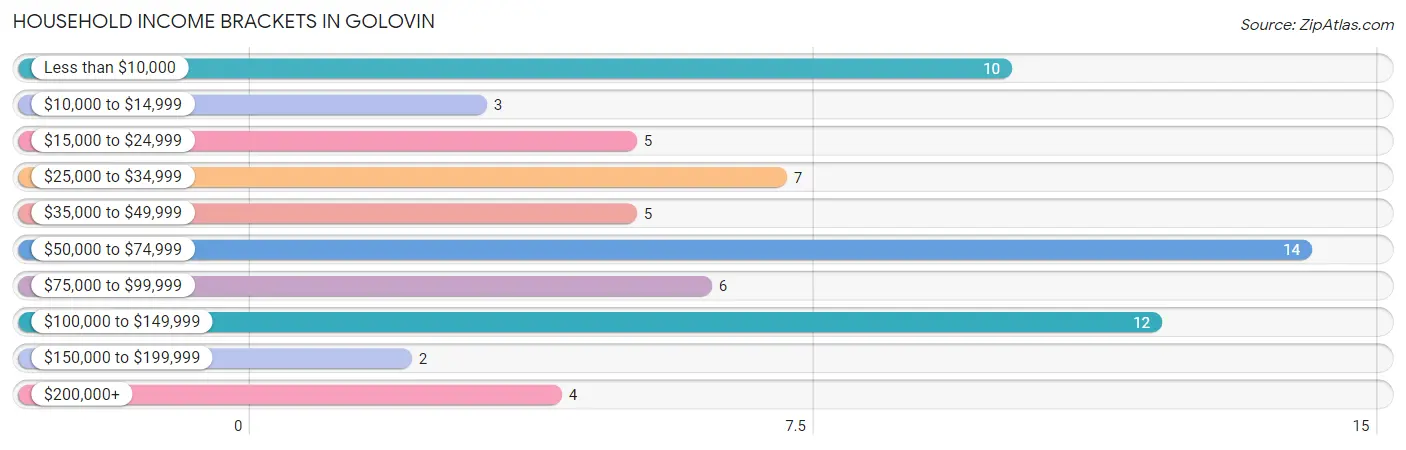
| Income Bracket | # Households | % Households |
| Less than $10,000 | 10 | 14.7% |
| $10,000 to $14,999 | 3 | 4.4% |
| $15,000 to $24,999 | 5 | 7.4% |
| $25,000 to $34,999 | 7 | 10.3% |
| $35,000 to $49,999 | 5 | 7.4% |
| $50,000 to $74,999 | 14 | 20.6% |
| $75,000 to $99,999 | 6 | 8.8% |
| $100,000 to $149,999 | 12 | 17.6% |
| $150,000 to $199,999 | 2 | 2.9% |
| $200,000+ | 4 | 5.9% |
Household Income by Householder Age in Golovin
The median household income in Golovin is $54,167, with the highest median household income of $68,750 found in the 45 to 64 years age bracket for the primary householder. A total of 24 households (35.3%) fall into this category. Meanwhile, the 25 to 44 years age bracket for the primary householder has the lowest median household income of $0, with 21 households (30.9%) in this group.
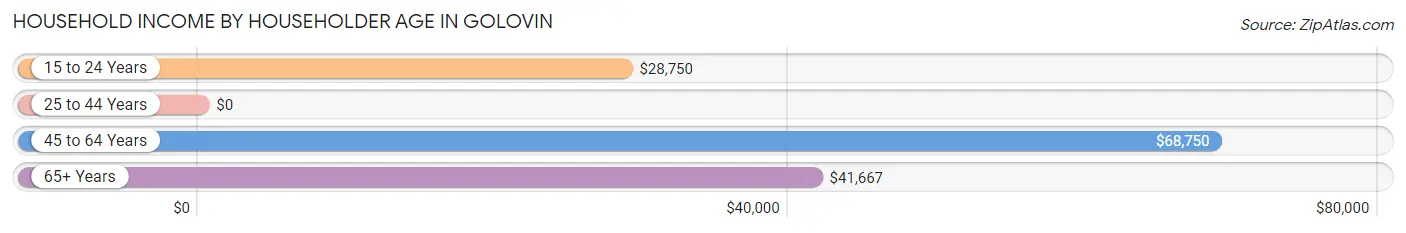
| Income Bracket | # Households | Median Income |
| 15 to 24 Years | 9 (13.2%) | $28,750 |
| 25 to 44 Years | 21 (30.9%) | $0 |
| 45 to 64 Years | 24 (35.3%) | $68,750 |
| 65+ Years | 14 (20.6%) | $41,667 |
| Total | 68 (100.0%) | $54,167 |
Poverty in Golovin
Income Below Poverty by Sex and Age in Golovin
With 13.9% poverty level for males and 15.7% for females among the residents of Golovin, 5 year old males and under 5 year old females are the most vulnerable to poverty, with 3 males (100.0%) and 2 females (66.7%) in their respective age groups living below the poverty level.
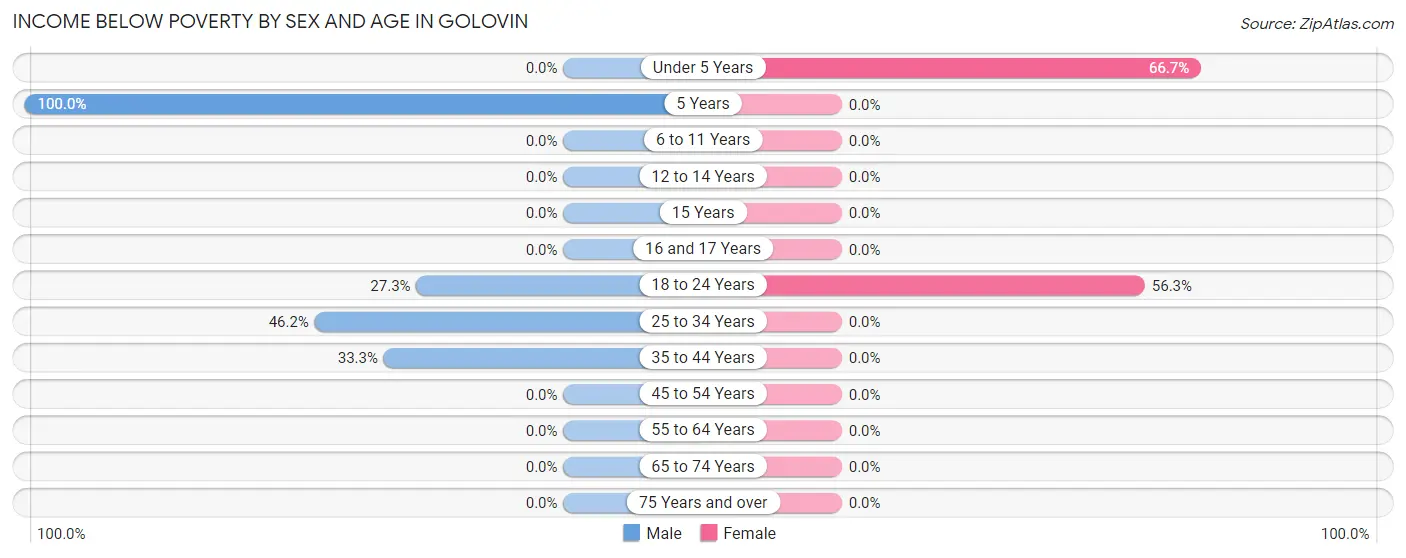
| Age Bracket | Male | Female |
| Under 5 Years | 0 (0.0%) | 2 (66.7%) |
| 5 Years | 3 (100.0%) | 0 (0.0%) |
| 6 to 11 Years | 0 (0.0%) | 0 (0.0%) |
| 12 to 14 Years | 0 (0.0%) | 0 (0.0%) |
| 15 Years | 0 (0.0%) | 0 (0.0%) |
| 16 and 17 Years | 0 (0.0%) | 0 (0.0%) |
| 18 to 24 Years | 3 (27.3%) | 9 (56.2%) |
| 25 to 34 Years | 6 (46.2%) | 0 (0.0%) |
| 35 to 44 Years | 4 (33.3%) | 0 (0.0%) |
| 45 to 54 Years | 0 (0.0%) | 0 (0.0%) |
| 55 to 64 Years | 0 (0.0%) | 0 (0.0%) |
| 65 to 74 Years | 0 (0.0%) | 0 (0.0%) |
| 75 Years and over | 0 (0.0%) | 0 (0.0%) |
| Total | 16 (13.9%) | 11 (15.7%) |
Income Above Poverty by Sex and Age in Golovin
According to the poverty statistics in Golovin, males aged under 5 years and females aged 5 years are the age groups that are most secure financially, with 100.0% of males and 100.0% of females in these age groups living above the poverty line.
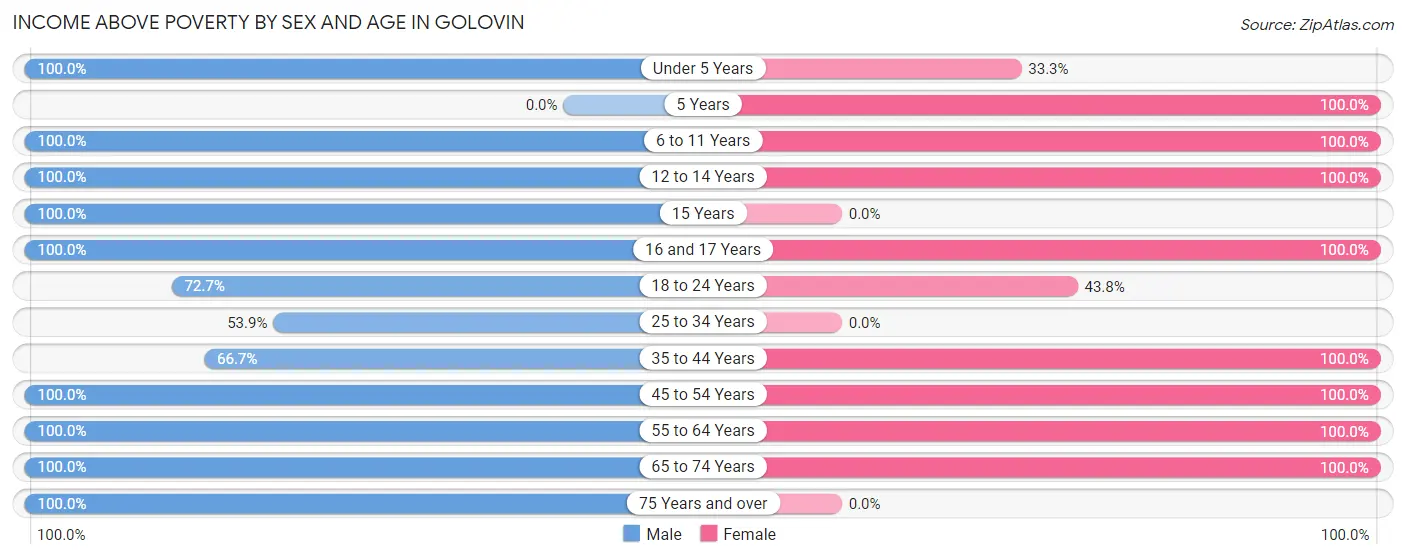
| Age Bracket | Male | Female |
| Under 5 Years | 7 (100.0%) | 1 (33.3%) |
| 5 Years | 0 (0.0%) | 1 (100.0%) |
| 6 to 11 Years | 10 (100.0%) | 2 (100.0%) |
| 12 to 14 Years | 10 (100.0%) | 8 (100.0%) |
| 15 Years | 5 (100.0%) | 0 (0.0%) |
| 16 and 17 Years | 6 (100.0%) | 4 (100.0%) |
| 18 to 24 Years | 8 (72.7%) | 7 (43.8%) |
| 25 to 34 Years | 7 (53.8%) | 0 (0.0%) |
| 35 to 44 Years | 8 (66.7%) | 18 (100.0%) |
| 45 to 54 Years | 11 (100.0%) | 3 (100.0%) |
| 55 to 64 Years | 11 (100.0%) | 9 (100.0%) |
| 65 to 74 Years | 12 (100.0%) | 6 (100.0%) |
| 75 Years and over | 4 (100.0%) | 0 (0.0%) |
| Total | 99 (86.1%) | 59 (84.3%) |
Income Below Poverty Among Married-Couple Families in Golovin
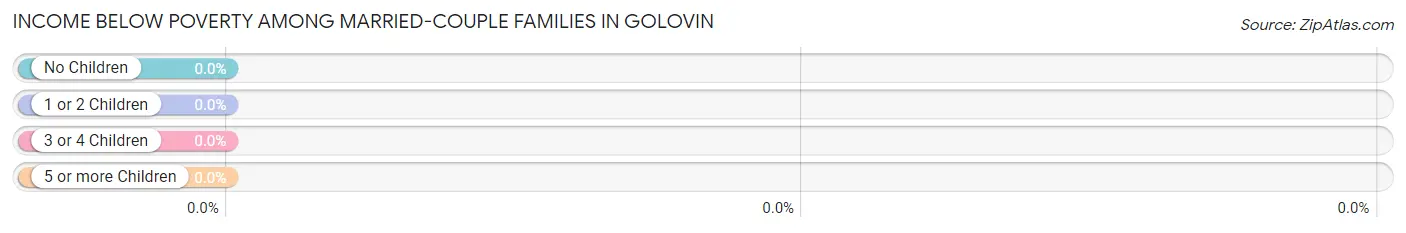
| Children | Above Poverty | Below Poverty |
| No Children | 11 (100.0%) | 0 (0.0%) |
| 1 or 2 Children | 6 (100.0%) | 0 (0.0%) |
| 3 or 4 Children | 10 (100.0%) | 0 (0.0%) |
| 5 or more Children | 2 (100.0%) | 0 (0.0%) |
| Total | 29 (100.0%) | 0 (0.0%) |
Income Below Poverty Among Single-Parent Households in Golovin
According to the poverty data in Golovin, 30.0% or 3 single-father households and 30.0% or 3 single-mother households are living below the poverty line. Among single-father households, those with 1 or 2 children have the highest poverty rate, with 3 households (37.5%) experiencing poverty. Likewise, among single-mother households, those with 1 or 2 children have the highest poverty rate, with 3 households (50.0%) falling below the poverty line.
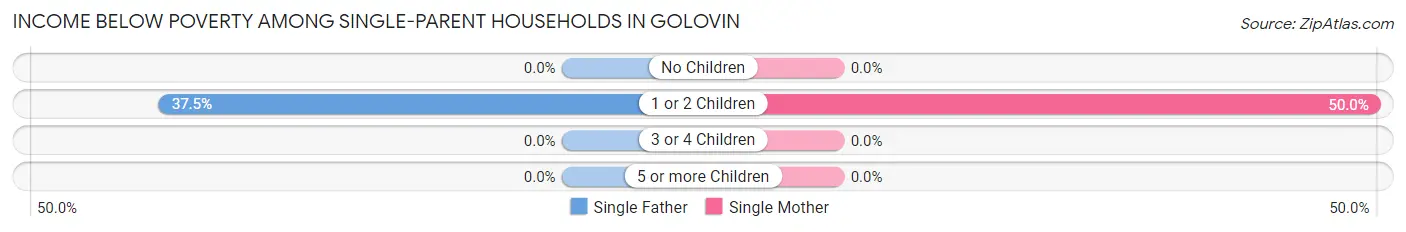
| Children | Single Father | Single Mother |
| No Children | 0 (0.0%) | 0 (0.0%) |
| 1 or 2 Children | 3 (37.5%) | 3 (50.0%) |
| 3 or 4 Children | 0 (0.0%) | 0 (0.0%) |
| 5 or more Children | 0 (0.0%) | 0 (0.0%) |
| Total | 3 (30.0%) | 3 (30.0%) |
Income Below Poverty Among Married-Couple vs Single-Parent Households in Golovin
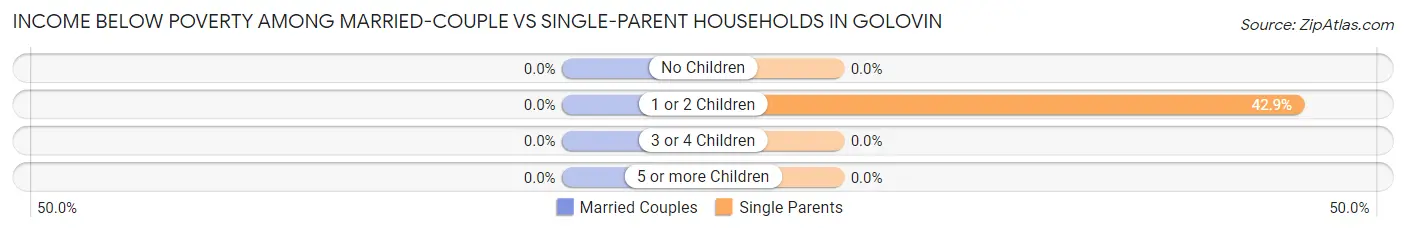
| Children | Married-Couple Families | Single-Parent Households |
| No Children | 0 (0.0%) | 0 (0.0%) |
| 1 or 2 Children | 0 (0.0%) | 6 (42.9%) |
| 3 or 4 Children | 0 (0.0%) | 0 (0.0%) |
| 5 or more Children | 0 (0.0%) | 0 (0.0%) |
| Total | 0 (0.0%) | 6 (30.0%) |
Race in Golovin
The most populous races in Golovin are Native / Alaskan (173 | 93.5%), White / Caucasian (7 | 3.8%), and Two or more Races (5 | 2.7%).
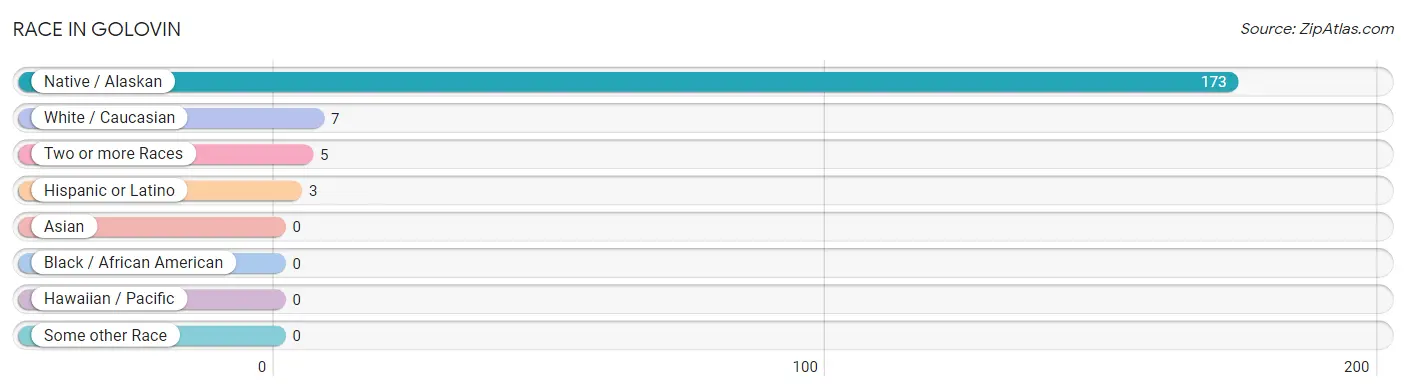
| Race | # Population | % Population |
| Asian | 0 | 0.0% |
| Black / African American | 0 | 0.0% |
| Hawaiian / Pacific | 0 | 0.0% |
| Hispanic or Latino | 3 | 1.6% |
| Native / Alaskan | 173 | 93.5% |
| White / Caucasian | 7 | 3.8% |
| Two or more Races | 5 | 2.7% |
| Some other Race | 0 | 0.0% |
| Total | 185 | 100.0% |
Ancestry in Golovin
The most populous ancestries reported in Golovin are Inupiat (173 | 93.5%), Hungarian (4 | 2.2%), Scottish (4 | 2.2%), Alaska Native (3 | 1.6%), and Mexican (3 | 1.6%), together accounting for 101.1% of all Golovin residents.
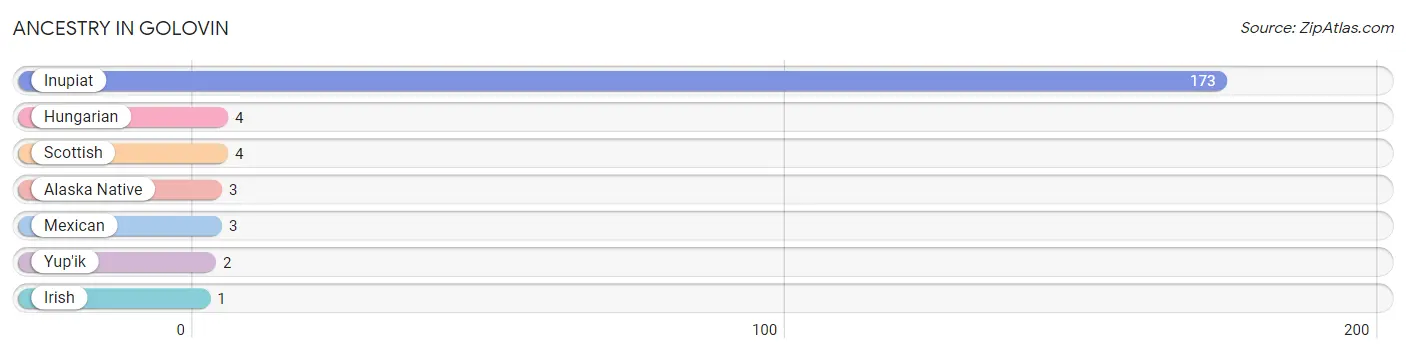
| Ancestry | # Population | % Population |
| Alaska Native | 3 | 1.6% |
| Hungarian | 4 | 2.2% |
| Inupiat | 173 | 93.5% |
| Irish | 1 | 0.5% |
| Mexican | 3 | 1.6% |
| Scottish | 4 | 2.2% |
| Yup'ik | 2 | 1.1% | View All 7 Rows |
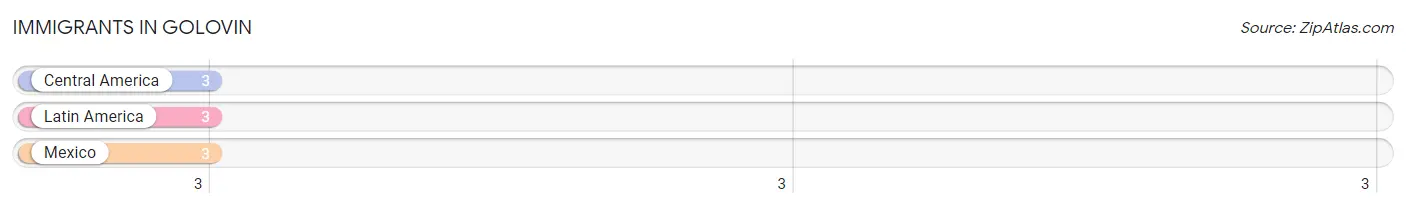
Immigrants in Golovin
The most numerous immigrant groups reported in Golovin came from Central America (3 | 1.6%), Latin America (3 | 1.6%), and Mexico (3 | 1.6%), together accounting for 4.9% of all Golovin residents.
| Immigration Origin | # Population | % Population |
| Central America | 3 | 1.6% |
| Latin America | 3 | 1.6% |
| Mexico | 3 | 1.6% | View All 3 Rows |
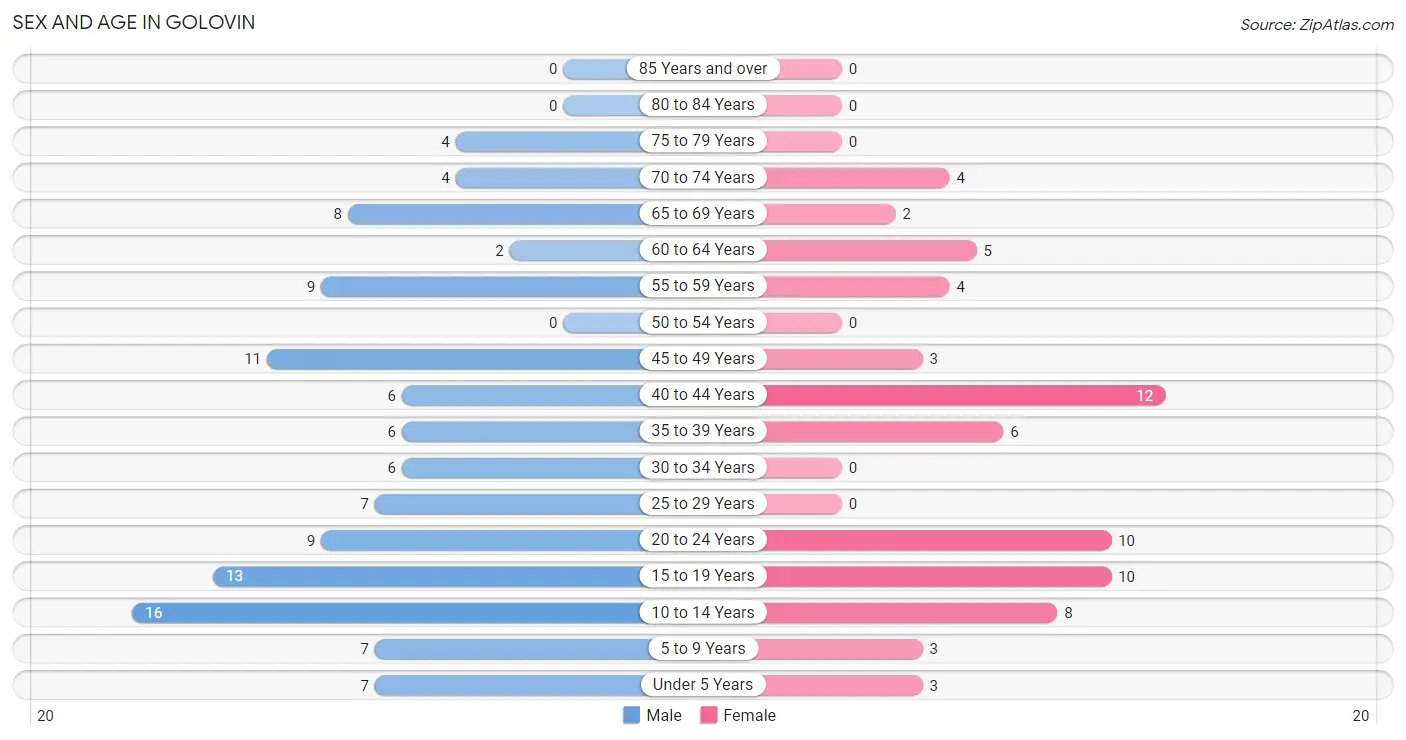
Sex and Age in Golovin
Sex and Age in Golovin
The most populous age groups in Golovin are 10 to 14 Years (16 | 13.9%) for men and 40 to 44 Years (12 | 17.1%) for women.
| Age Bracket | Male | Female |
| Under 5 Years | 7 (6.1%) | 3 (4.3%) |
| 5 to 9 Years | 7 (6.1%) | 3 (4.3%) |
| 10 to 14 Years | 16 (13.9%) | 8 (11.4%) |
| 15 to 19 Years | 13 (11.3%) | 10 (14.3%) |
| 20 to 24 Years | 9 (7.8%) | 10 (14.3%) |
| 25 to 29 Years | 7 (6.1%) | 0 (0.0%) |
| 30 to 34 Years | 6 (5.2%) | 0 (0.0%) |
| 35 to 39 Years | 6 (5.2%) | 6 (8.6%) |
| 40 to 44 Years | 6 (5.2%) | 12 (17.1%) |
| 45 to 49 Years | 11 (9.6%) | 3 (4.3%) |
| 50 to 54 Years | 0 (0.0%) | 0 (0.0%) |
| 55 to 59 Years | 9 (7.8%) | 4 (5.7%) |
| 60 to 64 Years | 2 (1.7%) | 5 (7.1%) |
| 65 to 69 Years | 8 (7.0%) | 2 (2.9%) |
| 70 to 74 Years | 4 (3.5%) | 4 (5.7%) |
| 75 to 79 Years | 4 (3.5%) | 0 (0.0%) |
| 80 to 84 Years | 0 (0.0%) | 0 (0.0%) |
| 85 Years and over | 0 (0.0%) | 0 (0.0%) |
| Total | 115 (100.0%) | 70 (100.0%) |
Families and Households in Golovin
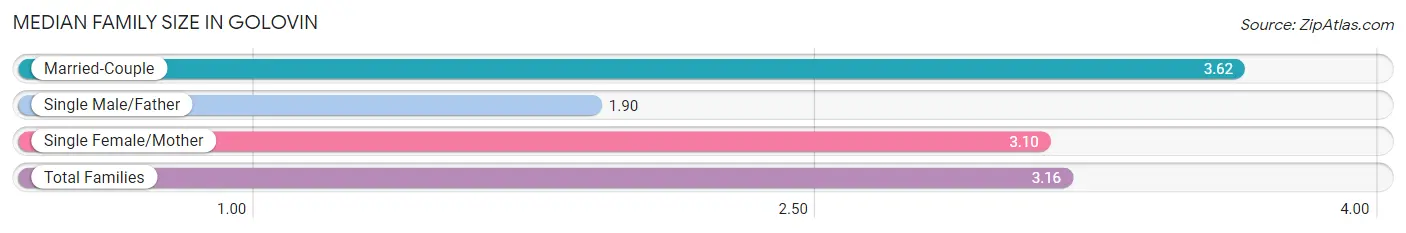
Median Family Size in Golovin
The median family size in Golovin is 3.16 persons per family, with married-couple families (29 | 59.2%) accounting for the largest median family size of 3.62 persons per family. On the other hand, single male/father families (10 | 20.4%) represent the smallest median family size with 1.90 persons per family.
| Family Type | # Families | Family Size |
| Married-Couple | 29 (59.2%) | 3.62 |
| Single Male/Father | 10 (20.4%) | 1.90 |
| Single Female/Mother | 10 (20.4%) | 3.10 |
| Total Families | 49 (100.0%) | 3.16 |
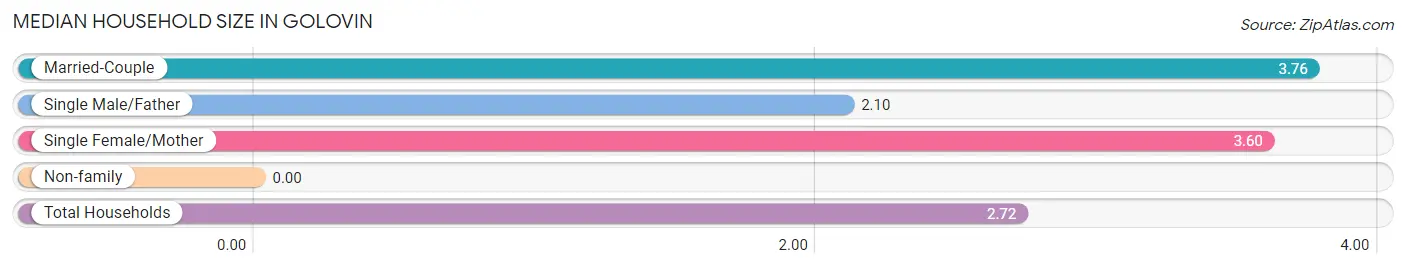
Median Household Size in Golovin
| Household Type | # Households | Household Size |
| Married-Couple | 29 (42.6%) | 3.76 |
| Single Male/Father | 10 (14.7%) | 2.10 |
| Single Female/Mother | 10 (14.7%) | 3.60 |
| Non-family | 19 (27.9%) | - |
| Total Households | 68 (100.0%) | 2.72 |
Household Size by Marriage Status in Golovin
Out of a total of 68 households in Golovin, 49 (72.1%) are family households, while 19 (27.9%) are nonfamily households. The most numerous type of family households are 3-person households, comprising 18, and the most common type of nonfamily households are 1-person households, comprising 19.
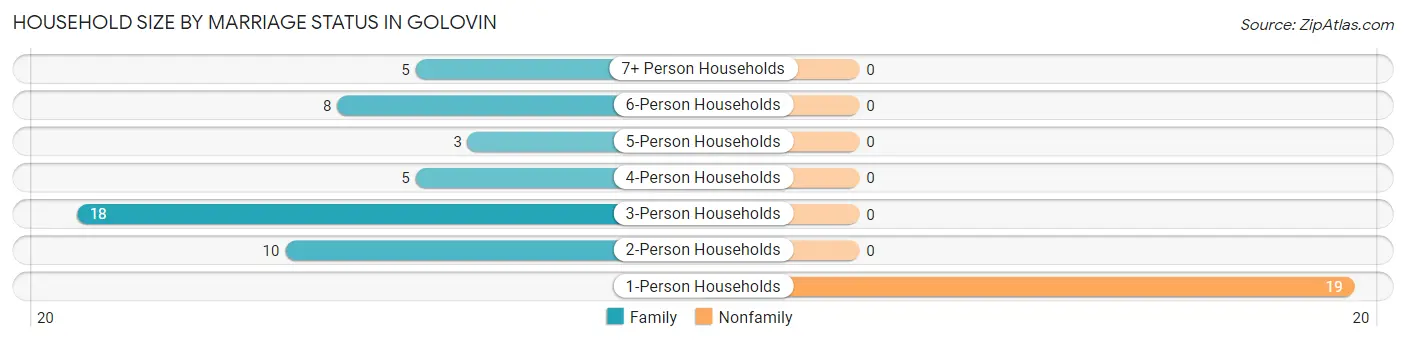
| Household Size | Family Households | Nonfamily Households |
| 1-Person Households | - | 19 (27.9%) |
| 2-Person Households | 10 (14.7%) | 0 (0.0%) |
| 3-Person Households | 18 (26.5%) | 0 (0.0%) |
| 4-Person Households | 5 (7.3%) | 0 (0.0%) |
| 5-Person Households | 3 (4.4%) | 0 (0.0%) |
| 6-Person Households | 8 (11.8%) | 0 (0.0%) |
| 7+ Person Households | 5 (7.3%) | 0 (0.0%) |
| Total | 49 (72.1%) | 19 (27.9%) |
Female Fertility in Golovin
Fertility by Age in Golovin
Average fertility rate in Golovin is 73.0 births per 1,000 women. Women in the age bracket of 15 to 19 years have the highest fertility rate with 200.0 births per 1,000 women. Women in the age bracket of 15 to 19 years acount for 66.7% of all women with births.
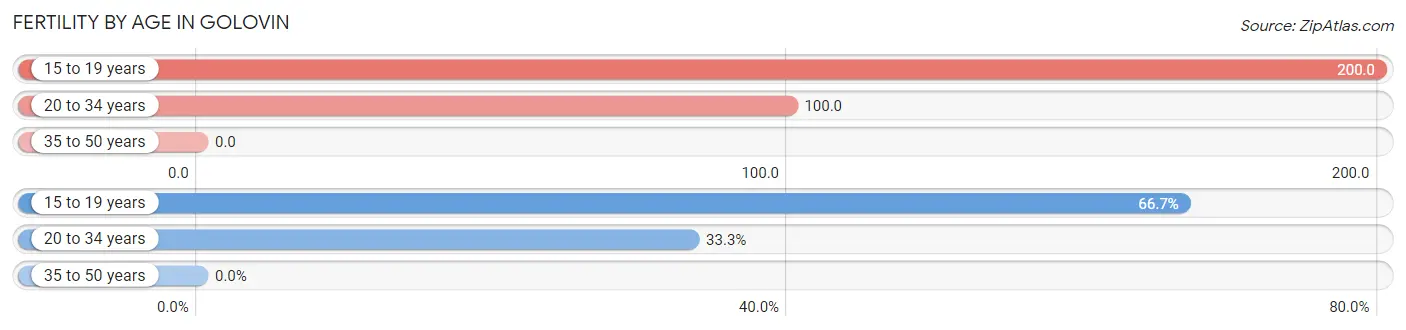
| Age Bracket | Women with Births | Births / 1,000 Women |
| 15 to 19 years | 2 (66.7%) | 200.0 |
| 20 to 34 years | 1 (33.3%) | 100.0 |
| 35 to 50 years | 0 (0.0%) | 0.0 |
| Total | 3 (100.0%) | 73.0 |
Fertility by Age by Marriage Status in Golovin
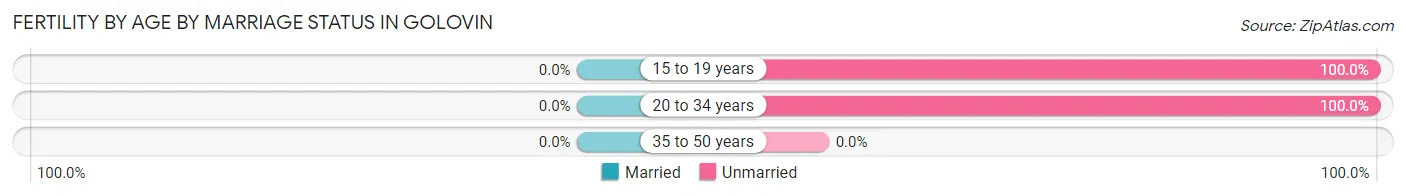
| Age Bracket | Married | Unmarried |
| 15 to 19 years | 0 (0.0%) | 2 (100.0%) |
| 20 to 34 years | 0 (0.0%) | 1 (100.0%) |
| 35 to 50 years | 0 (0.0%) | 0 (0.0%) |
| Total | 0 (0.0%) | 3 (100.0%) |
Fertility by Education in Golovin
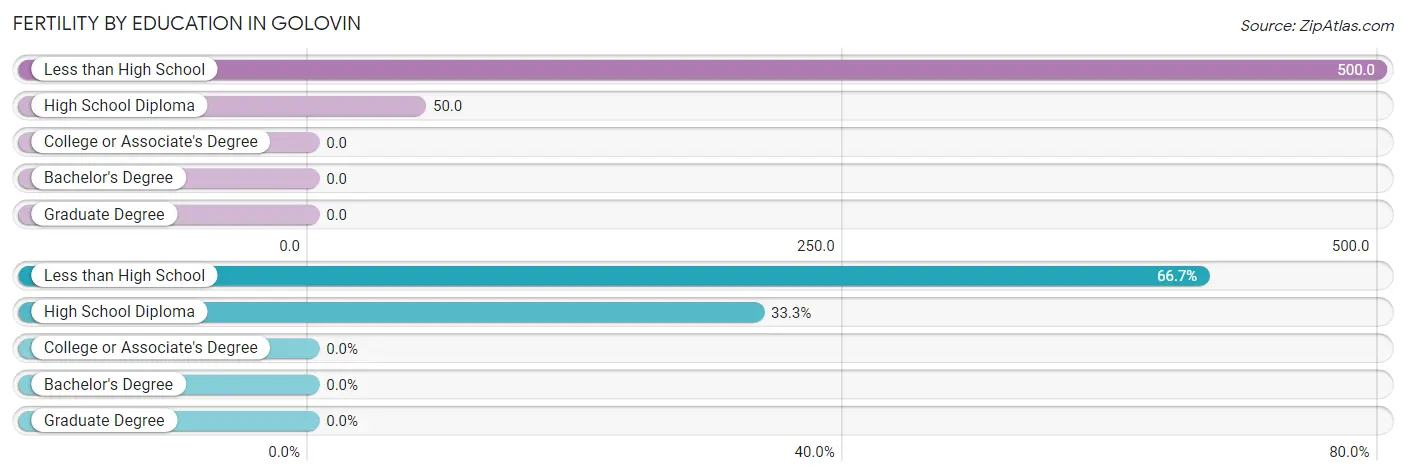
| Educational Attainment | Women with Births | Births / 1,000 Women |
| Less than High School | 2 (66.7%) | 500.0 |
| High School Diploma | 1 (33.3%) | 50.0 |
| College or Associate's Degree | 0 (0.0%) | 0.0 |
| Bachelor's Degree | 0 (0.0%) | 0.0 |
| Graduate Degree | 0 (0.0%) | 0.0 |
| Total | 3 (100.0%) | 73.0 |
Fertility by Education by Marriage Status in Golovin
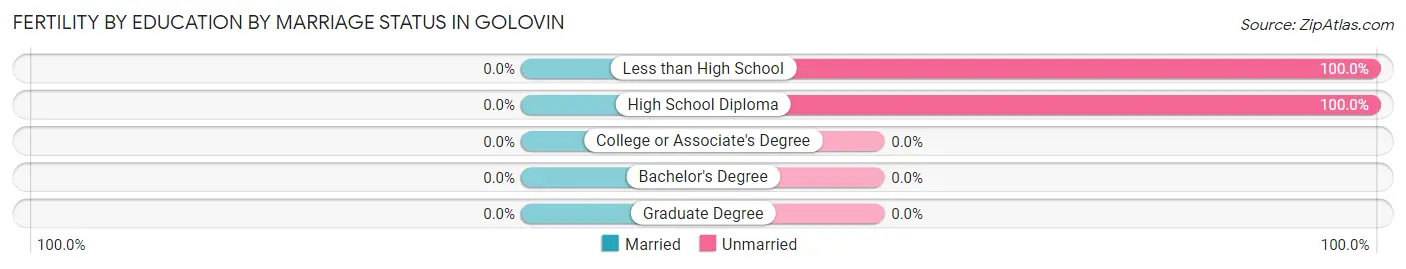
| Educational Attainment | Married | Unmarried |
| Less than High School | 0 (0.0%) | 2 (100.0%) |
| High School Diploma | 0 (0.0%) | 1 (100.0%) |
| College or Associate's Degree | 0 (0.0%) | 0 (0.0%) |
| Bachelor's Degree | 0 (0.0%) | 0 (0.0%) |
| Graduate Degree | 0 (0.0%) | 0 (0.0%) |
| Total | 0 (0.0%) | 3 (100.0%) |
Employment Characteristics in Golovin
Employment by Class of Employer in Golovin
Among the 75 employed individuals in Golovin, local government employees (26 | 34.7%), not-for-profit organizations (15 | 20.0%), and state government employees (15 | 20.0%) make up the most common classes of employment.
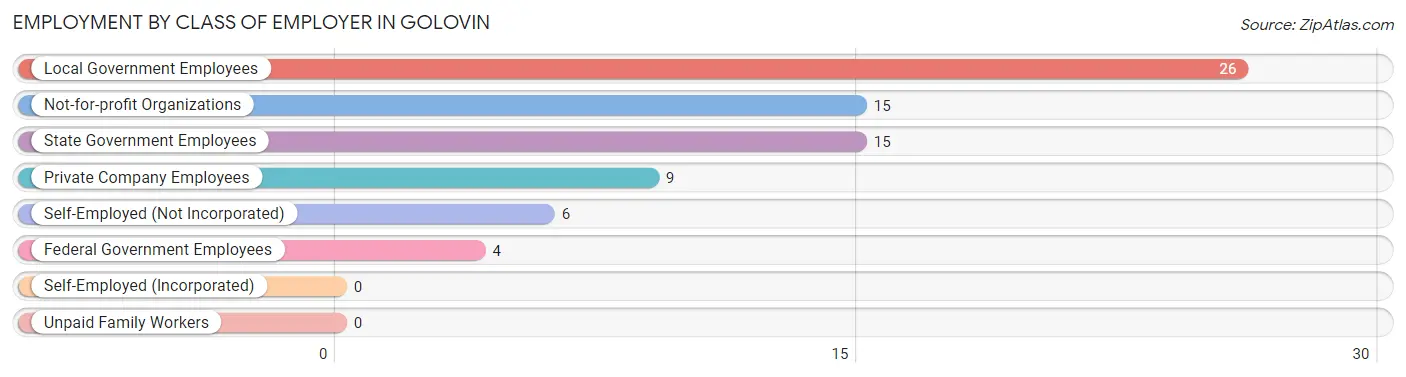
| Employer Class | # Employees | % Employees |
| Private Company Employees | 9 | 12.0% |
| Self-Employed (Incorporated) | 0 | 0.0% |
| Self-Employed (Not Incorporated) | 6 | 8.0% |
| Not-for-profit Organizations | 15 | 20.0% |
| Local Government Employees | 26 | 34.7% |
| State Government Employees | 15 | 20.0% |
| Federal Government Employees | 4 | 5.3% |
| Unpaid Family Workers | 0 | 0.0% |
| Total | 75 | 100.0% |
Employment Status by Age in Golovin
According to the labor force statistics for Golovin, out of the total population over 16 years of age (136), 71.3% or 97 individuals are in the labor force, with 16.5% or 16 of them unemployed. The age group with the highest labor force participation rate is 30 to 34 years, with 100.0% or 6 individuals in the labor force. Within the labor force, the 25 to 29 years age range has the highest percentage of unemployed individuals, with 100.0% or 2 of them being unemployed.
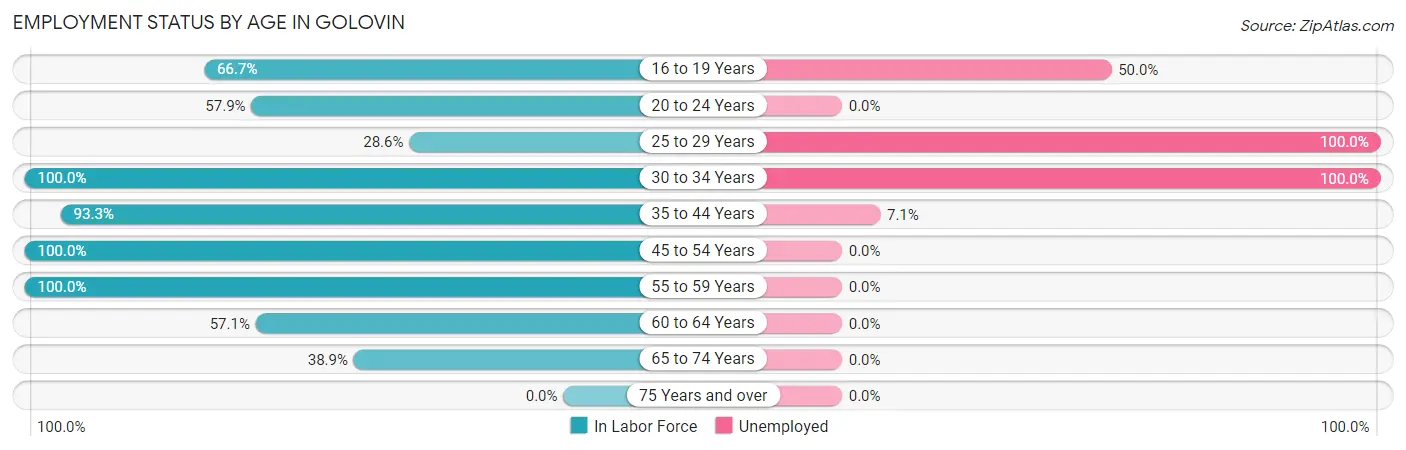
| Age Bracket | In Labor Force | Unemployed |
| 16 to 19 Years | 12 (66.7%) | 6 (50.0%) |
| 20 to 24 Years | 11 (57.9%) | 0 (0.0%) |
| 25 to 29 Years | 2 (28.6%) | 2 (100.0%) |
| 30 to 34 Years | 6 (100.0%) | 6 (100.0%) |
| 35 to 44 Years | 28 (93.3%) | 2 (7.1%) |
| 45 to 54 Years | 14 (100.0%) | 0 (0.0%) |
| 55 to 59 Years | 13 (100.0%) | 0 (0.0%) |
| 60 to 64 Years | 4 (57.1%) | 0 (0.0%) |
| 65 to 74 Years | 7 (38.9%) | 0 (0.0%) |
| 75 Years and over | 0 (0.0%) | 0 (0.0%) |
| Total | 97 (71.3%) | 16 (16.5%) |
Employment Status by Educational Attainment in Golovin
According to labor force statistics for Golovin, 87.0% of individuals (67) out of the total population between 25 and 64 years of age (77) are in the labor force, with 14.9% or 10 of them being unemployed. The group with the highest labor force participation rate are those with the educational attainment of high school diploma, with 89.7% or 35 individuals in the labor force. Within the labor force, individuals with college / associate degree education have the highest percentage of unemployment, with 23.1% or 6 of them being unemployed.
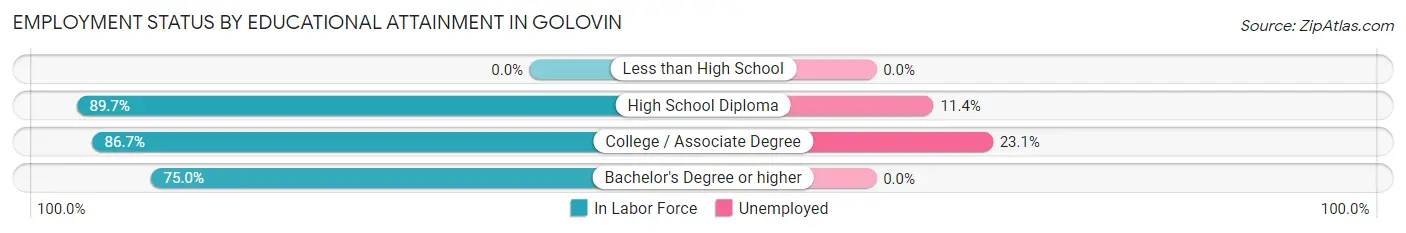
| Educational Attainment | In Labor Force | Unemployed |
| Less than High School | 0 (0.0%) | 0 (0.0%) |
| High School Diploma | 35 (89.7%) | 4 (11.4%) |
| College / Associate Degree | 26 (86.7%) | 7 (23.1%) |
| Bachelor's Degree or higher | 6 (75.0%) | 0 (0.0%) |
| Total | 67 (87.0%) | 11 (14.9%) |
Employment Occupations by Sex in Golovin
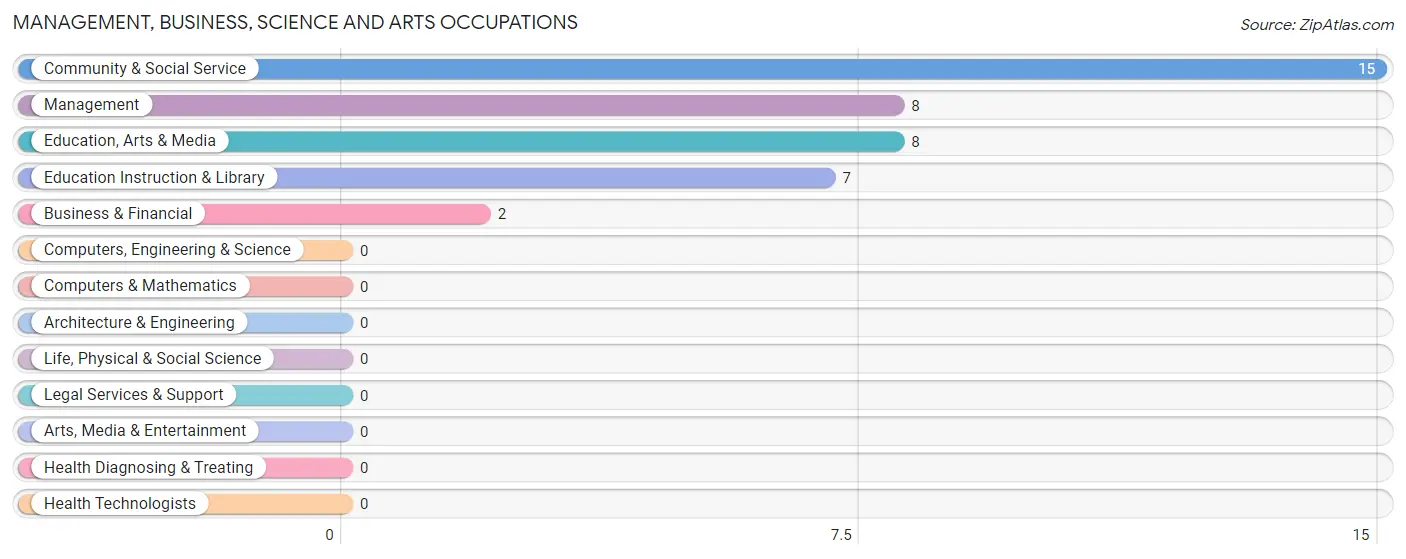
Management, Business, Science and Arts Occupations
The most common Management, Business, Science and Arts occupations in Golovin are Community & Social Service (15 | 18.5%), Management (8 | 9.9%), Education, Arts & Media (8 | 9.9%), Education Instruction & Library (7 | 8.6%), and Business & Financial (2 | 2.5%).
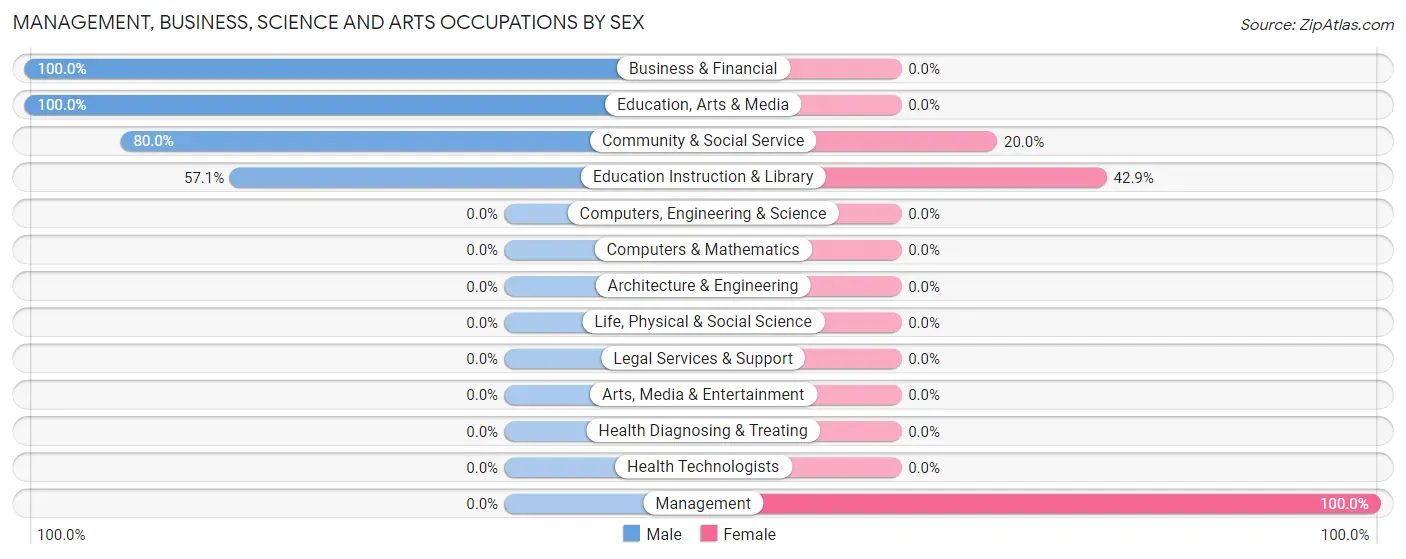
Management, Business, Science and Arts Occupations by Sex
Within the Management, Business, Science and Arts occupations in Golovin, the most male-oriented occupations are Business & Financial (100.0%), Education, Arts & Media (100.0%), and Community & Social Service (80.0%), while the most female-oriented occupations are Management (100.0%), Education Instruction & Library (42.9%), and Community & Social Service (20.0%).
| Occupation | Male | Female |
| Management | 0 (0.0%) | 8 (100.0%) |
| Business & Financial | 2 (100.0%) | 0 (0.0%) |
| Computers, Engineering & Science | 0 (0.0%) | 0 (0.0%) |
| Computers & Mathematics | 0 (0.0%) | 0 (0.0%) |
| Architecture & Engineering | 0 (0.0%) | 0 (0.0%) |
| Life, Physical & Social Science | 0 (0.0%) | 0 (0.0%) |
| Community & Social Service | 12 (80.0%) | 3 (20.0%) |
| Education, Arts & Media | 8 (100.0%) | 0 (0.0%) |
| Legal Services & Support | 0 (0.0%) | 0 (0.0%) |
| Education Instruction & Library | 4 (57.1%) | 3 (42.9%) |
| Arts, Media & Entertainment | 0 (0.0%) | 0 (0.0%) |
| Health Diagnosing & Treating | 0 (0.0%) | 0 (0.0%) |
| Health Technologists | 0 (0.0%) | 0 (0.0%) |
| Total (Category) | 14 (56.0%) | 11 (44.0%) |
| Total (Overall) | 42 (51.8%) | 39 (48.1%) |
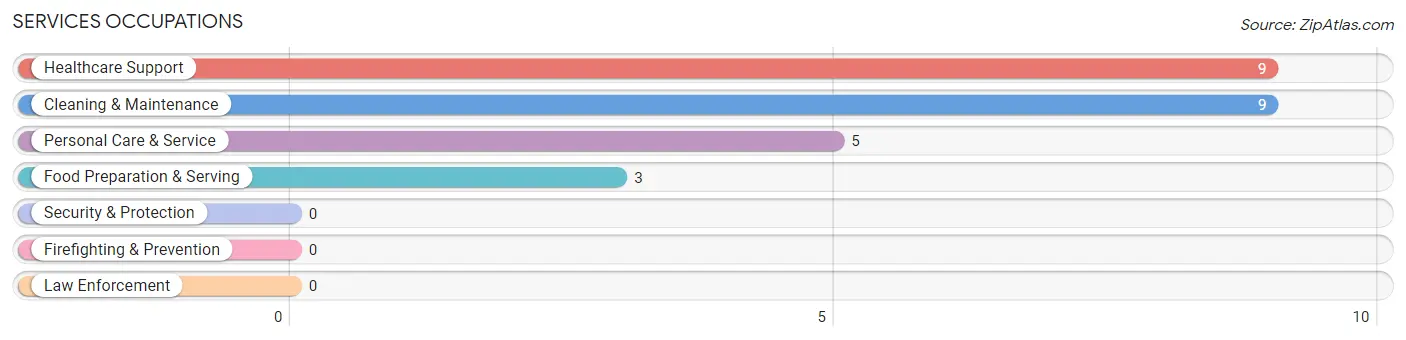
Services Occupations
The most common Services occupations in Golovin are Healthcare Support (9 | 11.1%), Cleaning & Maintenance (9 | 11.1%), Personal Care & Service (5 | 6.2%), and Food Preparation & Serving (3 | 3.7%).
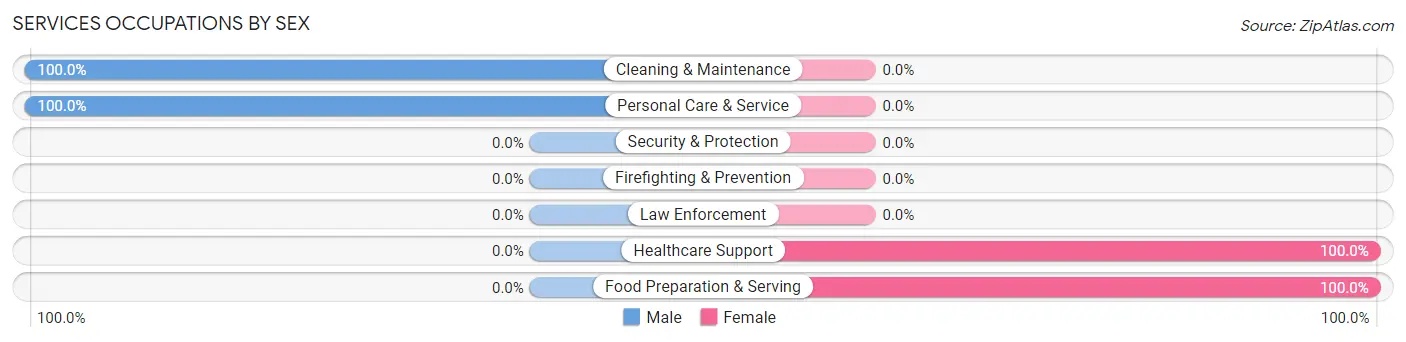
Services Occupations by Sex
Within the Services occupations in Golovin, the most male-oriented occupations are Cleaning & Maintenance (100.0%), and Personal Care & Service (100.0%), while the most female-oriented occupations are Healthcare Support (100.0%), and Food Preparation & Serving (100.0%).
| Occupation | Male | Female |
| Healthcare Support | 0 (0.0%) | 9 (100.0%) |
| Security & Protection | 0 (0.0%) | 0 (0.0%) |
| Firefighting & Prevention | 0 (0.0%) | 0 (0.0%) |
| Law Enforcement | 0 (0.0%) | 0 (0.0%) |
| Food Preparation & Serving | 0 (0.0%) | 3 (100.0%) |
| Cleaning & Maintenance | 9 (100.0%) | 0 (0.0%) |
| Personal Care & Service | 5 (100.0%) | 0 (0.0%) |
| Total (Category) | 14 (53.8%) | 12 (46.2%) |
| Total (Overall) | 42 (51.8%) | 39 (48.1%) |
Sales and Office Occupations
The most common Sales and Office occupations in Golovin are Office & Administration (10 | 12.3%), and Sales & Related (6 | 7.4%).
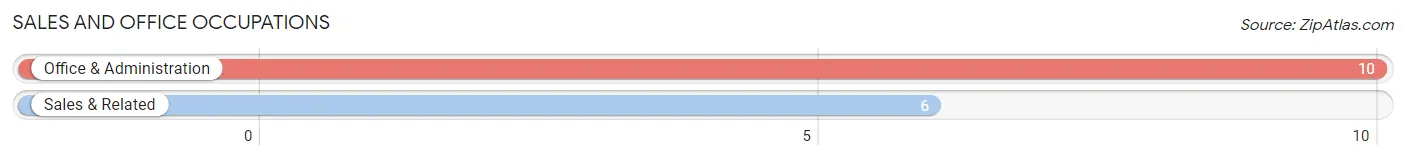
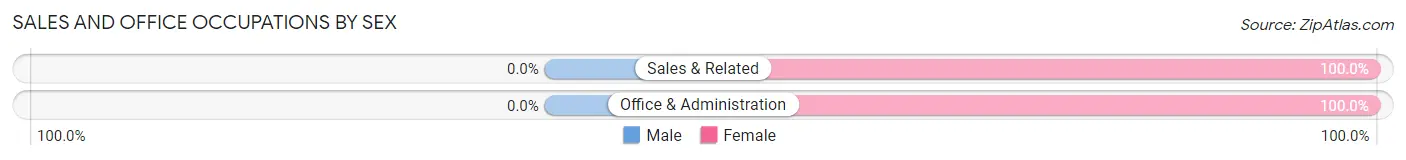
Sales and Office Occupations by Sex
| Occupation | Male | Female |
| Sales & Related | 0 (0.0%) | 6 (100.0%) |
| Office & Administration | 0 (0.0%) | 10 (100.0%) |
| Total (Category) | 0 (0.0%) | 16 (100.0%) |
| Total (Overall) | 42 (51.8%) | 39 (48.1%) |
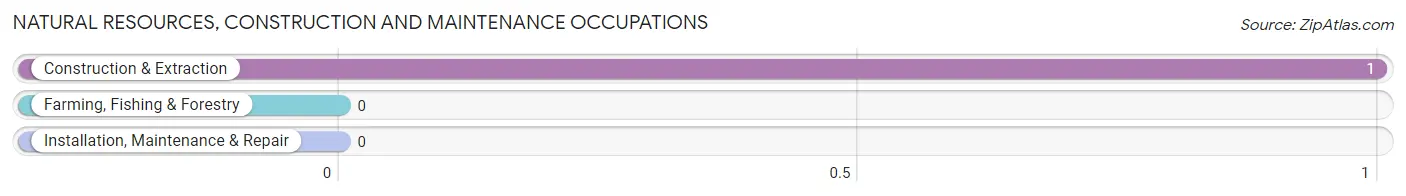
Natural Resources, Construction and Maintenance Occupations
The most common Natural Resources, Construction and Maintenance occupations in Golovin are , and Construction & Extraction (1 | 1.2%).
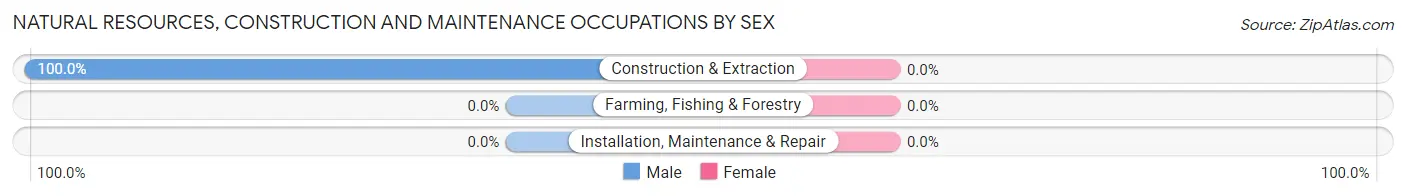
Natural Resources, Construction and Maintenance Occupations by Sex
| Occupation | Male | Female |
| Farming, Fishing & Forestry | 0 (0.0%) | 0 (0.0%) |
| Construction & Extraction | 1 (100.0%) | 0 (0.0%) |
| Installation, Maintenance & Repair | 0 (0.0%) | 0 (0.0%) |
| Total (Category) | 1 (100.0%) | 0 (0.0%) |
| Total (Overall) | 42 (51.8%) | 39 (48.1%) |
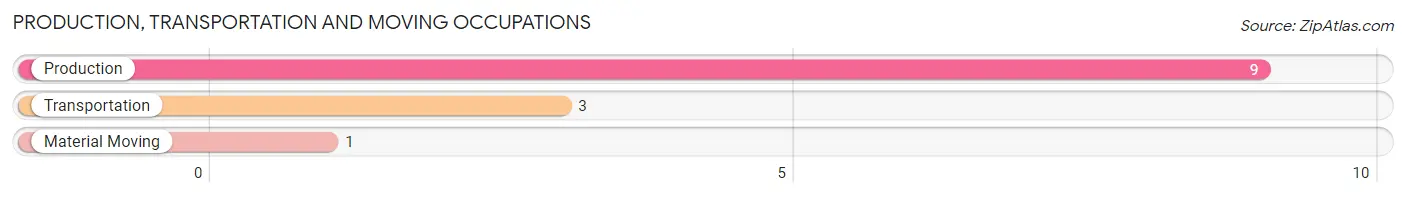
Production, Transportation and Moving Occupations
The most common Production, Transportation and Moving occupations in Golovin are Production (9 | 11.1%), Transportation (3 | 3.7%), and Material Moving (1 | 1.2%).
Production, Transportation and Moving Occupations by Sex
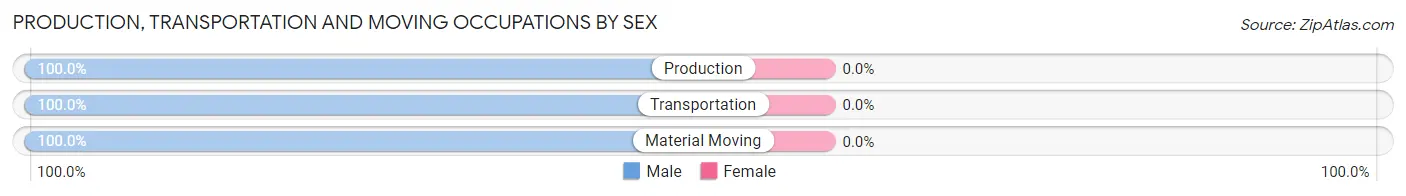
| Occupation | Male | Female |
| Production | 9 (100.0%) | 0 (0.0%) |
| Transportation | 3 (100.0%) | 0 (0.0%) |
| Material Moving | 1 (100.0%) | 0 (0.0%) |
| Total (Category) | 13 (100.0%) | 0 (0.0%) |
| Total (Overall) | 42 (51.8%) | 39 (48.1%) |
Employment Industries by Sex in Golovin
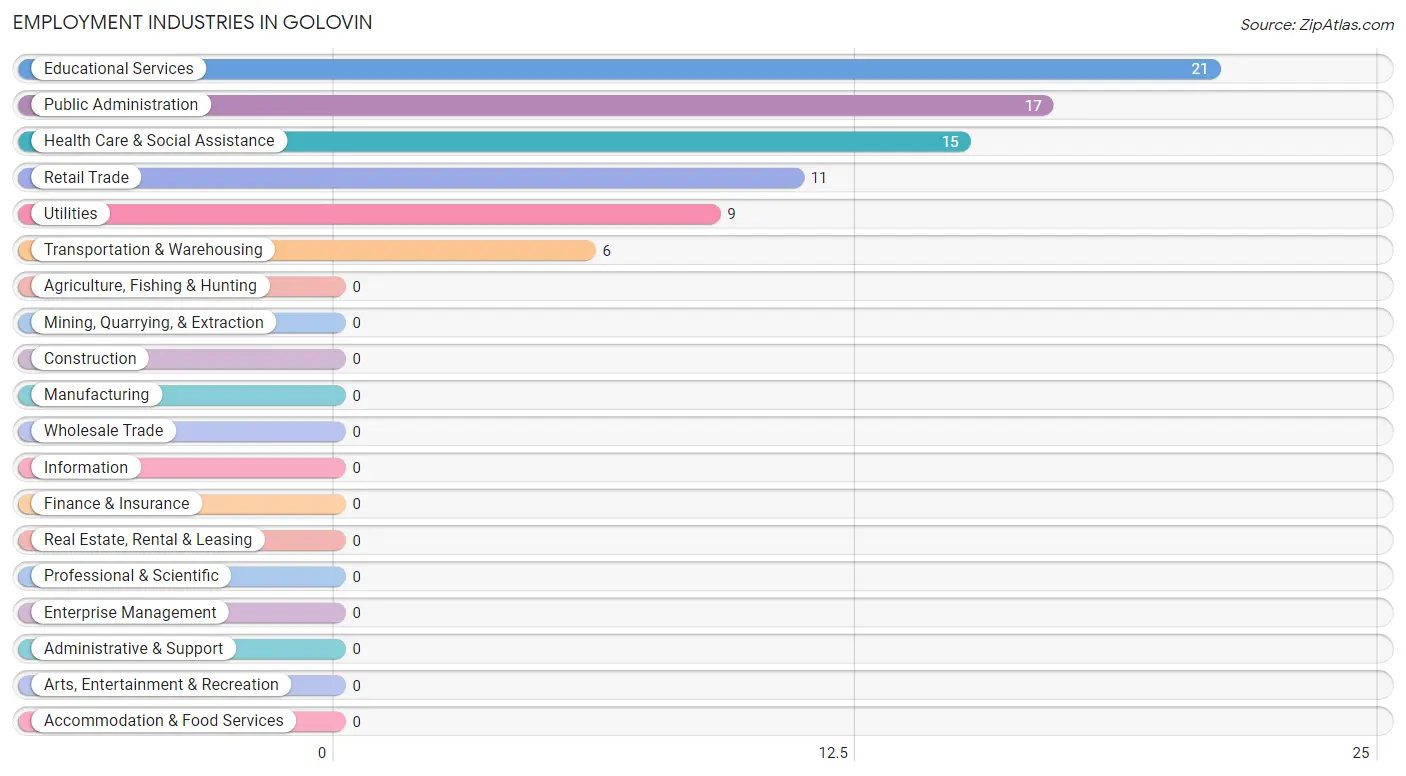
Employment Industries in Golovin
The major employment industries in Golovin include Educational Services (21 | 25.9%), Public Administration (17 | 21.0%), Health Care & Social Assistance (15 | 18.5%), Retail Trade (11 | 13.6%), and Utilities (9 | 11.1%).
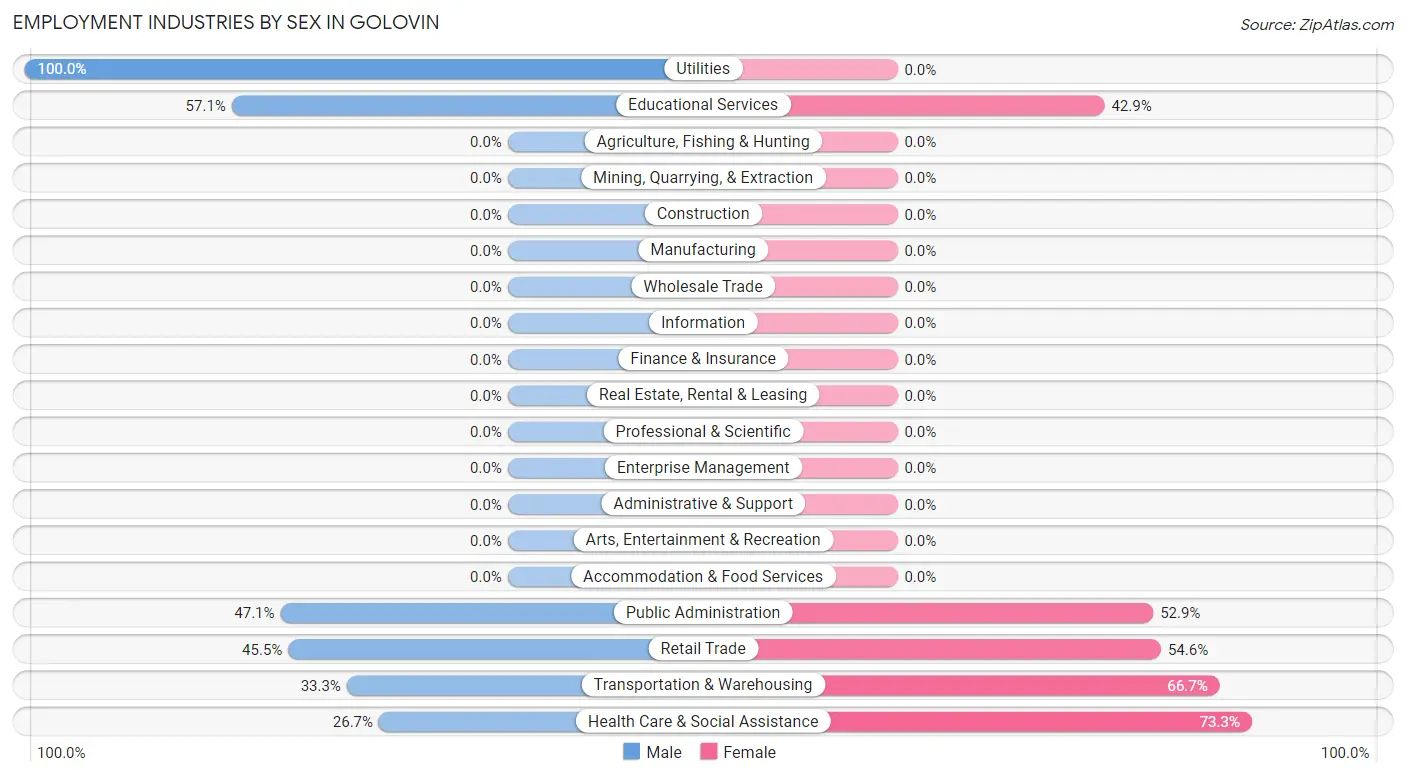
Employment Industries by Sex in Golovin
The Golovin industries that see more men than women are Utilities (100.0%), Educational Services (57.1%), and Public Administration (47.1%), whereas the industries that tend to have a higher number of women are Health Care & Social Assistance (73.3%), Transportation & Warehousing (66.7%), and Retail Trade (54.5%).
| Industry | Male | Female |
| Agriculture, Fishing & Hunting | 0 (0.0%) | 0 (0.0%) |
| Mining, Quarrying, & Extraction | 0 (0.0%) | 0 (0.0%) |
| Construction | 0 (0.0%) | 0 (0.0%) |
| Manufacturing | 0 (0.0%) | 0 (0.0%) |
| Wholesale Trade | 0 (0.0%) | 0 (0.0%) |
| Retail Trade | 5 (45.5%) | 6 (54.5%) |
| Transportation & Warehousing | 2 (33.3%) | 4 (66.7%) |
| Utilities | 9 (100.0%) | 0 (0.0%) |
| Information | 0 (0.0%) | 0 (0.0%) |
| Finance & Insurance | 0 (0.0%) | 0 (0.0%) |
| Real Estate, Rental & Leasing | 0 (0.0%) | 0 (0.0%) |
| Professional & Scientific | 0 (0.0%) | 0 (0.0%) |
| Enterprise Management | 0 (0.0%) | 0 (0.0%) |
| Administrative & Support | 0 (0.0%) | 0 (0.0%) |
| Educational Services | 12 (57.1%) | 9 (42.9%) |
| Health Care & Social Assistance | 4 (26.7%) | 11 (73.3%) |
| Arts, Entertainment & Recreation | 0 (0.0%) | 0 (0.0%) |
| Accommodation & Food Services | 0 (0.0%) | 0 (0.0%) |
| Public Administration | 8 (47.1%) | 9 (52.9%) |
| Total | 42 (51.8%) | 39 (48.1%) |
Education in Golovin
School Enrollment in Golovin
The most common levels of schooling among the 56 students in Golovin are middle school (20 | 35.7%), high school (17 | 30.4%), and elementary school (8 | 14.3%).
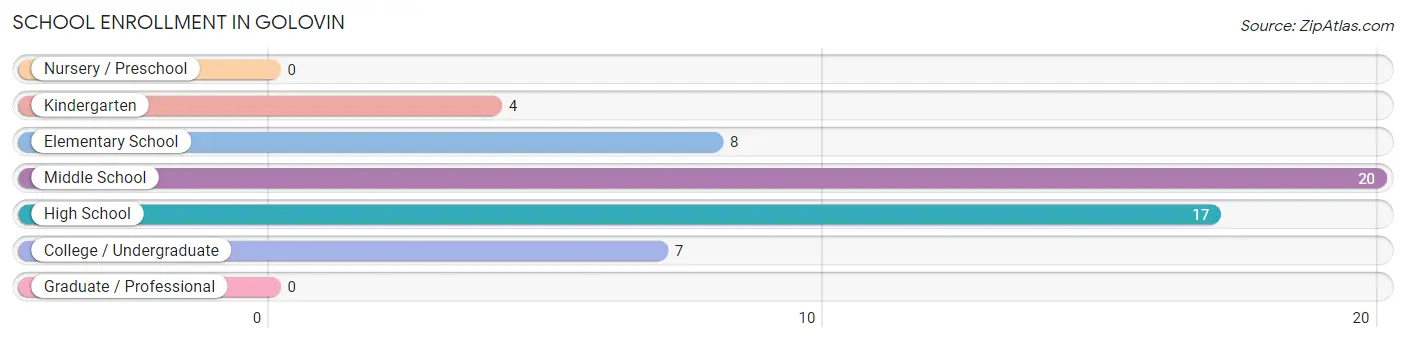
| School Level | # Students | % Students |
| Nursery / Preschool | 0 | 0.0% |
| Kindergarten | 4 | 7.1% |
| Elementary School | 8 | 14.3% |
| Middle School | 20 | 35.7% |
| High School | 17 | 30.4% |
| College / Undergraduate | 7 | 12.5% |
| Graduate / Professional | 0 | 0.0% |
| Total | 56 | 100.0% |
School Enrollment by Age by Funding Source in Golovin
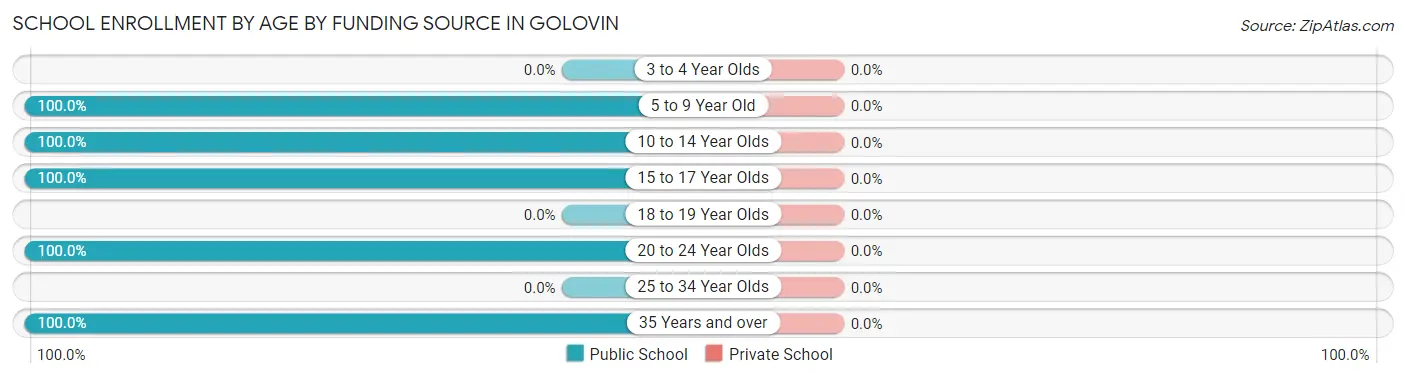
| Age Bracket | Public School | Private School |
| 3 to 4 Year Olds | 0 (0.0%) | 0 (0.0%) |
| 5 to 9 Year Old | 10 (100.0%) | 0 (0.0%) |
| 10 to 14 Year Olds | 24 (100.0%) | 0 (0.0%) |
| 15 to 17 Year Olds | 15 (100.0%) | 0 (0.0%) |
| 18 to 19 Year Olds | 0 (0.0%) | 0 (0.0%) |
| 20 to 24 Year Olds | 2 (100.0%) | 0 (0.0%) |
| 25 to 34 Year Olds | 0 (0.0%) | 0 (0.0%) |
| 35 Years and over | 5 (100.0%) | 0 (0.0%) |
| Total | 56 (100.0%) | 0 (0.0%) |
Educational Attainment by Field of Study in Golovin
Arts & humanities (4 | 50.0%), bio, nature & agricultural (2 | 25.0%), and education (2 | 25.0%) are the most common fields of study among 8 individuals in Golovin who have obtained a bachelor's degree or higher.
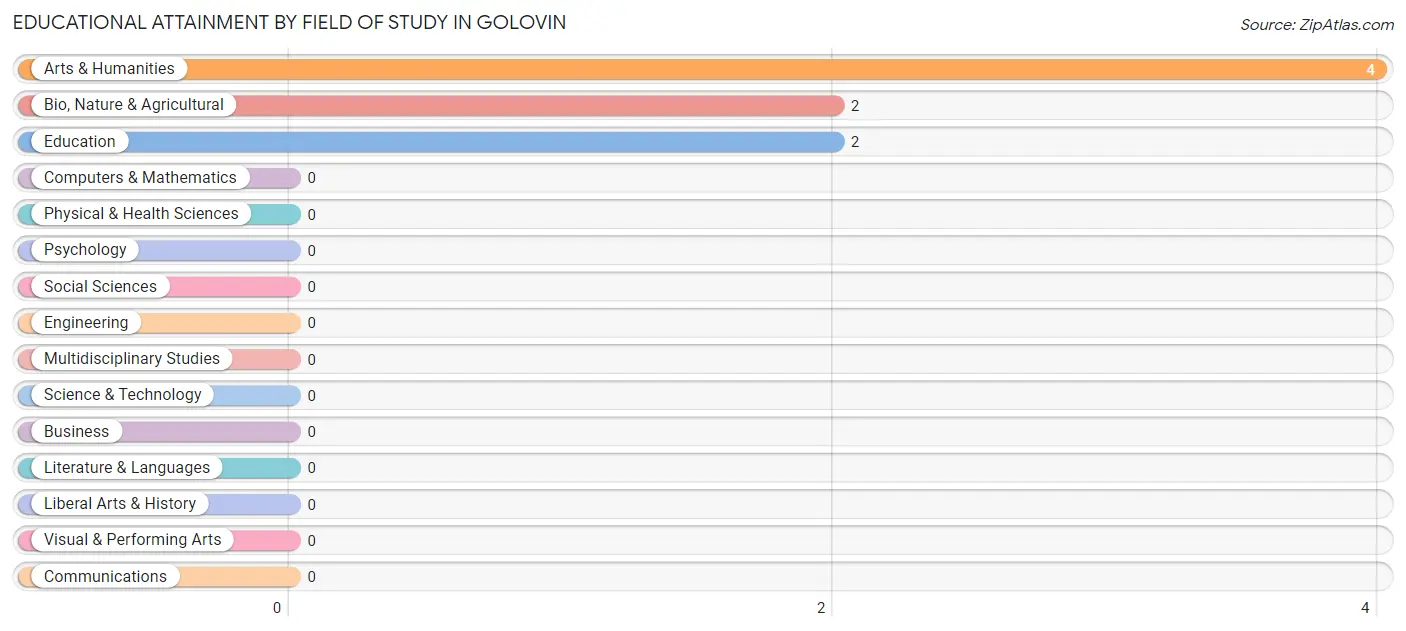
| Field of Study | # Graduates | % Graduates |
| Computers & Mathematics | 0 | 0.0% |
| Bio, Nature & Agricultural | 2 | 25.0% |
| Physical & Health Sciences | 0 | 0.0% |
| Psychology | 0 | 0.0% |
| Social Sciences | 0 | 0.0% |
| Engineering | 0 | 0.0% |
| Multidisciplinary Studies | 0 | 0.0% |
| Science & Technology | 0 | 0.0% |
| Business | 0 | 0.0% |
| Education | 2 | 25.0% |
| Literature & Languages | 0 | 0.0% |
| Liberal Arts & History | 0 | 0.0% |
| Visual & Performing Arts | 0 | 0.0% |
| Communications | 0 | 0.0% |
| Arts & Humanities | 4 | 50.0% |
| Total | 8 | 100.0% |
Transportation & Commute in Golovin
Vehicle Availability by Sex in Golovin
The most prevalent vehicle ownership categories in Golovin are males with no vehicle (25, accounting for 59.5%) and females with no vehicle (12, making up 75.8%).
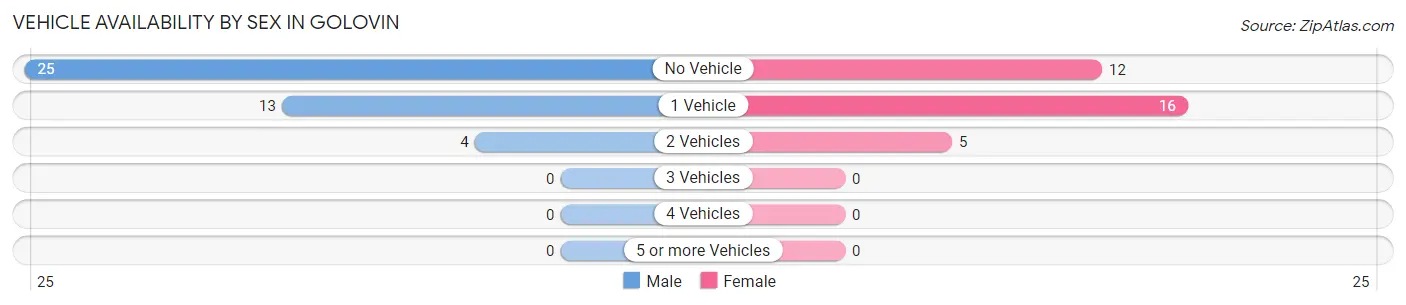
| Vehicles Available | Male | Female |
| No Vehicle | 25 (59.5%) | 12 (36.4%) |
| 1 Vehicle | 13 (30.9%) | 16 (48.5%) |
| 2 Vehicles | 4 (9.5%) | 5 (15.1%) |
| 3 Vehicles | 0 (0.0%) | 0 (0.0%) |
| 4 Vehicles | 0 (0.0%) | 0 (0.0%) |
| 5 or more Vehicles | 0 (0.0%) | 0 (0.0%) |
| Total | 42 (100.0%) | 33 (100.0%) |
Commute Time in Golovin
The most frequently occuring commute durations in Golovin are less than 5 minutes (59 commuters, 86.8%), 5 to 9 minutes (5 commuters, 7.3%), and 10 to 14 minutes (4 commuters, 5.9%).
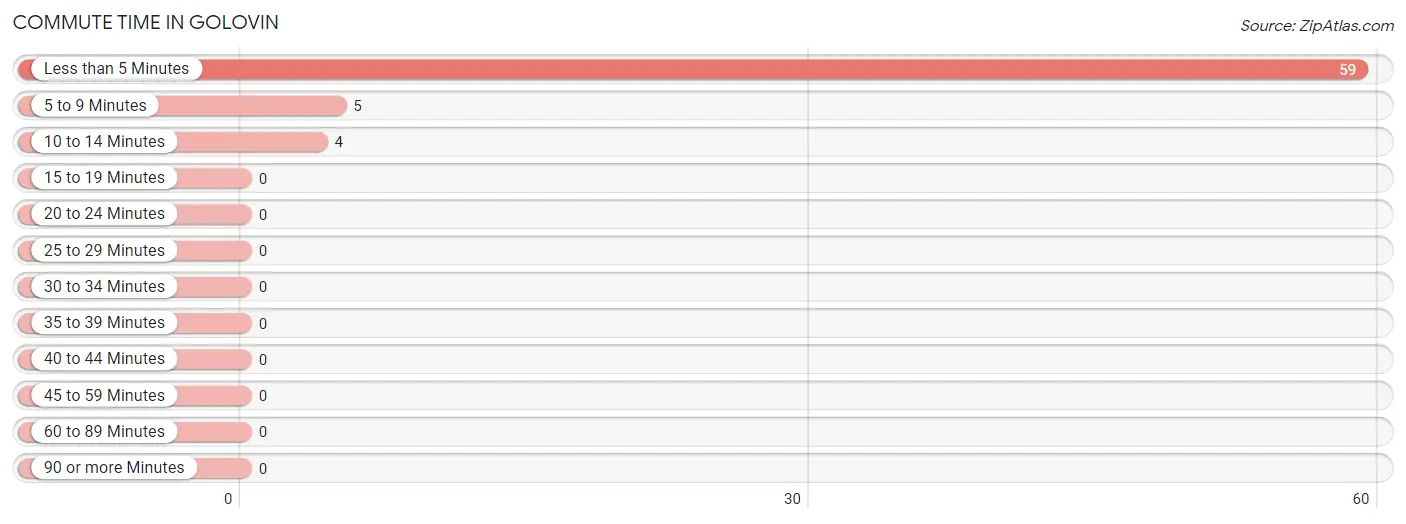
| Commute Time | # Commuters | % Commuters |
| Less than 5 Minutes | 59 | 86.8% |
| 5 to 9 Minutes | 5 | 7.3% |
| 10 to 14 Minutes | 4 | 5.9% |
| 15 to 19 Minutes | 0 | 0.0% |
| 20 to 24 Minutes | 0 | 0.0% |
| 25 to 29 Minutes | 0 | 0.0% |
| 30 to 34 Minutes | 0 | 0.0% |
| 35 to 39 Minutes | 0 | 0.0% |
| 40 to 44 Minutes | 0 | 0.0% |
| 45 to 59 Minutes | 0 | 0.0% |
| 60 to 89 Minutes | 0 | 0.0% |
| 90 or more Minutes | 0 | 0.0% |
Commute Time by Sex in Golovin
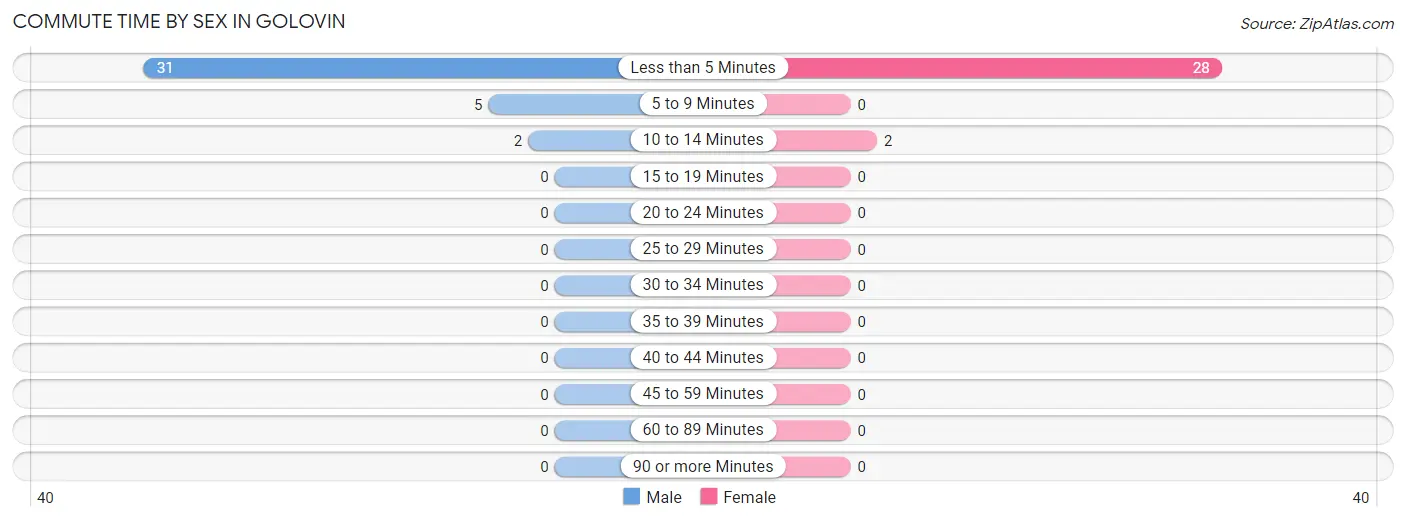
The most common commute times in Golovin are less than 5 minutes (31 commuters, 81.6%) for males and less than 5 minutes (28 commuters, 93.3%) for females.
| Commute Time | Male | Female |
| Less than 5 Minutes | 31 (81.6%) | 28 (93.3%) |
| 5 to 9 Minutes | 5 (13.2%) | 0 (0.0%) |
| 10 to 14 Minutes | 2 (5.3%) | 2 (6.7%) |
| 15 to 19 Minutes | 0 (0.0%) | 0 (0.0%) |
| 20 to 24 Minutes | 0 (0.0%) | 0 (0.0%) |
| 25 to 29 Minutes | 0 (0.0%) | 0 (0.0%) |
| 30 to 34 Minutes | 0 (0.0%) | 0 (0.0%) |
| 35 to 39 Minutes | 0 (0.0%) | 0 (0.0%) |
| 40 to 44 Minutes | 0 (0.0%) | 0 (0.0%) |
| 45 to 59 Minutes | 0 (0.0%) | 0 (0.0%) |
| 60 to 89 Minutes | 0 (0.0%) | 0 (0.0%) |
| 90 or more Minutes | 0 (0.0%) | 0 (0.0%) |
Time of Departure to Work by Sex in Golovin
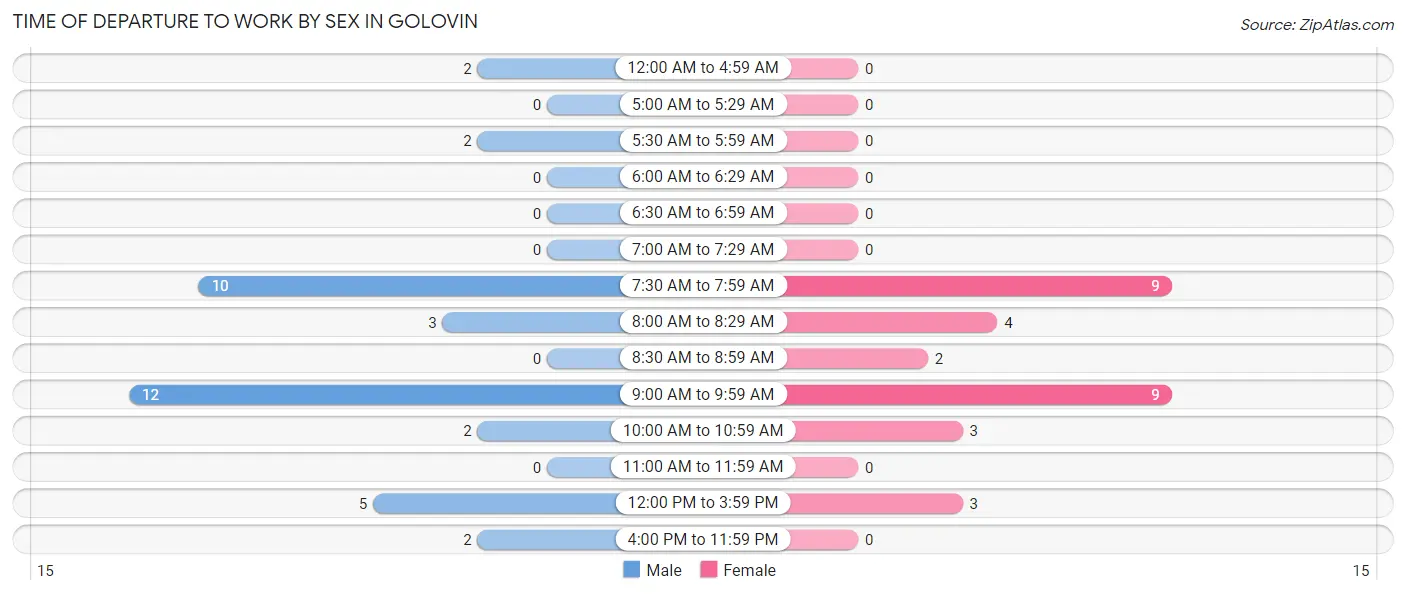
The most frequent times of departure to work in Golovin are 9:00 AM to 9:59 AM (12, 31.6%) for males and 7:30 AM to 7:59 AM (9, 30.0%) for females.
| Time of Departure | Male | Female |
| 12:00 AM to 4:59 AM | 2 (5.3%) | 0 (0.0%) |
| 5:00 AM to 5:29 AM | 0 (0.0%) | 0 (0.0%) |
| 5:30 AM to 5:59 AM | 2 (5.3%) | 0 (0.0%) |
| 6:00 AM to 6:29 AM | 0 (0.0%) | 0 (0.0%) |
| 6:30 AM to 6:59 AM | 0 (0.0%) | 0 (0.0%) |
| 7:00 AM to 7:29 AM | 0 (0.0%) | 0 (0.0%) |
| 7:30 AM to 7:59 AM | 10 (26.3%) | 9 (30.0%) |
| 8:00 AM to 8:29 AM | 3 (7.9%) | 4 (13.3%) |
| 8:30 AM to 8:59 AM | 0 (0.0%) | 2 (6.7%) |
| 9:00 AM to 9:59 AM | 12 (31.6%) | 9 (30.0%) |
| 10:00 AM to 10:59 AM | 2 (5.3%) | 3 (10.0%) |
| 11:00 AM to 11:59 AM | 0 (0.0%) | 0 (0.0%) |
| 12:00 PM to 3:59 PM | 5 (13.2%) | 3 (10.0%) |
| 4:00 PM to 11:59 PM | 2 (5.3%) | 0 (0.0%) |
| Total | 38 (100.0%) | 30 (100.0%) |
Housing Occupancy in Golovin
Occupancy by Ownership in Golovin
Of the total 68 dwellings in Golovin, owner-occupied units account for 47 (69.1%), while renter-occupied units make up 21 (30.9%).
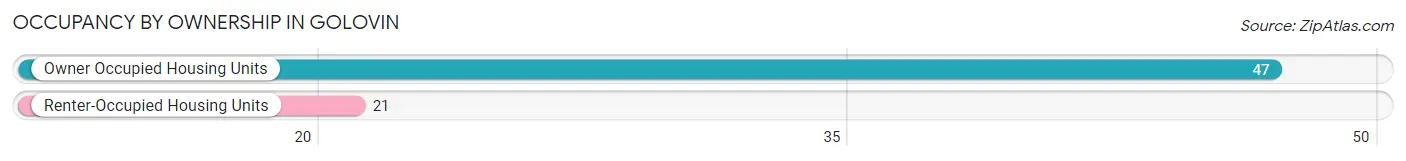
| Occupancy | # Housing Units | % Housing Units |
| Owner Occupied Housing Units | 47 | 69.1% |
| Renter-Occupied Housing Units | 21 | 30.9% |
| Total Occupied Housing Units | 68 | 100.0% |
Occupancy by Household Size in Golovin
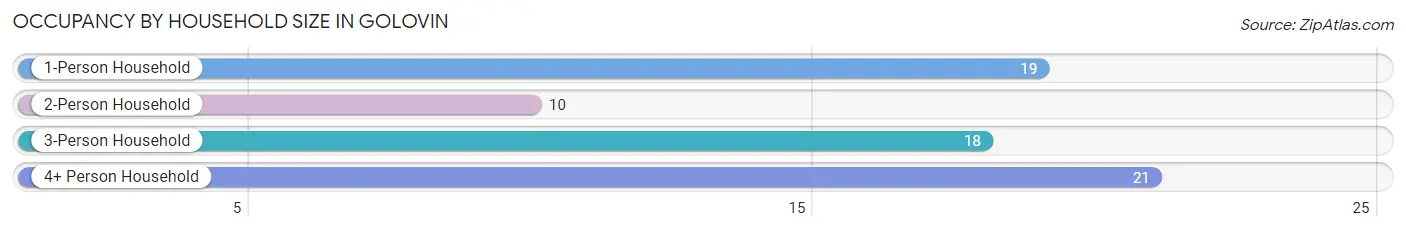
| Household Size | # Housing Units | % Housing Units |
| 1-Person Household | 19 | 27.9% |
| 2-Person Household | 10 | 14.7% |
| 3-Person Household | 18 | 26.5% |
| 4+ Person Household | 21 | 30.9% |
| Total Housing Units | 68 | 100.0% |
Occupancy by Ownership by Household Size in Golovin
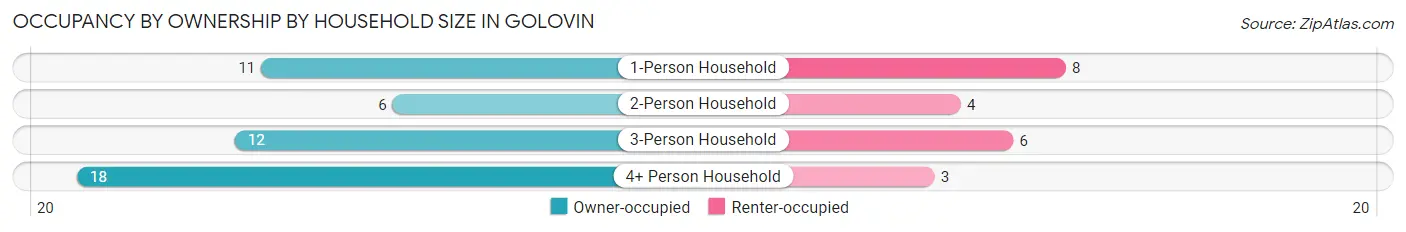
| Household Size | Owner-occupied | Renter-occupied |
| 1-Person Household | 11 (57.9%) | 8 (42.1%) |
| 2-Person Household | 6 (60.0%) | 4 (40.0%) |
| 3-Person Household | 12 (66.7%) | 6 (33.3%) |
| 4+ Person Household | 18 (85.7%) | 3 (14.3%) |
| Total Housing Units | 47 (69.1%) | 21 (30.9%) |
Occupancy by Educational Attainment in Golovin
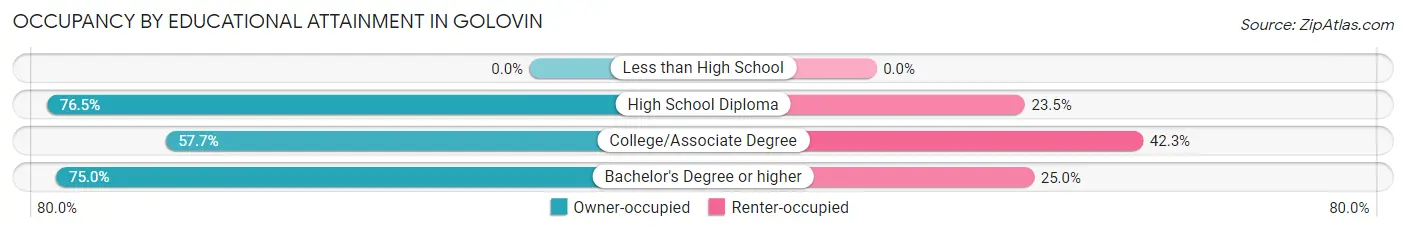
| Household Size | Owner-occupied | Renter-occupied |
| Less than High School | 0 (0.0%) | 0 (0.0%) |
| High School Diploma | 26 (76.5%) | 8 (23.5%) |
| College/Associate Degree | 15 (57.7%) | 11 (42.3%) |
| Bachelor's Degree or higher | 6 (75.0%) | 2 (25.0%) |
Occupancy by Age of Householder in Golovin
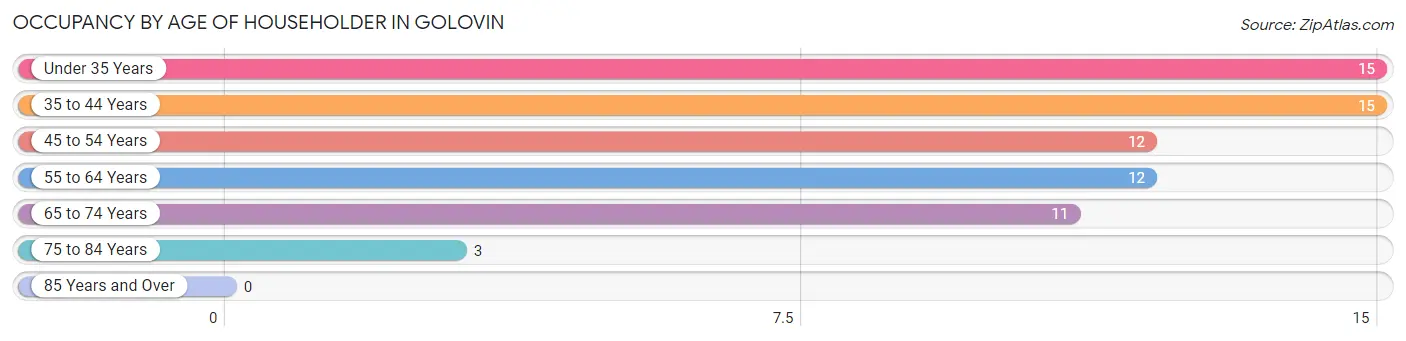
| Age Bracket | # Households | % Households |
| Under 35 Years | 15 | 22.1% |
| 35 to 44 Years | 15 | 22.1% |
| 45 to 54 Years | 12 | 17.6% |
| 55 to 64 Years | 12 | 17.6% |
| 65 to 74 Years | 11 | 16.2% |
| 75 to 84 Years | 3 | 4.4% |
| 85 Years and Over | 0 | 0.0% |
| Total | 68 | 100.0% |
Housing Finances in Golovin
Median Income by Occupancy in Golovin
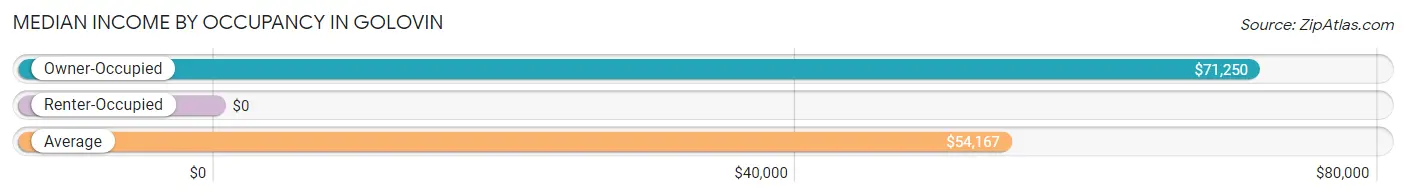
| Occupancy Type | # Households | Median Income |
| Owner-Occupied | 47 (69.1%) | $71,250 |
| Renter-Occupied | 21 (30.9%) | $0 |
| Average | 68 (100.0%) | $54,167 |
Occupancy by Householder Income Bracket in Golovin
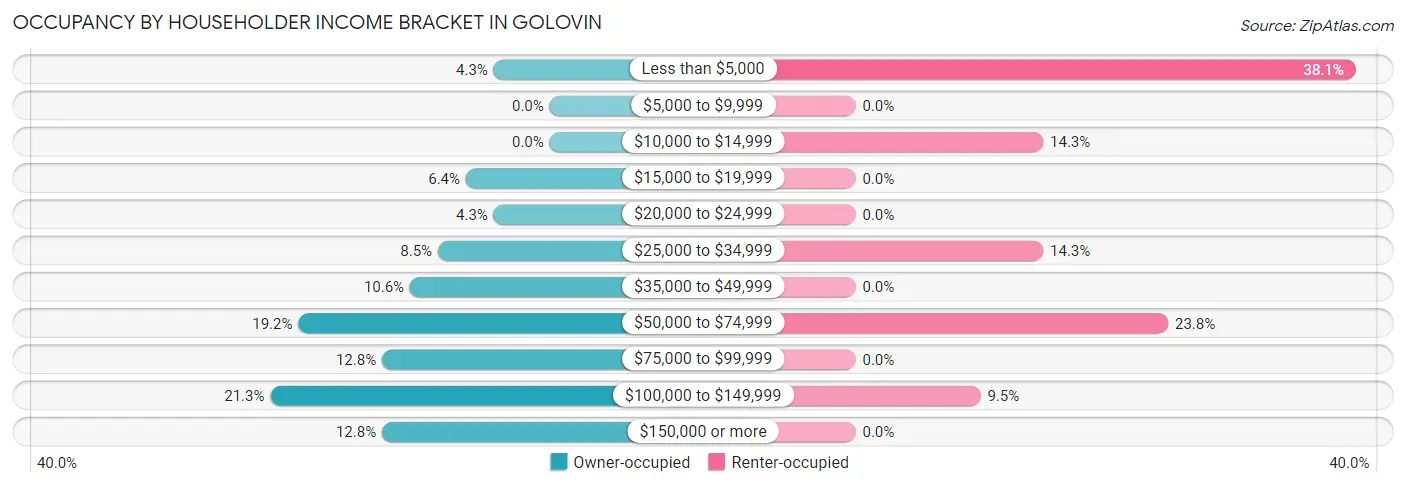
| Income Bracket | Owner-occupied | Renter-occupied |
| Less than $5,000 | 2 (4.3%) | 8 (38.1%) |
| $5,000 to $9,999 | 0 (0.0%) | 0 (0.0%) |
| $10,000 to $14,999 | 0 (0.0%) | 3 (14.3%) |
| $15,000 to $19,999 | 3 (6.4%) | 0 (0.0%) |
| $20,000 to $24,999 | 2 (4.3%) | 0 (0.0%) |
| $25,000 to $34,999 | 4 (8.5%) | 3 (14.3%) |
| $35,000 to $49,999 | 5 (10.6%) | 0 (0.0%) |
| $50,000 to $74,999 | 9 (19.2%) | 5 (23.8%) |
| $75,000 to $99,999 | 6 (12.8%) | 0 (0.0%) |
| $100,000 to $149,999 | 10 (21.3%) | 2 (9.5%) |
| $150,000 or more | 6 (12.8%) | 0 (0.0%) |
| Total | 47 (100.0%) | 21 (100.0%) |
Monthly Housing Cost Tiers in Golovin
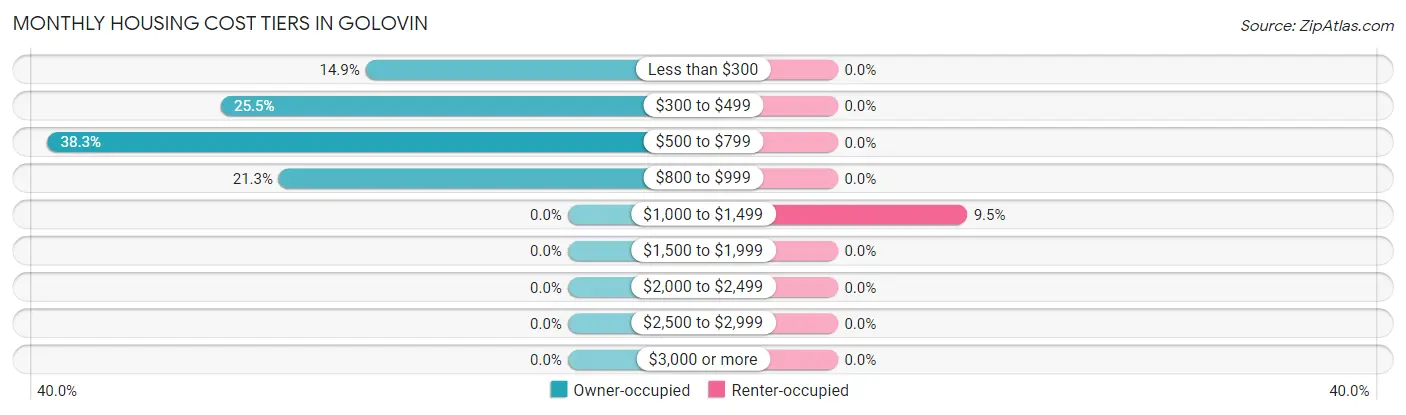
| Monthly Cost | Owner-occupied | Renter-occupied |
| Less than $300 | 7 (14.9%) | 0 (0.0%) |
| $300 to $499 | 12 (25.5%) | 0 (0.0%) |
| $500 to $799 | 18 (38.3%) | 0 (0.0%) |
| $800 to $999 | 10 (21.3%) | 0 (0.0%) |
| $1,000 to $1,499 | 0 (0.0%) | 2 (9.5%) |
| $1,500 to $1,999 | 0 (0.0%) | 0 (0.0%) |
| $2,000 to $2,499 | 0 (0.0%) | 0 (0.0%) |
| $2,500 to $2,999 | 0 (0.0%) | 0 (0.0%) |
| $3,000 or more | 0 (0.0%) | 0 (0.0%) |
| Total | 47 (100.0%) | 21 (100.0%) |
Physical Housing Characteristics in Golovin
Housing Structures in Golovin
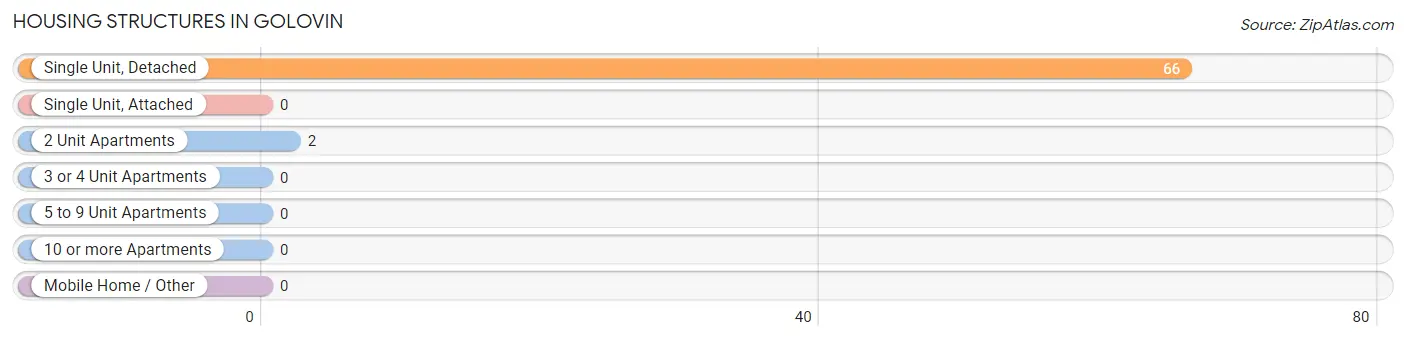
| Structure Type | # Housing Units | % Housing Units |
| Single Unit, Detached | 66 | 97.1% |
| Single Unit, Attached | 0 | 0.0% |
| 2 Unit Apartments | 2 | 2.9% |
| 3 or 4 Unit Apartments | 0 | 0.0% |
| 5 to 9 Unit Apartments | 0 | 0.0% |
| 10 or more Apartments | 0 | 0.0% |
| Mobile Home / Other | 0 | 0.0% |
| Total | 68 | 100.0% |
Housing Structures by Occupancy in Golovin
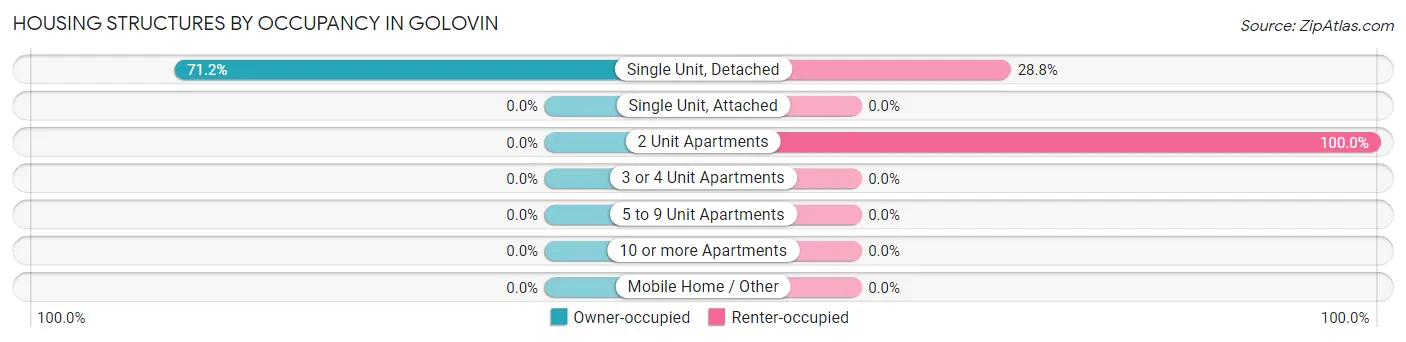
| Structure Type | Owner-occupied | Renter-occupied |
| Single Unit, Detached | 47 (71.2%) | 19 (28.8%) |
| Single Unit, Attached | 0 (0.0%) | 0 (0.0%) |
| 2 Unit Apartments | 0 (0.0%) | 2 (100.0%) |
| 3 or 4 Unit Apartments | 0 (0.0%) | 0 (0.0%) |
| 5 to 9 Unit Apartments | 0 (0.0%) | 0 (0.0%) |
| 10 or more Apartments | 0 (0.0%) | 0 (0.0%) |
| Mobile Home / Other | 0 (0.0%) | 0 (0.0%) |
| Total | 47 (69.1%) | 21 (30.9%) |
Housing Structures by Number of Rooms in Golovin
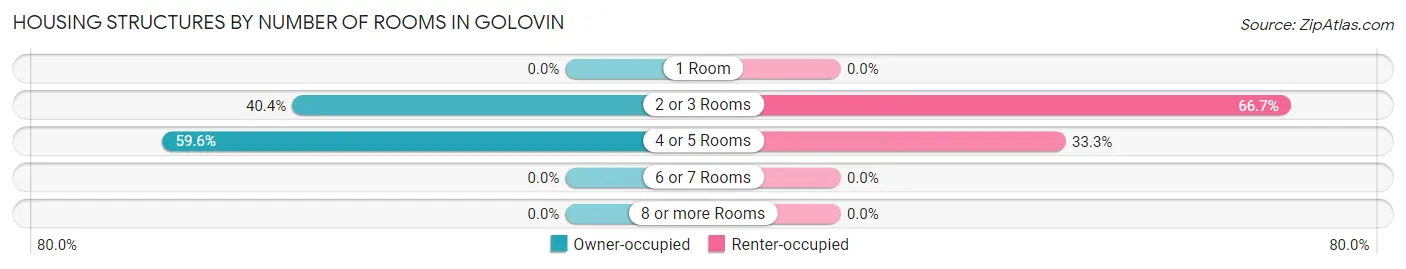
| Number of Rooms | Owner-occupied | Renter-occupied |
| 1 Room | 0 (0.0%) | 0 (0.0%) |
| 2 or 3 Rooms | 19 (40.4%) | 14 (66.7%) |
| 4 or 5 Rooms | 28 (59.6%) | 7 (33.3%) |
| 6 or 7 Rooms | 0 (0.0%) | 0 (0.0%) |
| 8 or more Rooms | 0 (0.0%) | 0 (0.0%) |
| Total | 47 (100.0%) | 21 (100.0%) |
Housing Structure by Heating Type in Golovin
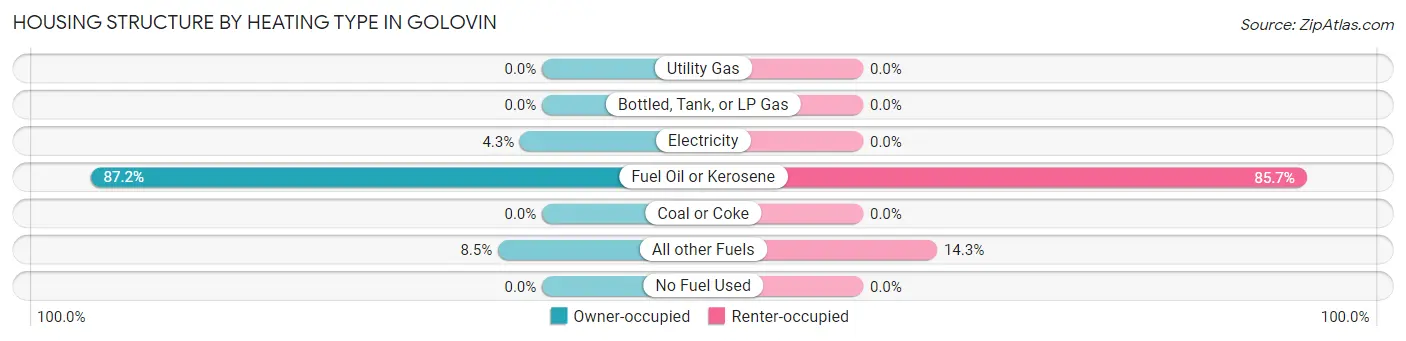
| Heating Type | Owner-occupied | Renter-occupied |
| Utility Gas | 0 (0.0%) | 0 (0.0%) |
| Bottled, Tank, or LP Gas | 0 (0.0%) | 0 (0.0%) |
| Electricity | 2 (4.3%) | 0 (0.0%) |
| Fuel Oil or Kerosene | 41 (87.2%) | 18 (85.7%) |
| Coal or Coke | 0 (0.0%) | 0 (0.0%) |
| All other Fuels | 4 (8.5%) | 3 (14.3%) |
| No Fuel Used | 0 (0.0%) | 0 (0.0%) |
| Total | 47 (100.0%) | 21 (100.0%) |
Household Vehicle Usage in Golovin
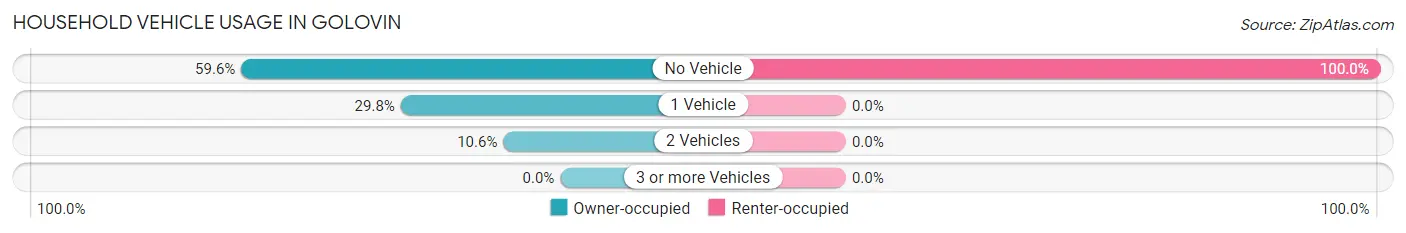
| Vehicles per Household | Owner-occupied | Renter-occupied |
| No Vehicle | 28 (59.6%) | 21 (100.0%) |
| 1 Vehicle | 14 (29.8%) | 0 (0.0%) |
| 2 Vehicles | 5 (10.6%) | 0 (0.0%) |
| 3 or more Vehicles | 0 (0.0%) | 0 (0.0%) |
| Total | 47 (100.0%) | 21 (100.0%) |
Real Estate & Mortgages in Golovin
Real Estate and Mortgage Overview in Golovin
| Characteristic | Without Mortgage | With Mortgage |
| Housing Units | 42 | 5 |
| Median Property Value | $87,500 | $0 |
| Median Household Income | $66,250 | $0 |
| Monthly Housing Costs | $520 | $0 |
| Real Estate Taxes | - | - |
Property Value by Mortgage Status in Golovin
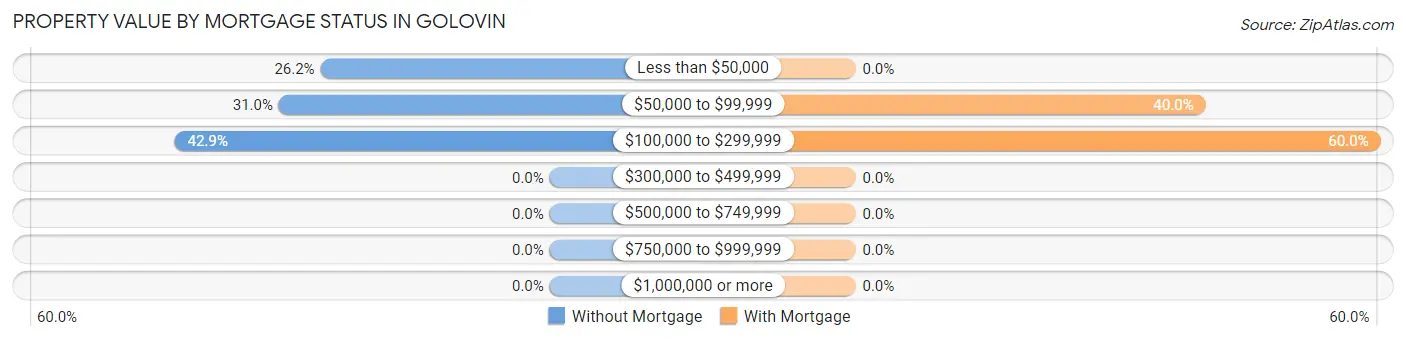
| Property Value | Without Mortgage | With Mortgage |
| Less than $50,000 | 11 (26.2%) | 0 (0.0%) |
| $50,000 to $99,999 | 13 (30.9%) | 2 (40.0%) |
| $100,000 to $299,999 | 18 (42.9%) | 3 (60.0%) |
| $300,000 to $499,999 | 0 (0.0%) | 0 (0.0%) |
| $500,000 to $749,999 | 0 (0.0%) | 0 (0.0%) |
| $750,000 to $999,999 | 0 (0.0%) | 0 (0.0%) |
| $1,000,000 or more | 0 (0.0%) | 0 (0.0%) |
| Total | 42 (100.0%) | 5 (100.0%) |
Household Income by Mortgage Status in Golovin
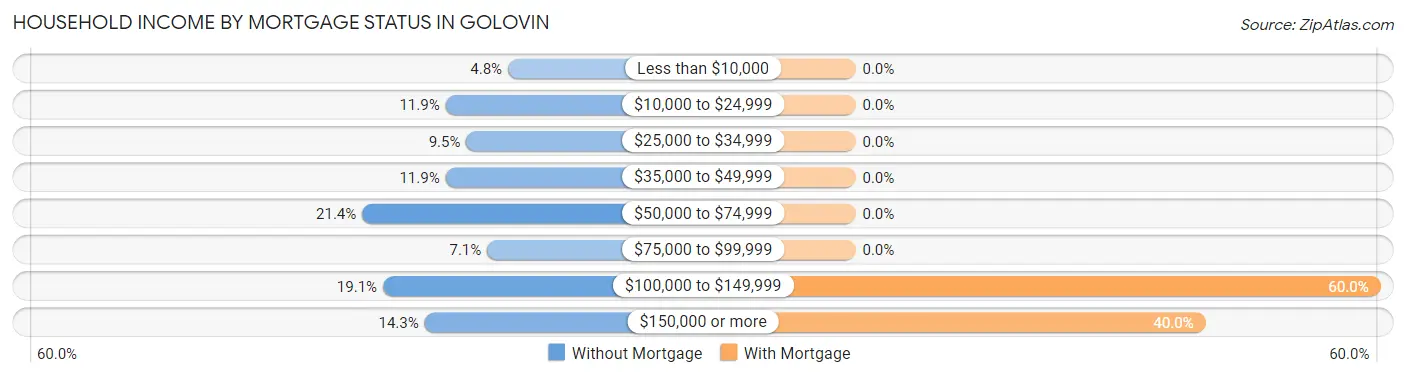
| Household Income | Without Mortgage | With Mortgage |
| Less than $10,000 | 2 (4.8%) | 0 (0.0%) |
| $10,000 to $24,999 | 5 (11.9%) | 0 (0.0%) |
| $25,000 to $34,999 | 4 (9.5%) | 0 (0.0%) |
| $35,000 to $49,999 | 5 (11.9%) | 0 (0.0%) |
| $50,000 to $74,999 | 9 (21.4%) | 0 (0.0%) |
| $75,000 to $99,999 | 3 (7.1%) | 0 (0.0%) |
| $100,000 to $149,999 | 8 (19.1%) | 3 (60.0%) |
| $150,000 or more | 6 (14.3%) | 2 (40.0%) |
| Total | 42 (100.0%) | 5 (100.0%) |
Property Value to Household Income Ratio in Golovin
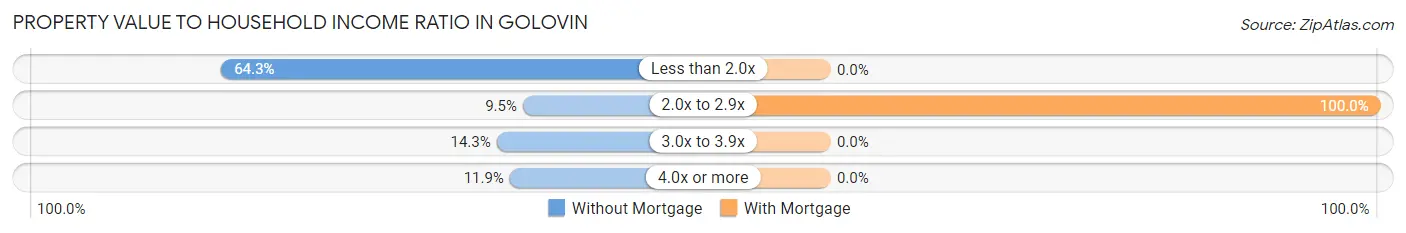
| Value-to-Income Ratio | Without Mortgage | With Mortgage |
| Less than 2.0x | 27 (64.3%) | 0 (0.0%) |
| 2.0x to 2.9x | 4 (9.5%) | 5 (100.0%) |
| 3.0x to 3.9x | 6 (14.3%) | 0 (0.0%) |
| 4.0x or more | 5 (11.9%) | 0 (0.0%) |
| Total | 42 (100.0%) | 5 (100.0%) |
Real Estate Taxes by Mortgage Status in Golovin
| Property Taxes | Without Mortgage | With Mortgage |
| Less than $800 | 0 (0.0%) | 0 (0.0%) |
| $800 to $1,499 | 0 (0.0%) | 0 (0.0%) |
| $800 to $1,499 | 0 (0.0%) | 0 (0.0%) |
| Total | 42 (100.0%) | 5 (100.0%) |
Health & Disability in Golovin
Health Insurance Coverage by Age in Golovin
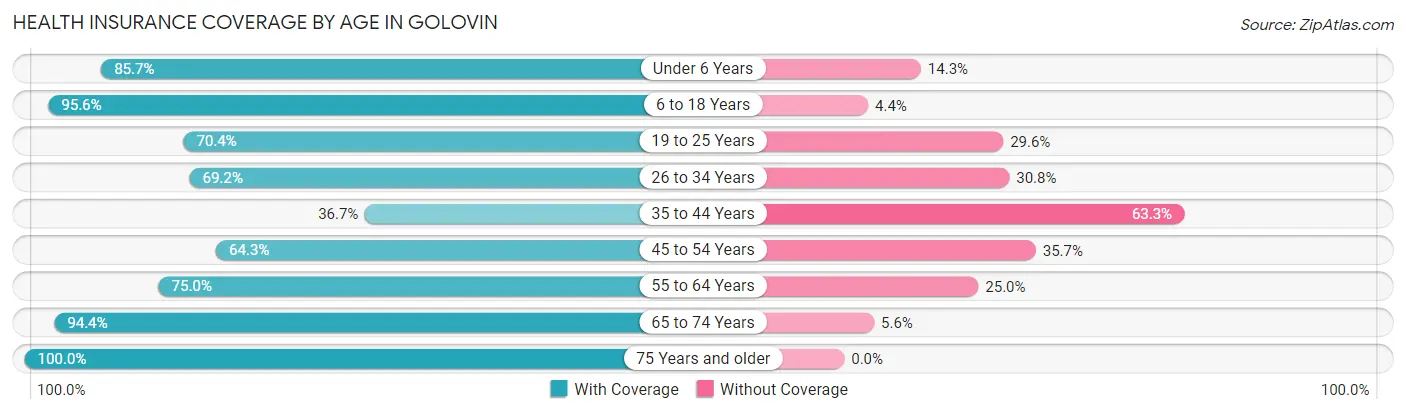
| Age Bracket | With Coverage | Without Coverage |
| Under 6 Years | 12 (85.7%) | 2 (14.3%) |
| 6 to 18 Years | 43 (95.6%) | 2 (4.4%) |
| 19 to 25 Years | 19 (70.4%) | 8 (29.6%) |
| 26 to 34 Years | 9 (69.2%) | 4 (30.8%) |
| 35 to 44 Years | 11 (36.7%) | 19 (63.3%) |
| 45 to 54 Years | 9 (64.3%) | 5 (35.7%) |
| 55 to 64 Years | 15 (75.0%) | 5 (25.0%) |
| 65 to 74 Years | 17 (94.4%) | 1 (5.6%) |
| 75 Years and older | 4 (100.0%) | 0 (0.0%) |
| Total | 139 (75.1%) | 46 (24.9%) |
Health Insurance Coverage by Citizenship Status in Golovin
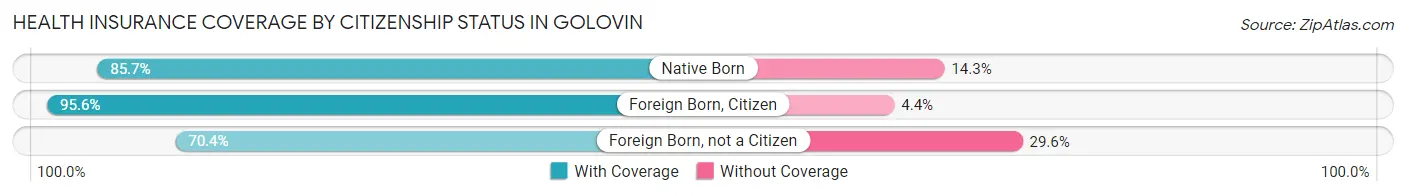
| Citizenship Status | With Coverage | Without Coverage |
| Native Born | 12 (85.7%) | 2 (14.3%) |
| Foreign Born, Citizen | 43 (95.6%) | 2 (4.4%) |
| Foreign Born, not a Citizen | 19 (70.4%) | 8 (29.6%) |
Health Insurance Coverage by Household Income in Golovin
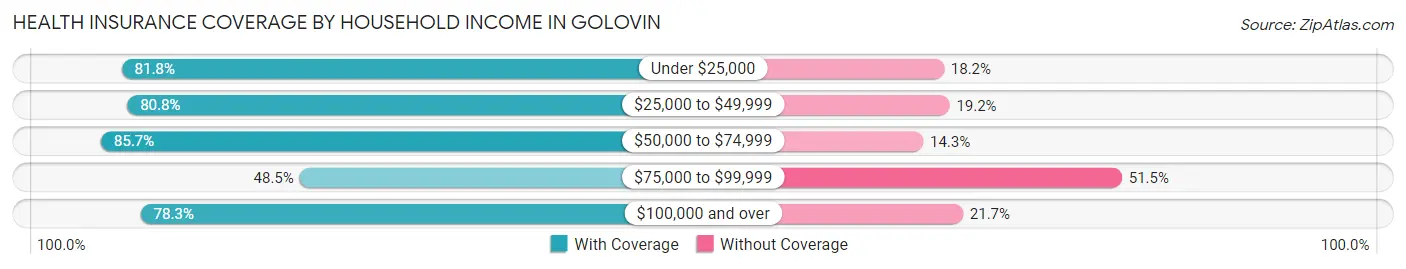
| Household Income | With Coverage | Without Coverage |
| Under $25,000 | 18 (81.8%) | 4 (18.2%) |
| $25,000 to $49,999 | 21 (80.8%) | 5 (19.2%) |
| $50,000 to $74,999 | 30 (85.7%) | 5 (14.3%) |
| $75,000 to $99,999 | 16 (48.5%) | 17 (51.5%) |
| $100,000 and over | 54 (78.3%) | 15 (21.7%) |
Public vs Private Health Insurance Coverage by Age in Golovin
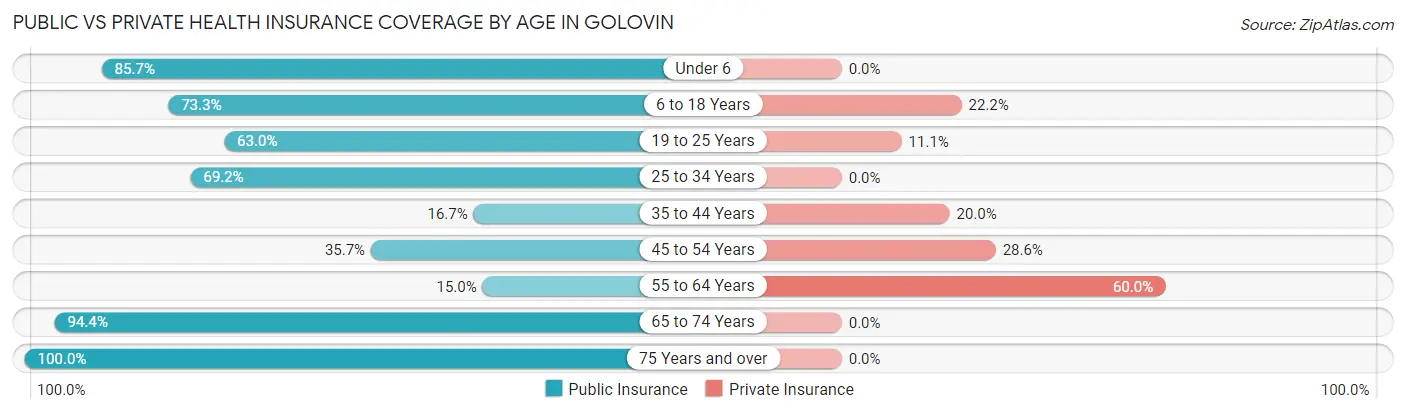
| Age Bracket | Public Insurance | Private Insurance |
| Under 6 | 12 (85.7%) | 0 (0.0%) |
| 6 to 18 Years | 33 (73.3%) | 10 (22.2%) |
| 19 to 25 Years | 17 (63.0%) | 3 (11.1%) |
| 25 to 34 Years | 9 (69.2%) | 0 (0.0%) |
| 35 to 44 Years | 5 (16.7%) | 6 (20.0%) |
| 45 to 54 Years | 5 (35.7%) | 4 (28.6%) |
| 55 to 64 Years | 3 (15.0%) | 12 (60.0%) |
| 65 to 74 Years | 17 (94.4%) | 0 (0.0%) |
| 75 Years and over | 4 (100.0%) | 0 (0.0%) |
| Total | 105 (56.8%) | 35 (18.9%) |
Disability Status by Sex by Age in Golovin
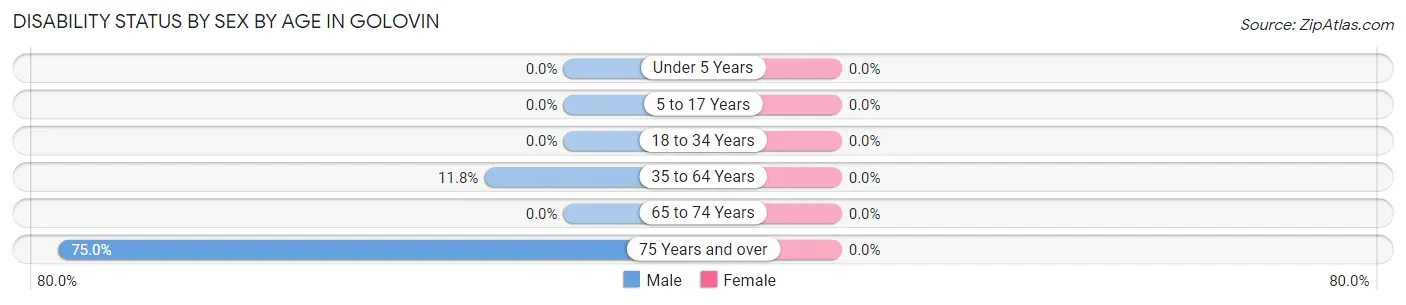
| Age Bracket | Male | Female |
| Under 5 Years | 0 (0.0%) | 0 (0.0%) |
| 5 to 17 Years | 0 (0.0%) | 0 (0.0%) |
| 18 to 34 Years | 0 (0.0%) | 0 (0.0%) |
| 35 to 64 Years | 4 (11.8%) | 0 (0.0%) |
| 65 to 74 Years | 0 (0.0%) | 0 (0.0%) |
| 75 Years and over | 3 (75.0%) | 0 (0.0%) |
Disability Class by Sex by Age in Golovin
Disability Class: Hearing Difficulty
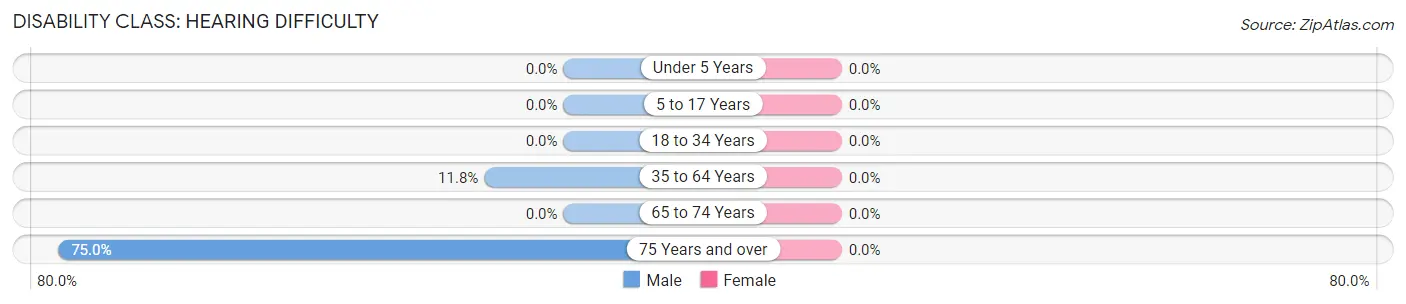
| Age Bracket | Male | Female |
| Under 5 Years | 0 (0.0%) | 0 (0.0%) |
| 5 to 17 Years | 0 (0.0%) | 0 (0.0%) |
| 18 to 34 Years | 0 (0.0%) | 0 (0.0%) |
| 35 to 64 Years | 4 (11.8%) | 0 (0.0%) |
| 65 to 74 Years | 0 (0.0%) | 0 (0.0%) |
| 75 Years and over | 3 (75.0%) | 0 (0.0%) |
Disability Class: Vision Difficulty
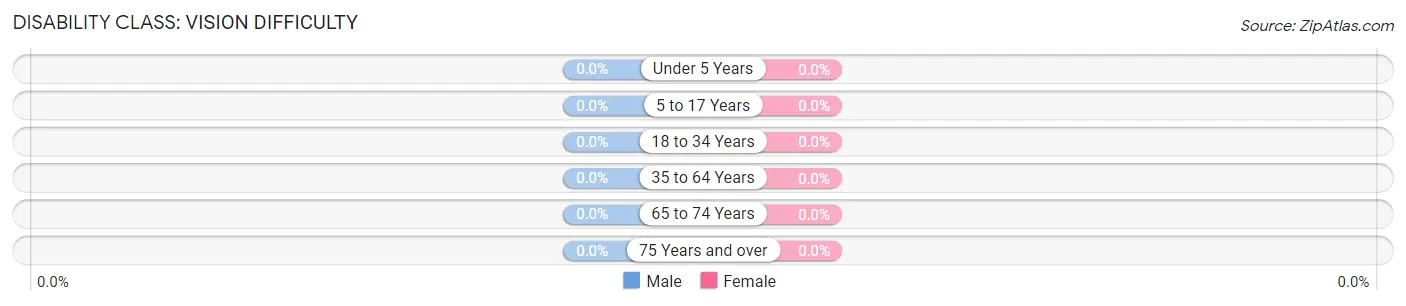
| Age Bracket | Male | Female |
| Under 5 Years | 0 (0.0%) | 0 (0.0%) |
| 5 to 17 Years | 0 (0.0%) | 0 (0.0%) |
| 18 to 34 Years | 0 (0.0%) | 0 (0.0%) |
| 35 to 64 Years | 0 (0.0%) | 0 (0.0%) |
| 65 to 74 Years | 0 (0.0%) | 0 (0.0%) |
| 75 Years and over | 0 (0.0%) | 0 (0.0%) |
Disability Class: Cognitive Difficulty
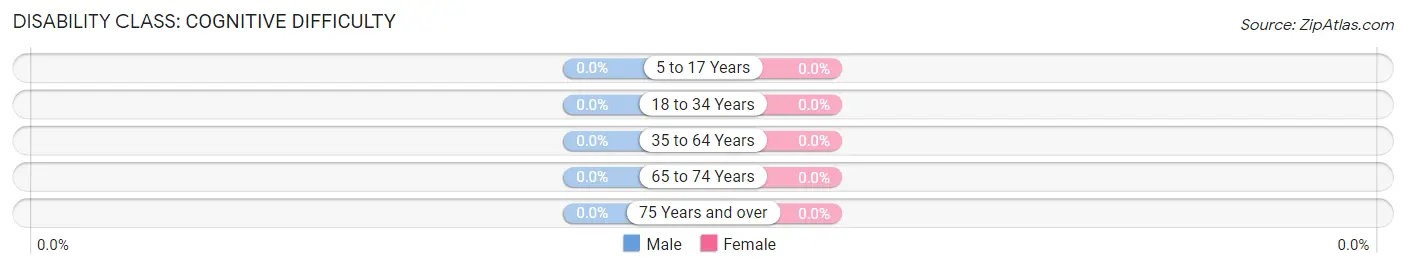
| Age Bracket | Male | Female |
| 5 to 17 Years | 0 (0.0%) | 0 (0.0%) |
| 18 to 34 Years | 0 (0.0%) | 0 (0.0%) |
| 35 to 64 Years | 0 (0.0%) | 0 (0.0%) |
| 65 to 74 Years | 0 (0.0%) | 0 (0.0%) |
| 75 Years and over | 0 (0.0%) | 0 (0.0%) |
Disability Class: Ambulatory Difficulty
| Age Bracket | Male | Female |
| 5 to 17 Years | 0 (0.0%) | 0 (0.0%) |
| 18 to 34 Years | 0 (0.0%) | 0 (0.0%) |
| 35 to 64 Years | 0 (0.0%) | 0 (0.0%) |
| 65 to 74 Years | 0 (0.0%) | 0 (0.0%) |
| 75 Years and over | 0 (0.0%) | 0 (0.0%) |
Disability Class: Self-Care Difficulty
| Age Bracket | Male | Female |
| 5 to 17 Years | 0 (0.0%) | 0 (0.0%) |
| 18 to 34 Years | 0 (0.0%) | 0 (0.0%) |
| 35 to 64 Years | 0 (0.0%) | 0 (0.0%) |
| 65 to 74 Years | 0 (0.0%) | 0 (0.0%) |
| 75 Years and over | 0 (0.0%) | 0 (0.0%) |
Technology Access in Golovin
Computing Device Access in Golovin
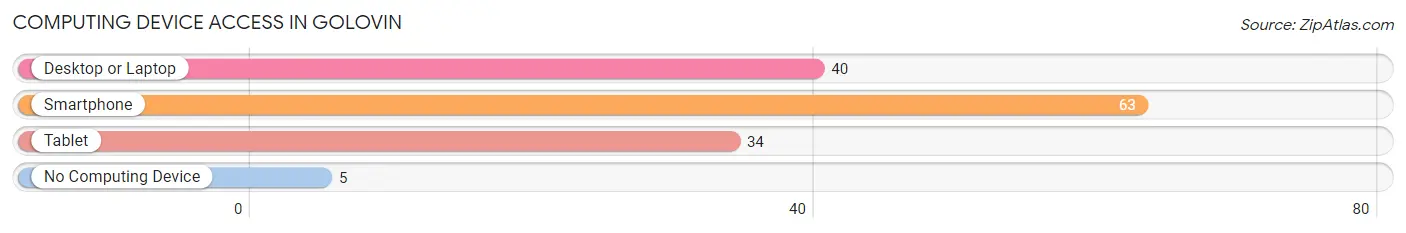
| Device Type | # Households | % Households |
| Desktop or Laptop | 40 | 58.8% |
| Smartphone | 63 | 92.6% |
| Tablet | 34 | 50.0% |
| No Computing Device | 5 | 7.3% |
| Total | 68 | 100.0% |
Internet Access in Golovin
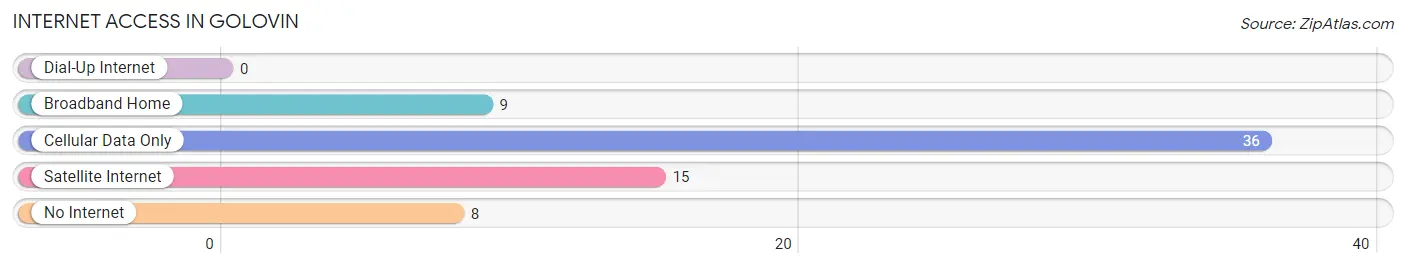
| Internet Type | # Households | % Households |
| Dial-Up Internet | 0 | 0.0% |
| Broadband Home | 9 | 13.2% |
| Cellular Data Only | 36 | 52.9% |
| Satellite Internet | 15 | 22.1% |
| No Internet | 8 | 11.8% |
| Total | 68 | 100.0% |
Golovin Summary
Golovin is a small city located in the Nome Census Area of Alaska. It is situated on the Seward Peninsula, on the south shore of Golovin Bay, about 25 miles east of Nome. The city has a population of about 300 people, and is the only incorporated city in the Nome Census Area.
History
Golovin was first settled by the Inupiat people in the late 1800s. The city was named after the Russian explorer, Vasili Golovnin, who explored the area in 1818. The first non-native settlers arrived in the area in the early 1900s, and the city was incorporated in 1912.
Golovin was an important trading center for the Inupiat people, and the city was a major hub for the fur trade. The city also served as a supply center for gold miners during the Nome Gold Rush of 1898.
In the early 1900s, the city was a major port for the Alaska Steamship Company, and the city was a major stop for ships traveling between Seattle and Nome. The city was also a major stop for the Alaska Railroad, which ran from Seward to Nome.
Geography
Golovin is located on the south shore of Golovin Bay, about 25 miles east of Nome. The city is situated on a flat plain, and is surrounded by mountains. The city is located in the Nome Census Area, and is the only incorporated city in the area.
The climate in Golovin is subarctic, with cold winters and mild summers. The average temperature in the summer is around 50°F, and the average temperature in the winter is around 10°F.
Economy
The economy of Golovin is largely based on fishing and tourism. The city is home to a number of commercial fishing operations, and the city is a popular destination for sport fishing. The city also has a number of tourist attractions, including the Golovin Bay Museum and the Golovin Bay Lighthouse.
Demographics
As of the 2010 census, the population of Golovin was 300 people. The racial makeup of the city was 95.3% Native American, 2.7% White, 0.3% Asian, and 1.7% from other races. The median household income in the city was $41,250, and the median family income was $50,000.
Conclusion
Golovin is a small city located in the Nome Census Area of Alaska. It is situated on the Seward Peninsula, on the south shore of Golovin Bay, about 25 miles east of Nome. The city has a population of about 300 people, and is the only incorporated city in the Nome Census Area. The economy of Golovin is largely based on fishing and tourism, and the city is home to a number of commercial fishing operations. The racial makeup of the city is 95.3% Native American, 2.7% White, 0.3% Asian, and 1.7% from other races. The median household income in the city was $41,250, and the median family income was $50,000.
Common Questions
What is Per Capita Income in Golovin?
Per Capita income in Golovin is $24,637.
What is the Median Family Income in Golovin?
Median Family Income in Golovin is $66,875.
What is the Median Household income in Golovin?
Median Household Income in Golovin is $54,167.
What is Income or Wage Gap in Golovin?
Income or Wage Gap in Golovin is 42.5%.
Women in Golovin earn 57.5 cents for every dollar earned by a man.
What is Inequality or Gini Index in Golovin?
Inequality or Gini Index in Golovin is 0.46.
What is the Total Population of Golovin?
Total Population of Golovin is 185.
What is the Total Male Population of Golovin?
Total Male Population of Golovin is 115.
What is the Total Female Population of Golovin?
Total Female Population of Golovin is 70.
What is the Ratio of Males per 100 Females in Golovin?
There are 164.29 Males per 100 Females in Golovin.
What is the Ratio of Females per 100 Males in Golovin?
There are 60.87 Females per 100 Males in Golovin.
What is the Median Population Age in Golovin?
Median Population Age in Golovin is 28.8 Years.
What is the Average Family Size in Golovin
Average Family Size in Golovin is 3.2 People.
What is the Average Household Size in Golovin
Average Household Size in Golovin is 2.7 People.
How Large is the Labor Force in Golovin?
There are 97 People in the Labor Forcein in Golovin.
What is the Percentage of People in the Labor Force in Golovin?
71.3% of People are in the Labor Force in Golovin.
What is the Unemployment Rate in Golovin?
Unemployment Rate in Golovin is 16.5%.