Fox River, AK Map & Demographics
Fox River Map
Fox River Overview
$18,315
PER CAPITA INCOME
$70,313
AVG FAMILY INCOME
$70,938
AVG HOUSEHOLD INCOME
29.5%
WAGE / INCOME GAP [ % ]
70.5¢/ $1
WAGE / INCOME GAP [ $ ]
0.41
INEQUALITY / GINI INDEX
712
TOTAL POPULATION
341
MALE POPULATION
371
FEMALE POPULATION
91.91
MALES / 100 FEMALES
108.80
FEMALES / 100 MALES
22.0
MEDIAN AGE
4.5
AVG FAMILY SIZE
4.3
AVG HOUSEHOLD SIZE
239
LABOR FORCE [ PEOPLE ]
57.0%
PERCENT IN LABOR FORCE
15.5%
UNEMPLOYMENT RATE
Income in Fox River
Income Overview in Fox River
Per Capita Income in Fox River is $18,315, while median incomes of families and households are $70,313 and $70,938 respectively.
| Characteristic | Number | Measure |
| Per Capita Income | 712 | $18,315 |
| Median Family Income | 151 | $70,313 |
| Mean Family Income | 151 | $70,400 |
| Median Household Income | 167 | $70,938 |
| Mean Household Income | 167 | $69,135 |
| Income Deficit | 151 | $0 |
| Wage / Income Gap (%) | 712 | 29.49% |
| Wage / Income Gap ($) | 712 | 70.51¢ per $1 |
| Gini / Inequality Index | 712 | 0.41 |
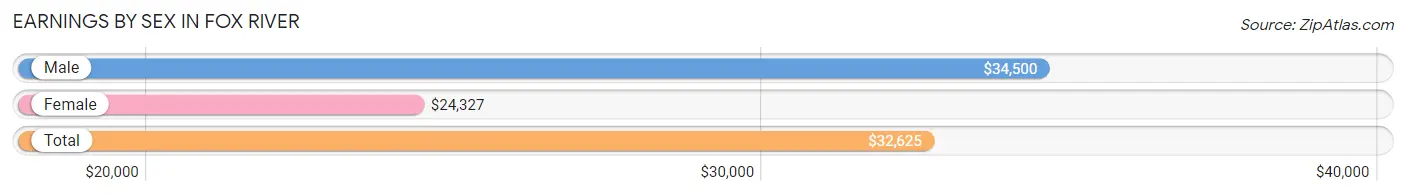
Earnings by Sex in Fox River
Average Earnings in Fox River are $32,625, $34,500 for men and $24,327 for women, a difference of 29.5%.
| Sex | Number | Average Earnings |
| Male | 172 (57.9%) | $34,500 |
| Female | 125 (42.1%) | $24,327 |
| Total | 297 (100.0%) | $32,625 |
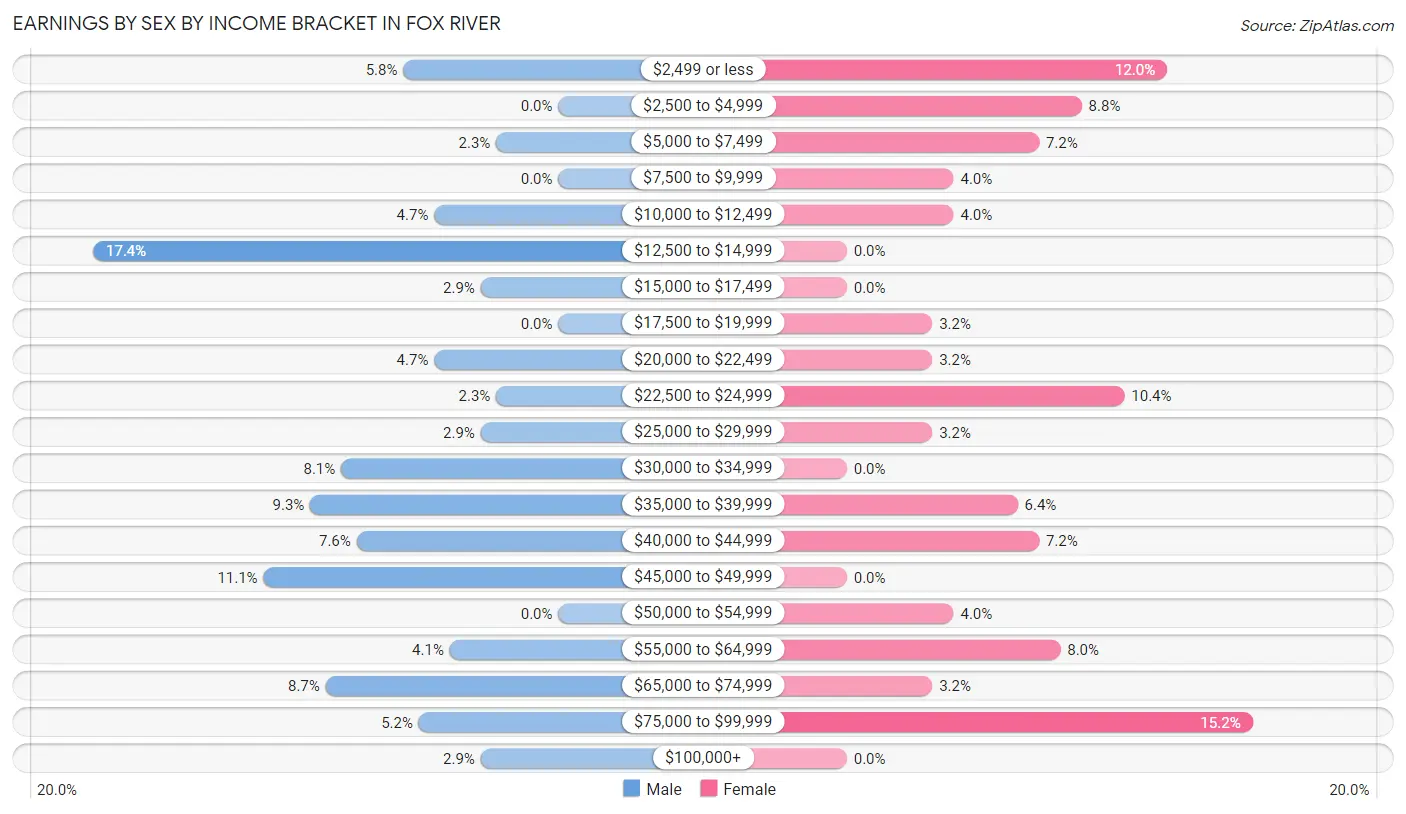
Earnings by Sex by Income Bracket in Fox River
The most common earnings brackets in Fox River are $12,500 to $14,999 for men (30 | 17.4%) and $75,000 to $99,999 for women (19 | 15.2%).
| Income | Male | Female |
| $2,499 or less | 10 (5.8%) | 15 (12.0%) |
| $2,500 to $4,999 | 0 (0.0%) | 11 (8.8%) |
| $5,000 to $7,499 | 4 (2.3%) | 9 (7.2%) |
| $7,500 to $9,999 | 0 (0.0%) | 5 (4.0%) |
| $10,000 to $12,499 | 8 (4.6%) | 5 (4.0%) |
| $12,500 to $14,999 | 30 (17.4%) | 0 (0.0%) |
| $15,000 to $17,499 | 5 (2.9%) | 0 (0.0%) |
| $17,500 to $19,999 | 0 (0.0%) | 4 (3.2%) |
| $20,000 to $22,499 | 8 (4.6%) | 4 (3.2%) |
| $22,500 to $24,999 | 4 (2.3%) | 13 (10.4%) |
| $25,000 to $29,999 | 5 (2.9%) | 4 (3.2%) |
| $30,000 to $34,999 | 14 (8.1%) | 0 (0.0%) |
| $35,000 to $39,999 | 16 (9.3%) | 8 (6.4%) |
| $40,000 to $44,999 | 13 (7.6%) | 9 (7.2%) |
| $45,000 to $49,999 | 19 (11.1%) | 0 (0.0%) |
| $50,000 to $54,999 | 0 (0.0%) | 5 (4.0%) |
| $55,000 to $64,999 | 7 (4.1%) | 10 (8.0%) |
| $65,000 to $74,999 | 15 (8.7%) | 4 (3.2%) |
| $75,000 to $99,999 | 9 (5.2%) | 19 (15.2%) |
| $100,000+ | 5 (2.9%) | 0 (0.0%) |
| Total | 172 (100.0%) | 125 (100.0%) |
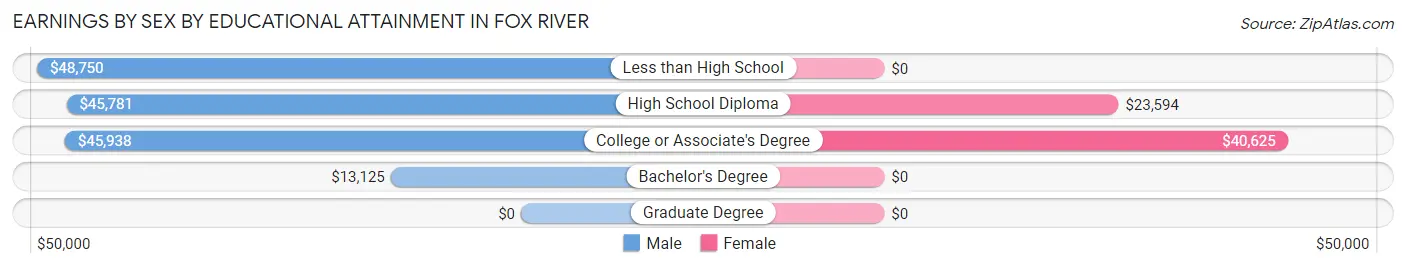
Earnings by Sex by Educational Attainment in Fox River
Average earnings in Fox River are $41,250 for men and $25,625 for women, a difference of 37.9%. Men with an educational attainment of less than high school enjoy the highest average annual earnings of $48,750, while those with bachelor's degree education earn the least with $13,125. Women with an educational attainment of college or associate's degree earn the most with the average annual earnings of $40,625, while those with high school diploma education have the smallest earnings of $23,594.
| Educational Attainment | Male Income | Female Income |
| Less than High School | $48,750 | $0 |
| High School Diploma | $45,781 | $23,594 |
| College or Associate's Degree | $45,938 | $40,625 |
| Bachelor's Degree | $13,125 | $0 |
| Graduate Degree | - | - |
| Total | $41,250 | $25,625 |
Family Income in Fox River
Family Income Brackets in Fox River
According to the Fox River family income data, there are 24 families falling into the $100,000 to $149,999 income range, which is the most common income bracket and makes up 15.9% of all families.
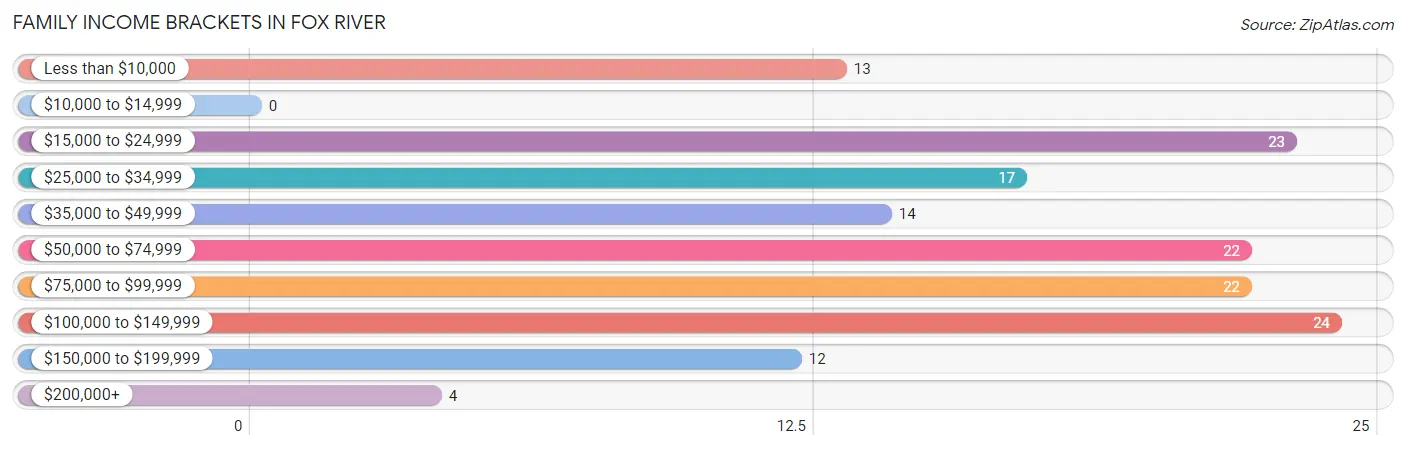
| Income Bracket | # Families | % Families |
| Less than $10,000 | 13 | 8.6% |
| $10,000 to $14,999 | 0 | 0.0% |
| $15,000 to $24,999 | 23 | 15.2% |
| $25,000 to $34,999 | 17 | 11.3% |
| $35,000 to $49,999 | 14 | 9.3% |
| $50,000 to $74,999 | 22 | 14.6% |
| $75,000 to $99,999 | 22 | 14.6% |
| $100,000 to $149,999 | 24 | 15.9% |
| $150,000 to $199,999 | 12 | 7.9% |
| $200,000+ | 4 | 2.6% |
Family Income by Famaliy Size in Fox River
3-person families (40 | 26.5%) account for the highest median family income in Fox River with $81,250 per family, while 2-person families (52 | 34.4%) have the highest median income of $37,125 per family member.
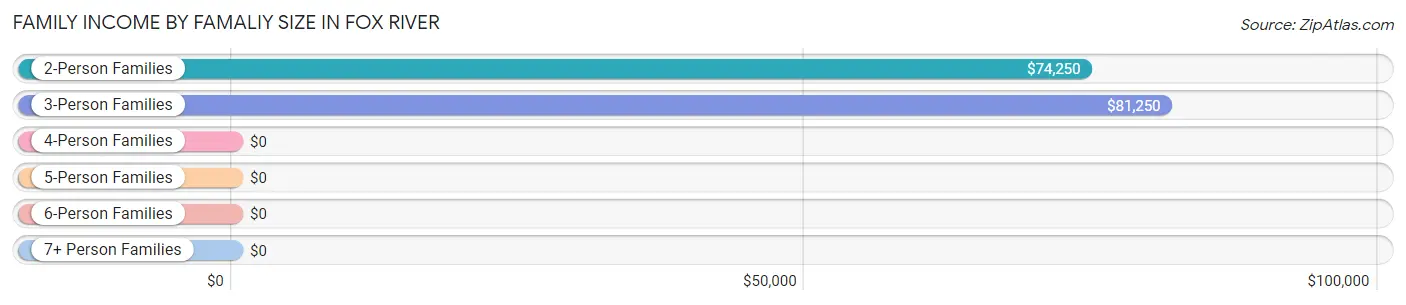
| Income Bracket | # Families | Median Income |
| 2-Person Families | 52 (34.4%) | $74,250 |
| 3-Person Families | 40 (26.5%) | $81,250 |
| 4-Person Families | 8 (5.3%) | $0 |
| 5-Person Families | 3 (2.0%) | $0 |
| 6-Person Families | 26 (17.2%) | $0 |
| 7+ Person Families | 22 (14.6%) | $0 |
| Total | 151 (100.0%) | $70,313 |
Family Income by Number of Earners in Fox River
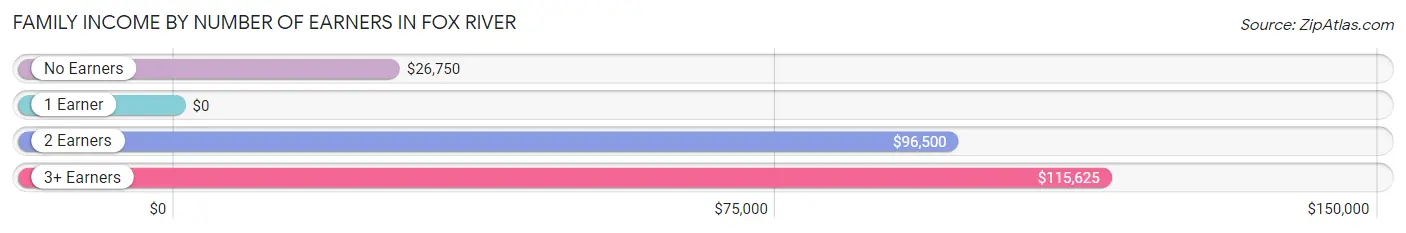
| Number of Earners | # Families | Median Income |
| No Earners | 23 (15.2%) | $26,750 |
| 1 Earner | 44 (29.1%) | $0 |
| 2 Earners | 62 (41.1%) | $96,500 |
| 3+ Earners | 22 (14.6%) | $115,625 |
| Total | 151 (100.0%) | $70,313 |
Household Income in Fox River
Household Income Brackets in Fox River
With 29 households falling in the category, the $100,000 to $149,999 income range is the most frequent in Fox River, accounting for 17.4% of all households.
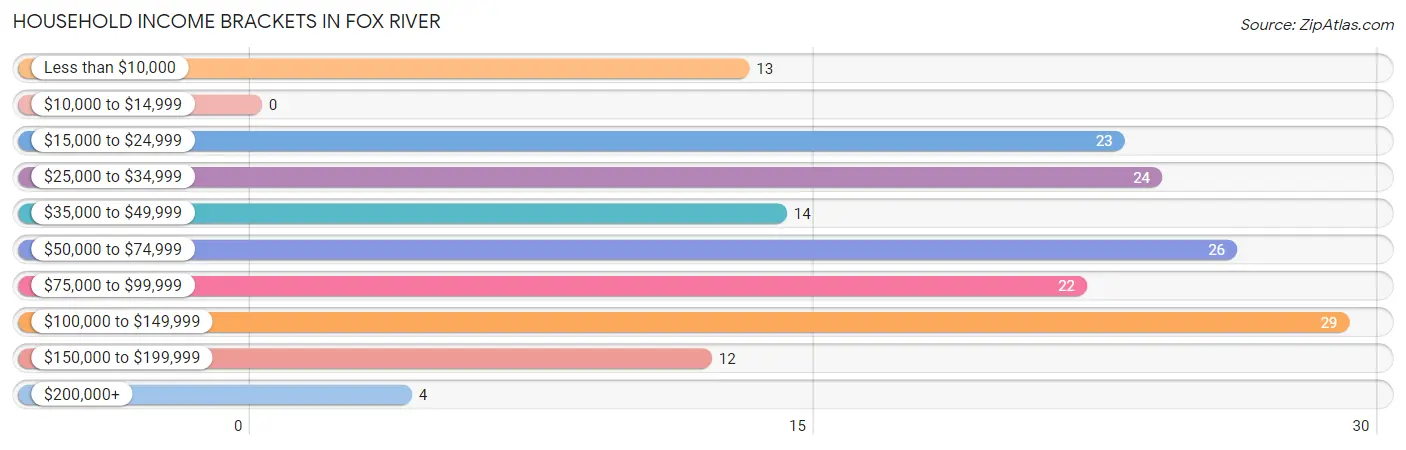
| Income Bracket | # Households | % Households |
| Less than $10,000 | 13 | 7.8% |
| $10,000 to $14,999 | 0 | 0.0% |
| $15,000 to $24,999 | 23 | 13.8% |
| $25,000 to $34,999 | 24 | 14.4% |
| $35,000 to $49,999 | 14 | 8.4% |
| $50,000 to $74,999 | 26 | 15.6% |
| $75,000 to $99,999 | 22 | 13.2% |
| $100,000 to $149,999 | 29 | 17.4% |
| $150,000 to $199,999 | 12 | 7.2% |
| $200,000+ | 4 | 2.4% |
Household Income by Householder Age in Fox River
The median household income in Fox River is $70,938, with the highest median household income of $95,750 found in the 45 to 64 years age bracket for the primary householder. A total of 45 households (27.0%) fall into this category. Meanwhile, the 15 to 24 years age bracket for the primary householder has the lowest median household income of $0, with 25 households (15.0%) in this group.
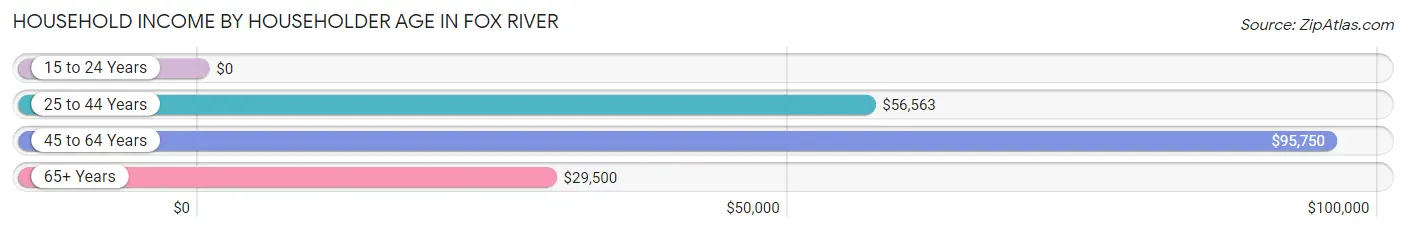
| Income Bracket | # Households | Median Income |
| 15 to 24 Years | 25 (15.0%) | $0 |
| 25 to 44 Years | 63 (37.7%) | $56,563 |
| 45 to 64 Years | 45 (27.0%) | $95,750 |
| 65+ Years | 34 (20.4%) | $29,500 |
| Total | 167 (100.0%) | $70,938 |
Poverty in Fox River
Income Below Poverty by Sex and Age in Fox River
With 41.6% poverty level for males and 47.2% for females among the residents of Fox River, 5 year old males and 6 to 11 year old females are the most vulnerable to poverty, with 8 males (100.0%) and 41 females (70.7%) in their respective age groups living below the poverty level.
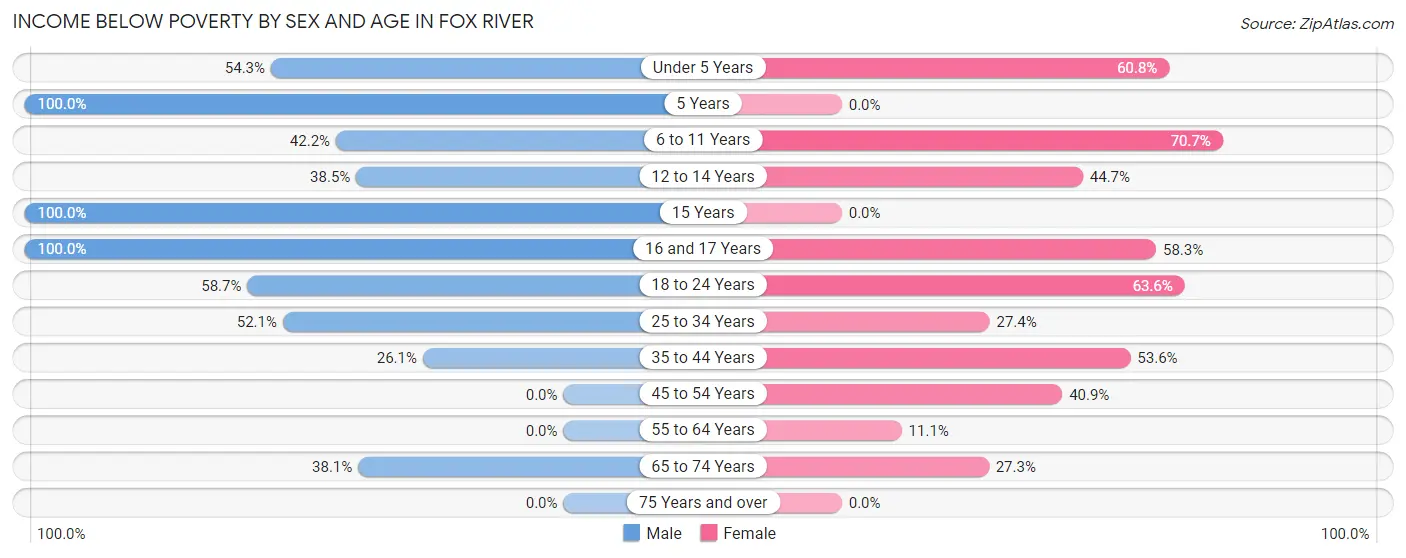
| Age Bracket | Male | Female |
| Under 5 Years | 19 (54.3%) | 48 (60.8%) |
| 5 Years | 8 (100.0%) | 0 (0.0%) |
| 6 to 11 Years | 19 (42.2%) | 41 (70.7%) |
| 12 to 14 Years | 10 (38.5%) | 17 (44.7%) |
| 15 Years | 1 (100.0%) | 0 (0.0%) |
| 16 and 17 Years | 2 (100.0%) | 7 (58.3%) |
| 18 to 24 Years | 44 (58.7%) | 14 (63.6%) |
| 25 to 34 Years | 25 (52.1%) | 17 (27.4%) |
| 35 to 44 Years | 6 (26.1%) | 15 (53.6%) |
| 45 to 54 Years | 0 (0.0%) | 9 (40.9%) |
| 55 to 64 Years | 0 (0.0%) | 4 (11.1%) |
| 65 to 74 Years | 8 (38.1%) | 3 (27.3%) |
| 75 Years and over | 0 (0.0%) | 0 (0.0%) |
| Total | 142 (41.6%) | 175 (47.2%) |
Income Above Poverty by Sex and Age in Fox River
According to the poverty statistics in Fox River, males aged 45 to 54 years and females aged 15 years are the age groups that are most secure financially, with 100.0% of males and 100.0% of females in these age groups living above the poverty line.
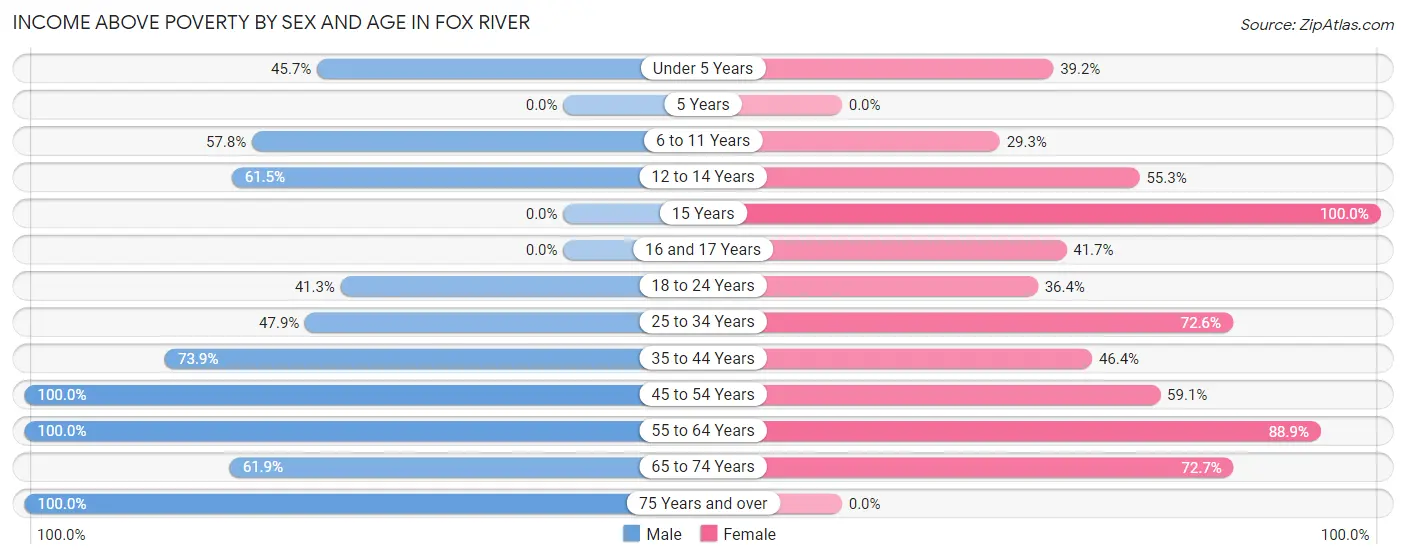
| Age Bracket | Male | Female |
| Under 5 Years | 16 (45.7%) | 31 (39.2%) |
| 5 Years | 0 (0.0%) | 0 (0.0%) |
| 6 to 11 Years | 26 (57.8%) | 17 (29.3%) |
| 12 to 14 Years | 16 (61.5%) | 21 (55.3%) |
| 15 Years | 0 (0.0%) | 3 (100.0%) |
| 16 and 17 Years | 0 (0.0%) | 5 (41.7%) |
| 18 to 24 Years | 31 (41.3%) | 8 (36.4%) |
| 25 to 34 Years | 23 (47.9%) | 45 (72.6%) |
| 35 to 44 Years | 17 (73.9%) | 13 (46.4%) |
| 45 to 54 Years | 24 (100.0%) | 13 (59.1%) |
| 55 to 64 Years | 18 (100.0%) | 32 (88.9%) |
| 65 to 74 Years | 13 (61.9%) | 8 (72.7%) |
| 75 Years and over | 15 (100.0%) | 0 (0.0%) |
| Total | 199 (58.4%) | 196 (52.8%) |
Income Below Poverty Among Married-Couple Families in Fox River
The poverty statistics for married-couple families in Fox River show that 33.9% or 43 of the total 127 families live below the poverty line. Families with 3 or 4 children have the highest poverty rate of 60.6%, comprising of 20 families. On the other hand, families with no children have the lowest poverty rate of 7.5%, which includes 4 families.
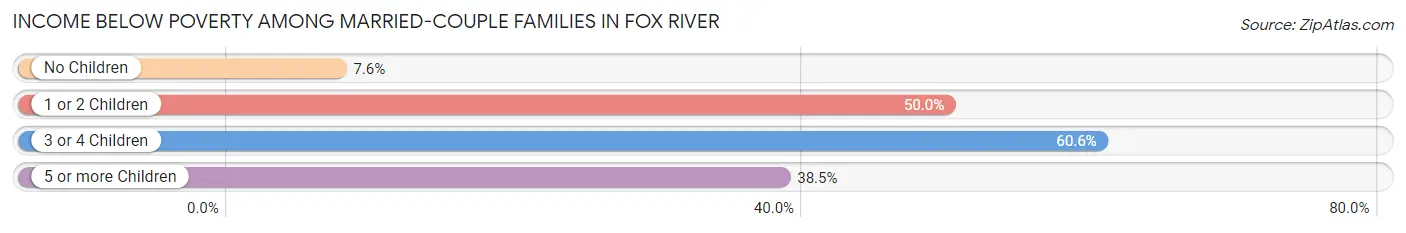
| Children | Above Poverty | Below Poverty |
| No Children | 49 (92.4%) | 4 (7.5%) |
| 1 or 2 Children | 14 (50.0%) | 14 (50.0%) |
| 3 or 4 Children | 13 (39.4%) | 20 (60.6%) |
| 5 or more Children | 8 (61.5%) | 5 (38.5%) |
| Total | 84 (66.1%) | 43 (33.9%) |
Income Below Poverty Among Single-Parent Households in Fox River
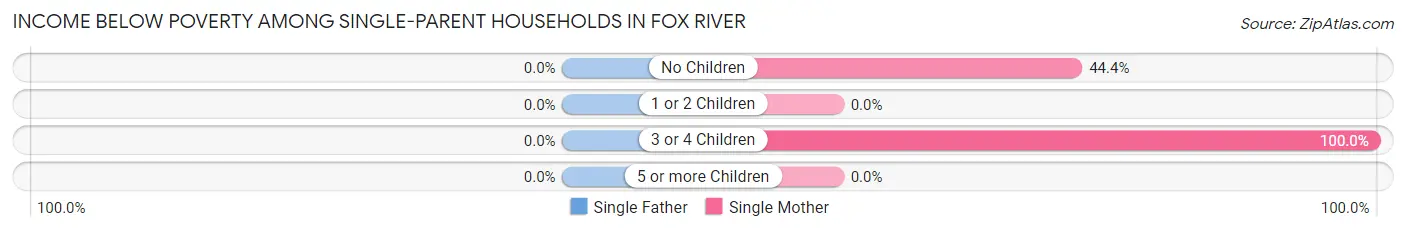
| Children | Single Father | Single Mother |
| No Children | 0 (0.0%) | 4 (44.4%) |
| 1 or 2 Children | 0 (0.0%) | 0 (0.0%) |
| 3 or 4 Children | 0 (0.0%) | 5 (100.0%) |
| 5 or more Children | 0 (0.0%) | 0 (0.0%) |
| Total | 0 (0.0%) | 9 (64.3%) |
Income Below Poverty Among Married-Couple vs Single-Parent Households in Fox River
The poverty data for Fox River shows that 43 of the married-couple family households (33.9%) and 9 of the single-parent households (37.5%) are living below the poverty level. Within the married-couple family households, those with 3 or 4 children have the highest poverty rate, with 20 households (60.6%) falling below the poverty line. Among the single-parent households, those with 3 or 4 children have the highest poverty rate, with 5 household (100.0%) living below poverty.
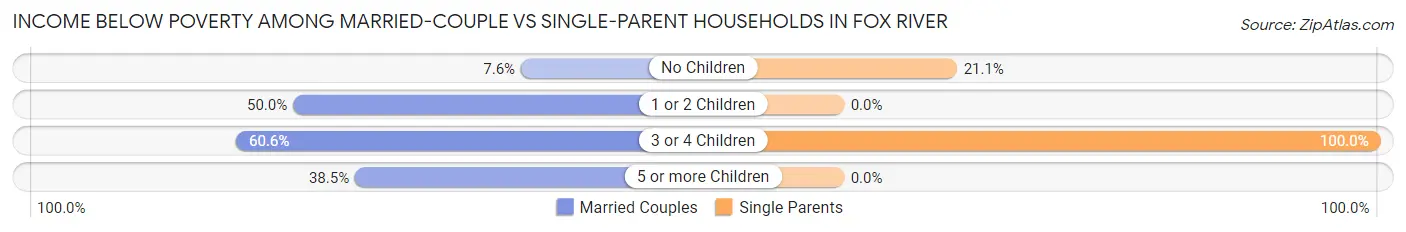
| Children | Married-Couple Families | Single-Parent Households |
| No Children | 4 (7.5%) | 4 (21.0%) |
| 1 or 2 Children | 14 (50.0%) | 0 (0.0%) |
| 3 or 4 Children | 20 (60.6%) | 5 (100.0%) |
| 5 or more Children | 5 (38.5%) | 0 (0.0%) |
| Total | 43 (33.9%) | 9 (37.5%) |
Race in Fox River
The most populous races in Fox River are White / Caucasian (683 | 95.9%), Some other Race (29 | 4.1%), and Hispanic or Latino (5 | 0.7%).
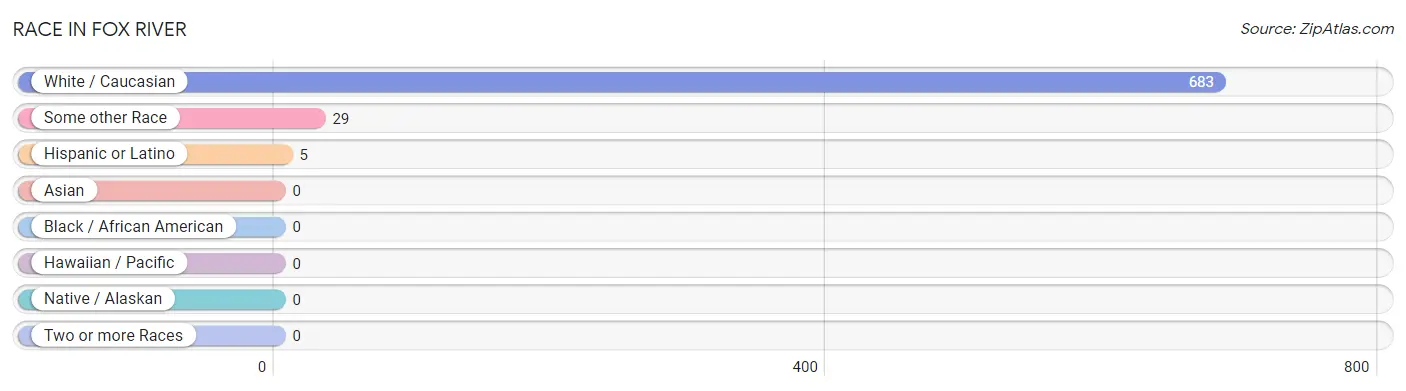
| Race | # Population | % Population |
| Asian | 0 | 0.0% |
| Black / African American | 0 | 0.0% |
| Hawaiian / Pacific | 0 | 0.0% |
| Hispanic or Latino | 5 | 0.7% |
| Native / Alaskan | 0 | 0.0% |
| White / Caucasian | 683 | 95.9% |
| Two or more Races | 0 | 0.0% |
| Some other Race | 29 | 4.1% |
| Total | 712 | 100.0% |
Ancestry in Fox River
The most populous ancestries reported in Fox River are Russian (279 | 39.2%), English (48 | 6.7%), American (39 | 5.5%), German (28 | 3.9%), and Irish (19 | 2.7%), together accounting for 58.0% of all Fox River residents.
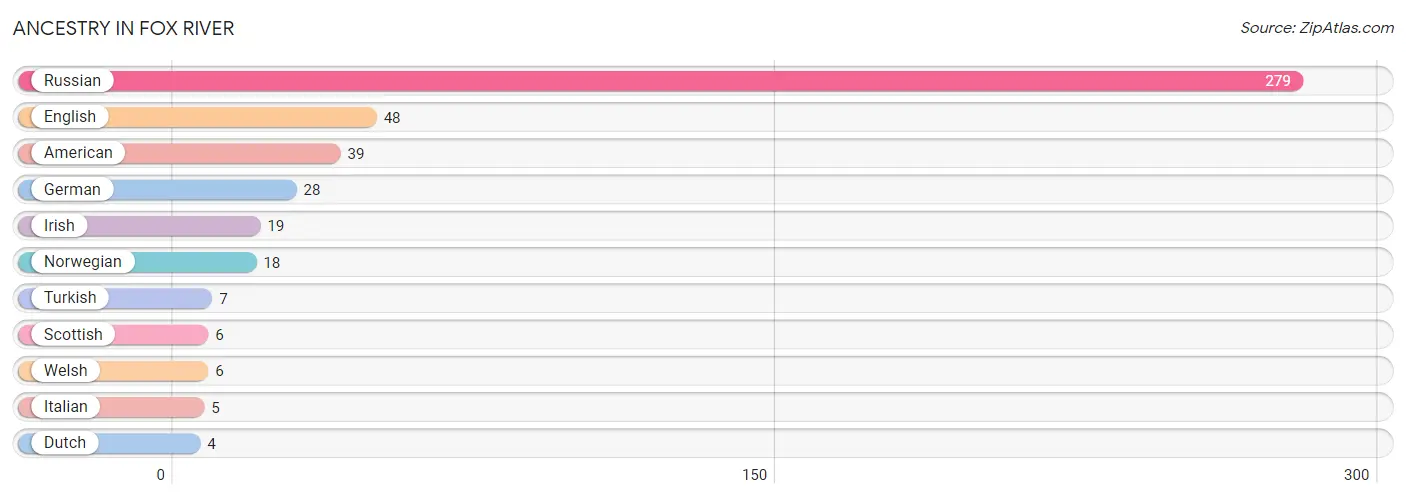
| Ancestry | # Population | % Population |
| American | 39 | 5.5% |
| Dutch | 4 | 0.6% |
| English | 48 | 6.7% |
| German | 28 | 3.9% |
| Irish | 19 | 2.7% |
| Italian | 5 | 0.7% |
| Norwegian | 18 | 2.5% |
| Russian | 279 | 39.2% |
| Scottish | 6 | 0.8% |
| Turkish | 7 | 1.0% |
| Welsh | 6 | 0.8% | View All 11 Rows |
Immigrants in Fox River
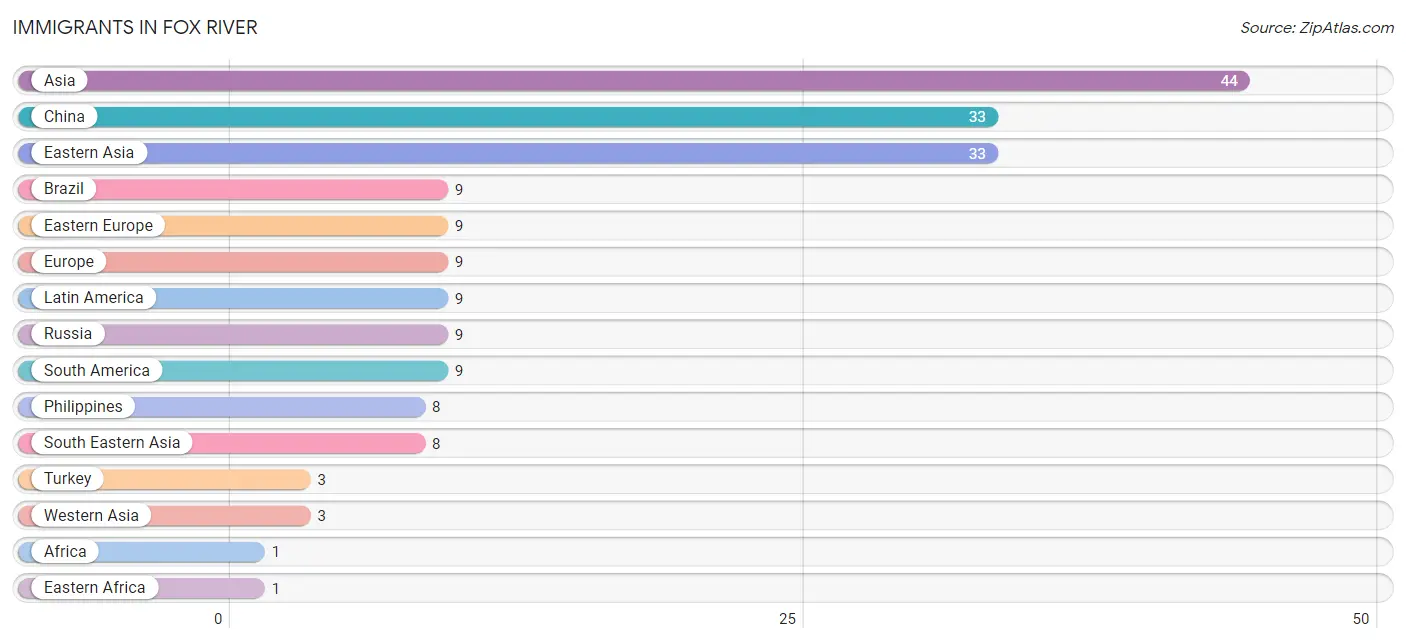
The most numerous immigrant groups reported in Fox River came from Asia (44 | 6.2%), China (33 | 4.6%), Eastern Asia (33 | 4.6%), Brazil (9 | 1.3%), and Eastern Europe (9 | 1.3%), together accounting for 18.0% of all Fox River residents.
| Immigration Origin | # Population | % Population |
| Africa | 1 | 0.1% |
| Asia | 44 | 6.2% |
| Brazil | 9 | 1.3% |
| China | 33 | 4.6% |
| Eastern Africa | 1 | 0.1% |
| Eastern Asia | 33 | 4.6% |
| Eastern Europe | 9 | 1.3% |
| Europe | 9 | 1.3% |
| Kenya | 1 | 0.1% |
| Latin America | 9 | 1.3% |
| Philippines | 8 | 1.1% |
| Russia | 9 | 1.3% |
| South America | 9 | 1.3% |
| South Eastern Asia | 8 | 1.1% |
| Turkey | 3 | 0.4% |
| Western Asia | 3 | 0.4% | View All 16 Rows |
Sex and Age in Fox River
Sex and Age in Fox River
The most populous age groups in Fox River are 20 to 24 Years (65 | 19.1%) for men and Under 5 Years (79 | 21.3%) for women.
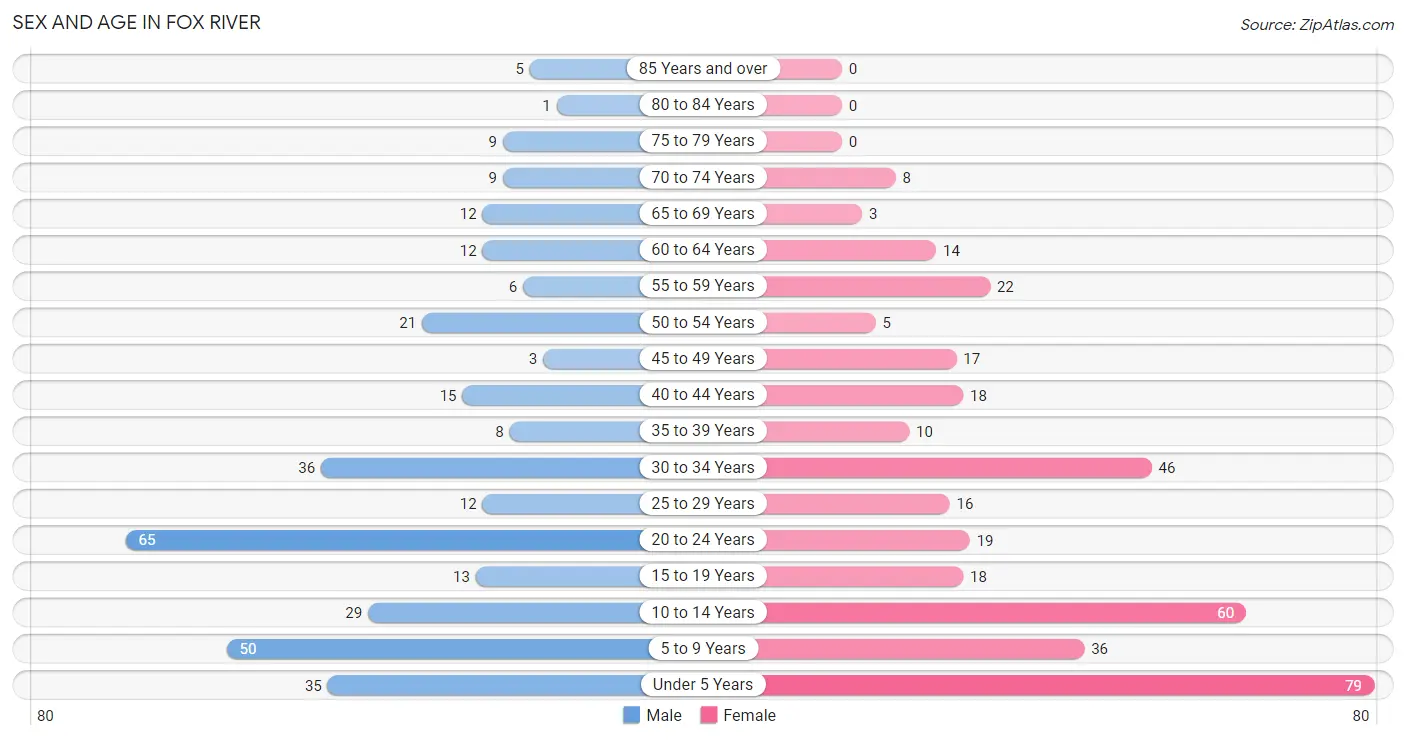
| Age Bracket | Male | Female |
| Under 5 Years | 35 (10.3%) | 79 (21.3%) |
| 5 to 9 Years | 50 (14.7%) | 36 (9.7%) |
| 10 to 14 Years | 29 (8.5%) | 60 (16.2%) |
| 15 to 19 Years | 13 (3.8%) | 18 (4.9%) |
| 20 to 24 Years | 65 (19.1%) | 19 (5.1%) |
| 25 to 29 Years | 12 (3.5%) | 16 (4.3%) |
| 30 to 34 Years | 36 (10.6%) | 46 (12.4%) |
| 35 to 39 Years | 8 (2.4%) | 10 (2.7%) |
| 40 to 44 Years | 15 (4.4%) | 18 (4.9%) |
| 45 to 49 Years | 3 (0.9%) | 17 (4.6%) |
| 50 to 54 Years | 21 (6.2%) | 5 (1.3%) |
| 55 to 59 Years | 6 (1.8%) | 22 (5.9%) |
| 60 to 64 Years | 12 (3.5%) | 14 (3.8%) |
| 65 to 69 Years | 12 (3.5%) | 3 (0.8%) |
| 70 to 74 Years | 9 (2.6%) | 8 (2.2%) |
| 75 to 79 Years | 9 (2.6%) | 0 (0.0%) |
| 80 to 84 Years | 1 (0.3%) | 0 (0.0%) |
| 85 Years and over | 5 (1.5%) | 0 (0.0%) |
| Total | 341 (100.0%) | 371 (100.0%) |
Families and Households in Fox River
Median Family Size in Fox River
The median family size in Fox River is 4.52 persons per family, with single female/mother families (14 | 9.3%) accounting for the largest median family size of 4.93 persons per family. On the other hand, single male/father families (10 | 6.6%) represent the smallest median family size with 2.10 persons per family.
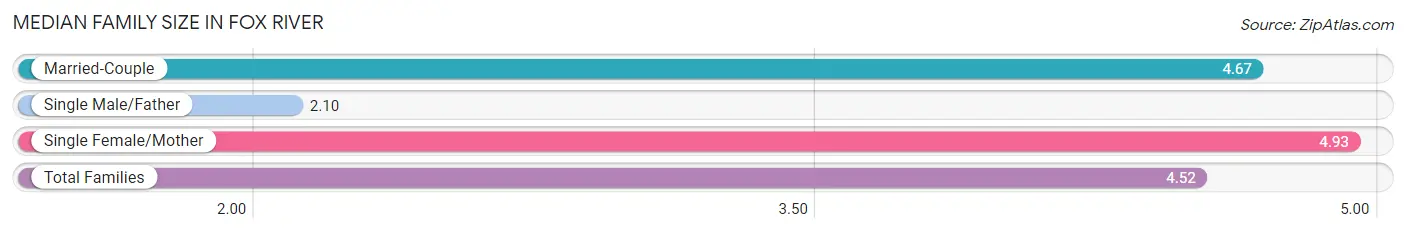
| Family Type | # Families | Family Size |
| Married-Couple | 127 (84.1%) | 4.67 |
| Single Male/Father | 10 (6.6%) | 2.10 |
| Single Female/Mother | 14 (9.3%) | 4.93 |
| Total Families | 151 (100.0%) | 4.52 |
Median Household Size in Fox River
The median household size in Fox River is 4.26 persons per household, with single female/mother households (14 | 8.4%) accounting for the largest median household size of 4.93 persons per household. non-family households (16 | 9.6%) represent the smallest median household size with 1.44 persons per household.
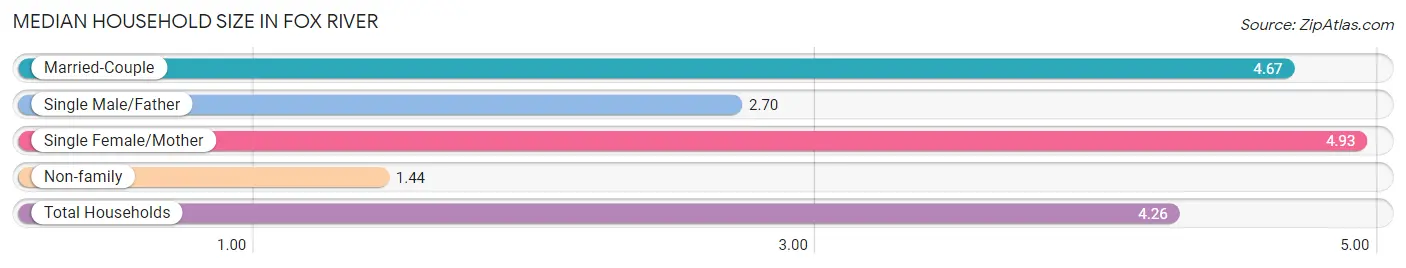
| Household Type | # Households | Household Size |
| Married-Couple | 127 (76.0%) | 4.67 |
| Single Male/Father | 10 (6.0%) | 2.70 |
| Single Female/Mother | 14 (8.4%) | 4.93 |
| Non-family | 16 (9.6%) | 1.44 |
| Total Households | 167 (100.0%) | 4.26 |
Household Size by Marriage Status in Fox River
Out of a total of 167 households in Fox River, 151 (90.4%) are family households, while 16 (9.6%) are nonfamily households. The most numerous type of family households are 2-person households, comprising 47, and the most common type of nonfamily households are 2-person households, comprising 9.
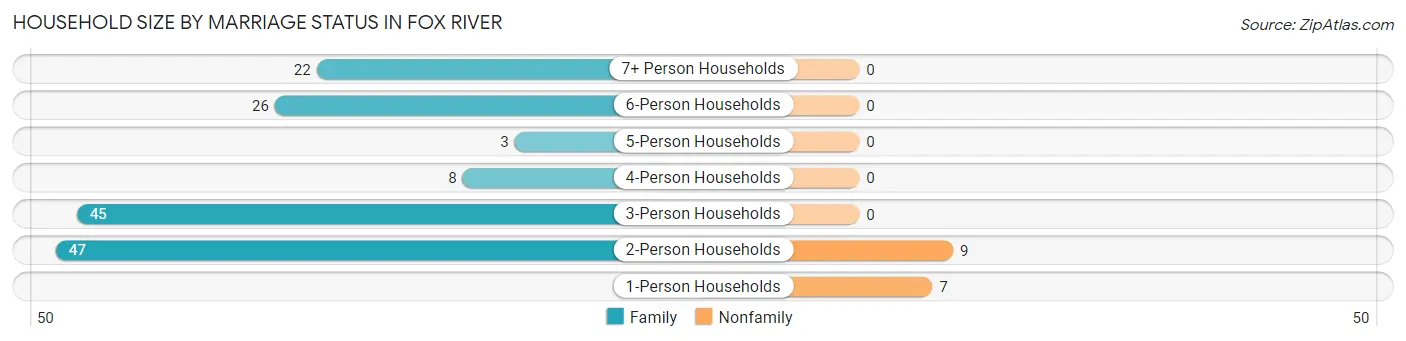
| Household Size | Family Households | Nonfamily Households |
| 1-Person Households | - | 7 (4.2%) |
| 2-Person Households | 47 (28.1%) | 9 (5.4%) |
| 3-Person Households | 45 (27.0%) | 0 (0.0%) |
| 4-Person Households | 8 (4.8%) | 0 (0.0%) |
| 5-Person Households | 3 (1.8%) | 0 (0.0%) |
| 6-Person Households | 26 (15.6%) | 0 (0.0%) |
| 7+ Person Households | 22 (13.2%) | 0 (0.0%) |
| Total | 151 (90.4%) | 16 (9.6%) |
Female Fertility in Fox River
Fertility by Age in Fox River
Average fertility rate in Fox River is 181.0 births per 1,000 women. Women in the age bracket of 20 to 34 years have the highest fertility rate with 272.0 births per 1,000 women. Women in the age bracket of 20 to 34 years acount for 81.5% of all women with births.
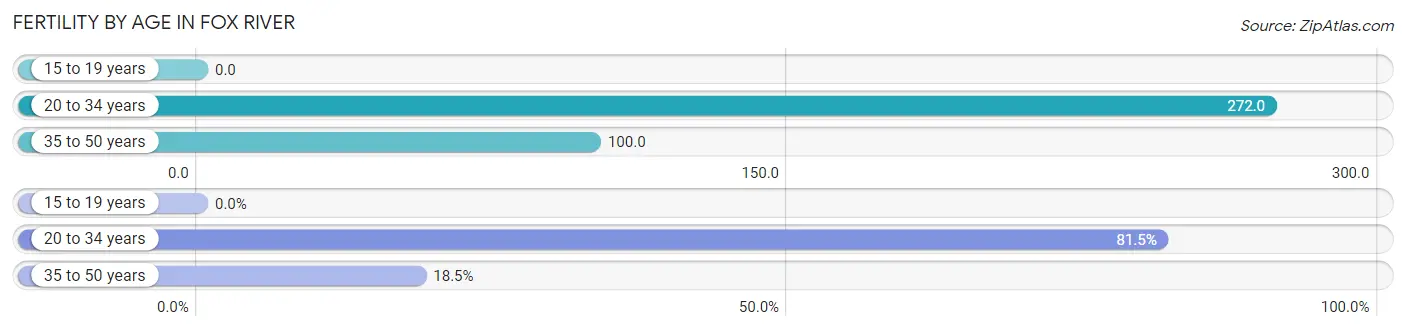
| Age Bracket | Women with Births | Births / 1,000 Women |
| 15 to 19 years | 0 (0.0%) | 0.0 |
| 20 to 34 years | 22 (81.5%) | 272.0 |
| 35 to 50 years | 5 (18.5%) | 100.0 |
| Total | 27 (100.0%) | 181.0 |
Fertility by Age by Marriage Status in Fox River
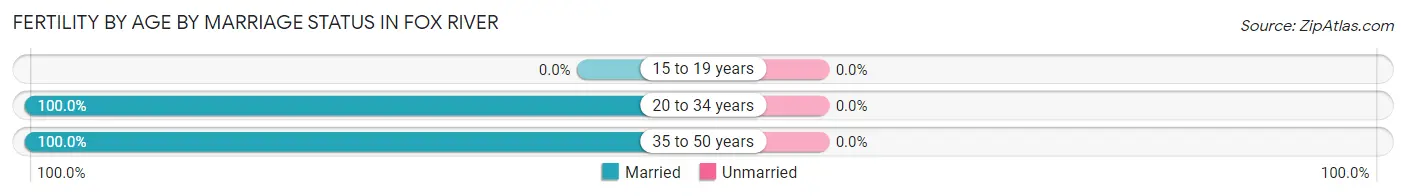
| Age Bracket | Married | Unmarried |
| 15 to 19 years | 0 (0.0%) | 0 (0.0%) |
| 20 to 34 years | 22 (100.0%) | 0 (0.0%) |
| 35 to 50 years | 5 (100.0%) | 0 (0.0%) |
| Total | 27 (100.0%) | 0 (0.0%) |
Fertility by Education in Fox River
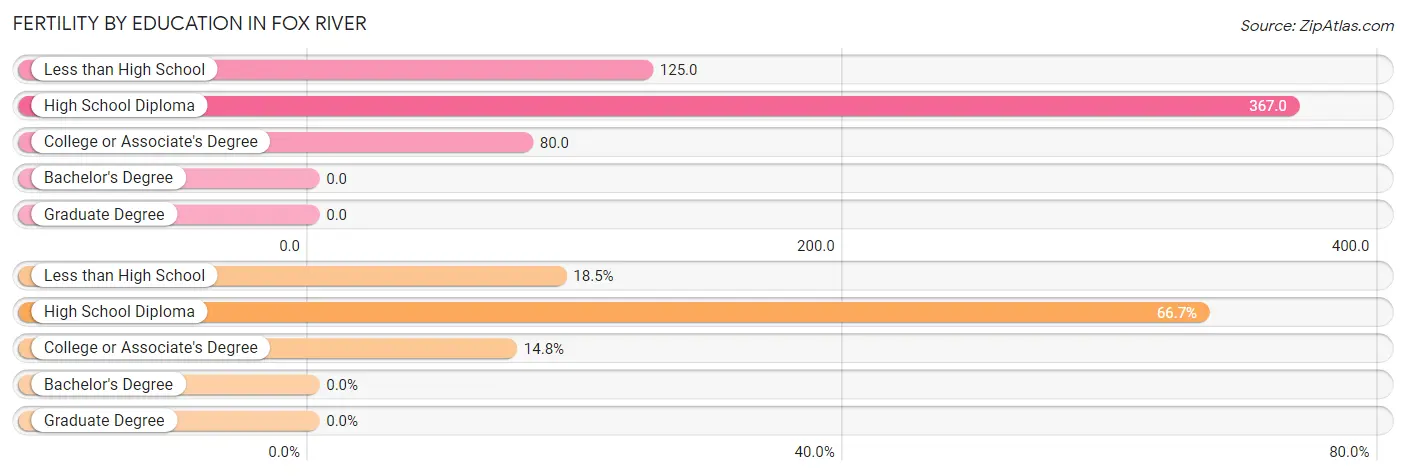
| Educational Attainment | Women with Births | Births / 1,000 Women |
| Less than High School | 5 (18.5%) | 125.0 |
| High School Diploma | 18 (66.7%) | 367.0 |
| College or Associate's Degree | 4 (14.8%) | 80.0 |
| Bachelor's Degree | 0 (0.0%) | 0.0 |
| Graduate Degree | 0 (0.0%) | 0.0 |
| Total | 27 (100.0%) | 181.0 |
Fertility by Education by Marriage Status in Fox River
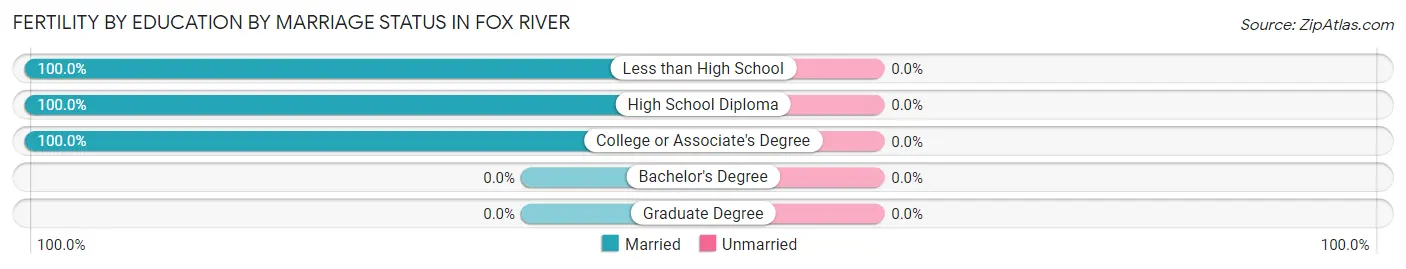
| Educational Attainment | Married | Unmarried |
| Less than High School | 5 (100.0%) | 0 (0.0%) |
| High School Diploma | 18 (100.0%) | 0 (0.0%) |
| College or Associate's Degree | 4 (100.0%) | 0 (0.0%) |
| Bachelor's Degree | 0 (0.0%) | 0 (0.0%) |
| Graduate Degree | 0 (0.0%) | 0 (0.0%) |
| Total | 27 (100.0%) | 0 (0.0%) |
Employment Characteristics in Fox River
Employment by Class of Employer in Fox River
Among the 173 employed individuals in Fox River, private company employees (95 | 54.9%), self-employed (incorporated) (24 | 13.9%), and local government employees (24 | 13.9%) make up the most common classes of employment.
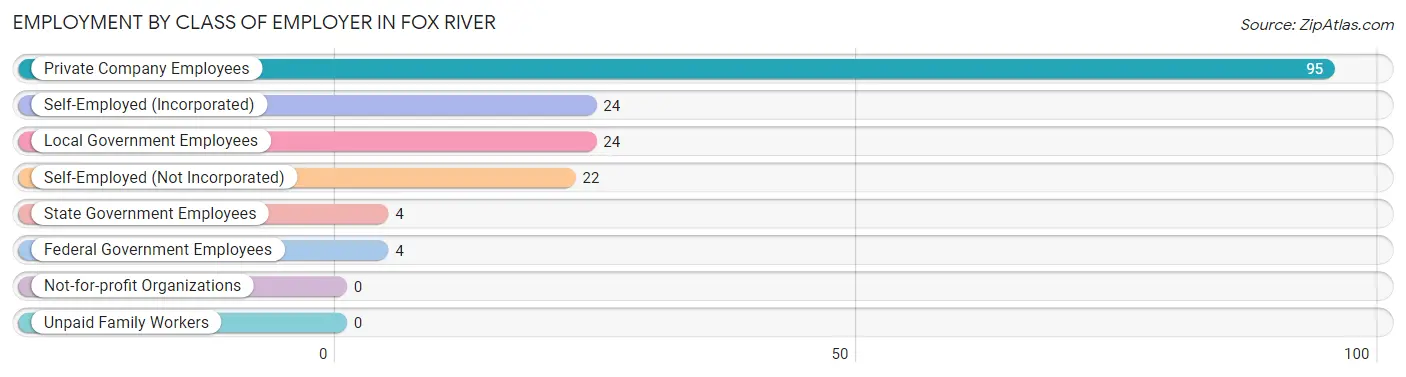
| Employer Class | # Employees | % Employees |
| Private Company Employees | 95 | 54.9% |
| Self-Employed (Incorporated) | 24 | 13.9% |
| Self-Employed (Not Incorporated) | 22 | 12.7% |
| Not-for-profit Organizations | 0 | 0.0% |
| Local Government Employees | 24 | 13.9% |
| State Government Employees | 4 | 2.3% |
| Federal Government Employees | 4 | 2.3% |
| Unpaid Family Workers | 0 | 0.0% |
| Total | 173 | 100.0% |
Employment Status by Age in Fox River
According to the labor force statistics for Fox River, out of the total population over 16 years of age (419), 57.0% or 239 individuals are in the labor force, with 15.5% or 37 of them unemployed. The age group with the highest labor force participation rate is 20 to 24 years, with 75.0% or 63 individuals in the labor force. Within the labor force, the 55 to 59 years age range has the highest percentage of unemployed individuals, with 35.7% or 5 of them being unemployed.
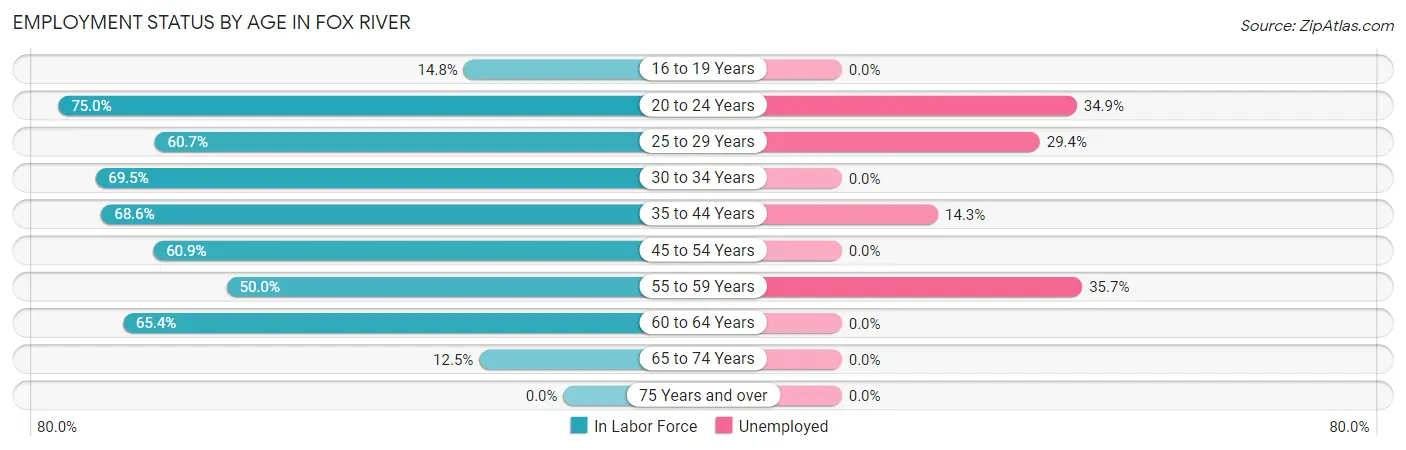
| Age Bracket | In Labor Force | Unemployed |
| 16 to 19 Years | 4 (14.8%) | 0 (0.0%) |
| 20 to 24 Years | 63 (75.0%) | 22 (34.9%) |
| 25 to 29 Years | 17 (60.7%) | 5 (29.4%) |
| 30 to 34 Years | 57 (69.5%) | 0 (0.0%) |
| 35 to 44 Years | 35 (68.6%) | 5 (14.3%) |
| 45 to 54 Years | 28 (60.9%) | 0 (0.0%) |
| 55 to 59 Years | 14 (50.0%) | 5 (35.7%) |
| 60 to 64 Years | 17 (65.4%) | 0 (0.0%) |
| 65 to 74 Years | 4 (12.5%) | 0 (0.0%) |
| 75 Years and over | 0 (0.0%) | 0 (0.0%) |
| Total | 239 (57.0%) | 37 (15.5%) |
Employment Status by Educational Attainment in Fox River
According to labor force statistics for Fox River, 64.4% of individuals (168) out of the total population between 25 and 64 years of age (261) are in the labor force, with 8.9% or 15 of them being unemployed. The group with the highest labor force participation rate are those with the educational attainment of college / associate degree, with 84.3% or 59 individuals in the labor force. Within the labor force, individuals with college / associate degree education have the highest percentage of unemployment, with 16.9% or 10 of them being unemployed.
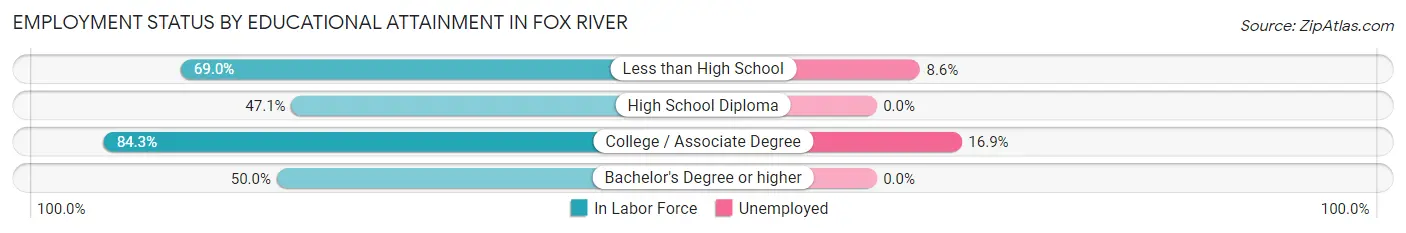
| Educational Attainment | In Labor Force | Unemployed |
| Less than High School | 58 (69.0%) | 7 (8.6%) |
| High School Diploma | 40 (47.1%) | 0 (0.0%) |
| College / Associate Degree | 59 (84.3%) | 12 (16.9%) |
| Bachelor's Degree or higher | 11 (50.0%) | 0 (0.0%) |
| Total | 168 (64.4%) | 23 (8.9%) |
Employment Occupations by Sex in Fox River
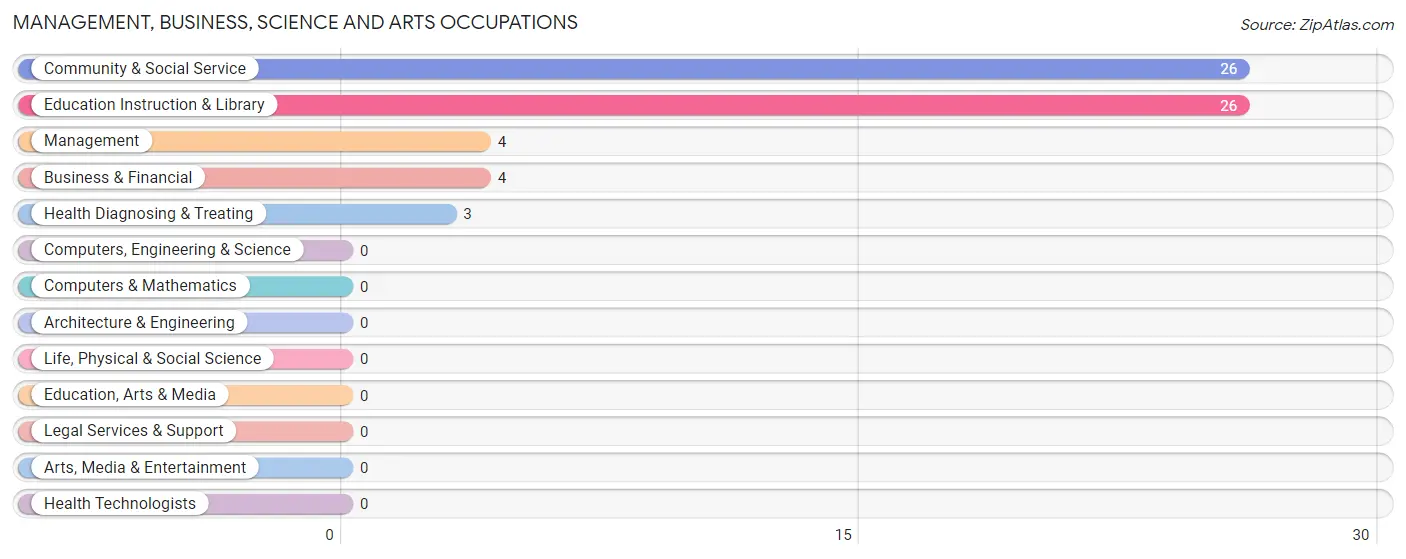
Management, Business, Science and Arts Occupations
The most common Management, Business, Science and Arts occupations in Fox River are Community & Social Service (26 | 12.9%), Education Instruction & Library (26 | 12.9%), Management (4 | 2.0%), Business & Financial (4 | 2.0%), and Health Diagnosing & Treating (3 | 1.5%).
Management, Business, Science and Arts Occupations by Sex
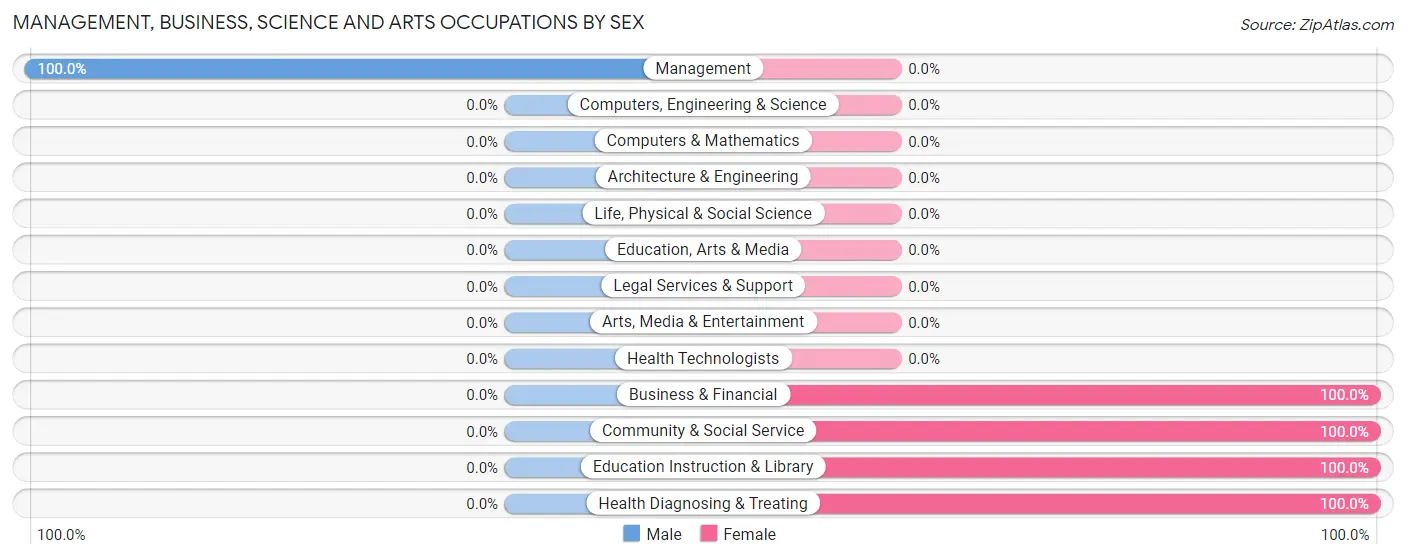
| Occupation | Male | Female |
| Management | 4 (100.0%) | 0 (0.0%) |
| Business & Financial | 0 (0.0%) | 4 (100.0%) |
| Computers, Engineering & Science | 0 (0.0%) | 0 (0.0%) |
| Computers & Mathematics | 0 (0.0%) | 0 (0.0%) |
| Architecture & Engineering | 0 (0.0%) | 0 (0.0%) |
| Life, Physical & Social Science | 0 (0.0%) | 0 (0.0%) |
| Community & Social Service | 0 (0.0%) | 26 (100.0%) |
| Education, Arts & Media | 0 (0.0%) | 0 (0.0%) |
| Legal Services & Support | 0 (0.0%) | 0 (0.0%) |
| Education Instruction & Library | 0 (0.0%) | 26 (100.0%) |
| Arts, Media & Entertainment | 0 (0.0%) | 0 (0.0%) |
| Health Diagnosing & Treating | 0 (0.0%) | 3 (100.0%) |
| Health Technologists | 0 (0.0%) | 0 (0.0%) |
| Total (Category) | 4 (10.8%) | 33 (89.2%) |
| Total (Overall) | 110 (54.5%) | 92 (45.5%) |
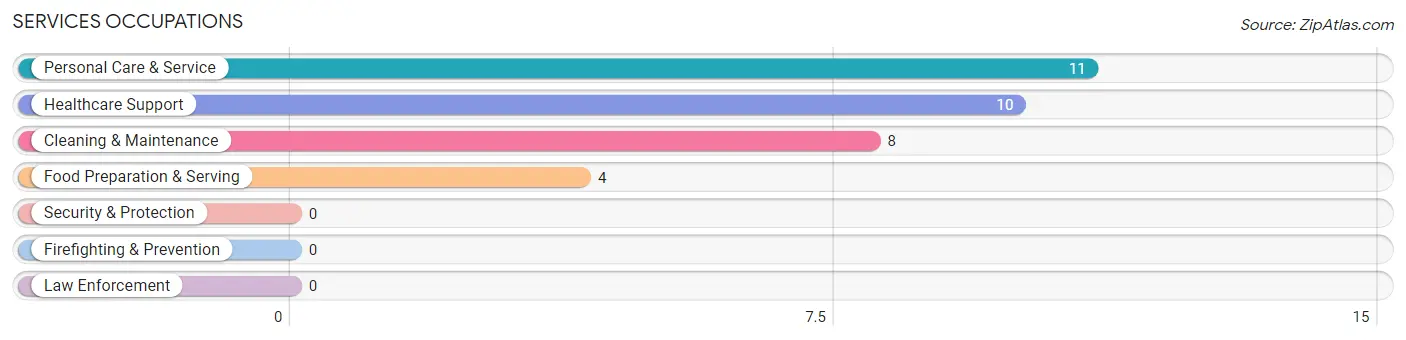
Services Occupations
The most common Services occupations in Fox River are Personal Care & Service (11 | 5.4%), Healthcare Support (10 | 5.0%), Cleaning & Maintenance (8 | 4.0%), and Food Preparation & Serving (4 | 2.0%).
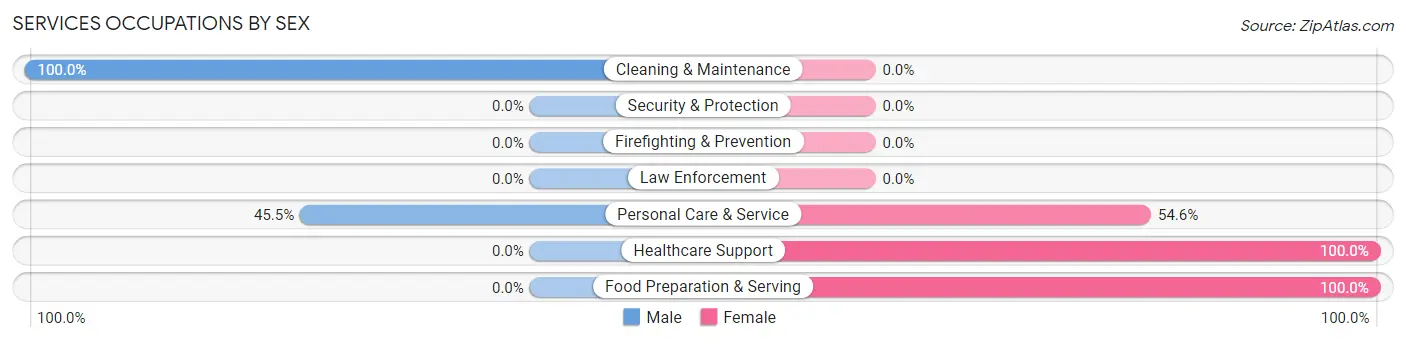
Services Occupations by Sex
Within the Services occupations in Fox River, the most male-oriented occupations are Cleaning & Maintenance (100.0%), and Personal Care & Service (45.5%), while the most female-oriented occupations are Healthcare Support (100.0%), Food Preparation & Serving (100.0%), and Personal Care & Service (54.5%).
| Occupation | Male | Female |
| Healthcare Support | 0 (0.0%) | 10 (100.0%) |
| Security & Protection | 0 (0.0%) | 0 (0.0%) |
| Firefighting & Prevention | 0 (0.0%) | 0 (0.0%) |
| Law Enforcement | 0 (0.0%) | 0 (0.0%) |
| Food Preparation & Serving | 0 (0.0%) | 4 (100.0%) |
| Cleaning & Maintenance | 8 (100.0%) | 0 (0.0%) |
| Personal Care & Service | 5 (45.5%) | 6 (54.5%) |
| Total (Category) | 13 (39.4%) | 20 (60.6%) |
| Total (Overall) | 110 (54.5%) | 92 (45.5%) |
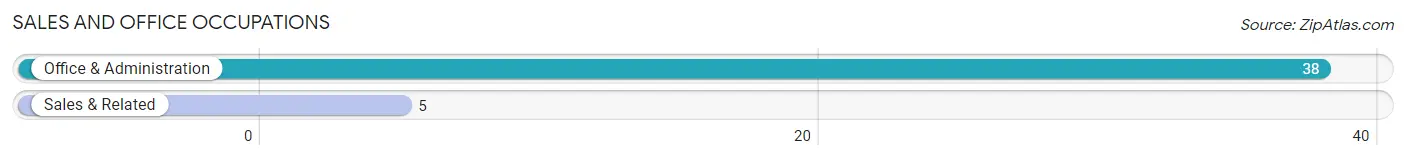
Sales and Office Occupations
The most common Sales and Office occupations in Fox River are Office & Administration (38 | 18.8%), and Sales & Related (5 | 2.5%).
Sales and Office Occupations by Sex
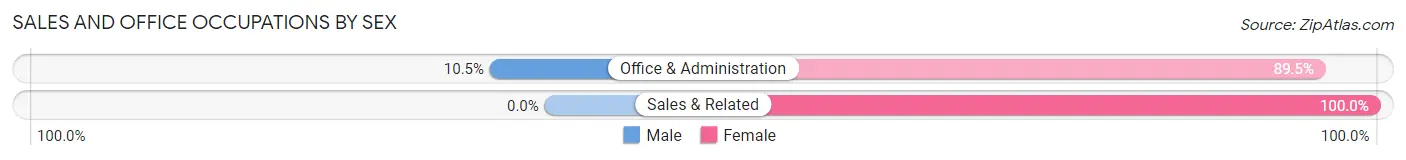
| Occupation | Male | Female |
| Sales & Related | 0 (0.0%) | 5 (100.0%) |
| Office & Administration | 4 (10.5%) | 34 (89.5%) |
| Total (Category) | 4 (9.3%) | 39 (90.7%) |
| Total (Overall) | 110 (54.5%) | 92 (45.5%) |
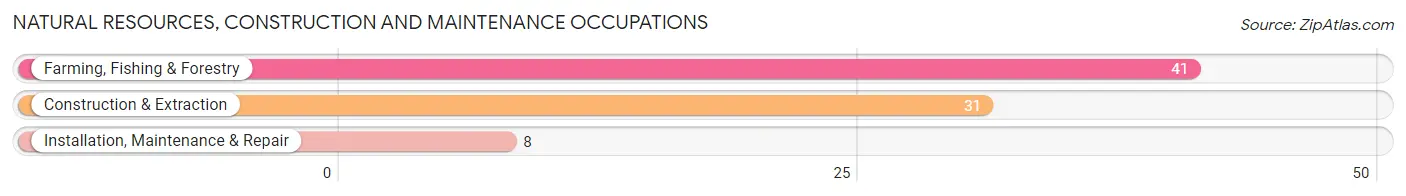
Natural Resources, Construction and Maintenance Occupations
The most common Natural Resources, Construction and Maintenance occupations in Fox River are Farming, Fishing & Forestry (41 | 20.3%), Construction & Extraction (31 | 15.3%), and Installation, Maintenance & Repair (8 | 4.0%).
Natural Resources, Construction and Maintenance Occupations by Sex
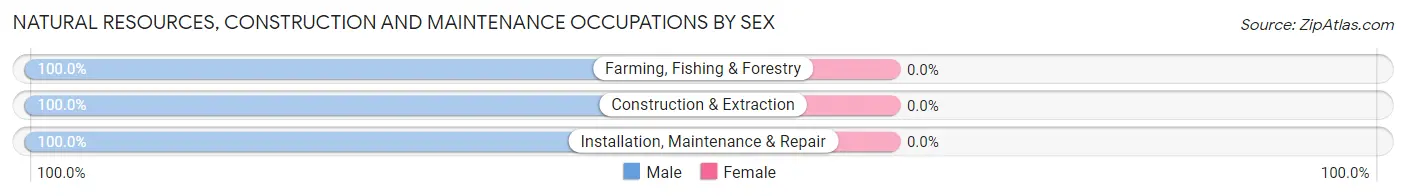
| Occupation | Male | Female |
| Farming, Fishing & Forestry | 41 (100.0%) | 0 (0.0%) |
| Construction & Extraction | 31 (100.0%) | 0 (0.0%) |
| Installation, Maintenance & Repair | 8 (100.0%) | 0 (0.0%) |
| Total (Category) | 80 (100.0%) | 0 (0.0%) |
| Total (Overall) | 110 (54.5%) | 92 (45.5%) |
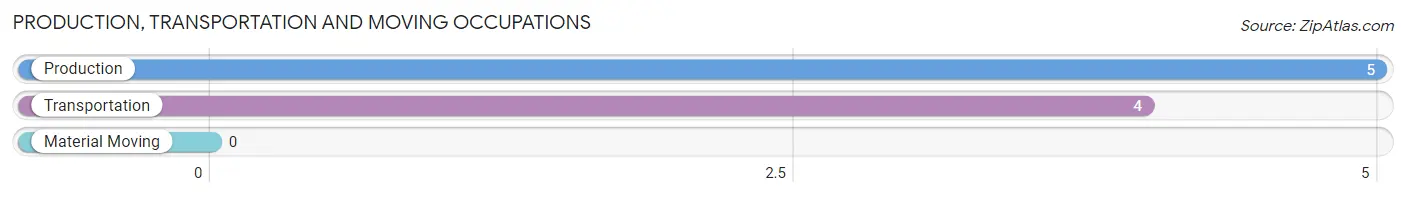
Production, Transportation and Moving Occupations
The most common Production, Transportation and Moving occupations in Fox River are Production (5 | 2.5%), and Transportation (4 | 2.0%).
Production, Transportation and Moving Occupations by Sex
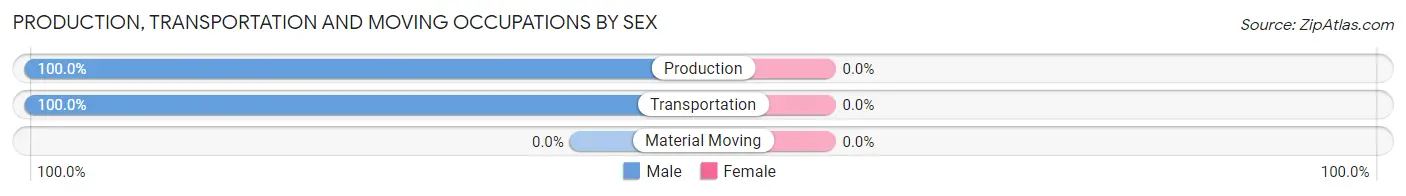
| Occupation | Male | Female |
| Production | 5 (100.0%) | 0 (0.0%) |
| Transportation | 4 (100.0%) | 0 (0.0%) |
| Material Moving | 0 (0.0%) | 0 (0.0%) |
| Total (Category) | 9 (100.0%) | 0 (0.0%) |
| Total (Overall) | 110 (54.5%) | 92 (45.5%) |
Employment Industries by Sex in Fox River
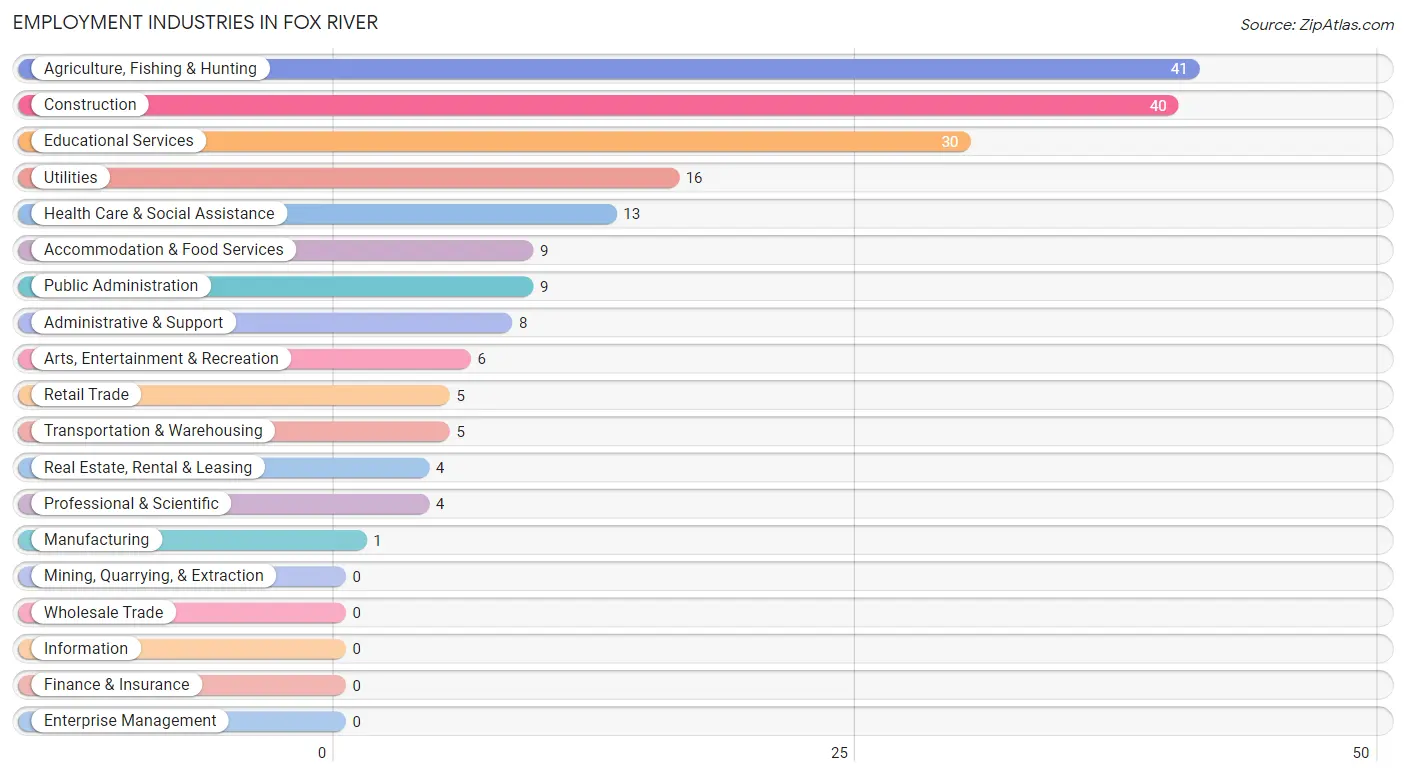
Employment Industries in Fox River
The major employment industries in Fox River include Agriculture, Fishing & Hunting (41 | 20.3%), Construction (40 | 19.8%), Educational Services (30 | 14.8%), Utilities (16 | 7.9%), and Health Care & Social Assistance (13 | 6.4%).
Employment Industries by Sex in Fox River
The Fox River industries that see more men than women are Agriculture, Fishing & Hunting (100.0%), Construction (100.0%), and Manufacturing (100.0%), whereas the industries that tend to have a higher number of women are Retail Trade (100.0%), Transportation & Warehousing (100.0%), and Utilities (100.0%).
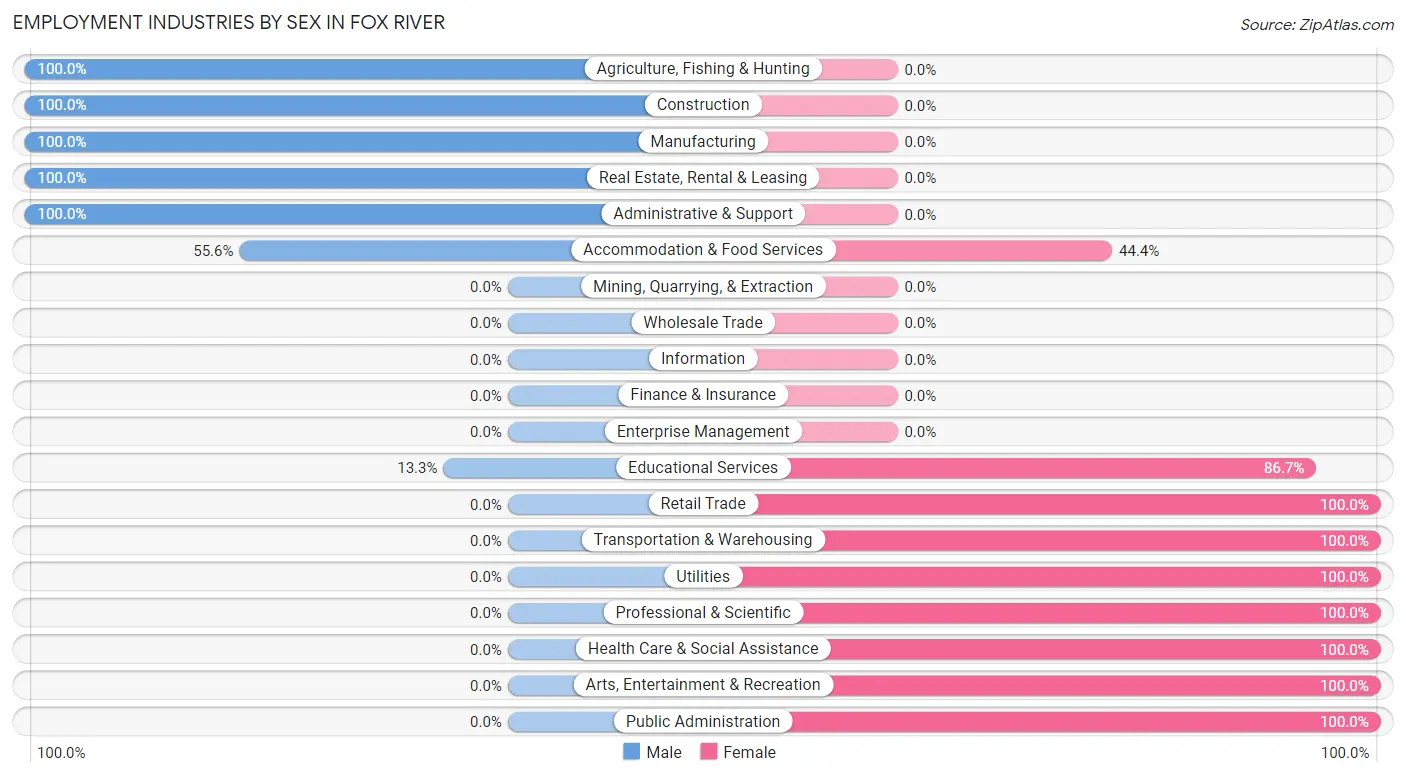
| Industry | Male | Female |
| Agriculture, Fishing & Hunting | 41 (100.0%) | 0 (0.0%) |
| Mining, Quarrying, & Extraction | 0 (0.0%) | 0 (0.0%) |
| Construction | 40 (100.0%) | 0 (0.0%) |
| Manufacturing | 1 (100.0%) | 0 (0.0%) |
| Wholesale Trade | 0 (0.0%) | 0 (0.0%) |
| Retail Trade | 0 (0.0%) | 5 (100.0%) |
| Transportation & Warehousing | 0 (0.0%) | 5 (100.0%) |
| Utilities | 0 (0.0%) | 16 (100.0%) |
| Information | 0 (0.0%) | 0 (0.0%) |
| Finance & Insurance | 0 (0.0%) | 0 (0.0%) |
| Real Estate, Rental & Leasing | 4 (100.0%) | 0 (0.0%) |
| Professional & Scientific | 0 (0.0%) | 4 (100.0%) |
| Enterprise Management | 0 (0.0%) | 0 (0.0%) |
| Administrative & Support | 8 (100.0%) | 0 (0.0%) |
| Educational Services | 4 (13.3%) | 26 (86.7%) |
| Health Care & Social Assistance | 0 (0.0%) | 13 (100.0%) |
| Arts, Entertainment & Recreation | 0 (0.0%) | 6 (100.0%) |
| Accommodation & Food Services | 5 (55.6%) | 4 (44.4%) |
| Public Administration | 0 (0.0%) | 9 (100.0%) |
| Total | 110 (54.5%) | 92 (45.5%) |
Education in Fox River
School Enrollment in Fox River
The most common levels of schooling among the 215 students in Fox River are elementary school (76 | 35.3%), middle school (68 | 31.6%), and high school (26 | 12.1%).
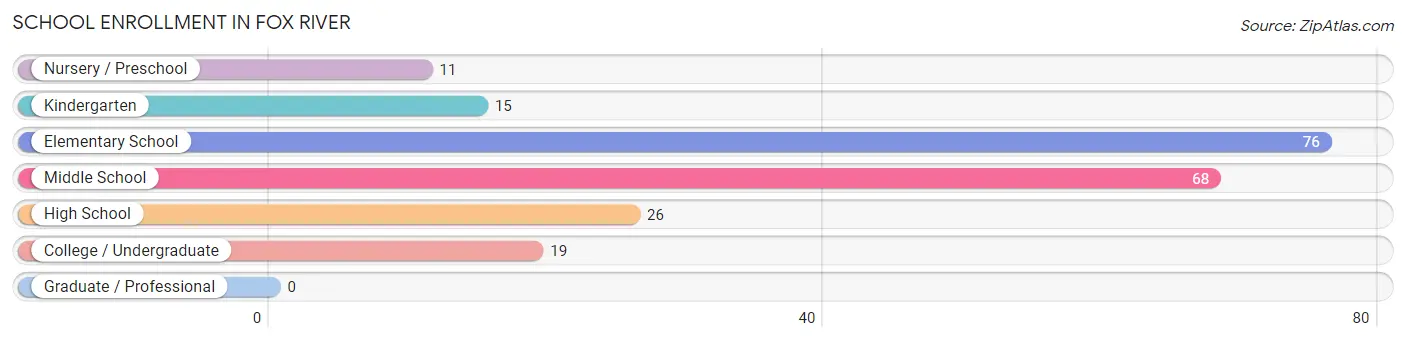
| School Level | # Students | % Students |
| Nursery / Preschool | 11 | 5.1% |
| Kindergarten | 15 | 7.0% |
| Elementary School | 76 | 35.3% |
| Middle School | 68 | 31.6% |
| High School | 26 | 12.1% |
| College / Undergraduate | 19 | 8.8% |
| Graduate / Professional | 0 | 0.0% |
| Total | 215 | 100.0% |
School Enrollment by Age by Funding Source in Fox River
Out of a total of 215 students who are enrolled in schools in Fox River, 31 (14.4%) attend a private institution, while the remaining 184 (85.6%) are enrolled in public schools. The age group of 20 to 24 year olds has the highest likelihood of being enrolled in private schools, with 7 (58.3% in the age bracket) enrolled. Conversely, the age group of 3 to 4 year olds has the lowest likelihood of being enrolled in a private school, with 11 (100.0% in the age bracket) attending a public institution.
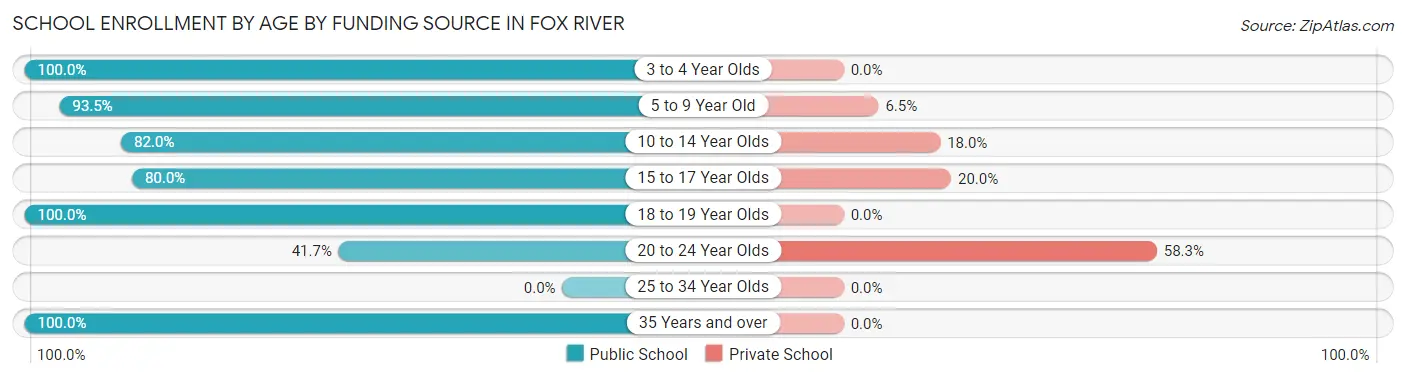
| Age Bracket | Public School | Private School |
| 3 to 4 Year Olds | 11 (100.0%) | 0 (0.0%) |
| 5 to 9 Year Old | 72 (93.5%) | 5 (6.5%) |
| 10 to 14 Year Olds | 73 (82.0%) | 16 (18.0%) |
| 15 to 17 Year Olds | 12 (80.0%) | 3 (20.0%) |
| 18 to 19 Year Olds | 4 (100.0%) | 0 (0.0%) |
| 20 to 24 Year Olds | 5 (41.7%) | 7 (58.3%) |
| 25 to 34 Year Olds | 0 (0.0%) | 0 (0.0%) |
| 35 Years and over | 7 (100.0%) | 0 (0.0%) |
| Total | 184 (85.6%) | 31 (14.4%) |
Educational Attainment by Field of Study in Fox River
Bio, nature & agricultural (12 | 31.6%), education (5 | 13.2%), computers & mathematics (4 | 10.5%), social sciences (4 | 10.5%), and literature & languages (4 | 10.5%) are the most common fields of study among 38 individuals in Fox River who have obtained a bachelor's degree or higher.
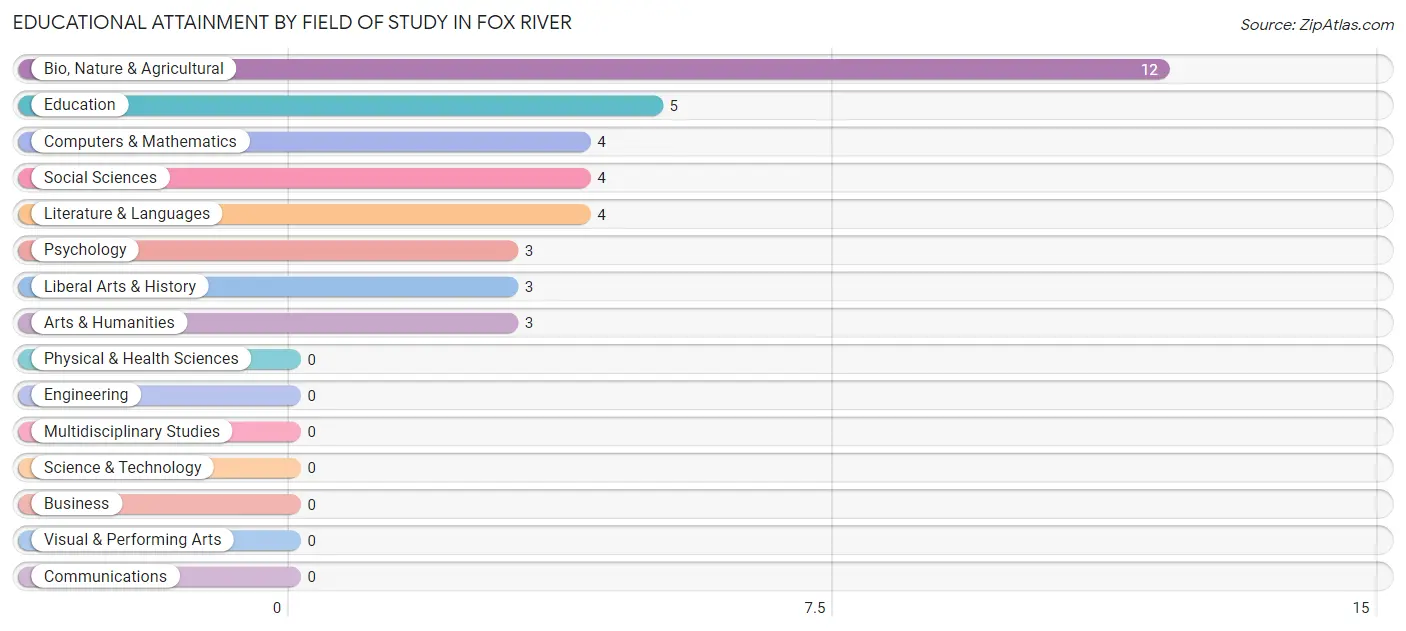
| Field of Study | # Graduates | % Graduates |
| Computers & Mathematics | 4 | 10.5% |
| Bio, Nature & Agricultural | 12 | 31.6% |
| Physical & Health Sciences | 0 | 0.0% |
| Psychology | 3 | 7.9% |
| Social Sciences | 4 | 10.5% |
| Engineering | 0 | 0.0% |
| Multidisciplinary Studies | 0 | 0.0% |
| Science & Technology | 0 | 0.0% |
| Business | 0 | 0.0% |
| Education | 5 | 13.2% |
| Literature & Languages | 4 | 10.5% |
| Liberal Arts & History | 3 | 7.9% |
| Visual & Performing Arts | 0 | 0.0% |
| Communications | 0 | 0.0% |
| Arts & Humanities | 3 | 7.9% |
| Total | 38 | 100.0% |
Transportation & Commute in Fox River
Vehicle Availability by Sex in Fox River
The most prevalent vehicle ownership categories in Fox River are males with 3 vehicles (50, accounting for 49.5%) and females with 3 vehicles (20, making up 69.4%).
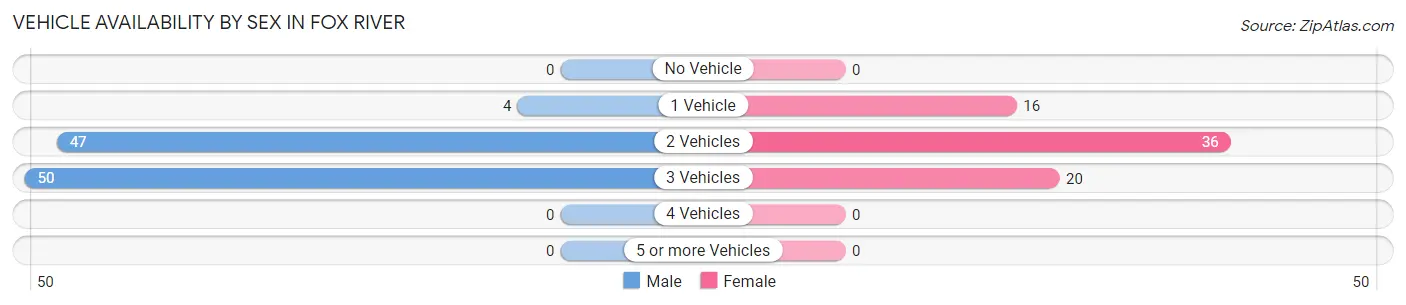
| Vehicles Available | Male | Female |
| No Vehicle | 0 (0.0%) | 0 (0.0%) |
| 1 Vehicle | 4 (4.0%) | 16 (22.2%) |
| 2 Vehicles | 47 (46.5%) | 36 (50.0%) |
| 3 Vehicles | 50 (49.5%) | 20 (27.8%) |
| 4 Vehicles | 0 (0.0%) | 0 (0.0%) |
| 5 or more Vehicles | 0 (0.0%) | 0 (0.0%) |
| Total | 101 (100.0%) | 72 (100.0%) |
Commute Time in Fox River
The most frequently occuring commute durations in Fox River are 45 to 59 minutes (34 commuters, 23.3%), 15 to 19 minutes (17 commuters, 11.6%), and 20 to 24 minutes (17 commuters, 11.6%).
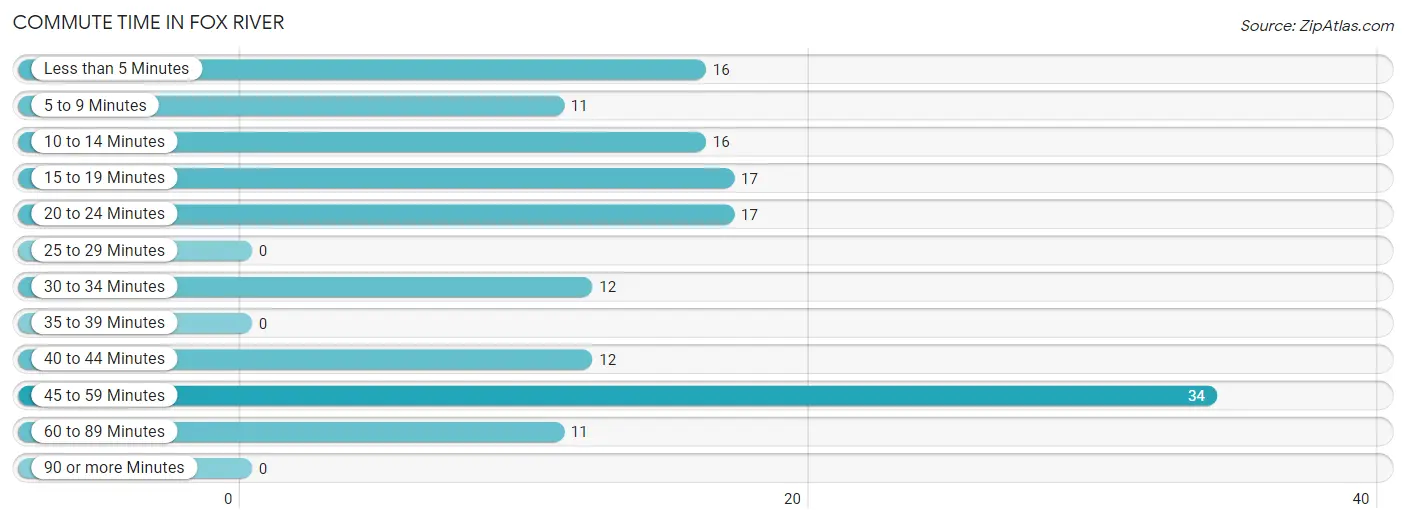
| Commute Time | # Commuters | % Commuters |
| Less than 5 Minutes | 16 | 11.0% |
| 5 to 9 Minutes | 11 | 7.5% |
| 10 to 14 Minutes | 16 | 11.0% |
| 15 to 19 Minutes | 17 | 11.6% |
| 20 to 24 Minutes | 17 | 11.6% |
| 25 to 29 Minutes | 0 | 0.0% |
| 30 to 34 Minutes | 12 | 8.2% |
| 35 to 39 Minutes | 0 | 0.0% |
| 40 to 44 Minutes | 12 | 8.2% |
| 45 to 59 Minutes | 34 | 23.3% |
| 60 to 89 Minutes | 11 | 7.5% |
| 90 or more Minutes | 0 | 0.0% |
Commute Time by Sex in Fox River
The most common commute times in Fox River are 45 to 59 minutes (30 commuters, 30.9%) for males and 5 to 9 minutes (11 commuters, 22.5%) for females.
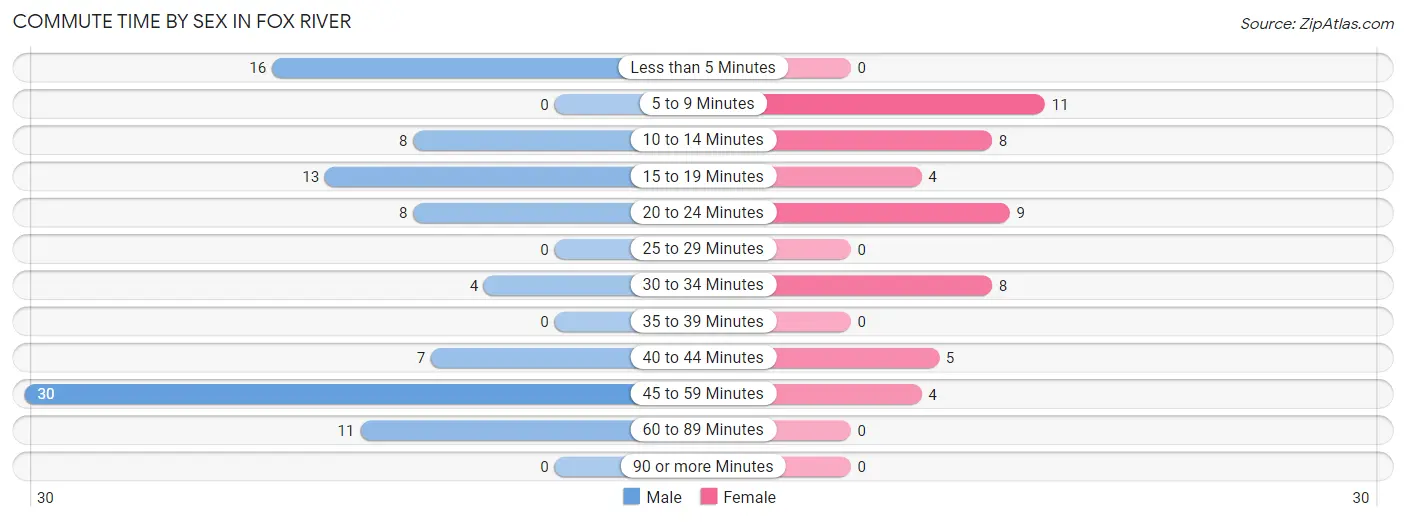
| Commute Time | Male | Female |
| Less than 5 Minutes | 16 (16.5%) | 0 (0.0%) |
| 5 to 9 Minutes | 0 (0.0%) | 11 (22.5%) |
| 10 to 14 Minutes | 8 (8.3%) | 8 (16.3%) |
| 15 to 19 Minutes | 13 (13.4%) | 4 (8.2%) |
| 20 to 24 Minutes | 8 (8.3%) | 9 (18.4%) |
| 25 to 29 Minutes | 0 (0.0%) | 0 (0.0%) |
| 30 to 34 Minutes | 4 (4.1%) | 8 (16.3%) |
| 35 to 39 Minutes | 0 (0.0%) | 0 (0.0%) |
| 40 to 44 Minutes | 7 (7.2%) | 5 (10.2%) |
| 45 to 59 Minutes | 30 (30.9%) | 4 (8.2%) |
| 60 to 89 Minutes | 11 (11.3%) | 0 (0.0%) |
| 90 or more Minutes | 0 (0.0%) | 0 (0.0%) |
Time of Departure to Work by Sex in Fox River
The most frequent times of departure to work in Fox River are 7:00 AM to 7:29 AM (33, 34.0%) for males and 8:30 AM to 8:59 AM (19, 38.8%) for females.
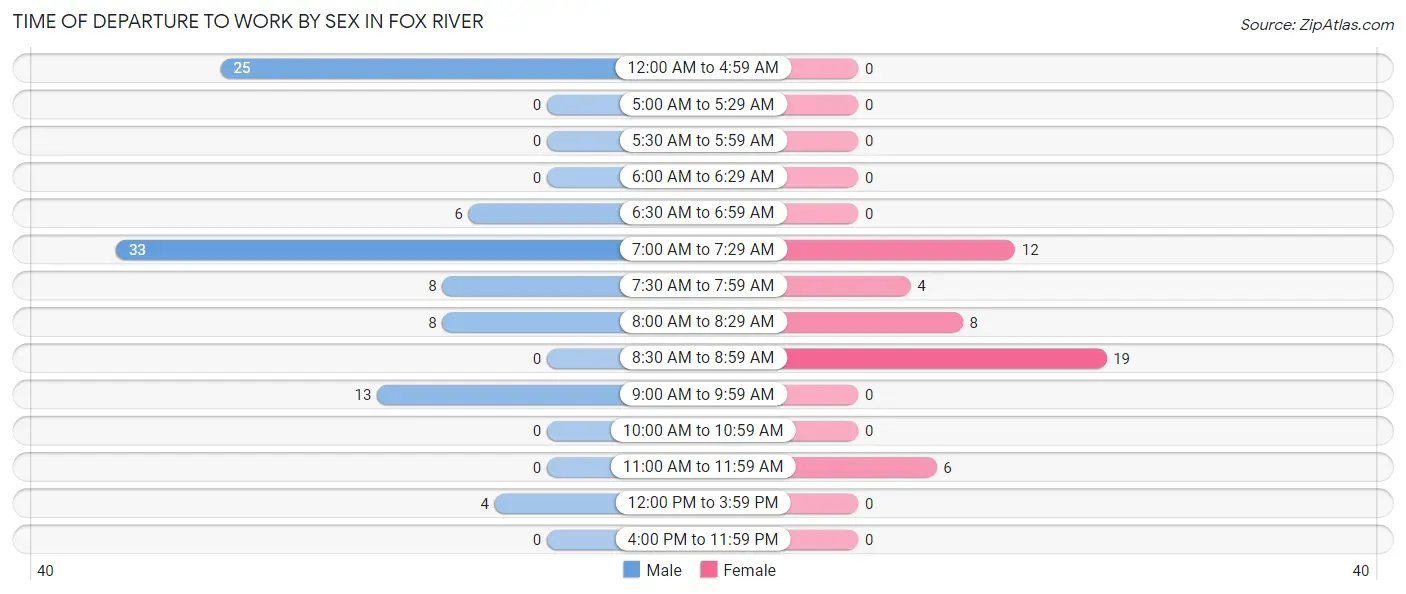
| Time of Departure | Male | Female |
| 12:00 AM to 4:59 AM | 25 (25.8%) | 0 (0.0%) |
| 5:00 AM to 5:29 AM | 0 (0.0%) | 0 (0.0%) |
| 5:30 AM to 5:59 AM | 0 (0.0%) | 0 (0.0%) |
| 6:00 AM to 6:29 AM | 0 (0.0%) | 0 (0.0%) |
| 6:30 AM to 6:59 AM | 6 (6.2%) | 0 (0.0%) |
| 7:00 AM to 7:29 AM | 33 (34.0%) | 12 (24.5%) |
| 7:30 AM to 7:59 AM | 8 (8.3%) | 4 (8.2%) |
| 8:00 AM to 8:29 AM | 8 (8.3%) | 8 (16.3%) |
| 8:30 AM to 8:59 AM | 0 (0.0%) | 19 (38.8%) |
| 9:00 AM to 9:59 AM | 13 (13.4%) | 0 (0.0%) |
| 10:00 AM to 10:59 AM | 0 (0.0%) | 0 (0.0%) |
| 11:00 AM to 11:59 AM | 0 (0.0%) | 6 (12.2%) |
| 12:00 PM to 3:59 PM | 4 (4.1%) | 0 (0.0%) |
| 4:00 PM to 11:59 PM | 0 (0.0%) | 0 (0.0%) |
| Total | 97 (100.0%) | 49 (100.0%) |
Housing Occupancy in Fox River
Occupancy by Ownership in Fox River
Of the total 167 dwellings in Fox River, owner-occupied units account for 145 (86.8%), while renter-occupied units make up 22 (13.2%).
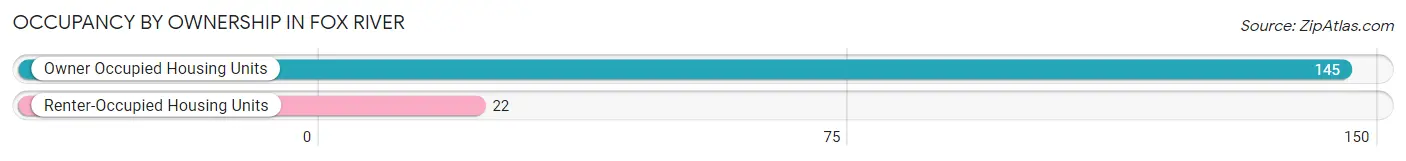
| Occupancy | # Housing Units | % Housing Units |
| Owner Occupied Housing Units | 145 | 86.8% |
| Renter-Occupied Housing Units | 22 | 13.2% |
| Total Occupied Housing Units | 167 | 100.0% |
Occupancy by Household Size in Fox River
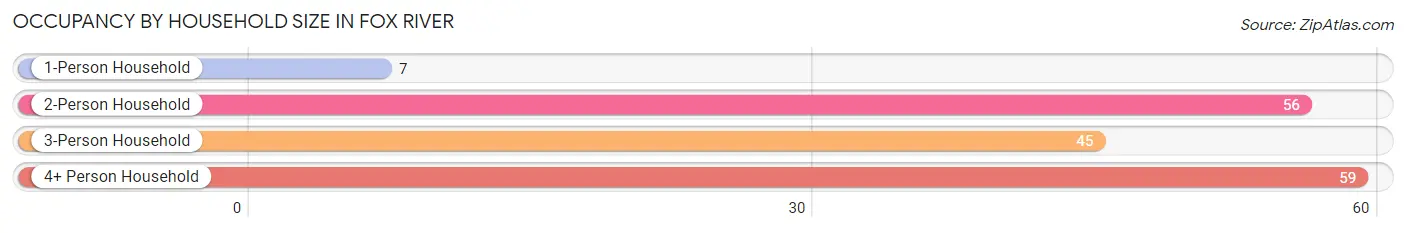
| Household Size | # Housing Units | % Housing Units |
| 1-Person Household | 7 | 4.2% |
| 2-Person Household | 56 | 33.5% |
| 3-Person Household | 45 | 27.0% |
| 4+ Person Household | 59 | 35.3% |
| Total Housing Units | 167 | 100.0% |
Occupancy by Ownership by Household Size in Fox River
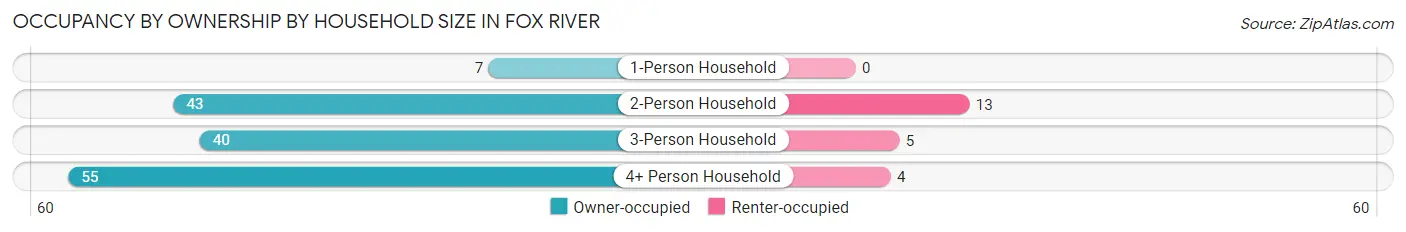
| Household Size | Owner-occupied | Renter-occupied |
| 1-Person Household | 7 (100.0%) | 0 (0.0%) |
| 2-Person Household | 43 (76.8%) | 13 (23.2%) |
| 3-Person Household | 40 (88.9%) | 5 (11.1%) |
| 4+ Person Household | 55 (93.2%) | 4 (6.8%) |
| Total Housing Units | 145 (86.8%) | 22 (13.2%) |
Occupancy by Educational Attainment in Fox River
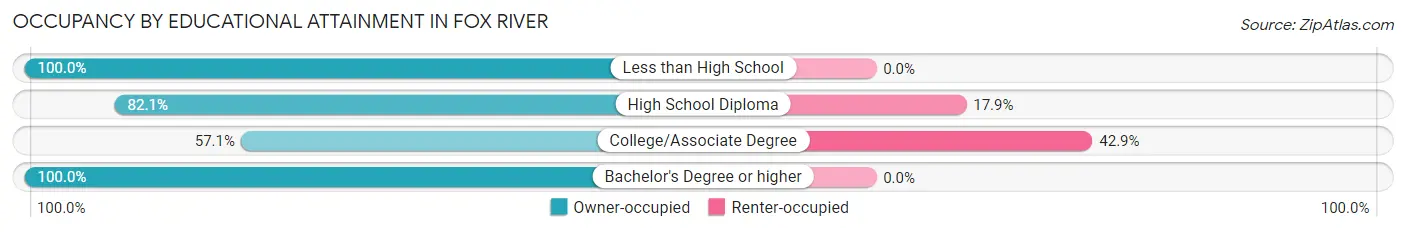
| Household Size | Owner-occupied | Renter-occupied |
| Less than High School | 67 (100.0%) | 0 (0.0%) |
| High School Diploma | 46 (82.1%) | 10 (17.9%) |
| College/Associate Degree | 16 (57.1%) | 12 (42.9%) |
| Bachelor's Degree or higher | 16 (100.0%) | 0 (0.0%) |
Occupancy by Age of Householder in Fox River
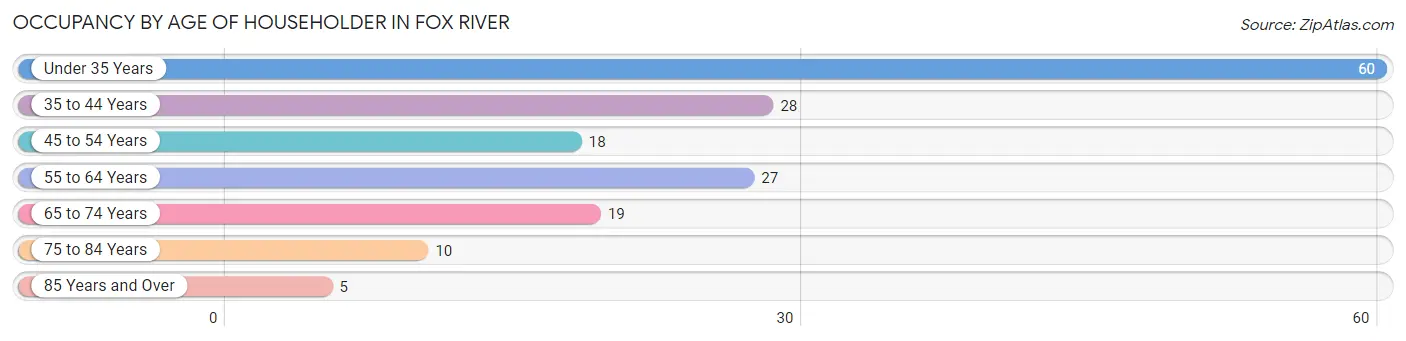
| Age Bracket | # Households | % Households |
| Under 35 Years | 60 | 35.9% |
| 35 to 44 Years | 28 | 16.8% |
| 45 to 54 Years | 18 | 10.8% |
| 55 to 64 Years | 27 | 16.2% |
| 65 to 74 Years | 19 | 11.4% |
| 75 to 84 Years | 10 | 6.0% |
| 85 Years and Over | 5 | 3.0% |
| Total | 167 | 100.0% |
Housing Finances in Fox River
Median Income by Occupancy in Fox River
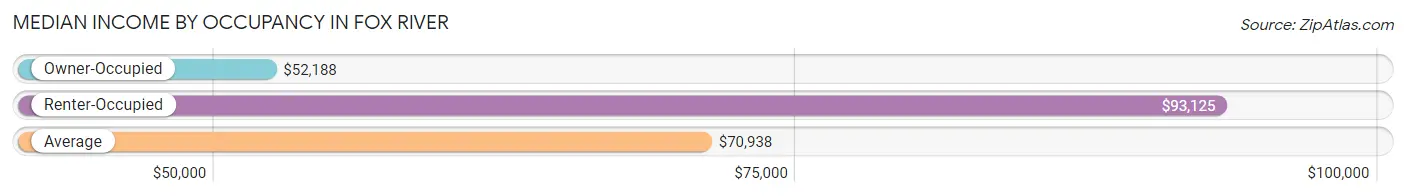
| Occupancy Type | # Households | Median Income |
| Owner-Occupied | 145 (86.8%) | $52,188 |
| Renter-Occupied | 22 (13.2%) | $93,125 |
| Average | 167 (100.0%) | $70,938 |
Occupancy by Householder Income Bracket in Fox River
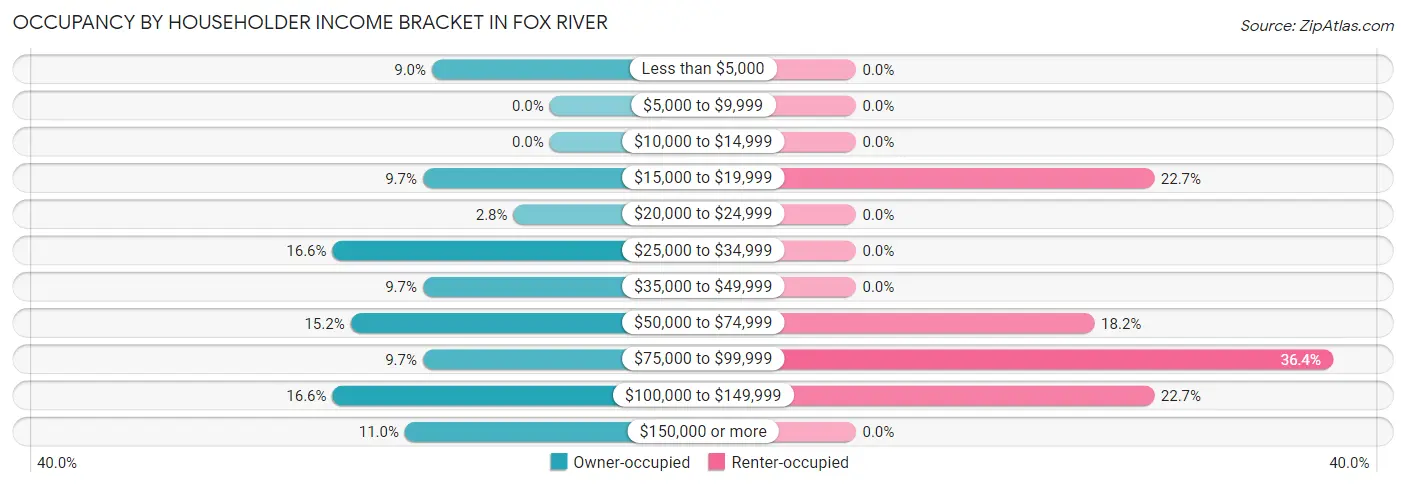
| Income Bracket | Owner-occupied | Renter-occupied |
| Less than $5,000 | 13 (9.0%) | 0 (0.0%) |
| $5,000 to $9,999 | 0 (0.0%) | 0 (0.0%) |
| $10,000 to $14,999 | 0 (0.0%) | 0 (0.0%) |
| $15,000 to $19,999 | 14 (9.7%) | 5 (22.7%) |
| $20,000 to $24,999 | 4 (2.8%) | 0 (0.0%) |
| $25,000 to $34,999 | 24 (16.6%) | 0 (0.0%) |
| $35,000 to $49,999 | 14 (9.7%) | 0 (0.0%) |
| $50,000 to $74,999 | 22 (15.2%) | 4 (18.2%) |
| $75,000 to $99,999 | 14 (9.7%) | 8 (36.4%) |
| $100,000 to $149,999 | 24 (16.6%) | 5 (22.7%) |
| $150,000 or more | 16 (11.0%) | 0 (0.0%) |
| Total | 145 (100.0%) | 22 (100.0%) |
Monthly Housing Cost Tiers in Fox River
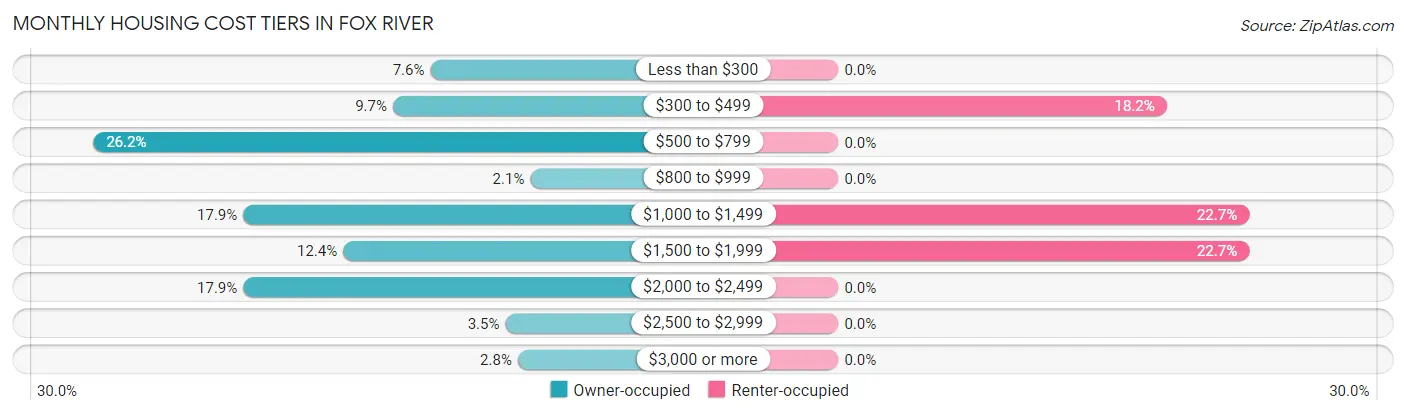
| Monthly Cost | Owner-occupied | Renter-occupied |
| Less than $300 | 11 (7.6%) | 0 (0.0%) |
| $300 to $499 | 14 (9.7%) | 4 (18.2%) |
| $500 to $799 | 38 (26.2%) | 0 (0.0%) |
| $800 to $999 | 3 (2.1%) | 0 (0.0%) |
| $1,000 to $1,499 | 26 (17.9%) | 5 (22.7%) |
| $1,500 to $1,999 | 18 (12.4%) | 5 (22.7%) |
| $2,000 to $2,499 | 26 (17.9%) | 0 (0.0%) |
| $2,500 to $2,999 | 5 (3.5%) | 0 (0.0%) |
| $3,000 or more | 4 (2.8%) | 0 (0.0%) |
| Total | 145 (100.0%) | 22 (100.0%) |
Physical Housing Characteristics in Fox River
Housing Structures in Fox River
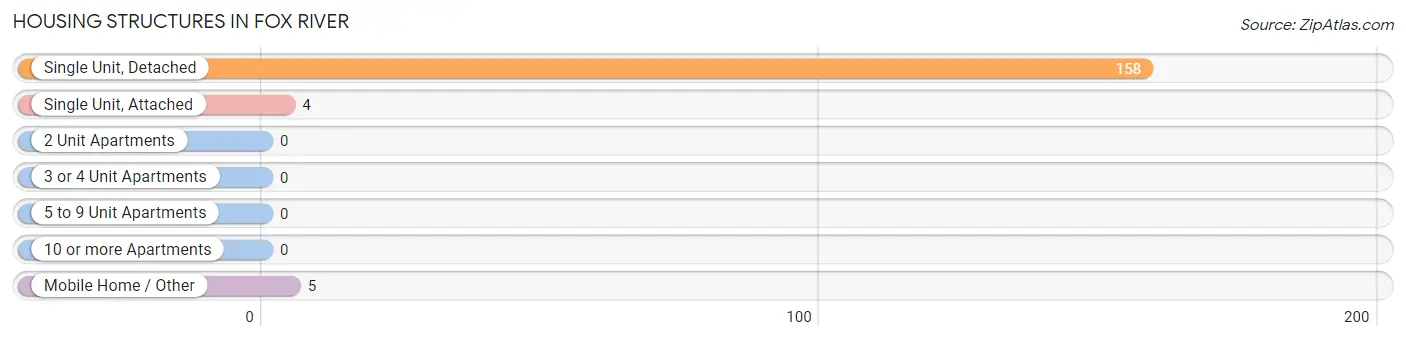
| Structure Type | # Housing Units | % Housing Units |
| Single Unit, Detached | 158 | 94.6% |
| Single Unit, Attached | 4 | 2.4% |
| 2 Unit Apartments | 0 | 0.0% |
| 3 or 4 Unit Apartments | 0 | 0.0% |
| 5 to 9 Unit Apartments | 0 | 0.0% |
| 10 or more Apartments | 0 | 0.0% |
| Mobile Home / Other | 5 | 3.0% |
| Total | 167 | 100.0% |
Housing Structures by Occupancy in Fox River
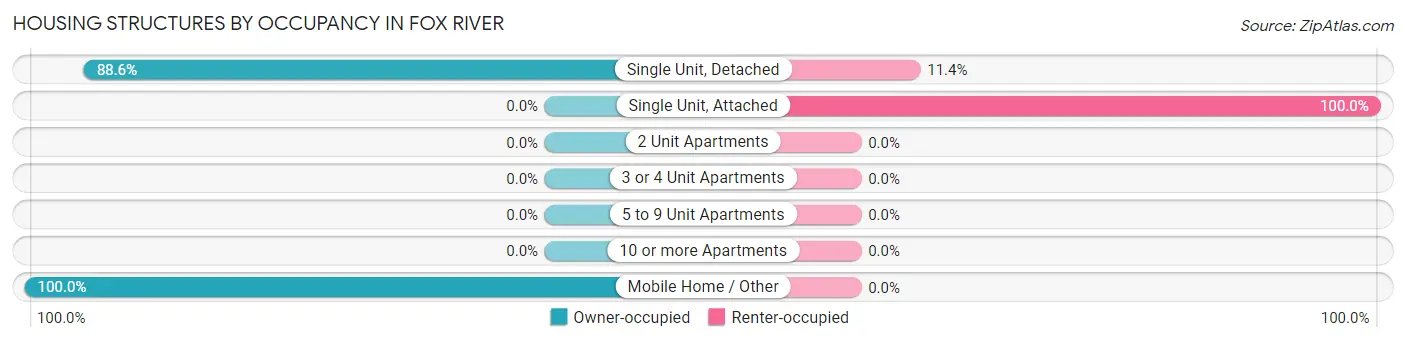
| Structure Type | Owner-occupied | Renter-occupied |
| Single Unit, Detached | 140 (88.6%) | 18 (11.4%) |
| Single Unit, Attached | 0 (0.0%) | 4 (100.0%) |
| 2 Unit Apartments | 0 (0.0%) | 0 (0.0%) |
| 3 or 4 Unit Apartments | 0 (0.0%) | 0 (0.0%) |
| 5 to 9 Unit Apartments | 0 (0.0%) | 0 (0.0%) |
| 10 or more Apartments | 0 (0.0%) | 0 (0.0%) |
| Mobile Home / Other | 5 (100.0%) | 0 (0.0%) |
| Total | 145 (86.8%) | 22 (13.2%) |
Housing Structures by Number of Rooms in Fox River
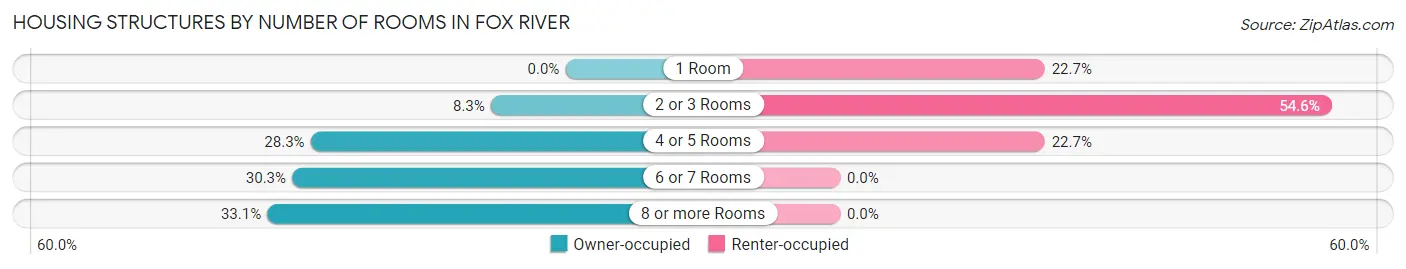
| Number of Rooms | Owner-occupied | Renter-occupied |
| 1 Room | 0 (0.0%) | 5 (22.7%) |
| 2 or 3 Rooms | 12 (8.3%) | 12 (54.5%) |
| 4 or 5 Rooms | 41 (28.3%) | 5 (22.7%) |
| 6 or 7 Rooms | 44 (30.3%) | 0 (0.0%) |
| 8 or more Rooms | 48 (33.1%) | 0 (0.0%) |
| Total | 145 (100.0%) | 22 (100.0%) |
Housing Structure by Heating Type in Fox River
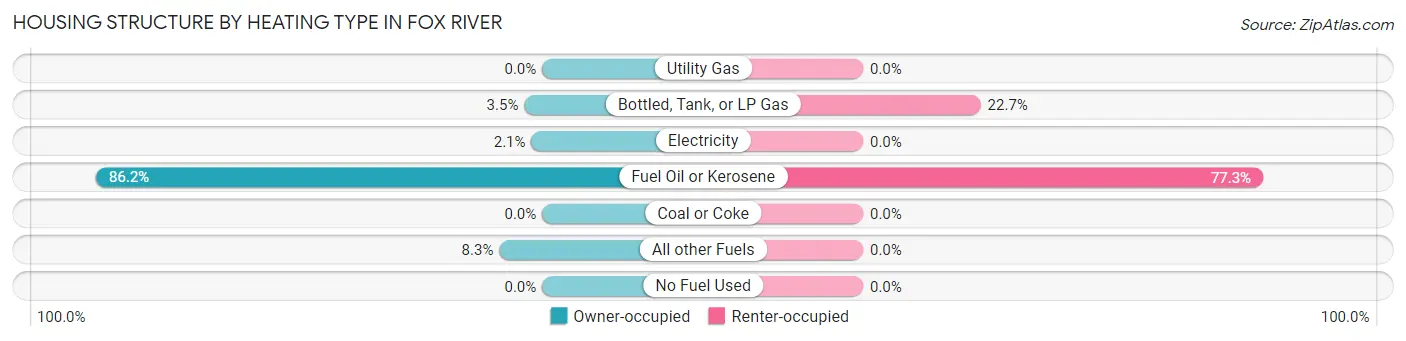
| Heating Type | Owner-occupied | Renter-occupied |
| Utility Gas | 0 (0.0%) | 0 (0.0%) |
| Bottled, Tank, or LP Gas | 5 (3.5%) | 5 (22.7%) |
| Electricity | 3 (2.1%) | 0 (0.0%) |
| Fuel Oil or Kerosene | 125 (86.2%) | 17 (77.3%) |
| Coal or Coke | 0 (0.0%) | 0 (0.0%) |
| All other Fuels | 12 (8.3%) | 0 (0.0%) |
| No Fuel Used | 0 (0.0%) | 0 (0.0%) |
| Total | 145 (100.0%) | 22 (100.0%) |
Household Vehicle Usage in Fox River
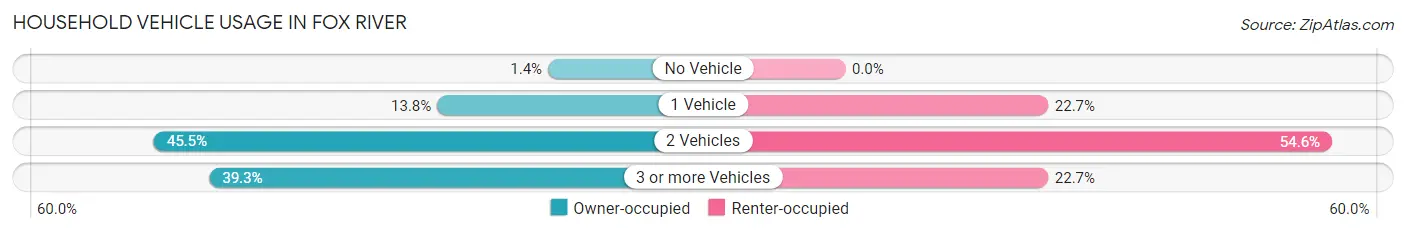
| Vehicles per Household | Owner-occupied | Renter-occupied |
| No Vehicle | 2 (1.4%) | 0 (0.0%) |
| 1 Vehicle | 20 (13.8%) | 5 (22.7%) |
| 2 Vehicles | 66 (45.5%) | 12 (54.5%) |
| 3 or more Vehicles | 57 (39.3%) | 5 (22.7%) |
| Total | 145 (100.0%) | 22 (100.0%) |
Real Estate & Mortgages in Fox River
Real Estate and Mortgage Overview in Fox River
| Characteristic | Without Mortgage | With Mortgage |
| Housing Units | 82 | 63 |
| Median Property Value | $296,200 | $358,300 |
| Median Household Income | $49,500 | $7 |
| Monthly Housing Costs | $581 | $4 |
| Real Estate Taxes | $1,350 | $15 |
Property Value by Mortgage Status in Fox River
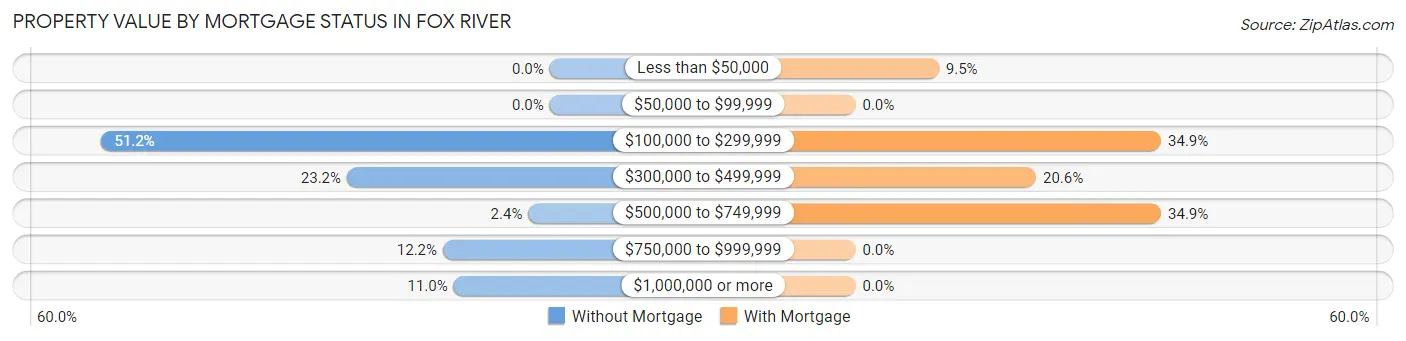
| Property Value | Without Mortgage | With Mortgage |
| Less than $50,000 | 0 (0.0%) | 6 (9.5%) |
| $50,000 to $99,999 | 0 (0.0%) | 0 (0.0%) |
| $100,000 to $299,999 | 42 (51.2%) | 22 (34.9%) |
| $300,000 to $499,999 | 19 (23.2%) | 13 (20.6%) |
| $500,000 to $749,999 | 2 (2.4%) | 22 (34.9%) |
| $750,000 to $999,999 | 10 (12.2%) | 0 (0.0%) |
| $1,000,000 or more | 9 (11.0%) | 0 (0.0%) |
| Total | 82 (100.0%) | 63 (100.0%) |
Household Income by Mortgage Status in Fox River
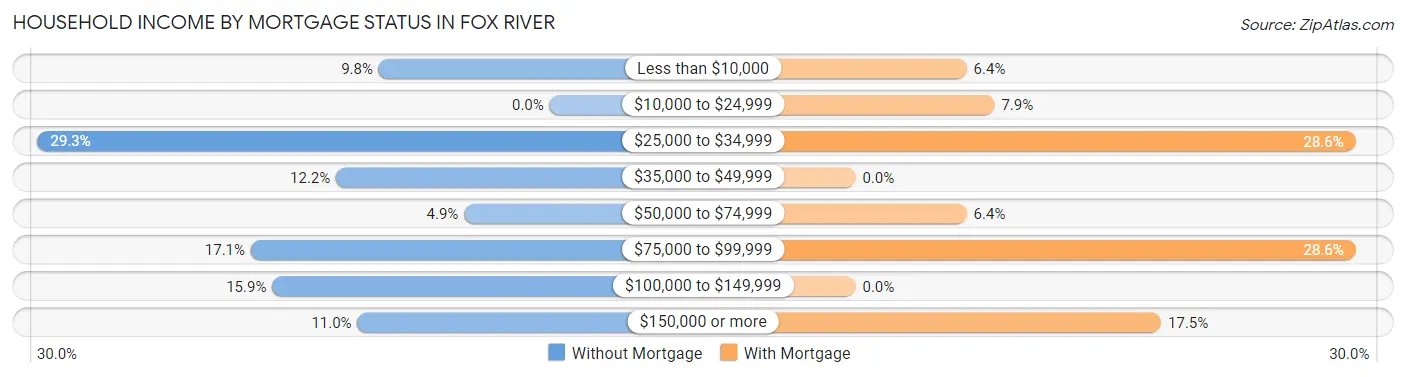
| Household Income | Without Mortgage | With Mortgage |
| Less than $10,000 | 8 (9.8%) | 4 (6.4%) |
| $10,000 to $24,999 | 0 (0.0%) | 5 (7.9%) |
| $25,000 to $34,999 | 24 (29.3%) | 18 (28.6%) |
| $35,000 to $49,999 | 10 (12.2%) | 0 (0.0%) |
| $50,000 to $74,999 | 4 (4.9%) | 4 (6.4%) |
| $75,000 to $99,999 | 14 (17.1%) | 18 (28.6%) |
| $100,000 to $149,999 | 13 (15.9%) | 0 (0.0%) |
| $150,000 or more | 9 (11.0%) | 11 (17.5%) |
| Total | 82 (100.0%) | 63 (100.0%) |
Property Value to Household Income Ratio in Fox River
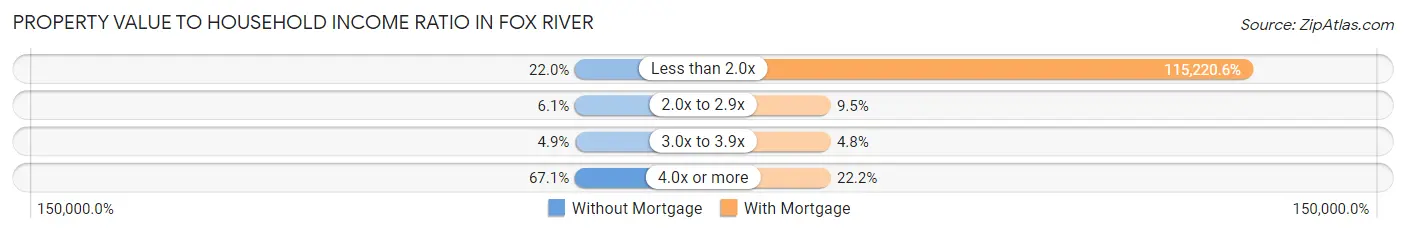
| Value-to-Income Ratio | Without Mortgage | With Mortgage |
| Less than 2.0x | 18 (22.0%) | 72,589 (115,220.6%) |
| 2.0x to 2.9x | 5 (6.1%) | 6 (9.5%) |
| 3.0x to 3.9x | 4 (4.9%) | 3 (4.8%) |
| 4.0x or more | 55 (67.1%) | 14 (22.2%) |
| Total | 82 (100.0%) | 63 (100.0%) |
Real Estate Taxes by Mortgage Status in Fox River
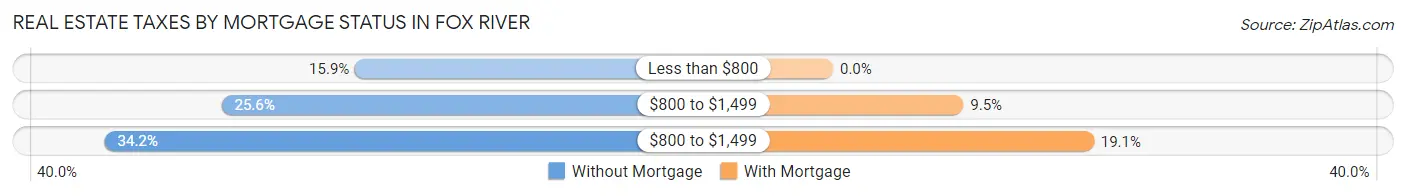
| Property Taxes | Without Mortgage | With Mortgage |
| Less than $800 | 13 (15.9%) | 0 (0.0%) |
| $800 to $1,499 | 21 (25.6%) | 6 (9.5%) |
| $800 to $1,499 | 28 (34.2%) | 12 (19.1%) |
| Total | 82 (100.0%) | 63 (100.0%) |
Health & Disability in Fox River
Health Insurance Coverage by Age in Fox River
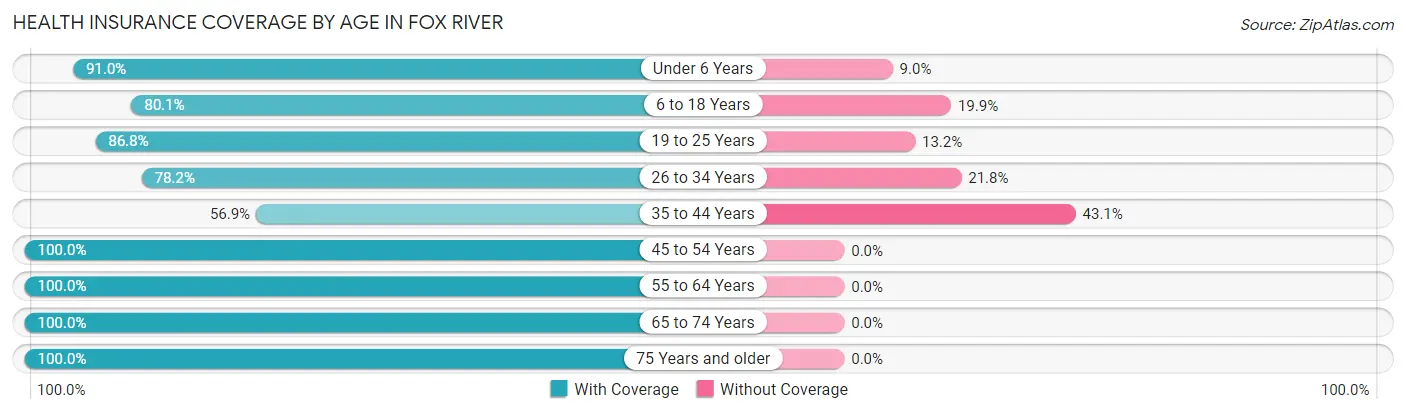
| Age Bracket | With Coverage | Without Coverage |
| Under 6 Years | 111 (91.0%) | 11 (9.0%) |
| 6 to 18 Years | 153 (80.1%) | 38 (19.9%) |
| 19 to 25 Years | 79 (86.8%) | 12 (13.2%) |
| 26 to 34 Years | 86 (78.2%) | 24 (21.8%) |
| 35 to 44 Years | 29 (56.9%) | 22 (43.1%) |
| 45 to 54 Years | 46 (100.0%) | 0 (0.0%) |
| 55 to 64 Years | 54 (100.0%) | 0 (0.0%) |
| 65 to 74 Years | 32 (100.0%) | 0 (0.0%) |
| 75 Years and older | 15 (100.0%) | 0 (0.0%) |
| Total | 605 (85.0%) | 107 (15.0%) |
Health Insurance Coverage by Citizenship Status in Fox River
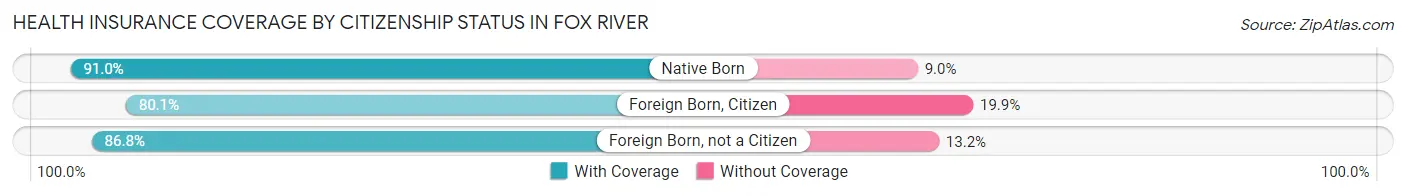
| Citizenship Status | With Coverage | Without Coverage |
| Native Born | 111 (91.0%) | 11 (9.0%) |
| Foreign Born, Citizen | 153 (80.1%) | 38 (19.9%) |
| Foreign Born, not a Citizen | 79 (86.8%) | 12 (13.2%) |
Health Insurance Coverage by Household Income in Fox River
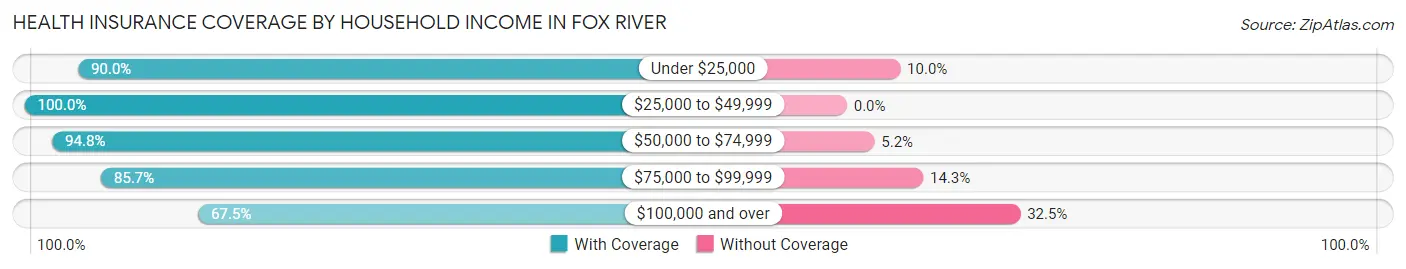
| Household Income | With Coverage | Without Coverage |
| Under $25,000 | 144 (90.0%) | 16 (10.0%) |
| $25,000 to $49,999 | 143 (100.0%) | 0 (0.0%) |
| $50,000 to $74,999 | 110 (94.8%) | 6 (5.2%) |
| $75,000 to $99,999 | 48 (85.7%) | 8 (14.3%) |
| $100,000 and over | 160 (67.5%) | 77 (32.5%) |
Public vs Private Health Insurance Coverage by Age in Fox River
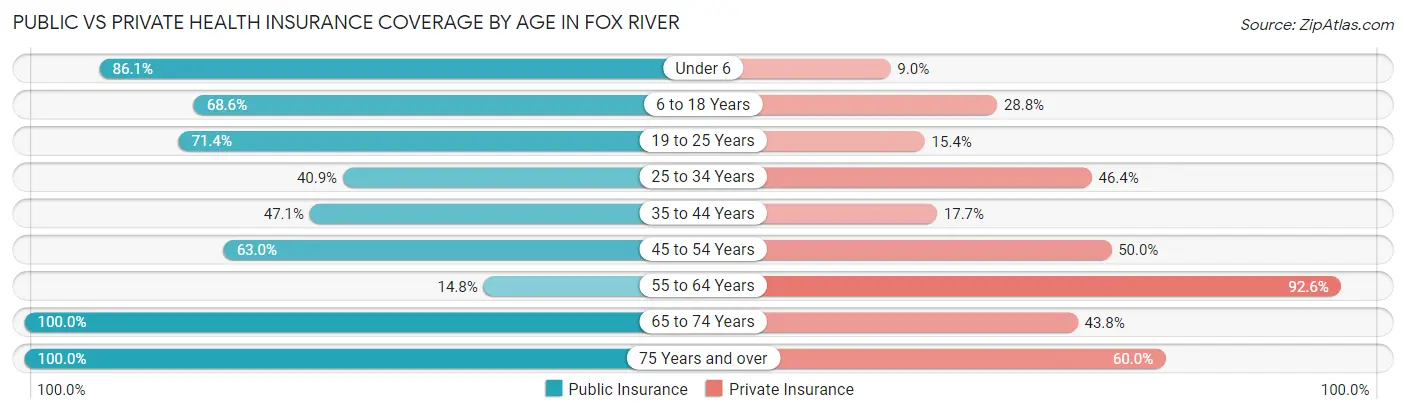
| Age Bracket | Public Insurance | Private Insurance |
| Under 6 | 105 (86.1%) | 11 (9.0%) |
| 6 to 18 Years | 131 (68.6%) | 55 (28.8%) |
| 19 to 25 Years | 65 (71.4%) | 14 (15.4%) |
| 25 to 34 Years | 45 (40.9%) | 51 (46.4%) |
| 35 to 44 Years | 24 (47.1%) | 9 (17.6%) |
| 45 to 54 Years | 29 (63.0%) | 23 (50.0%) |
| 55 to 64 Years | 8 (14.8%) | 50 (92.6%) |
| 65 to 74 Years | 32 (100.0%) | 14 (43.8%) |
| 75 Years and over | 15 (100.0%) | 9 (60.0%) |
| Total | 454 (63.8%) | 236 (33.2%) |
Disability Status by Sex by Age in Fox River
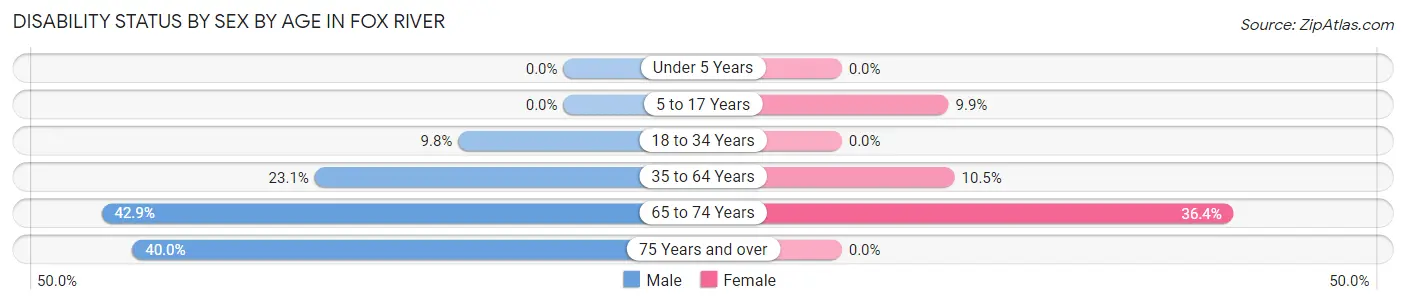
| Age Bracket | Male | Female |
| Under 5 Years | 0 (0.0%) | 0 (0.0%) |
| 5 to 17 Years | 0 (0.0%) | 11 (9.9%) |
| 18 to 34 Years | 12 (9.8%) | 0 (0.0%) |
| 35 to 64 Years | 15 (23.1%) | 9 (10.5%) |
| 65 to 74 Years | 9 (42.9%) | 4 (36.4%) |
| 75 Years and over | 6 (40.0%) | 0 (0.0%) |
Disability Class by Sex by Age in Fox River
Disability Class: Hearing Difficulty
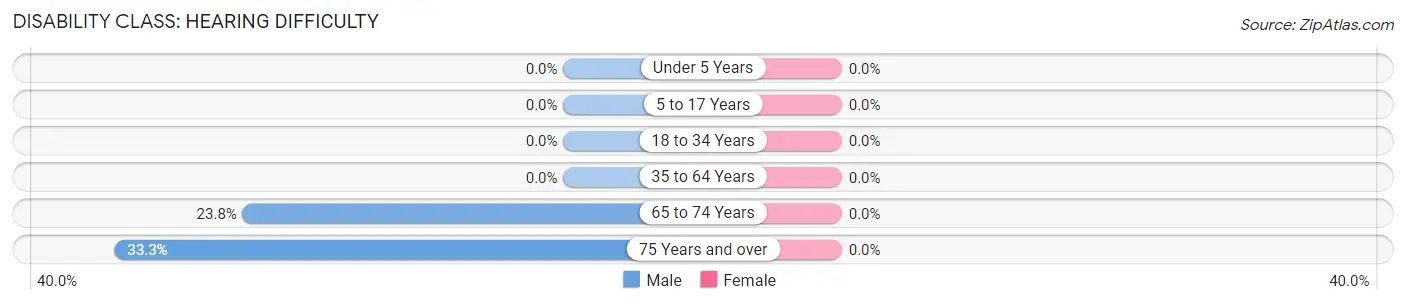
| Age Bracket | Male | Female |
| Under 5 Years | 0 (0.0%) | 0 (0.0%) |
| 5 to 17 Years | 0 (0.0%) | 0 (0.0%) |
| 18 to 34 Years | 0 (0.0%) | 0 (0.0%) |
| 35 to 64 Years | 0 (0.0%) | 0 (0.0%) |
| 65 to 74 Years | 5 (23.8%) | 0 (0.0%) |
| 75 Years and over | 5 (33.3%) | 0 (0.0%) |
Disability Class: Vision Difficulty
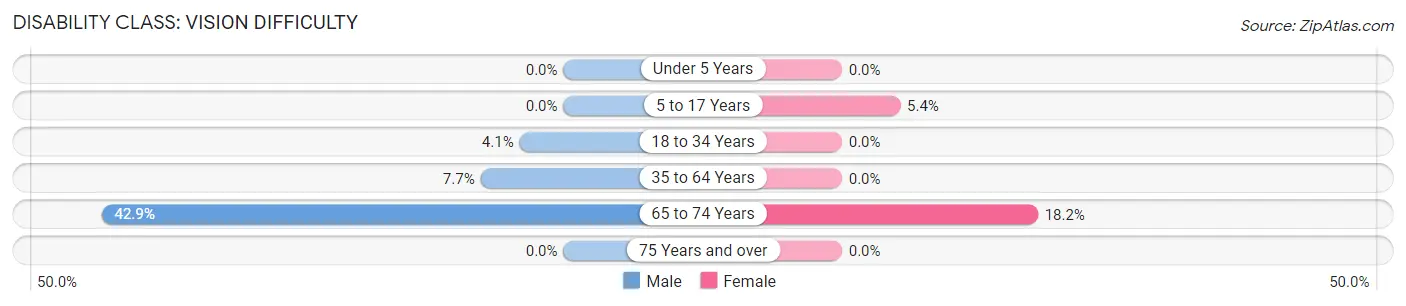
| Age Bracket | Male | Female |
| Under 5 Years | 0 (0.0%) | 0 (0.0%) |
| 5 to 17 Years | 0 (0.0%) | 6 (5.4%) |
| 18 to 34 Years | 5 (4.1%) | 0 (0.0%) |
| 35 to 64 Years | 5 (7.7%) | 0 (0.0%) |
| 65 to 74 Years | 9 (42.9%) | 2 (18.2%) |
| 75 Years and over | 0 (0.0%) | 0 (0.0%) |
Disability Class: Cognitive Difficulty
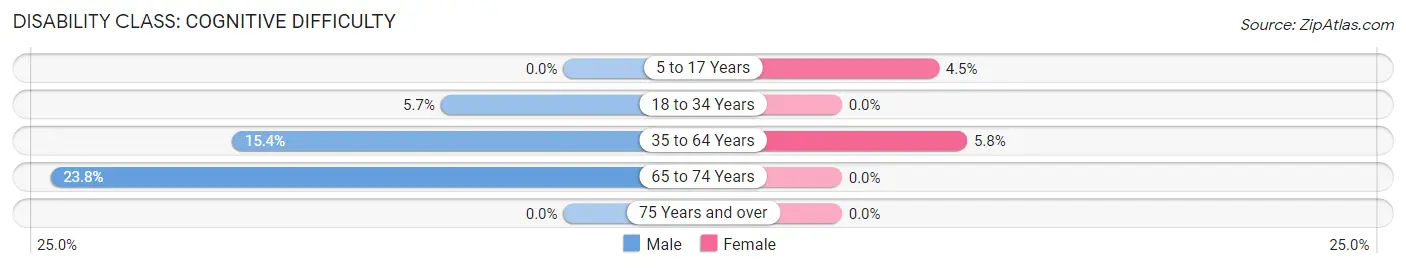
| Age Bracket | Male | Female |
| 5 to 17 Years | 0 (0.0%) | 5 (4.5%) |
| 18 to 34 Years | 7 (5.7%) | 0 (0.0%) |
| 35 to 64 Years | 10 (15.4%) | 5 (5.8%) |
| 65 to 74 Years | 5 (23.8%) | 0 (0.0%) |
| 75 Years and over | 0 (0.0%) | 0 (0.0%) |
Disability Class: Ambulatory Difficulty
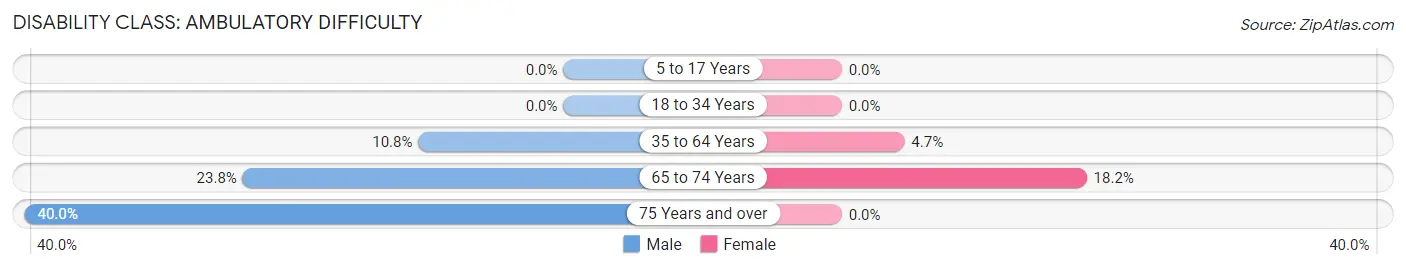
| Age Bracket | Male | Female |
| 5 to 17 Years | 0 (0.0%) | 0 (0.0%) |
| 18 to 34 Years | 0 (0.0%) | 0 (0.0%) |
| 35 to 64 Years | 7 (10.8%) | 4 (4.6%) |
| 65 to 74 Years | 5 (23.8%) | 2 (18.2%) |
| 75 Years and over | 6 (40.0%) | 0 (0.0%) |
Disability Class: Self-Care Difficulty
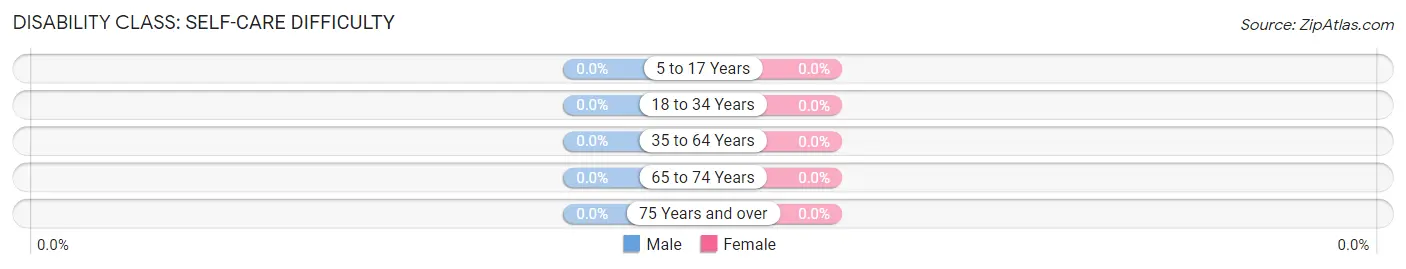
| Age Bracket | Male | Female |
| 5 to 17 Years | 0 (0.0%) | 0 (0.0%) |
| 18 to 34 Years | 0 (0.0%) | 0 (0.0%) |
| 35 to 64 Years | 0 (0.0%) | 0 (0.0%) |
| 65 to 74 Years | 0 (0.0%) | 0 (0.0%) |
| 75 Years and over | 0 (0.0%) | 0 (0.0%) |
Technology Access in Fox River
Computing Device Access in Fox River
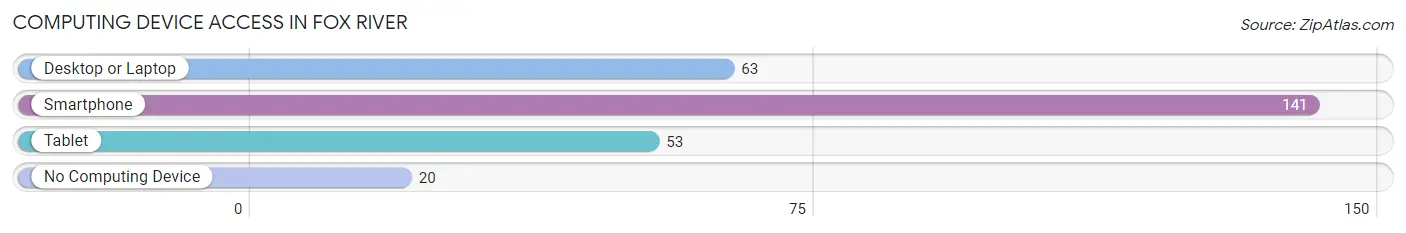
| Device Type | # Households | % Households |
| Desktop or Laptop | 63 | 37.7% |
| Smartphone | 141 | 84.4% |
| Tablet | 53 | 31.7% |
| No Computing Device | 20 | 12.0% |
| Total | 167 | 100.0% |
Internet Access in Fox River
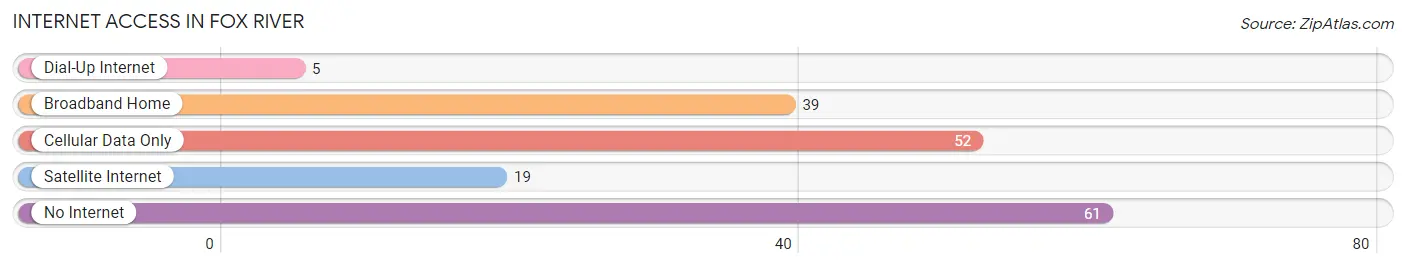
| Internet Type | # Households | % Households |
| Dial-Up Internet | 5 | 3.0% |
| Broadband Home | 39 | 23.4% |
| Cellular Data Only | 52 | 31.1% |
| Satellite Internet | 19 | 11.4% |
| No Internet | 61 | 36.5% |
| Total | 167 | 100.0% |
Fox River Summary
River Fox, AK is a small, rural community located in the Matanuska-Susitna Borough of Alaska. It is situated on the banks of the Susitna River, approximately 40 miles northeast of Anchorage. The population of River Fox, AK was estimated to be around 200 people in 2020.
History
The area now known as River Fox, AK was first inhabited by the Dena’ina Athabascan people. The Dena’ina were a semi-nomadic people who lived off the land, hunting and fishing for sustenance. They were also known for their intricate basket weaving and beadwork.
The first non-native settlers arrived in the area in the late 1800s. These settlers were primarily miners and trappers who were drawn to the area by the abundance of natural resources. The first permanent settlement in the area was established in the early 1900s. This settlement was known as “Fox River” and was located on the banks of the Susitna River.
The settlement of Fox River was a small, rural community that relied heavily on the natural resources of the area. The primary industry was fishing, with the residents also relying on hunting, trapping, and logging for sustenance. The community was also known for its strong sense of community and its close-knit relationships.
Geography
River Fox, AK is located in the Matanuska-Susitna Borough of Alaska. It is situated on the banks of the Susitna River, approximately 40 miles northeast of Anchorage. The area is characterized by its rugged terrain, with the surrounding mountains providing a stunning backdrop. The climate in the area is generally mild, with temperatures ranging from the mid-30s in the winter to the mid-60s in the summer.
The Susitna River is the main waterway in the area, and is a popular destination for fishing, boating, and other recreational activities. The river is also home to a variety of wildlife, including moose, bear, and bald eagles.
Economy
The economy of River Fox, AK is largely based on fishing and tourism. The Susitna River is a popular destination for fishing, boating, and other recreational activities. The area is also home to a number of small businesses, including restaurants, lodging, and retail stores.
The local economy is also supported by the nearby military base, Fort Richardson. The base provides employment opportunities for many of the residents of River Fox, AK.
Demographics
The population of River Fox, AK was estimated to be around 200 people in 2020. The majority of the population is white (90%), with the remaining 10% being of Native American descent. The median age of the population is 44 years old, and the median household income is $50,000.
The area is also home to a number of small businesses, including restaurants, lodging, and retail stores. The local economy is also supported by the nearby military base, Fort Richardson. The base provides employment opportunities for many of the residents of River Fox, AK.
Conclusion
River Fox, AK is a small, rural community located in the Matanuska-Susitna Borough of Alaska. It is situated on the banks of the Susitna River, approximately 40 miles northeast of Anchorage. The population of River Fox, AK was estimated to be around 200 people in 2020. The economy of River Fox, AK is largely based on fishing and tourism, with the local economy also supported by the nearby military base, Fort Richardson. The area is characterized by its rugged terrain, with the surrounding mountains providing a stunning backdrop. The climate in the area is generally mild, with temperatures ranging from the mid-30s in the winter to the mid-60s in the summer. River Fox, AK is a unique and beautiful community that offers its residents a unique lifestyle and a strong sense of community.
Common Questions
What is Per Capita Income in Fox River?
Per Capita income in Fox River is $18,315.
What is the Median Family Income in Fox River?
Median Family Income in Fox River is $70,313.
What is the Median Household income in Fox River?
Median Household Income in Fox River is $70,938.
What is Income or Wage Gap in Fox River?
Income or Wage Gap in Fox River is 29.5%.
Women in Fox River earn 70.5 cents for every dollar earned by a man.
What is Inequality or Gini Index in Fox River?
Inequality or Gini Index in Fox River is 0.41.
What is the Total Population of Fox River?
Total Population of Fox River is 712.
What is the Total Male Population of Fox River?
Total Male Population of Fox River is 341.
What is the Total Female Population of Fox River?
Total Female Population of Fox River is 371.
What is the Ratio of Males per 100 Females in Fox River?
There are 91.91 Males per 100 Females in Fox River.
What is the Ratio of Females per 100 Males in Fox River?
There are 108.80 Females per 100 Males in Fox River.
What is the Median Population Age in Fox River?
Median Population Age in Fox River is 22.0 Years.
What is the Average Family Size in Fox River
Average Family Size in Fox River is 4.5 People.
What is the Average Household Size in Fox River
Average Household Size in Fox River is 4.3 People.
How Large is the Labor Force in Fox River?
There are 239 People in the Labor Forcein in Fox River.
What is the Percentage of People in the Labor Force in Fox River?
57.0% of People are in the Labor Force in Fox River.
What is the Unemployment Rate in Fox River?
Unemployment Rate in Fox River is 15.5%.