Tuntutuliak, AK Map & Demographics
Tuntutuliak Map
Tuntutuliak Overview
$20,965
PER CAPITA INCOME
$47,917
AVG FAMILY INCOME
$43,000
AVG HOUSEHOLD INCOME
$11,000
FAMILY INCOME DEFICIT
0.46
INEQUALITY / GINI INDEX
820
TOTAL POPULATION
326
MALE POPULATION
494
FEMALE POPULATION
65.99
MALES / 100 FEMALES
151.53
FEMALES / 100 MALES
28.2
MEDIAN AGE
5.6
AVG FAMILY SIZE
5.1
AVG HOUSEHOLD SIZE
393
LABOR FORCE [ PEOPLE ]
70.7%
PERCENT IN LABOR FORCE
22.0%
UNEMPLOYMENT RATE
Tuntutuliak Zip Codes
Tuntutuliak Area Codes
Income in Tuntutuliak
Income Overview in Tuntutuliak
Per Capita Income in Tuntutuliak is $20,965, while median incomes of families and households are $47,917 and $43,000 respectively.
| Characteristic | Number | Measure |
| Per Capita Income | 820 | $20,965 |
| Median Family Income | 110 | $47,917 |
| Mean Family Income | 110 | $58,846 |
| Median Household Income | 130 | $43,000 |
| Mean Household Income | 130 | $53,480 |
| Income Deficit | 110 | $11,000 |
| Wage / Income Gap (%) | 820 | 0.00% |
| Wage / Income Gap ($) | 820 | 100.00¢ per $1 |
| Gini / Inequality Index | 820 | 0.46 |
Earnings by Sex in Tuntutuliak
| Sex | Number | Average Earnings |
| Male | 102 (26.5%) | $0 |
| Female | 283 (73.5%) | $0 |
| Total | 385 (100.0%) | $0 |
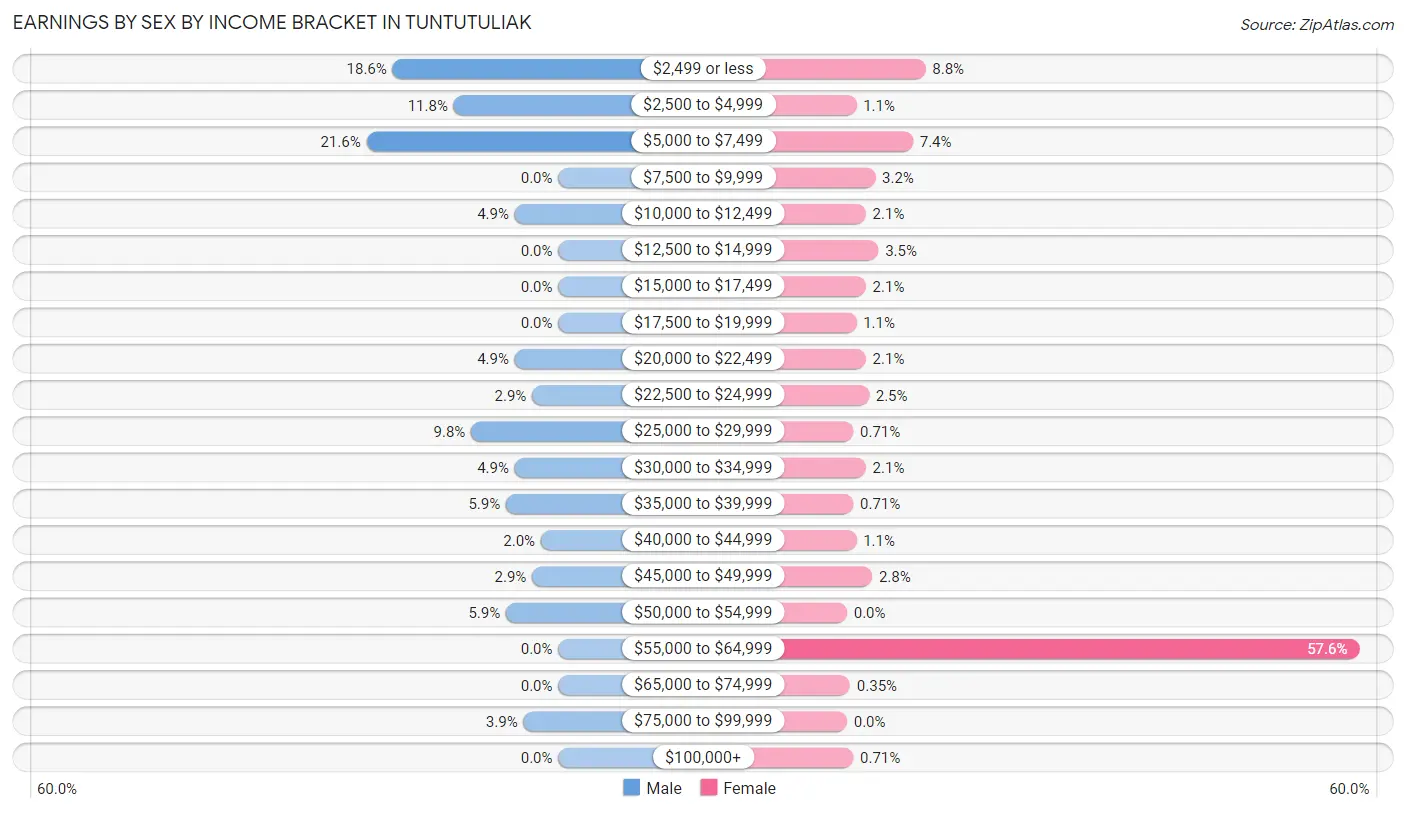
Earnings by Sex by Income Bracket in Tuntutuliak
The most common earnings brackets in Tuntutuliak are $5,000 to $7,499 for men (22 | 21.6%) and $55,000 to $64,999 for women (163 | 57.6%).
| Income | Male | Female |
| $2,499 or less | 19 (18.6%) | 25 (8.8%) |
| $2,500 to $4,999 | 12 (11.8%) | 3 (1.1%) |
| $5,000 to $7,499 | 22 (21.6%) | 21 (7.4%) |
| $7,500 to $9,999 | 0 (0.0%) | 9 (3.2%) |
| $10,000 to $12,499 | 5 (4.9%) | 6 (2.1%) |
| $12,500 to $14,999 | 0 (0.0%) | 10 (3.5%) |
| $15,000 to $17,499 | 0 (0.0%) | 6 (2.1%) |
| $17,500 to $19,999 | 0 (0.0%) | 3 (1.1%) |
| $20,000 to $22,499 | 5 (4.9%) | 6 (2.1%) |
| $22,500 to $24,999 | 3 (2.9%) | 7 (2.5%) |
| $25,000 to $29,999 | 10 (9.8%) | 2 (0.7%) |
| $30,000 to $34,999 | 5 (4.9%) | 6 (2.1%) |
| $35,000 to $39,999 | 6 (5.9%) | 2 (0.7%) |
| $40,000 to $44,999 | 2 (2.0%) | 3 (1.1%) |
| $45,000 to $49,999 | 3 (2.9%) | 8 (2.8%) |
| $50,000 to $54,999 | 6 (5.9%) | 0 (0.0%) |
| $55,000 to $64,999 | 0 (0.0%) | 163 (57.6%) |
| $65,000 to $74,999 | 0 (0.0%) | 1 (0.4%) |
| $75,000 to $99,999 | 4 (3.9%) | 0 (0.0%) |
| $100,000+ | 0 (0.0%) | 2 (0.7%) |
| Total | 102 (100.0%) | 283 (100.0%) |
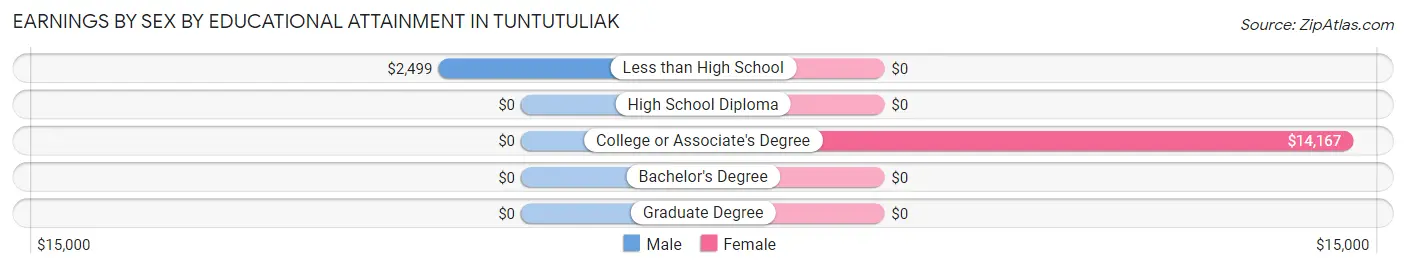
Earnings by Sex by Educational Attainment in Tuntutuliak
| Educational Attainment | Male Income | Female Income |
| Less than High School | $2,499 | $0 |
| High School Diploma | - | - |
| College or Associate's Degree | - | - |
| Bachelor's Degree | - | - |
| Graduate Degree | - | - |
| Total | - | - |
Family Income in Tuntutuliak
Family Income Brackets in Tuntutuliak
According to the Tuntutuliak family income data, there are 28 families falling into the $35,000 to $49,999 income range, which is the most common income bracket and makes up 25.5% of all families.
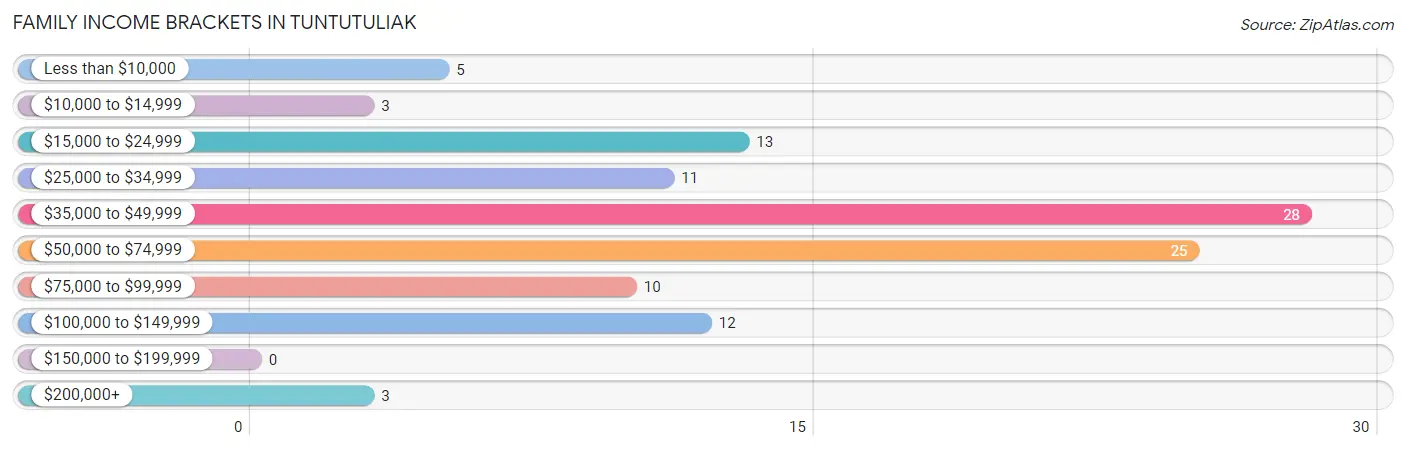
| Income Bracket | # Families | % Families |
| Less than $10,000 | 5 | 4.5% |
| $10,000 to $14,999 | 3 | 2.7% |
| $15,000 to $24,999 | 13 | 11.8% |
| $25,000 to $34,999 | 11 | 10.0% |
| $35,000 to $49,999 | 28 | 25.5% |
| $50,000 to $74,999 | 25 | 22.7% |
| $75,000 to $99,999 | 10 | 9.1% |
| $100,000 to $149,999 | 12 | 10.9% |
| $150,000 to $199,999 | 0 | 0.0% |
| $200,000+ | 3 | 2.7% |
Family Income by Famaliy Size in Tuntutuliak
7+ person families (34 | 30.9%) account for the highest median family income in Tuntutuliak with $68,333 per family, while 2-person families (8 | 7.3%) have the highest median income of $13,334 per family member.
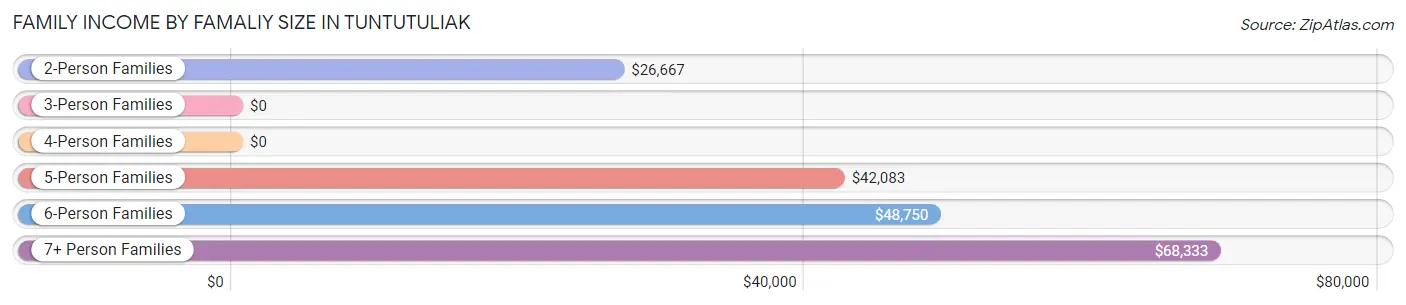
| Income Bracket | # Families | Median Income |
| 2-Person Families | 8 (7.3%) | $26,667 |
| 3-Person Families | 15 (13.6%) | $0 |
| 4-Person Families | 19 (17.3%) | $0 |
| 5-Person Families | 21 (19.1%) | $42,083 |
| 6-Person Families | 13 (11.8%) | $48,750 |
| 7+ Person Families | 34 (30.9%) | $68,333 |
| Total | 110 (100.0%) | $47,917 |
Family Income by Number of Earners in Tuntutuliak
The median family income in Tuntutuliak is $47,917, with families comprising 3+ earners (42) having the highest median family income of $72,500, while families with no earners (17) have the lowest median family income of $25,417, accounting for 38.2% and 15.4% of families, respectively.
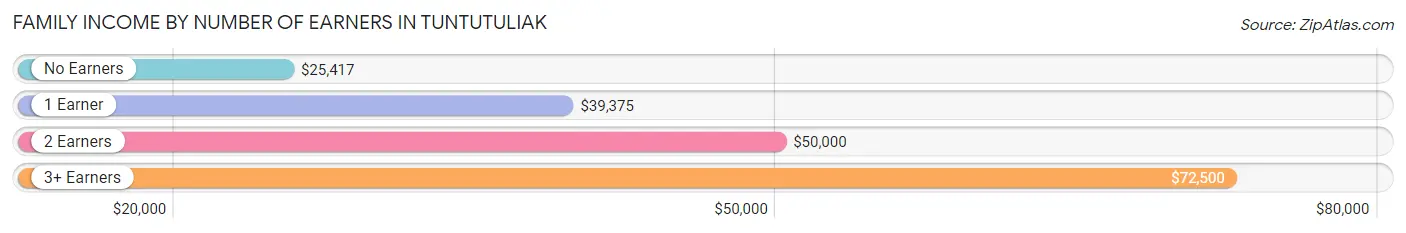
| Number of Earners | # Families | Median Income |
| No Earners | 17 (15.4%) | $25,417 |
| 1 Earner | 33 (30.0%) | $39,375 |
| 2 Earners | 18 (16.4%) | $50,000 |
| 3+ Earners | 42 (38.2%) | $72,500 |
| Total | 110 (100.0%) | $47,917 |
Household Income in Tuntutuliak
Household Income Brackets in Tuntutuliak
With 32 households falling in the category, the $35,000 to $49,999 income range is the most frequent in Tuntutuliak, accounting for 24.6% of all households. In contrast, only 3 households (2.3%) fall into the $10,000 to $14,999 income bracket, making it the least populous group.
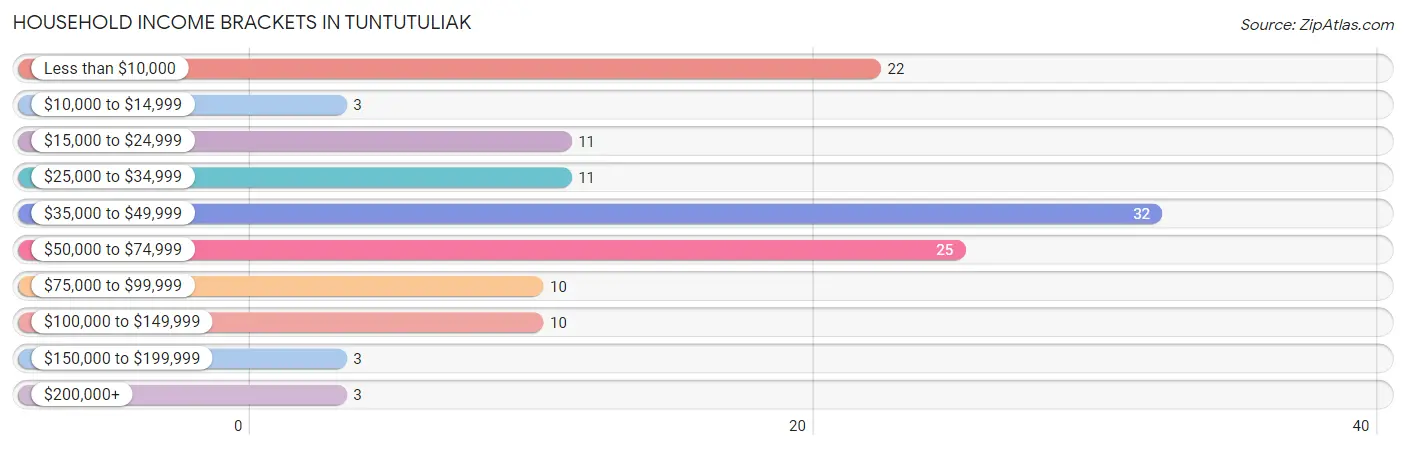
| Income Bracket | # Households | % Households |
| Less than $10,000 | 22 | 16.9% |
| $10,000 to $14,999 | 3 | 2.3% |
| $15,000 to $24,999 | 11 | 8.5% |
| $25,000 to $34,999 | 11 | 8.5% |
| $35,000 to $49,999 | 32 | 24.6% |
| $50,000 to $74,999 | 25 | 19.2% |
| $75,000 to $99,999 | 10 | 7.7% |
| $100,000 to $149,999 | 10 | 7.7% |
| $150,000 to $199,999 | 3 | 2.3% |
| $200,000+ | 3 | 2.3% |
Household Income by Householder Age in Tuntutuliak
The median household income in Tuntutuliak is $43,000, with the highest median household income of $46,250 found in the 65+ years age bracket for the primary householder. A total of 20 households (15.4%) fall into this category. Meanwhile, the 15 to 24 years age bracket for the primary householder has the lowest median household income of $0, with 1 households (0.8%) in this group.
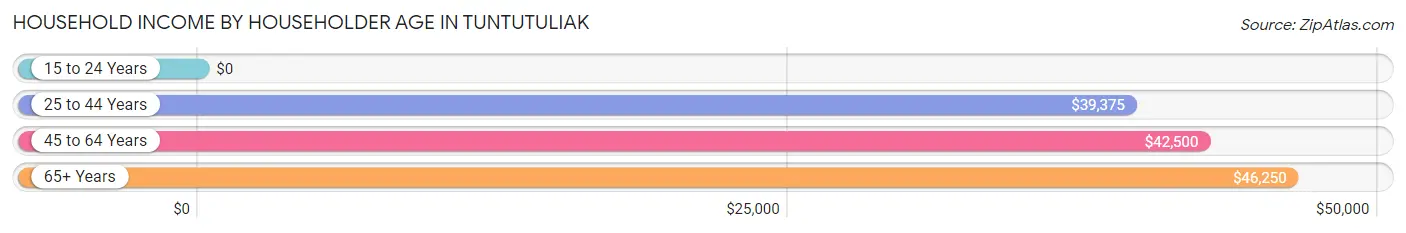
| Income Bracket | # Households | Median Income |
| 15 to 24 Years | 1 (0.8%) | $0 |
| 25 to 44 Years | 41 (31.5%) | $39,375 |
| 45 to 64 Years | 68 (52.3%) | $42,500 |
| 65+ Years | 20 (15.4%) | $46,250 |
| Total | 130 (100.0%) | $43,000 |
Poverty in Tuntutuliak
Income Below Poverty by Sex and Age in Tuntutuliak
With 50.9% poverty level for males and 27.1% for females among the residents of Tuntutuliak, 45 to 54 year old males and 35 to 44 year old females are the most vulnerable to poverty, with 21 males (70.0%) and 19 females (67.9%) in their respective age groups living below the poverty level.
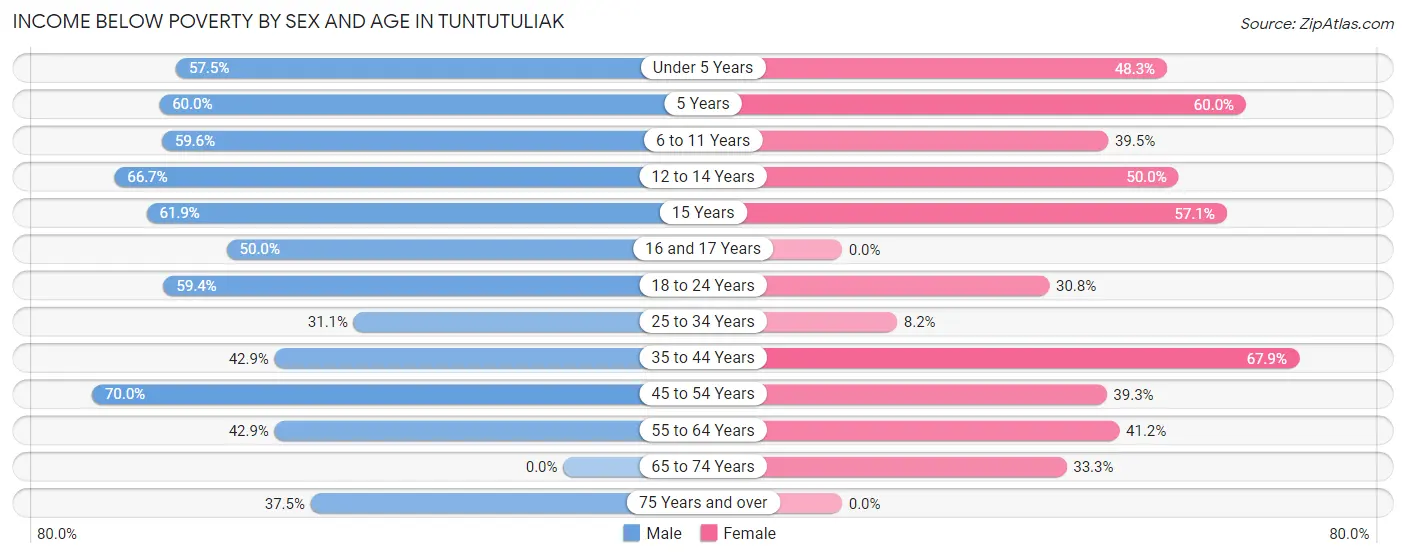
| Age Bracket | Male | Female |
| Under 5 Years | 23 (57.5%) | 28 (48.3%) |
| 5 Years | 3 (60.0%) | 3 (60.0%) |
| 6 to 11 Years | 31 (59.6%) | 17 (39.5%) |
| 12 to 14 Years | 10 (66.7%) | 9 (50.0%) |
| 15 Years | 13 (61.9%) | 4 (57.1%) |
| 16 and 17 Years | 5 (50.0%) | 0 (0.0%) |
| 18 to 24 Years | 19 (59.4%) | 16 (30.8%) |
| 25 to 34 Years | 14 (31.1%) | 17 (8.2%) |
| 35 to 44 Years | 12 (42.9%) | 19 (67.9%) |
| 45 to 54 Years | 21 (70.0%) | 11 (39.3%) |
| 55 to 64 Years | 12 (42.9%) | 7 (41.2%) |
| 65 to 74 Years | 0 (0.0%) | 3 (33.3%) |
| 75 Years and over | 3 (37.5%) | 0 (0.0%) |
| Total | 166 (50.9%) | 134 (27.1%) |
Income Above Poverty by Sex and Age in Tuntutuliak
According to the poverty statistics in Tuntutuliak, males aged 65 to 74 years and females aged 16 and 17 years are the age groups that are most secure financially, with 100.0% of males and 100.0% of females in these age groups living above the poverty line.
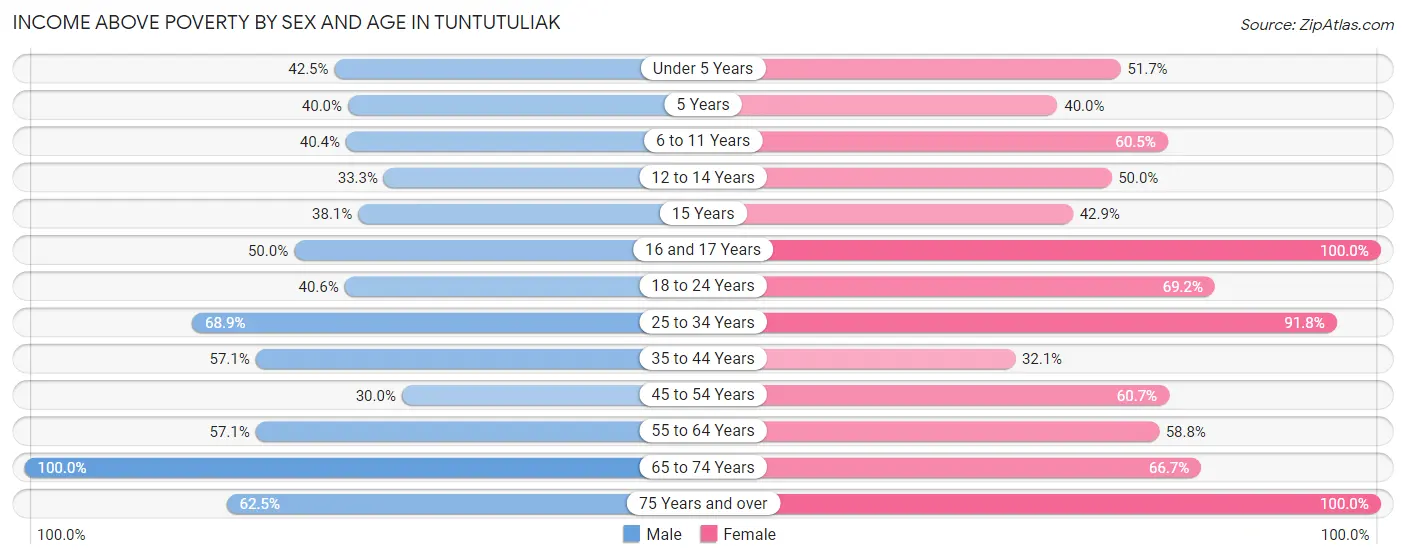
| Age Bracket | Male | Female |
| Under 5 Years | 17 (42.5%) | 30 (51.7%) |
| 5 Years | 2 (40.0%) | 2 (40.0%) |
| 6 to 11 Years | 21 (40.4%) | 26 (60.5%) |
| 12 to 14 Years | 5 (33.3%) | 9 (50.0%) |
| 15 Years | 8 (38.1%) | 3 (42.9%) |
| 16 and 17 Years | 5 (50.0%) | 10 (100.0%) |
| 18 to 24 Years | 13 (40.6%) | 36 (69.2%) |
| 25 to 34 Years | 31 (68.9%) | 191 (91.8%) |
| 35 to 44 Years | 16 (57.1%) | 9 (32.1%) |
| 45 to 54 Years | 9 (30.0%) | 17 (60.7%) |
| 55 to 64 Years | 16 (57.1%) | 10 (58.8%) |
| 65 to 74 Years | 12 (100.0%) | 6 (66.7%) |
| 75 Years and over | 5 (62.5%) | 11 (100.0%) |
| Total | 160 (49.1%) | 360 (72.9%) |
Income Below Poverty Among Married-Couple Families in Tuntutuliak
The poverty statistics for married-couple families in Tuntutuliak show that 33.3% or 27 of the total 81 families live below the poverty line. Families with 3 or 4 children have the highest poverty rate of 54.2%, comprising of 13 families. On the other hand, families with no children have the lowest poverty rate of 0.0%, which includes 0 families.
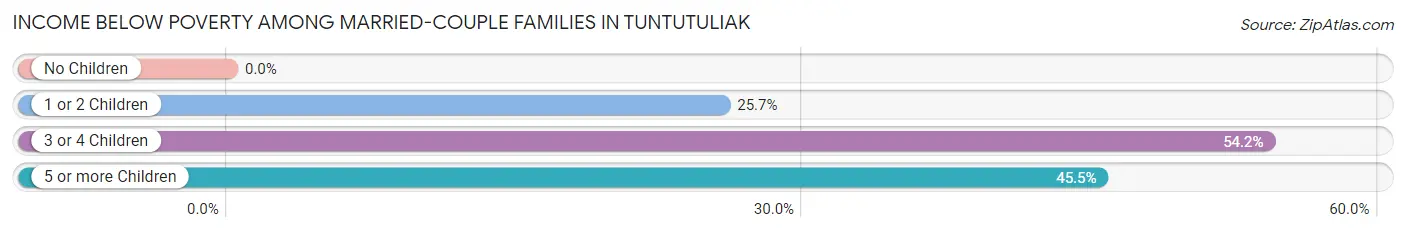
| Children | Above Poverty | Below Poverty |
| No Children | 11 (100.0%) | 0 (0.0%) |
| 1 or 2 Children | 26 (74.3%) | 9 (25.7%) |
| 3 or 4 Children | 11 (45.8%) | 13 (54.2%) |
| 5 or more Children | 6 (54.5%) | 5 (45.5%) |
| Total | 54 (66.7%) | 27 (33.3%) |
Income Below Poverty Among Single-Parent Households in Tuntutuliak
According to the poverty data in Tuntutuliak, 53.3% or 8 single-father households and 57.1% or 8 single-mother households are living below the poverty line. Among single-father households, those with 5 or more children have the highest poverty rate, with 3 households (100.0%) experiencing poverty. Likewise, among single-mother households, those with 1 or 2 children have the highest poverty rate, with 8 households (57.1%) falling below the poverty line.
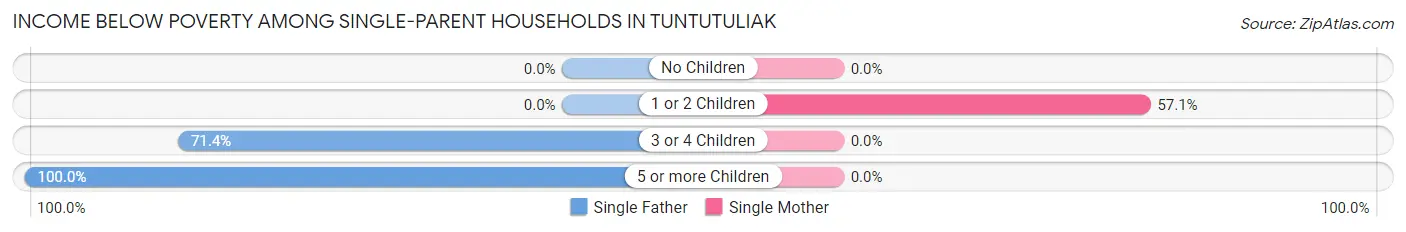
| Children | Single Father | Single Mother |
| No Children | 0 (0.0%) | 0 (0.0%) |
| 1 or 2 Children | 0 (0.0%) | 8 (57.1%) |
| 3 or 4 Children | 5 (71.4%) | 0 (0.0%) |
| 5 or more Children | 3 (100.0%) | 0 (0.0%) |
| Total | 8 (53.3%) | 8 (57.1%) |
Income Below Poverty Among Married-Couple vs Single-Parent Households in Tuntutuliak
The poverty data for Tuntutuliak shows that 27 of the married-couple family households (33.3%) and 16 of the single-parent households (55.2%) are living below the poverty level. Within the married-couple family households, those with 3 or 4 children have the highest poverty rate, with 13 households (54.2%) falling below the poverty line. Among the single-parent households, those with 5 or more children have the highest poverty rate, with 3 household (100.0%) living below poverty.
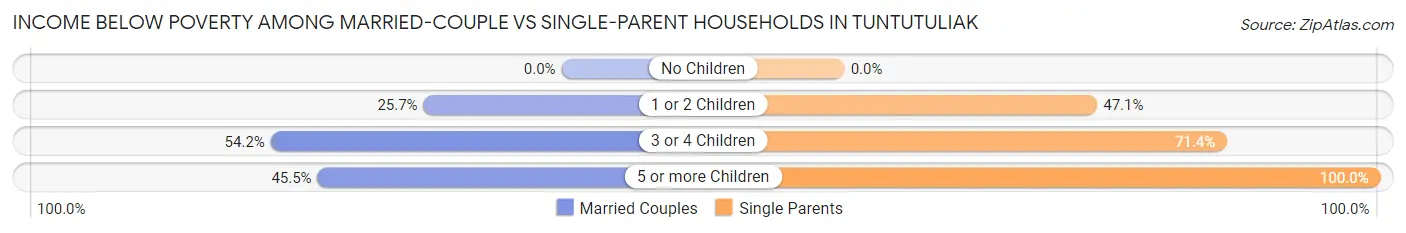
| Children | Married-Couple Families | Single-Parent Households |
| No Children | 0 (0.0%) | 0 (0.0%) |
| 1 or 2 Children | 9 (25.7%) | 8 (47.1%) |
| 3 or 4 Children | 13 (54.2%) | 5 (71.4%) |
| 5 or more Children | 5 (45.5%) | 3 (100.0%) |
| Total | 27 (33.3%) | 16 (55.2%) |
Race in Tuntutuliak
The most populous races in Tuntutuliak are Native / Alaskan (815 | 99.4%), Two or more Races (3 | 0.4%), and White / Caucasian (2 | 0.2%).
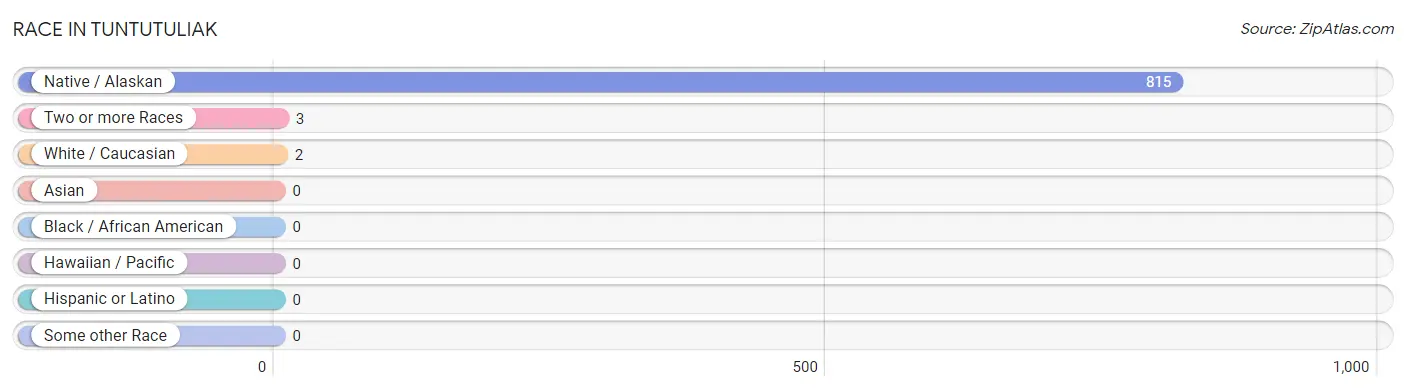
| Race | # Population | % Population |
| Asian | 0 | 0.0% |
| Black / African American | 0 | 0.0% |
| Hawaiian / Pacific | 0 | 0.0% |
| Hispanic or Latino | 0 | 0.0% |
| Native / Alaskan | 815 | 99.4% |
| White / Caucasian | 2 | 0.2% |
| Two or more Races | 3 | 0.4% |
| Some other Race | 0 | 0.0% |
| Total | 820 | 100.0% |
Ancestry in Tuntutuliak
The most populous ancestries reported in Tuntutuliak are Yup'ik (656 | 80.0%), Inupiat (162 | 19.8%), Russian (12 | 1.5%), English (1 | 0.1%), and German (1 | 0.1%), together accounting for 101.5% of all Tuntutuliak residents.
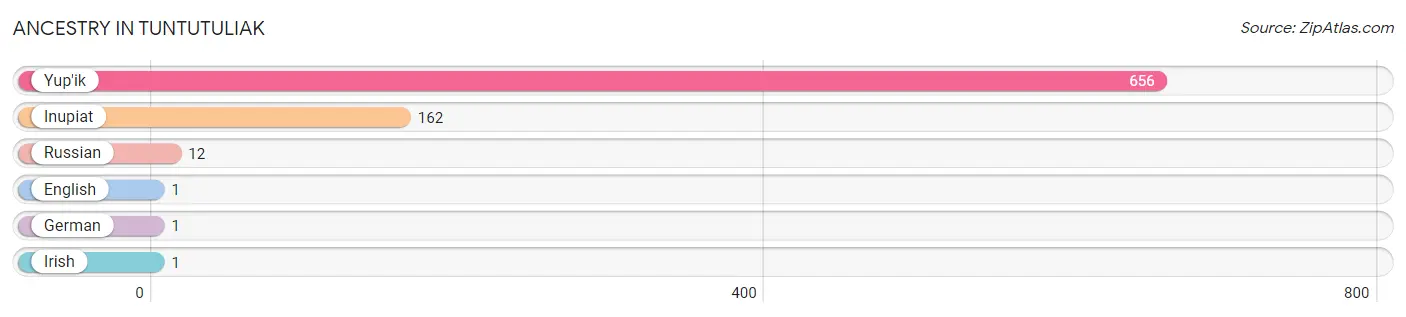
| Ancestry | # Population | % Population |
| English | 1 | 0.1% |
| German | 1 | 0.1% |
| Inupiat | 162 | 19.8% |
| Irish | 1 | 0.1% |
| Russian | 12 | 1.5% |
| Yup'ik | 656 | 80.0% | View All 6 Rows |
Immigrants in Tuntutuliak

| Immigration Origin | # Population | % Population | View All 0 Rows |
Sex and Age in Tuntutuliak
Sex and Age in Tuntutuliak
The most populous age groups in Tuntutuliak are 15 to 19 Years (50 | 15.3%) for men and 25 to 29 Years (184 | 37.2%) for women.
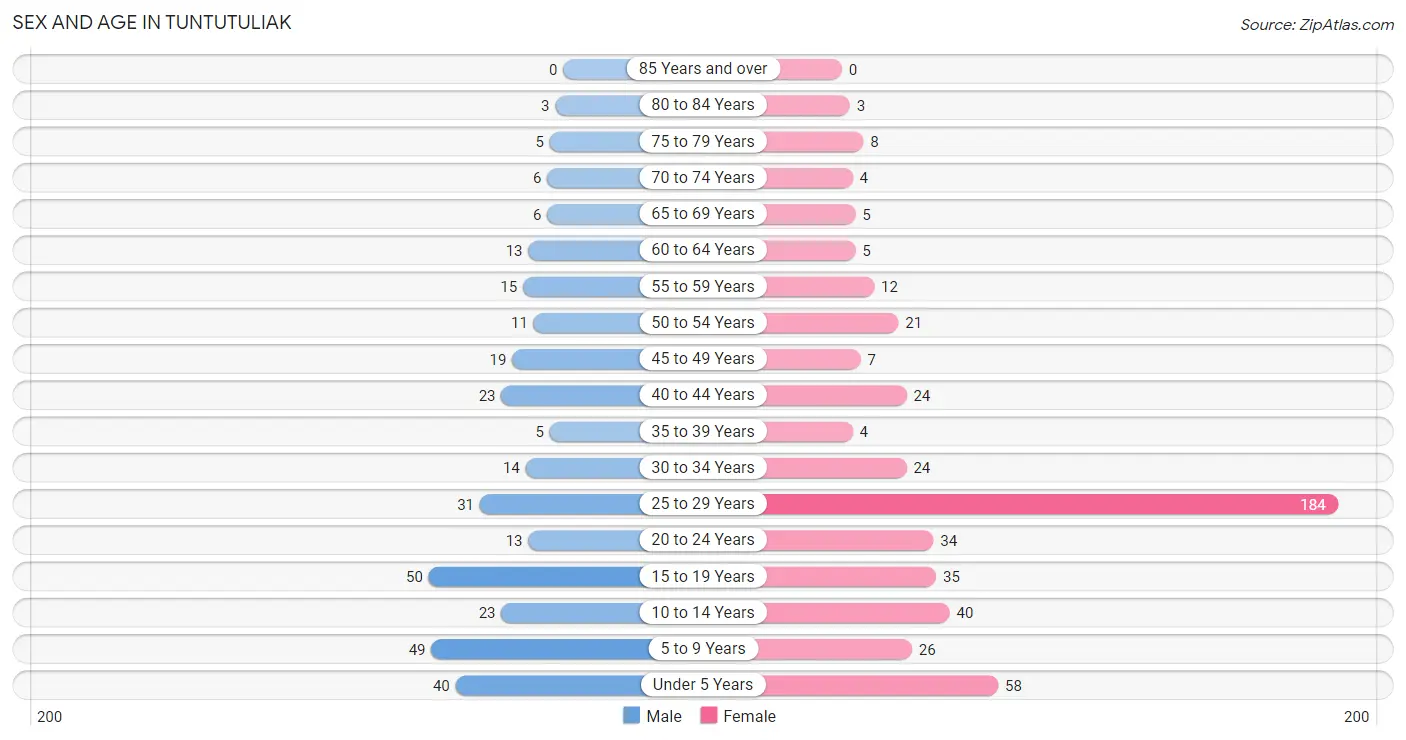
| Age Bracket | Male | Female |
| Under 5 Years | 40 (12.3%) | 58 (11.7%) |
| 5 to 9 Years | 49 (15.0%) | 26 (5.3%) |
| 10 to 14 Years | 23 (7.1%) | 40 (8.1%) |
| 15 to 19 Years | 50 (15.3%) | 35 (7.1%) |
| 20 to 24 Years | 13 (4.0%) | 34 (6.9%) |
| 25 to 29 Years | 31 (9.5%) | 184 (37.2%) |
| 30 to 34 Years | 14 (4.3%) | 24 (4.9%) |
| 35 to 39 Years | 5 (1.5%) | 4 (0.8%) |
| 40 to 44 Years | 23 (7.1%) | 24 (4.9%) |
| 45 to 49 Years | 19 (5.8%) | 7 (1.4%) |
| 50 to 54 Years | 11 (3.4%) | 21 (4.3%) |
| 55 to 59 Years | 15 (4.6%) | 12 (2.4%) |
| 60 to 64 Years | 13 (4.0%) | 5 (1.0%) |
| 65 to 69 Years | 6 (1.8%) | 5 (1.0%) |
| 70 to 74 Years | 6 (1.8%) | 4 (0.8%) |
| 75 to 79 Years | 5 (1.5%) | 8 (1.6%) |
| 80 to 84 Years | 3 (0.9%) | 3 (0.6%) |
| 85 Years and over | 0 (0.0%) | 0 (0.0%) |
| Total | 326 (100.0%) | 494 (100.0%) |
Families and Households in Tuntutuliak
Median Family Size in Tuntutuliak
The median family size in Tuntutuliak is 5.64 persons per family, with married-couple families (81 | 73.6%) accounting for the largest median family size of 6.06 persons per family. On the other hand, single female/mother families (14 | 12.7%) represent the smallest median family size with 3.64 persons per family.
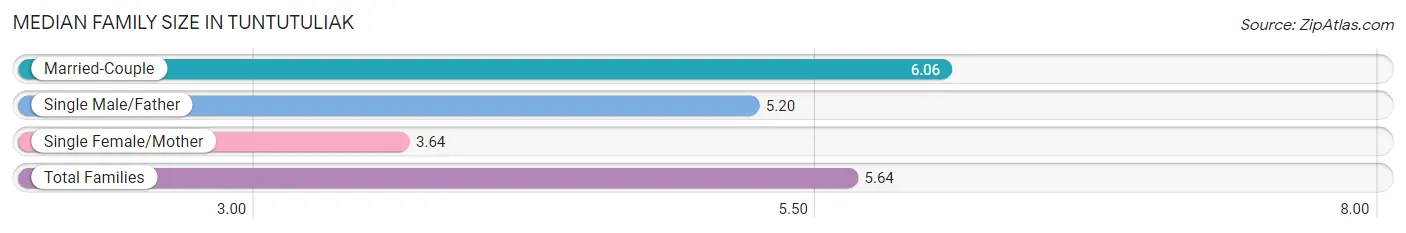
| Family Type | # Families | Family Size |
| Married-Couple | 81 (73.6%) | 6.06 |
| Single Male/Father | 15 (13.6%) | 5.20 |
| Single Female/Mother | 14 (12.7%) | 3.64 |
| Total Families | 110 (100.0%) | 5.64 |
Median Household Size in Tuntutuliak
The median household size in Tuntutuliak is 5.08 persons per household, with single male/father households (15 | 11.5%) accounting for the largest median household size of 6.2 persons per household. non-family households (20 | 15.4%) represent the smallest median household size with 1.05 persons per household.
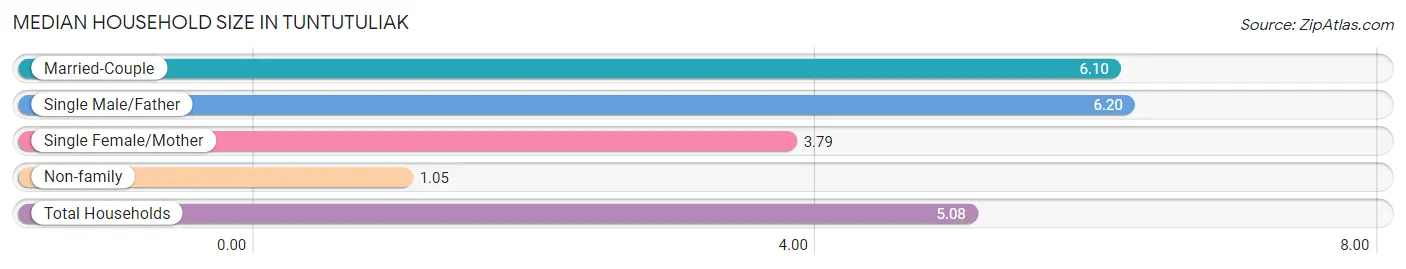
| Household Type | # Households | Household Size |
| Married-Couple | 81 (62.3%) | 6.10 |
| Single Male/Father | 15 (11.5%) | 6.20 |
| Single Female/Mother | 14 (10.8%) | 3.79 |
| Non-family | 20 (15.4%) | 1.05 |
| Total Households | 130 (100.0%) | 5.08 |
Household Size by Marriage Status in Tuntutuliak
Out of a total of 130 households in Tuntutuliak, 110 (84.6%) are family households, while 20 (15.4%) are nonfamily households. The most numerous type of family households are 7+ person households, comprising 37, and the most common type of nonfamily households are 1-person households, comprising 19.
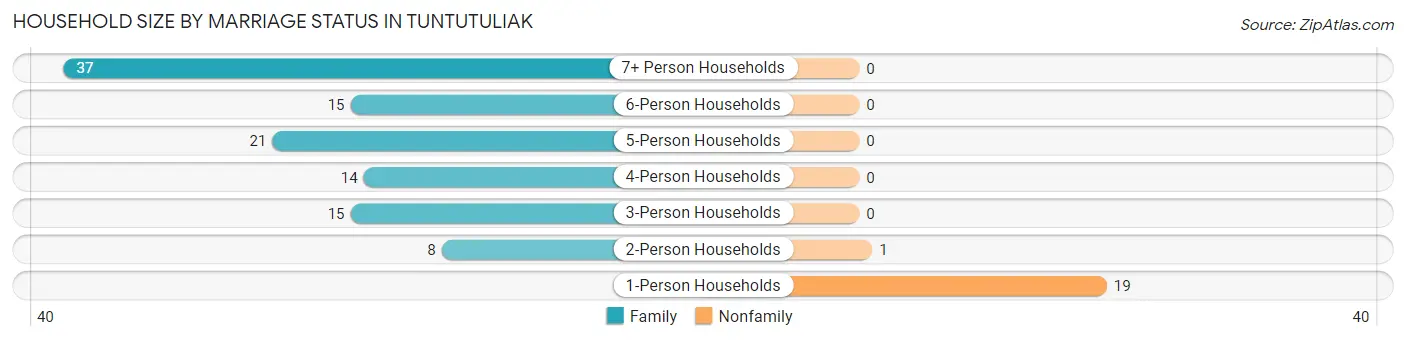
| Household Size | Family Households | Nonfamily Households |
| 1-Person Households | - | 19 (14.6%) |
| 2-Person Households | 8 (6.1%) | 1 (0.8%) |
| 3-Person Households | 15 (11.5%) | 0 (0.0%) |
| 4-Person Households | 14 (10.8%) | 0 (0.0%) |
| 5-Person Households | 21 (16.2%) | 0 (0.0%) |
| 6-Person Households | 15 (11.5%) | 0 (0.0%) |
| 7+ Person Households | 37 (28.5%) | 0 (0.0%) |
| Total | 110 (84.6%) | 20 (15.4%) |
Female Fertility in Tuntutuliak
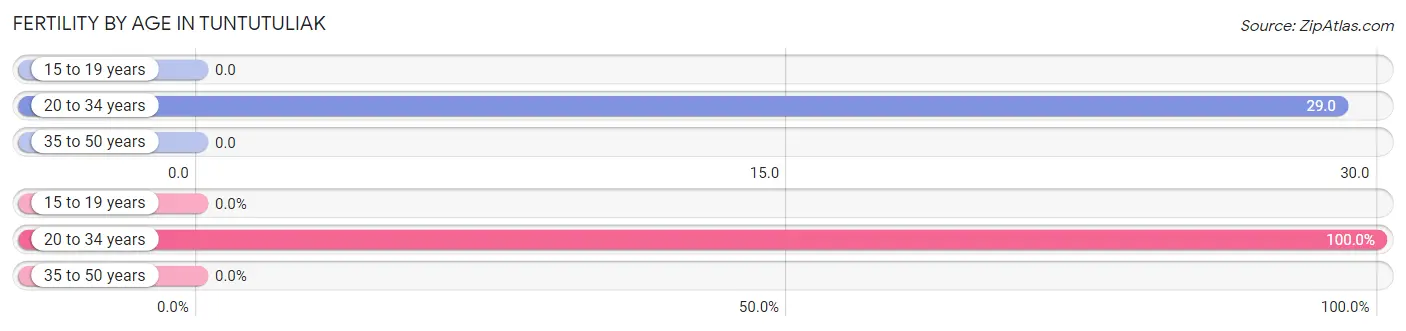
Fertility by Age in Tuntutuliak
Average fertility rate in Tuntutuliak is 22.0 births per 1,000 women. Women in the age bracket of 20 to 34 years have the highest fertility rate with 29.0 births per 1,000 women. Women in the age bracket of 20 to 34 years acount for 100.0% of all women with births.
| Age Bracket | Women with Births | Births / 1,000 Women |
| 15 to 19 years | 0 (0.0%) | 0.0 |
| 20 to 34 years | 7 (100.0%) | 29.0 |
| 35 to 50 years | 0 (0.0%) | 0.0 |
| Total | 7 (100.0%) | 22.0 |
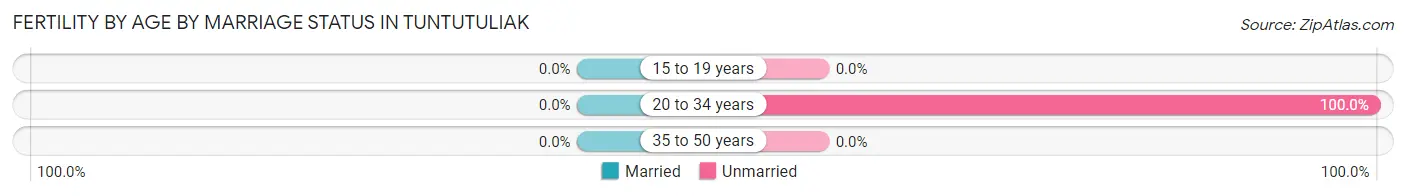
Fertility by Age by Marriage Status in Tuntutuliak
| Age Bracket | Married | Unmarried |
| 15 to 19 years | 0 (0.0%) | 0 (0.0%) |
| 20 to 34 years | 0 (0.0%) | 7 (100.0%) |
| 35 to 50 years | 0 (0.0%) | 0 (0.0%) |
| Total | 0 (0.0%) | 7 (100.0%) |
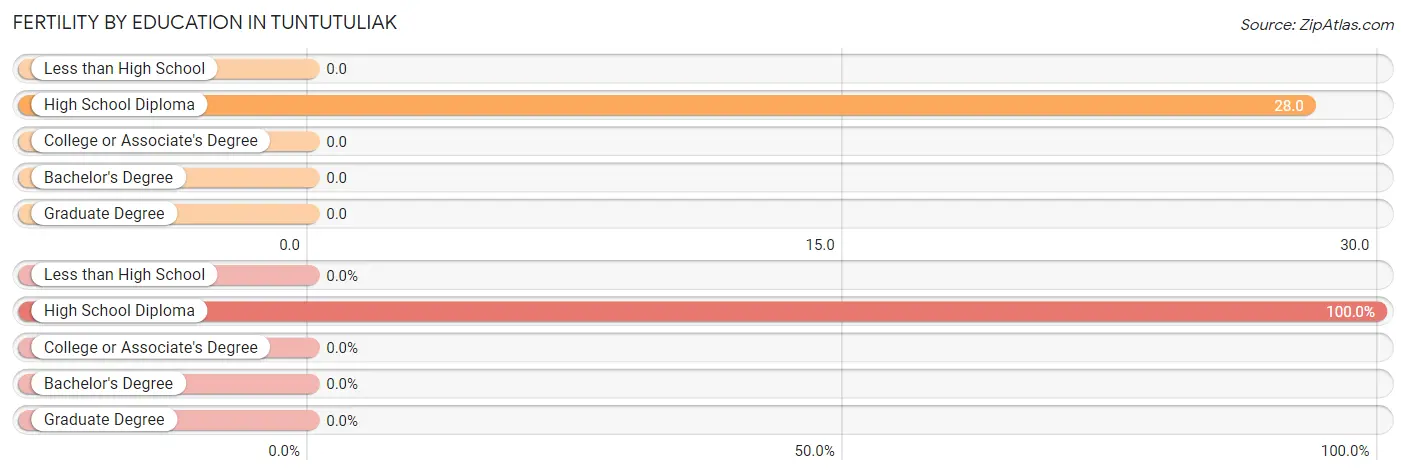
Fertility by Education in Tuntutuliak
| Educational Attainment | Women with Births | Births / 1,000 Women |
| Less than High School | 0 (0.0%) | 0.0 |
| High School Diploma | 7 (100.0%) | 28.0 |
| College or Associate's Degree | 0 (0.0%) | 0.0 |
| Bachelor's Degree | 0 (0.0%) | 0.0 |
| Graduate Degree | 0 (0.0%) | 0.0 |
| Total | 7 (100.0%) | 22.0 |
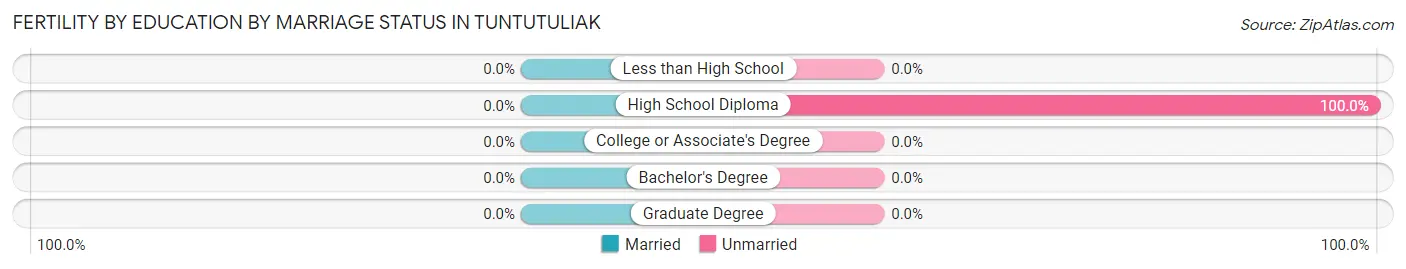
Fertility by Education by Marriage Status in Tuntutuliak
| Educational Attainment | Married | Unmarried |
| Less than High School | 0 (0.0%) | 0 (0.0%) |
| High School Diploma | 0 (0.0%) | 7 (100.0%) |
| College or Associate's Degree | 0 (0.0%) | 0 (0.0%) |
| Bachelor's Degree | 0 (0.0%) | 0 (0.0%) |
| Graduate Degree | 0 (0.0%) | 0 (0.0%) |
| Total | 0 (0.0%) | 7 (100.0%) |
Employment Characteristics in Tuntutuliak
Employment by Class of Employer in Tuntutuliak
Among the 307 employed individuals in Tuntutuliak, local government employees (207 | 67.4%), private company employees (45 | 14.7%), and state government employees (21 | 6.8%) make up the most common classes of employment.
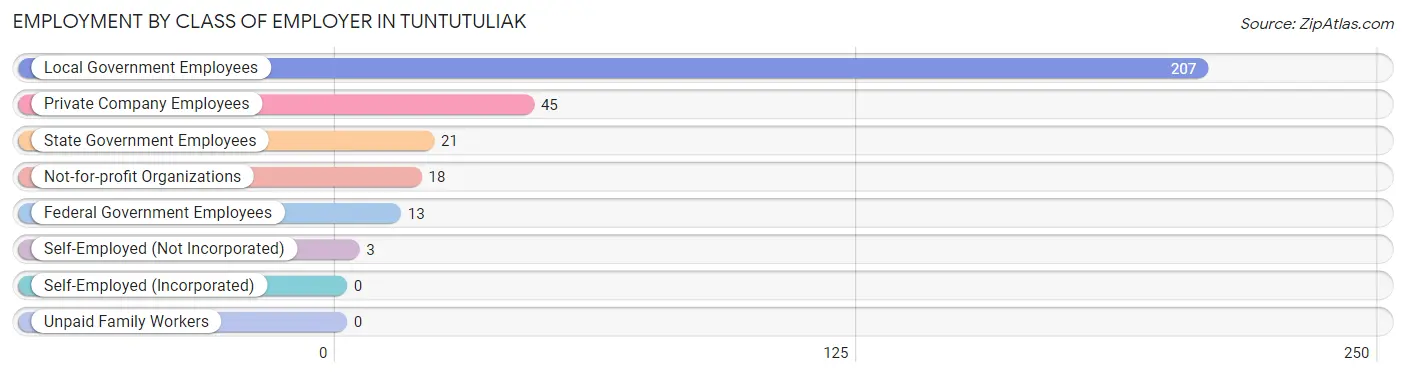
| Employer Class | # Employees | % Employees |
| Private Company Employees | 45 | 14.7% |
| Self-Employed (Incorporated) | 0 | 0.0% |
| Self-Employed (Not Incorporated) | 3 | 1.0% |
| Not-for-profit Organizations | 18 | 5.9% |
| Local Government Employees | 207 | 67.4% |
| State Government Employees | 21 | 6.8% |
| Federal Government Employees | 13 | 4.2% |
| Unpaid Family Workers | 0 | 0.0% |
| Total | 307 | 100.0% |
Employment Status by Age in Tuntutuliak
According to the labor force statistics for Tuntutuliak, out of the total population over 16 years of age (556), 70.7% or 393 individuals are in the labor force, with 22.0% or 86 of them unemployed. The age group with the highest labor force participation rate is 25 to 29 years, with 92.1% or 198 individuals in the labor force. Within the labor force, the 16 to 19 years age range has the highest percentage of unemployed individuals, with 61.9% or 14 of them being unemployed.
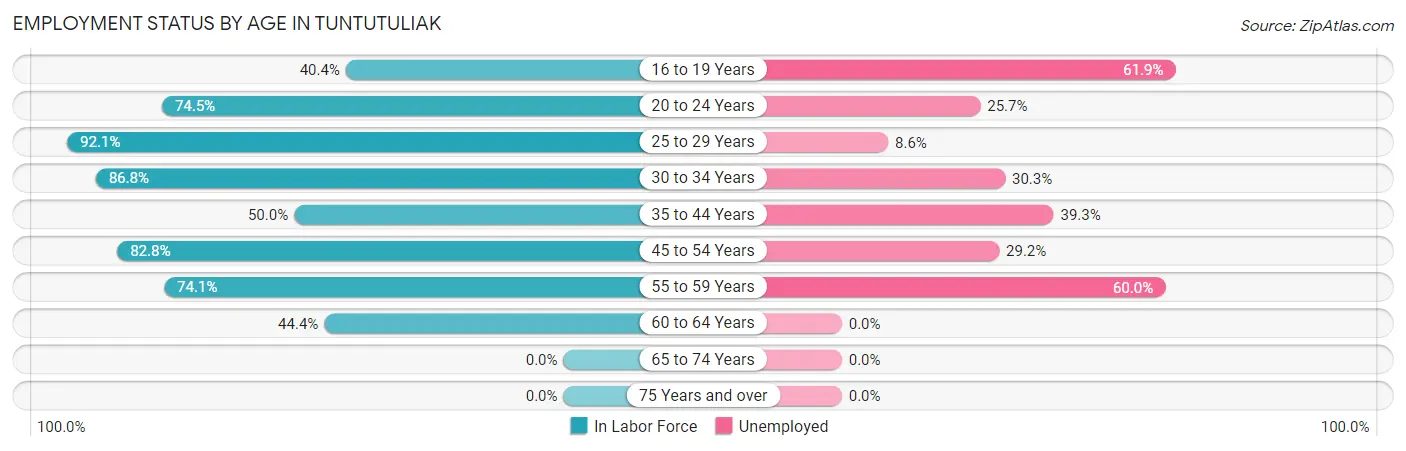
| Age Bracket | In Labor Force | Unemployed |
| 16 to 19 Years | 23 (40.4%) | 14 (61.9%) |
| 20 to 24 Years | 35 (74.5%) | 9 (25.7%) |
| 25 to 29 Years | 198 (92.1%) | 17 (8.6%) |
| 30 to 34 Years | 33 (86.8%) | 10 (30.3%) |
| 35 to 44 Years | 28 (50.0%) | 11 (39.3%) |
| 45 to 54 Years | 48 (82.8%) | 14 (29.2%) |
| 55 to 59 Years | 20 (74.1%) | 12 (60.0%) |
| 60 to 64 Years | 8 (44.4%) | 0 (0.0%) |
| 65 to 74 Years | 0 (0.0%) | 0 (0.0%) |
| 75 Years and over | 0 (0.0%) | 0 (0.0%) |
| Total | 393 (70.7%) | 86 (22.0%) |
Employment Status by Educational Attainment in Tuntutuliak
According to labor force statistics for Tuntutuliak, 81.3% of individuals (335) out of the total population between 25 and 64 years of age (412) are in the labor force, with 19.1% or 64 of them being unemployed. The group with the highest labor force participation rate are those with the educational attainment of bachelor's degree or higher, with 100.0% or 2 individuals in the labor force. Within the labor force, individuals with less than high school education have the highest percentage of unemployment, with 57.9% or 11 of them being unemployed.
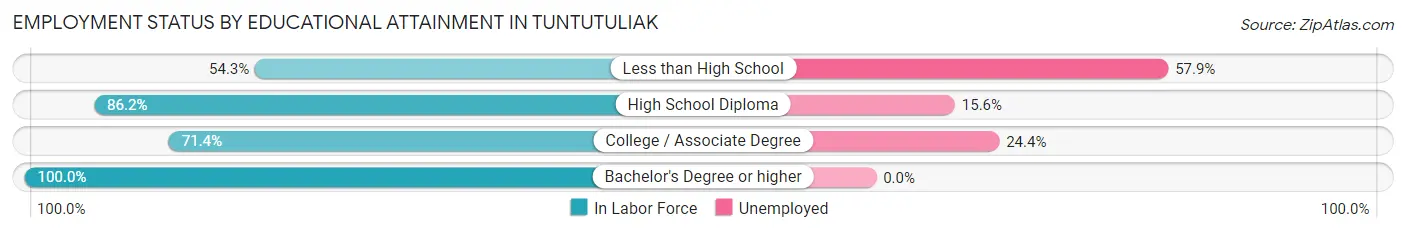
| Educational Attainment | In Labor Force | Unemployed |
| Less than High School | 19 (54.3%) | 20 (57.9%) |
| High School Diploma | 269 (86.2%) | 49 (15.6%) |
| College / Associate Degree | 45 (71.4%) | 15 (24.4%) |
| Bachelor's Degree or higher | 2 (100.0%) | 0 (0.0%) |
| Total | 335 (81.3%) | 79 (19.1%) |
Employment Occupations by Sex in Tuntutuliak
Management, Business, Science and Arts Occupations
The most common Management, Business, Science and Arts occupations in Tuntutuliak are Community & Social Service (25 | 8.2%), Education Instruction & Library (18 | 5.9%), Management (14 | 4.6%), Education, Arts & Media (7 | 2.3%), and Computers, Engineering & Science (3 | 1.0%).
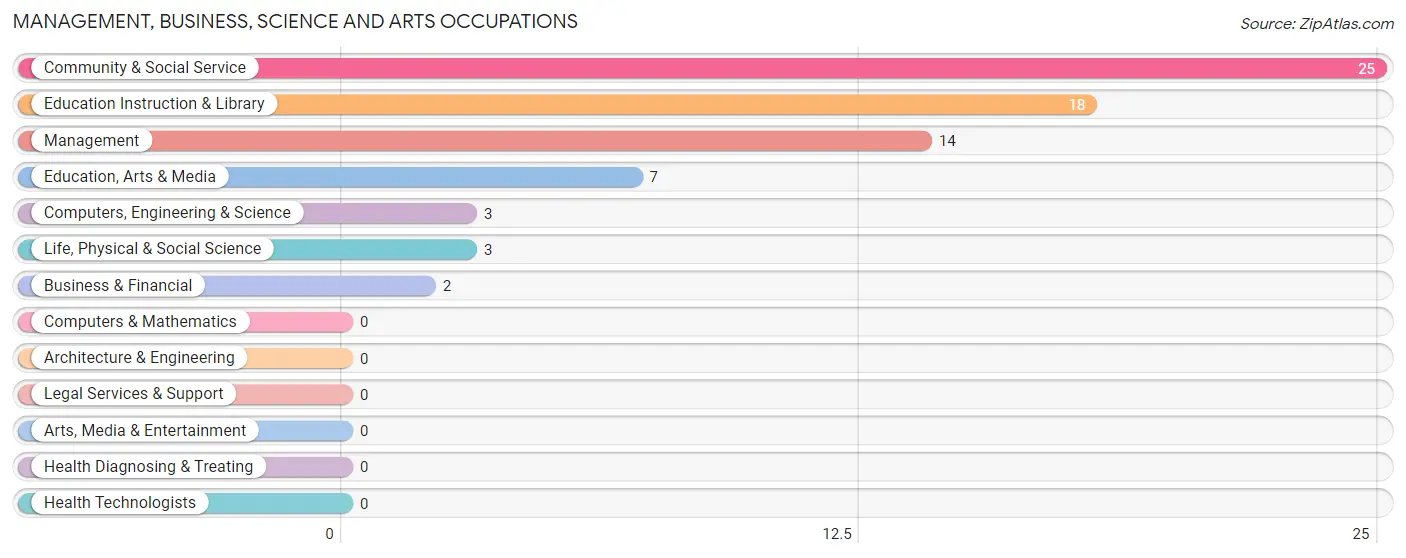
Management, Business, Science and Arts Occupations by Sex
Within the Management, Business, Science and Arts occupations in Tuntutuliak, the most male-oriented occupations are Computers, Engineering & Science (100.0%), Life, Physical & Social Science (100.0%), and Education, Arts & Media (71.4%), while the most female-oriented occupations are Business & Financial (100.0%), Education Instruction & Library (61.1%), and Management (57.1%).
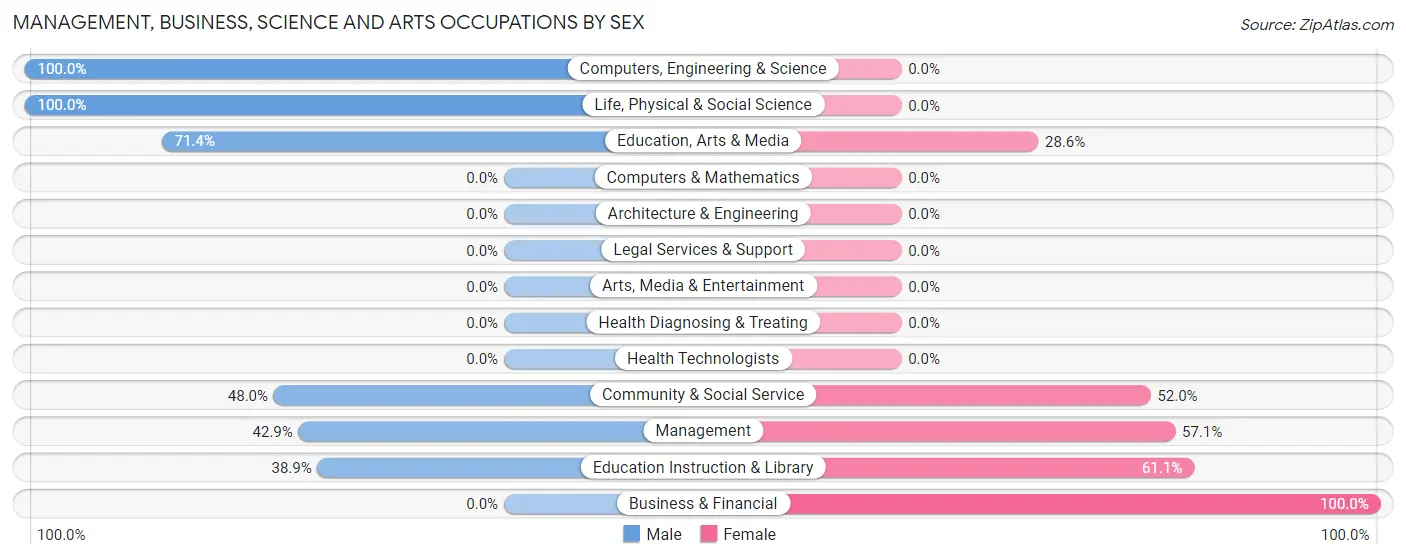
| Occupation | Male | Female |
| Management | 6 (42.9%) | 8 (57.1%) |
| Business & Financial | 0 (0.0%) | 2 (100.0%) |
| Computers, Engineering & Science | 3 (100.0%) | 0 (0.0%) |
| Computers & Mathematics | 0 (0.0%) | 0 (0.0%) |
| Architecture & Engineering | 0 (0.0%) | 0 (0.0%) |
| Life, Physical & Social Science | 3 (100.0%) | 0 (0.0%) |
| Community & Social Service | 12 (48.0%) | 13 (52.0%) |
| Education, Arts & Media | 5 (71.4%) | 2 (28.6%) |
| Legal Services & Support | 0 (0.0%) | 0 (0.0%) |
| Education Instruction & Library | 7 (38.9%) | 11 (61.1%) |
| Arts, Media & Entertainment | 0 (0.0%) | 0 (0.0%) |
| Health Diagnosing & Treating | 0 (0.0%) | 0 (0.0%) |
| Health Technologists | 0 (0.0%) | 0 (0.0%) |
| Total (Category) | 21 (47.7%) | 23 (52.3%) |
| Total (Overall) | 53 (17.4%) | 252 (82.6%) |
Services Occupations
The most common Services occupations in Tuntutuliak are Food Preparation & Serving (6 | 2.0%), Cleaning & Maintenance (6 | 2.0%), and Healthcare Support (2 | 0.7%).
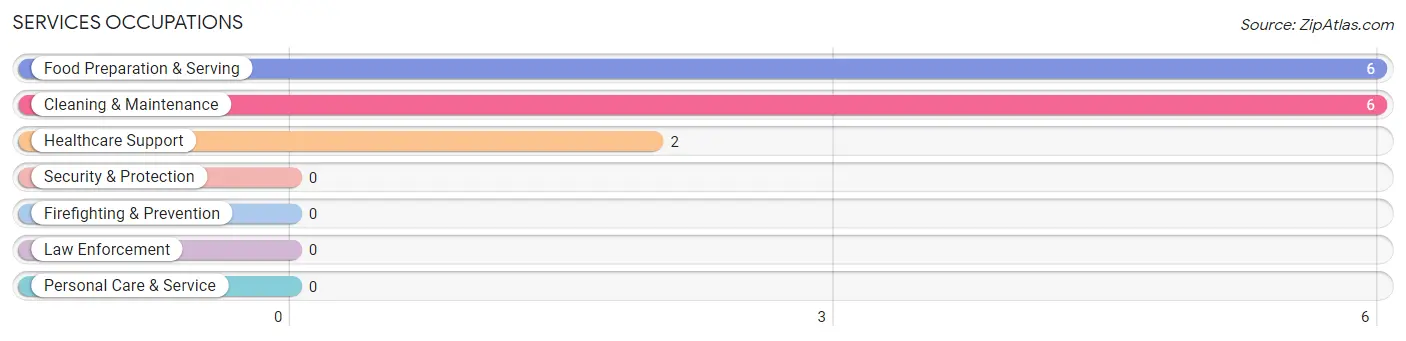
Services Occupations by Sex
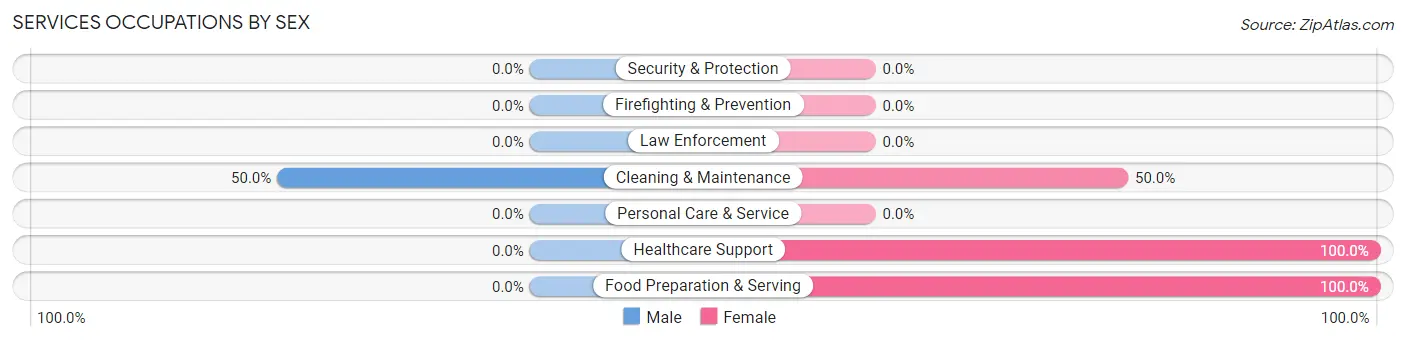
| Occupation | Male | Female |
| Healthcare Support | 0 (0.0%) | 2 (100.0%) |
| Security & Protection | 0 (0.0%) | 0 (0.0%) |
| Firefighting & Prevention | 0 (0.0%) | 0 (0.0%) |
| Law Enforcement | 0 (0.0%) | 0 (0.0%) |
| Food Preparation & Serving | 0 (0.0%) | 6 (100.0%) |
| Cleaning & Maintenance | 3 (50.0%) | 3 (50.0%) |
| Personal Care & Service | 0 (0.0%) | 0 (0.0%) |
| Total (Category) | 3 (21.4%) | 11 (78.6%) |
| Total (Overall) | 53 (17.4%) | 252 (82.6%) |
Sales and Office Occupations
The most common Sales and Office occupations in Tuntutuliak are Office & Administration (200 | 65.6%), and Sales & Related (20 | 6.6%).
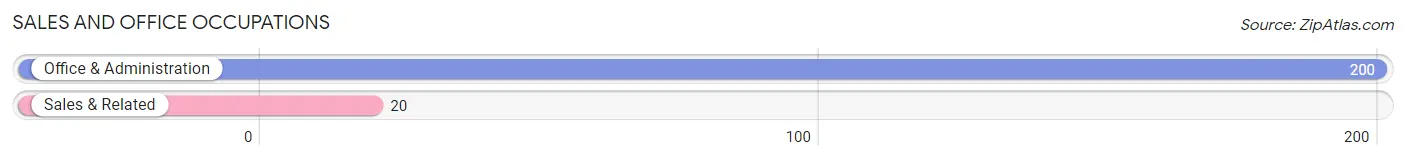
Sales and Office Occupations by Sex
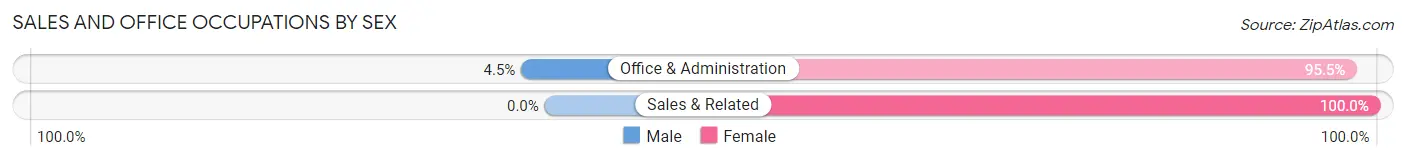
| Occupation | Male | Female |
| Sales & Related | 0 (0.0%) | 20 (100.0%) |
| Office & Administration | 9 (4.5%) | 191 (95.5%) |
| Total (Category) | 9 (4.1%) | 211 (95.9%) |
| Total (Overall) | 53 (17.4%) | 252 (82.6%) |
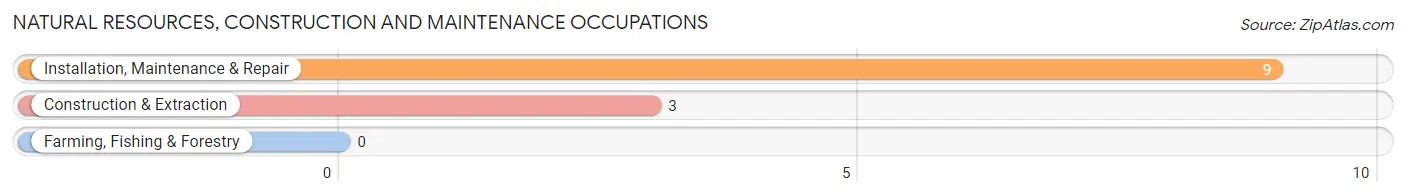
Natural Resources, Construction and Maintenance Occupations
The most common Natural Resources, Construction and Maintenance occupations in Tuntutuliak are Installation, Maintenance & Repair (9 | 2.9%), and Construction & Extraction (3 | 1.0%).
Natural Resources, Construction and Maintenance Occupations by Sex
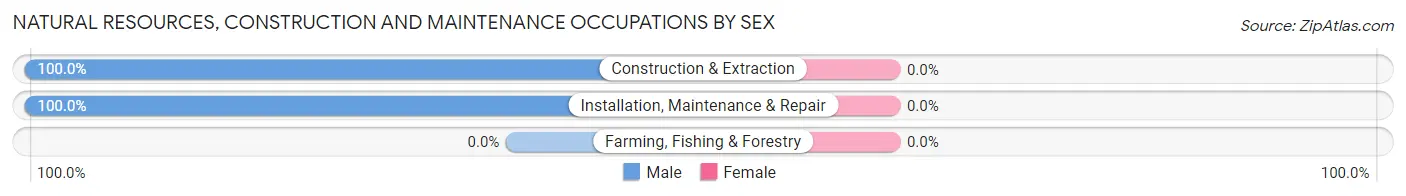
| Occupation | Male | Female |
| Farming, Fishing & Forestry | 0 (0.0%) | 0 (0.0%) |
| Construction & Extraction | 3 (100.0%) | 0 (0.0%) |
| Installation, Maintenance & Repair | 9 (100.0%) | 0 (0.0%) |
| Total (Category) | 12 (100.0%) | 0 (0.0%) |
| Total (Overall) | 53 (17.4%) | 252 (82.6%) |
Production, Transportation and Moving Occupations
The most common Production, Transportation and Moving occupations in Tuntutuliak are Production (10 | 3.3%), and Material Moving (5 | 1.6%).
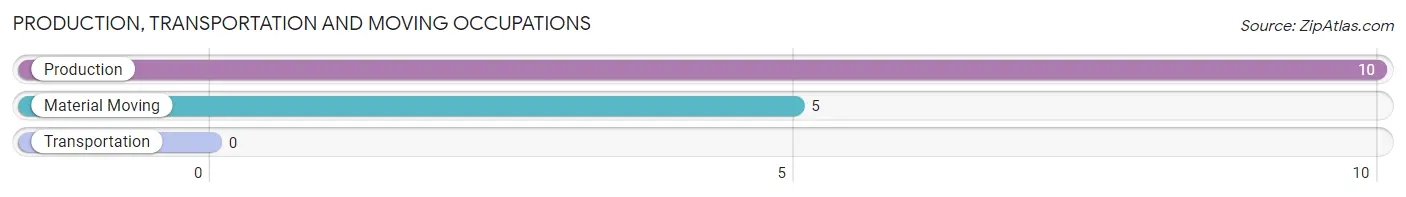
Production, Transportation and Moving Occupations by Sex
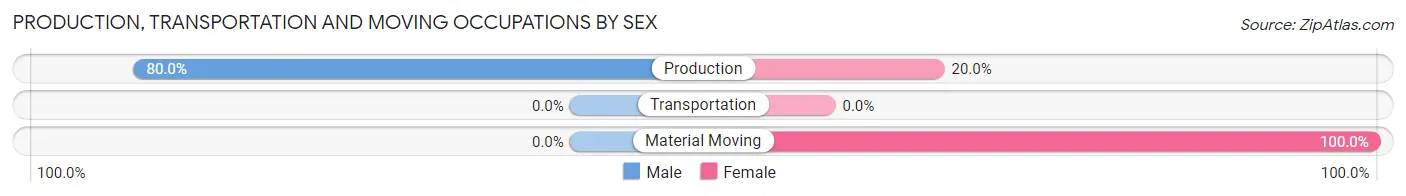
| Occupation | Male | Female |
| Production | 8 (80.0%) | 2 (20.0%) |
| Transportation | 0 (0.0%) | 0 (0.0%) |
| Material Moving | 0 (0.0%) | 5 (100.0%) |
| Total (Category) | 8 (53.3%) | 7 (46.7%) |
| Total (Overall) | 53 (17.4%) | 252 (82.6%) |
Employment Industries by Sex in Tuntutuliak
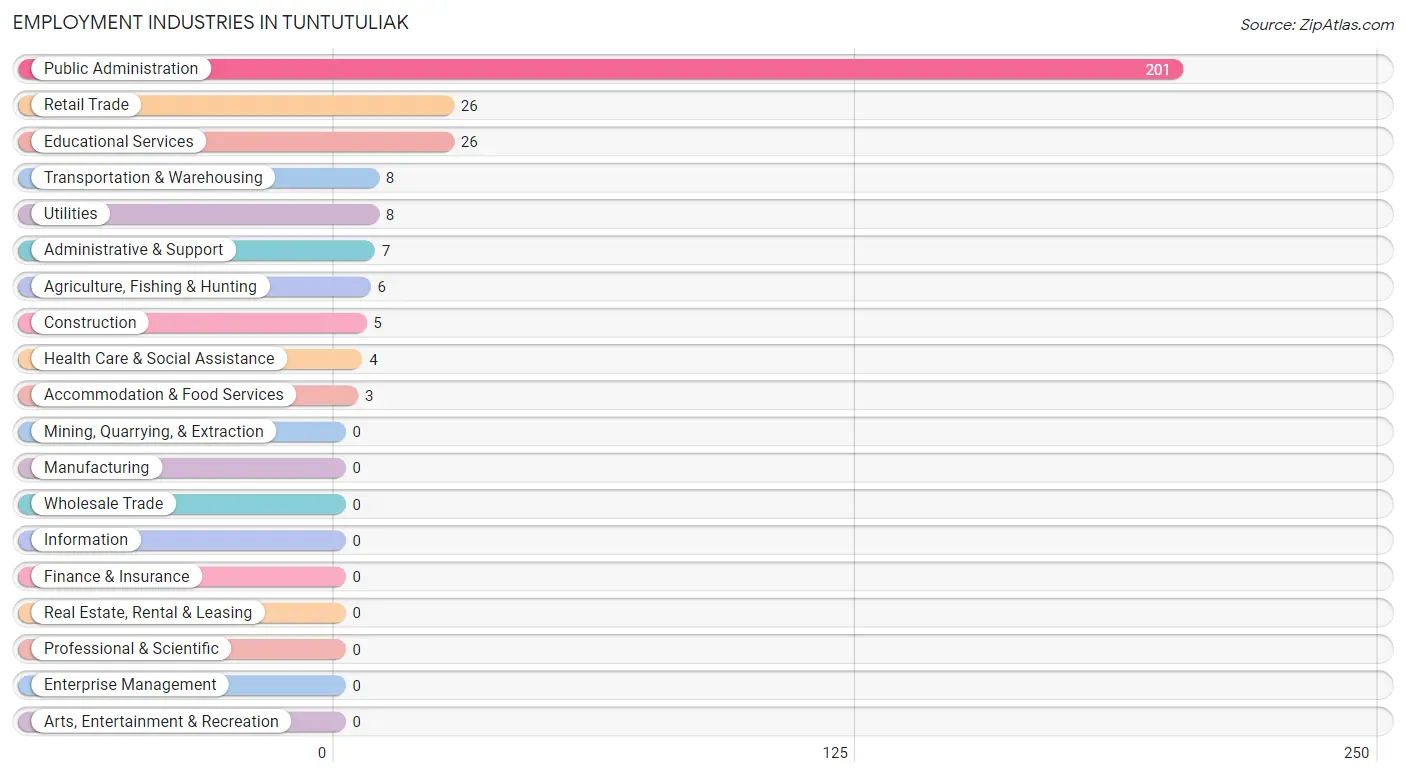
Employment Industries in Tuntutuliak
The major employment industries in Tuntutuliak include Public Administration (201 | 65.9%), Retail Trade (26 | 8.5%), Educational Services (26 | 8.5%), Transportation & Warehousing (8 | 2.6%), and Utilities (8 | 2.6%).
Employment Industries by Sex in Tuntutuliak
The Tuntutuliak industries that see more men than women are Agriculture, Fishing & Hunting (100.0%), Administrative & Support (100.0%), and Transportation & Warehousing (75.0%), whereas the industries that tend to have a higher number of women are Retail Trade (100.0%), Health Care & Social Assistance (100.0%), and Accommodation & Food Services (100.0%).
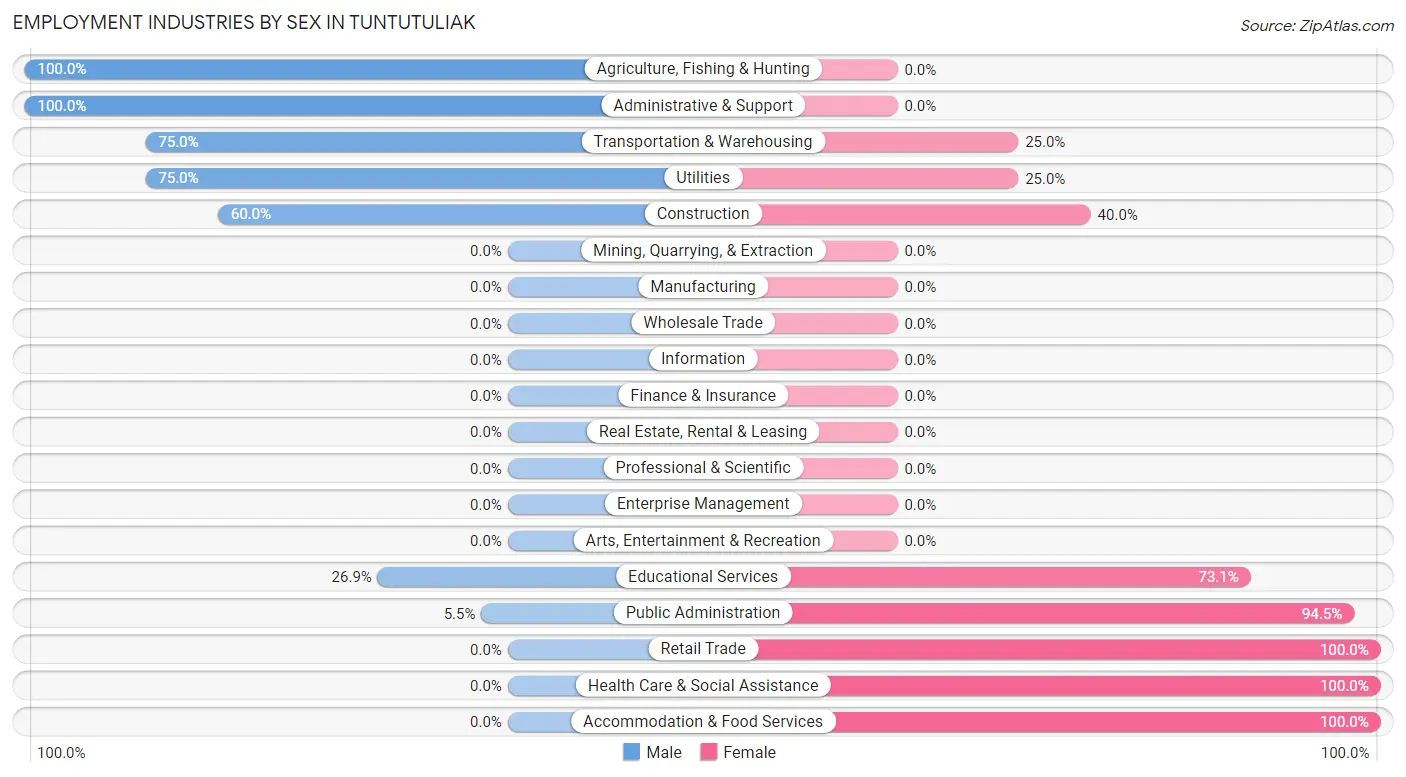
| Industry | Male | Female |
| Agriculture, Fishing & Hunting | 6 (100.0%) | 0 (0.0%) |
| Mining, Quarrying, & Extraction | 0 (0.0%) | 0 (0.0%) |
| Construction | 3 (60.0%) | 2 (40.0%) |
| Manufacturing | 0 (0.0%) | 0 (0.0%) |
| Wholesale Trade | 0 (0.0%) | 0 (0.0%) |
| Retail Trade | 0 (0.0%) | 26 (100.0%) |
| Transportation & Warehousing | 6 (75.0%) | 2 (25.0%) |
| Utilities | 6 (75.0%) | 2 (25.0%) |
| Information | 0 (0.0%) | 0 (0.0%) |
| Finance & Insurance | 0 (0.0%) | 0 (0.0%) |
| Real Estate, Rental & Leasing | 0 (0.0%) | 0 (0.0%) |
| Professional & Scientific | 0 (0.0%) | 0 (0.0%) |
| Enterprise Management | 0 (0.0%) | 0 (0.0%) |
| Administrative & Support | 7 (100.0%) | 0 (0.0%) |
| Educational Services | 7 (26.9%) | 19 (73.1%) |
| Health Care & Social Assistance | 0 (0.0%) | 4 (100.0%) |
| Arts, Entertainment & Recreation | 0 (0.0%) | 0 (0.0%) |
| Accommodation & Food Services | 0 (0.0%) | 3 (100.0%) |
| Public Administration | 11 (5.5%) | 190 (94.5%) |
| Total | 53 (17.4%) | 252 (82.6%) |
Education in Tuntutuliak
School Enrollment in Tuntutuliak
The most common levels of schooling among the 222 students in Tuntutuliak are middle school (61 | 27.5%), high school (61 | 27.5%), and elementary school (56 | 25.2%).
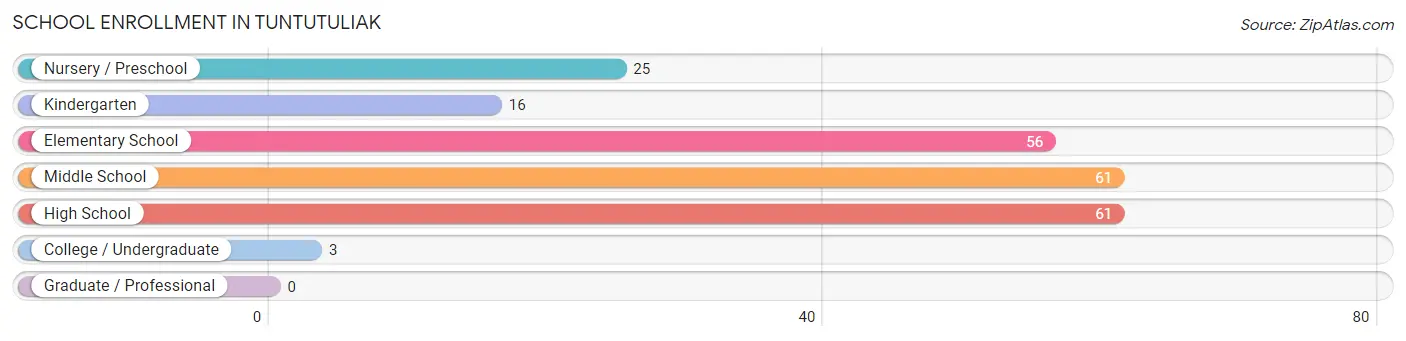
| School Level | # Students | % Students |
| Nursery / Preschool | 25 | 11.3% |
| Kindergarten | 16 | 7.2% |
| Elementary School | 56 | 25.2% |
| Middle School | 61 | 27.5% |
| High School | 61 | 27.5% |
| College / Undergraduate | 3 | 1.3% |
| Graduate / Professional | 0 | 0.0% |
| Total | 222 | 100.0% |
School Enrollment by Age by Funding Source in Tuntutuliak
Out of a total of 222 students who are enrolled in schools in Tuntutuliak, 2 (0.9%) attend a private institution, while the remaining 220 (99.1%) are enrolled in public schools. The age group of 25 to 34 year olds has the highest likelihood of being enrolled in private schools, with 2 (28.6% in the age bracket) enrolled. Conversely, the age group of 3 to 4 year olds has the lowest likelihood of being enrolled in a private school, with 22 (100.0% in the age bracket) attending a public institution.
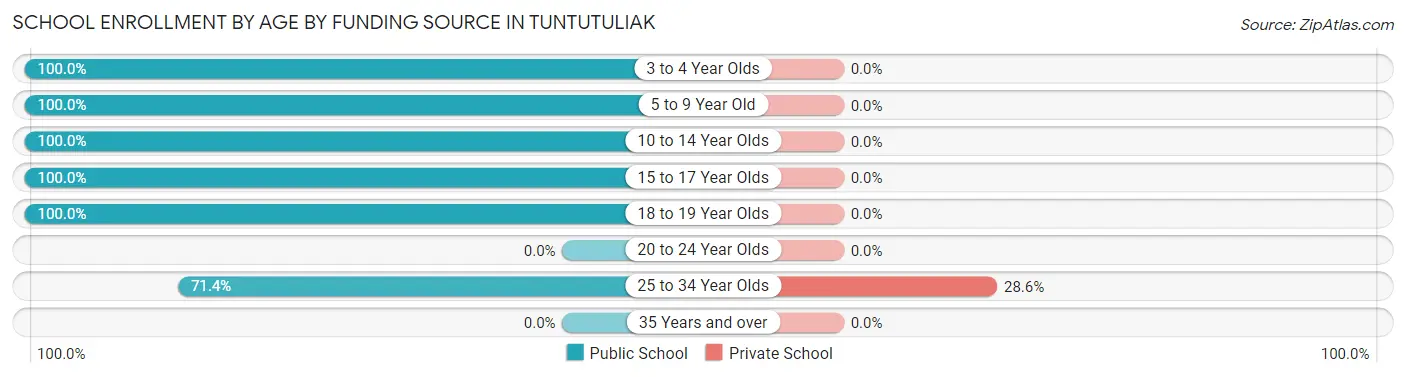
| Age Bracket | Public School | Private School |
| 3 to 4 Year Olds | 22 (100.0%) | 0 (0.0%) |
| 5 to 9 Year Old | 70 (100.0%) | 0 (0.0%) |
| 10 to 14 Year Olds | 63 (100.0%) | 0 (0.0%) |
| 15 to 17 Year Olds | 46 (100.0%) | 0 (0.0%) |
| 18 to 19 Year Olds | 14 (100.0%) | 0 (0.0%) |
| 20 to 24 Year Olds | 0 (0.0%) | 0 (0.0%) |
| 25 to 34 Year Olds | 5 (71.4%) | 2 (28.6%) |
| 35 Years and over | 0 (0.0%) | 0 (0.0%) |
| Total | 220 (99.1%) | 2 (0.9%) |
Educational Attainment by Field of Study in Tuntutuliak
Education (2 | 50.0%), and arts & humanities (2 | 50.0%) are the most common fields of study among 4 individuals in Tuntutuliak who have obtained a bachelor's degree or higher.
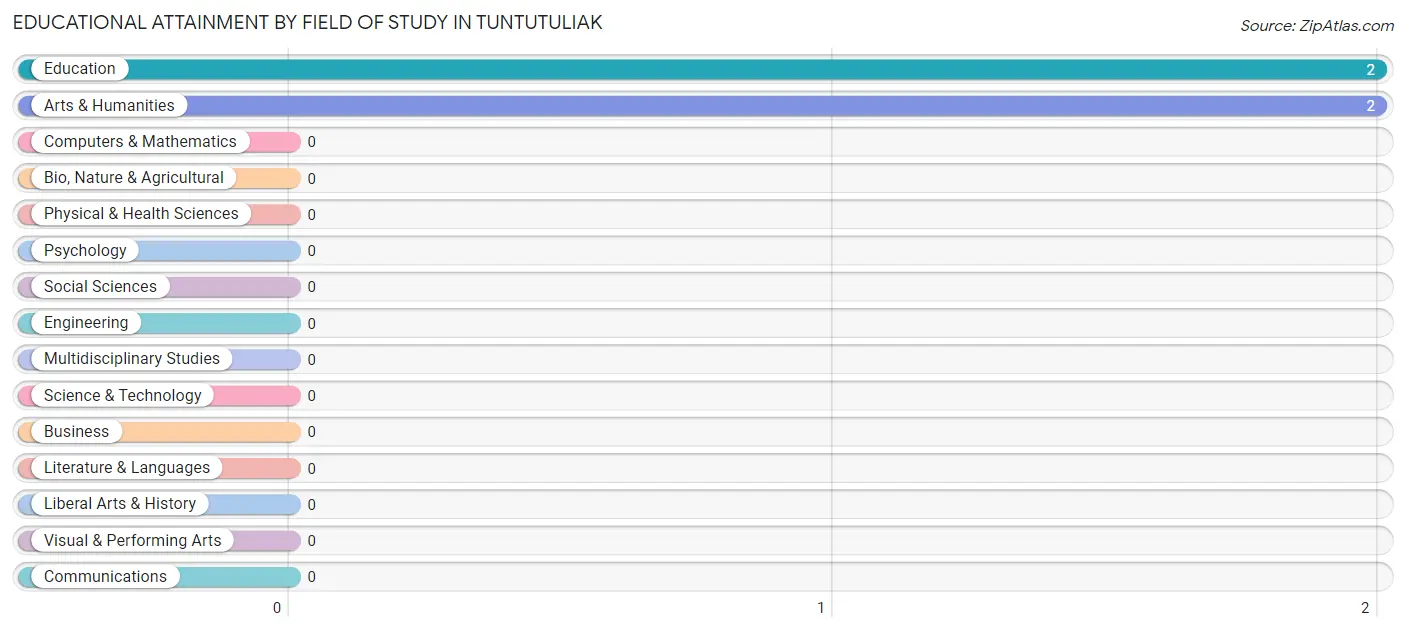
| Field of Study | # Graduates | % Graduates |
| Computers & Mathematics | 0 | 0.0% |
| Bio, Nature & Agricultural | 0 | 0.0% |
| Physical & Health Sciences | 0 | 0.0% |
| Psychology | 0 | 0.0% |
| Social Sciences | 0 | 0.0% |
| Engineering | 0 | 0.0% |
| Multidisciplinary Studies | 0 | 0.0% |
| Science & Technology | 0 | 0.0% |
| Business | 0 | 0.0% |
| Education | 2 | 50.0% |
| Literature & Languages | 0 | 0.0% |
| Liberal Arts & History | 0 | 0.0% |
| Visual & Performing Arts | 0 | 0.0% |
| Communications | 0 | 0.0% |
| Arts & Humanities | 2 | 50.0% |
| Total | 4 | 100.0% |
Transportation & Commute in Tuntutuliak
Vehicle Availability by Sex in Tuntutuliak
The most prevalent vehicle ownership categories in Tuntutuliak are males with no vehicle (55, accounting for 100.0%) and females with no vehicle (93, making up 59.1%).
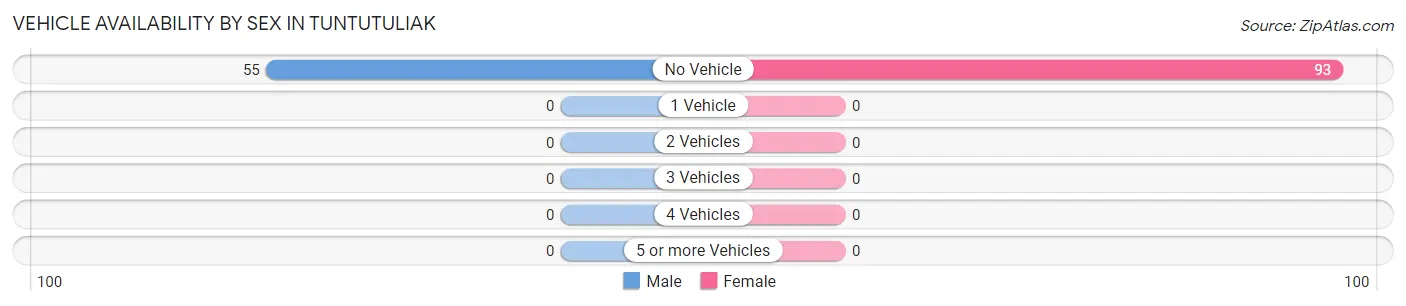
| Vehicles Available | Male | Female |
| No Vehicle | 55 (100.0%) | 93 (100.0%) |
| 1 Vehicle | 0 (0.0%) | 0 (0.0%) |
| 2 Vehicles | 0 (0.0%) | 0 (0.0%) |
| 3 Vehicles | 0 (0.0%) | 0 (0.0%) |
| 4 Vehicles | 0 (0.0%) | 0 (0.0%) |
| 5 or more Vehicles | 0 (0.0%) | 0 (0.0%) |
| Total | 55 (100.0%) | 93 (100.0%) |
Commute Time in Tuntutuliak
The most frequently occuring commute durations in Tuntutuliak are less than 5 minutes (194 commuters, 65.3%), 5 to 9 minutes (89 commuters, 30.0%), and 10 to 14 minutes (11 commuters, 3.7%).
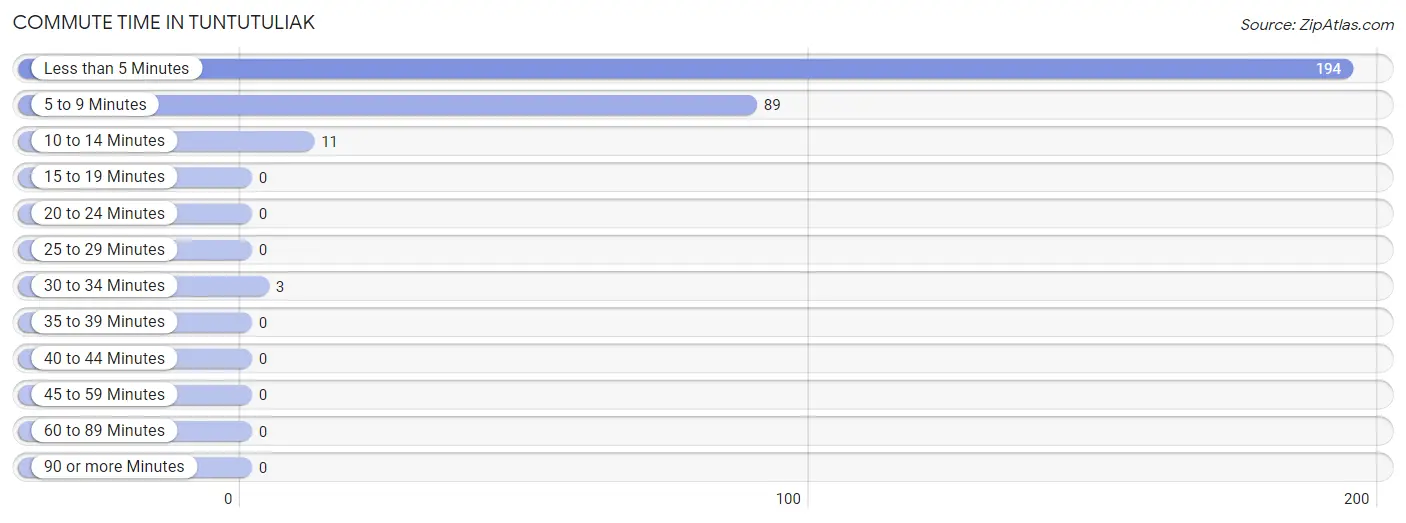
| Commute Time | # Commuters | % Commuters |
| Less than 5 Minutes | 194 | 65.3% |
| 5 to 9 Minutes | 89 | 30.0% |
| 10 to 14 Minutes | 11 | 3.7% |
| 15 to 19 Minutes | 0 | 0.0% |
| 20 to 24 Minutes | 0 | 0.0% |
| 25 to 29 Minutes | 0 | 0.0% |
| 30 to 34 Minutes | 3 | 1.0% |
| 35 to 39 Minutes | 0 | 0.0% |
| 40 to 44 Minutes | 0 | 0.0% |
| 45 to 59 Minutes | 0 | 0.0% |
| 60 to 89 Minutes | 0 | 0.0% |
| 90 or more Minutes | 0 | 0.0% |
Commute Time by Sex in Tuntutuliak
The most common commute times in Tuntutuliak are 5 to 9 minutes (27 commuters, 57.5%) for males and less than 5 minutes (179 commuters, 71.6%) for females.
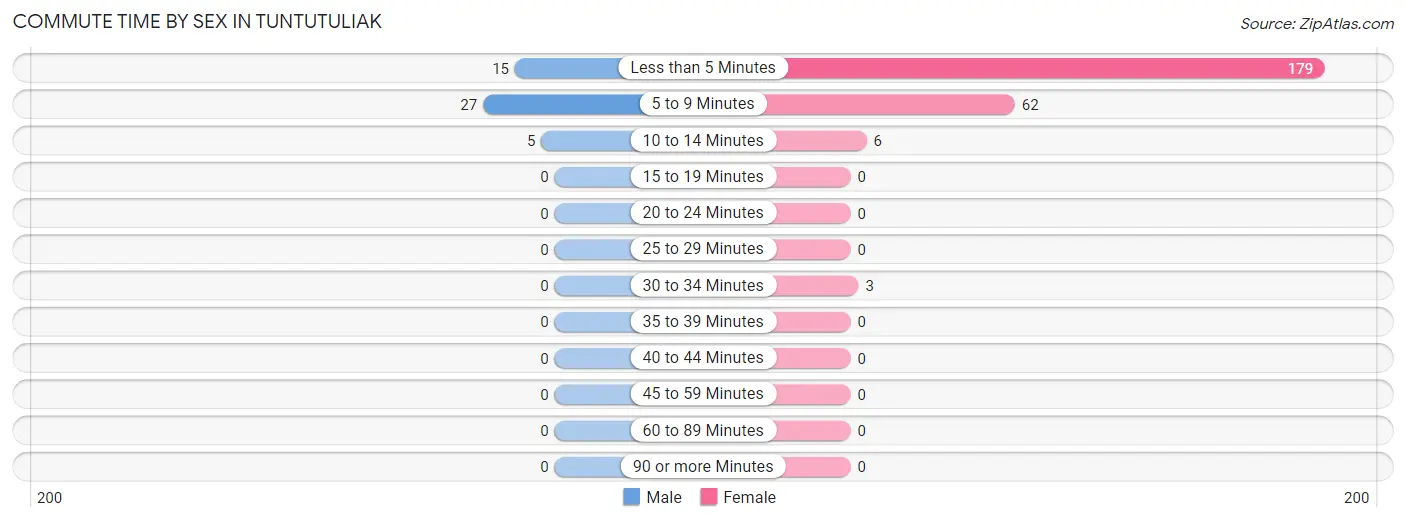
| Commute Time | Male | Female |
| Less than 5 Minutes | 15 (31.9%) | 179 (71.6%) |
| 5 to 9 Minutes | 27 (57.5%) | 62 (24.8%) |
| 10 to 14 Minutes | 5 (10.6%) | 6 (2.4%) |
| 15 to 19 Minutes | 0 (0.0%) | 0 (0.0%) |
| 20 to 24 Minutes | 0 (0.0%) | 0 (0.0%) |
| 25 to 29 Minutes | 0 (0.0%) | 0 (0.0%) |
| 30 to 34 Minutes | 0 (0.0%) | 3 (1.2%) |
| 35 to 39 Minutes | 0 (0.0%) | 0 (0.0%) |
| 40 to 44 Minutes | 0 (0.0%) | 0 (0.0%) |
| 45 to 59 Minutes | 0 (0.0%) | 0 (0.0%) |
| 60 to 89 Minutes | 0 (0.0%) | 0 (0.0%) |
| 90 or more Minutes | 0 (0.0%) | 0 (0.0%) |
Time of Departure to Work by Sex in Tuntutuliak
The most frequent times of departure to work in Tuntutuliak are 8:00 AM to 8:29 AM (18, 38.3%) for males and 7:30 AM to 7:59 AM (159, 63.6%) for females.
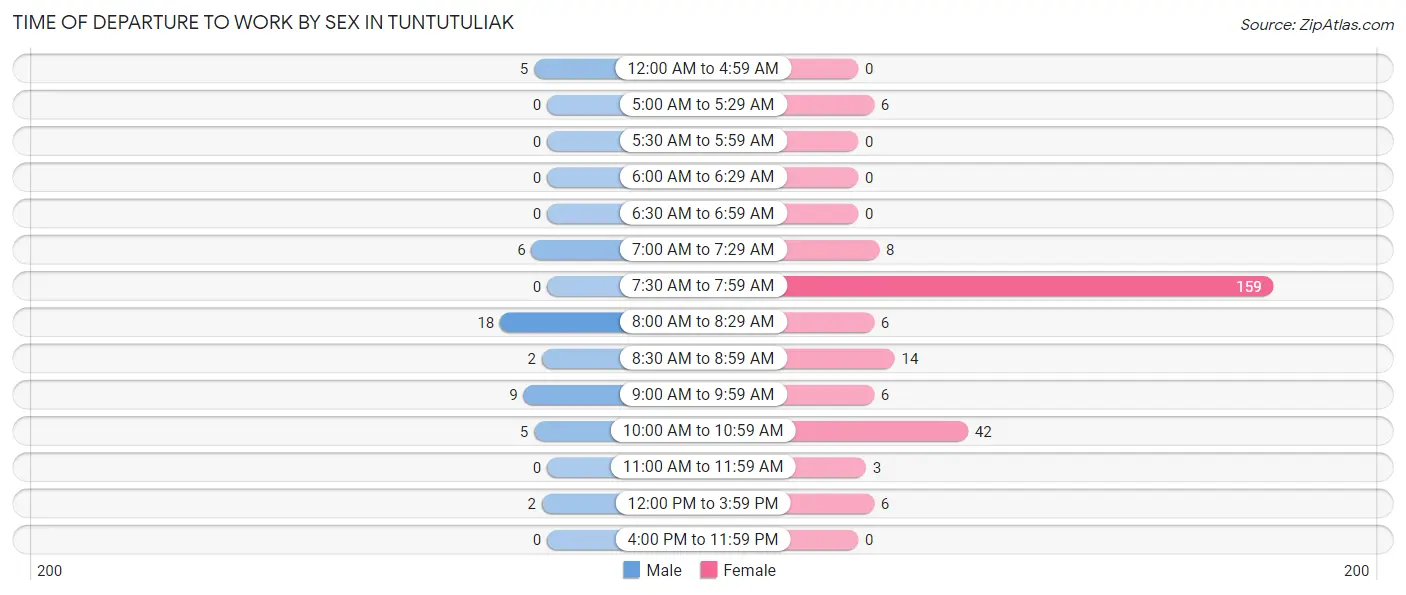
| Time of Departure | Male | Female |
| 12:00 AM to 4:59 AM | 5 (10.6%) | 0 (0.0%) |
| 5:00 AM to 5:29 AM | 0 (0.0%) | 6 (2.4%) |
| 5:30 AM to 5:59 AM | 0 (0.0%) | 0 (0.0%) |
| 6:00 AM to 6:29 AM | 0 (0.0%) | 0 (0.0%) |
| 6:30 AM to 6:59 AM | 0 (0.0%) | 0 (0.0%) |
| 7:00 AM to 7:29 AM | 6 (12.8%) | 8 (3.2%) |
| 7:30 AM to 7:59 AM | 0 (0.0%) | 159 (63.6%) |
| 8:00 AM to 8:29 AM | 18 (38.3%) | 6 (2.4%) |
| 8:30 AM to 8:59 AM | 2 (4.3%) | 14 (5.6%) |
| 9:00 AM to 9:59 AM | 9 (19.2%) | 6 (2.4%) |
| 10:00 AM to 10:59 AM | 5 (10.6%) | 42 (16.8%) |
| 11:00 AM to 11:59 AM | 0 (0.0%) | 3 (1.2%) |
| 12:00 PM to 3:59 PM | 2 (4.3%) | 6 (2.4%) |
| 4:00 PM to 11:59 PM | 0 (0.0%) | 0 (0.0%) |
| Total | 47 (100.0%) | 250 (100.0%) |
Housing Occupancy in Tuntutuliak
Occupancy by Ownership in Tuntutuliak
Of the total 130 dwellings in Tuntutuliak, owner-occupied units account for 96 (73.9%), while renter-occupied units make up 34 (26.2%).
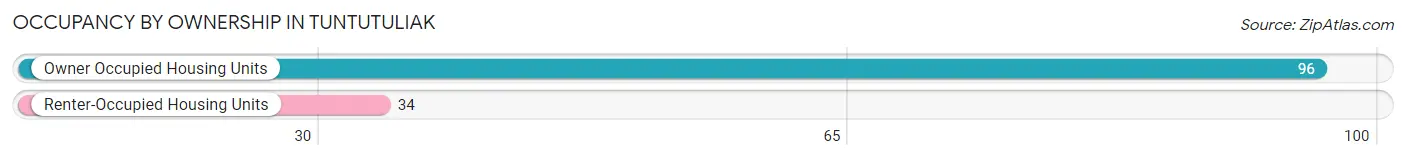
| Occupancy | # Housing Units | % Housing Units |
| Owner Occupied Housing Units | 96 | 73.9% |
| Renter-Occupied Housing Units | 34 | 26.2% |
| Total Occupied Housing Units | 130 | 100.0% |
Occupancy by Household Size in Tuntutuliak
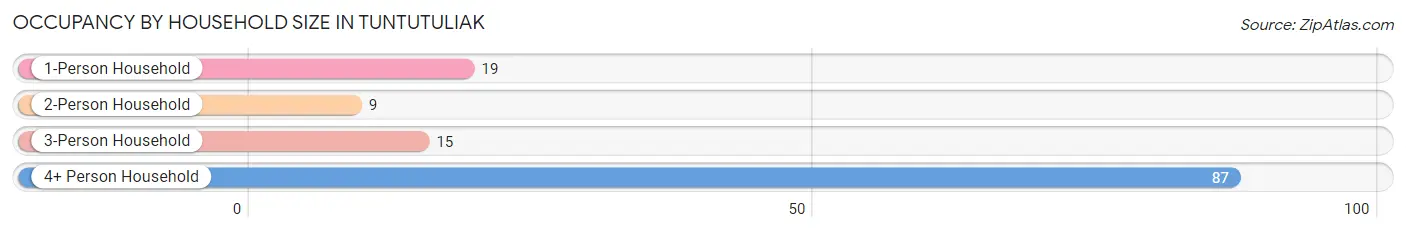
| Household Size | # Housing Units | % Housing Units |
| 1-Person Household | 19 | 14.6% |
| 2-Person Household | 9 | 6.9% |
| 3-Person Household | 15 | 11.5% |
| 4+ Person Household | 87 | 66.9% |
| Total Housing Units | 130 | 100.0% |
Occupancy by Ownership by Household Size in Tuntutuliak
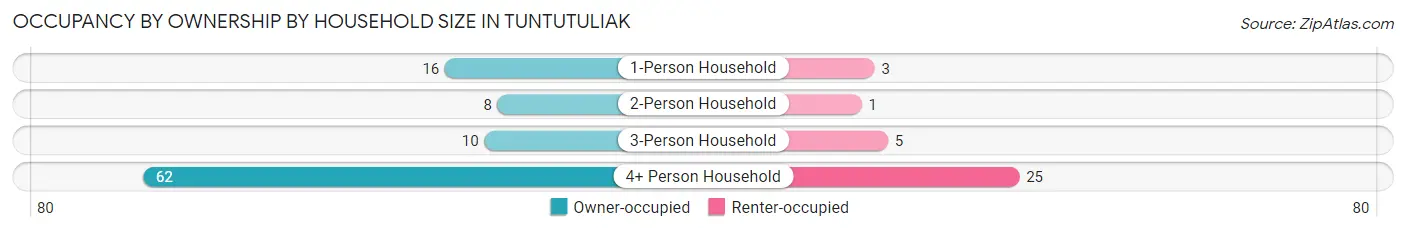
| Household Size | Owner-occupied | Renter-occupied |
| 1-Person Household | 16 (84.2%) | 3 (15.8%) |
| 2-Person Household | 8 (88.9%) | 1 (11.1%) |
| 3-Person Household | 10 (66.7%) | 5 (33.3%) |
| 4+ Person Household | 62 (71.3%) | 25 (28.7%) |
| Total Housing Units | 96 (73.9%) | 34 (26.2%) |
Occupancy by Educational Attainment in Tuntutuliak
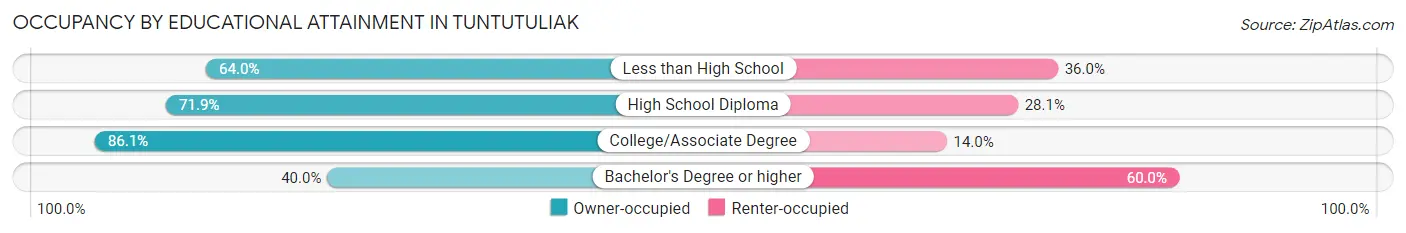
| Household Size | Owner-occupied | Renter-occupied |
| Less than High School | 16 (64.0%) | 9 (36.0%) |
| High School Diploma | 41 (71.9%) | 16 (28.1%) |
| College/Associate Degree | 37 (86.1%) | 6 (14.0%) |
| Bachelor's Degree or higher | 2 (40.0%) | 3 (60.0%) |
Occupancy by Age of Householder in Tuntutuliak
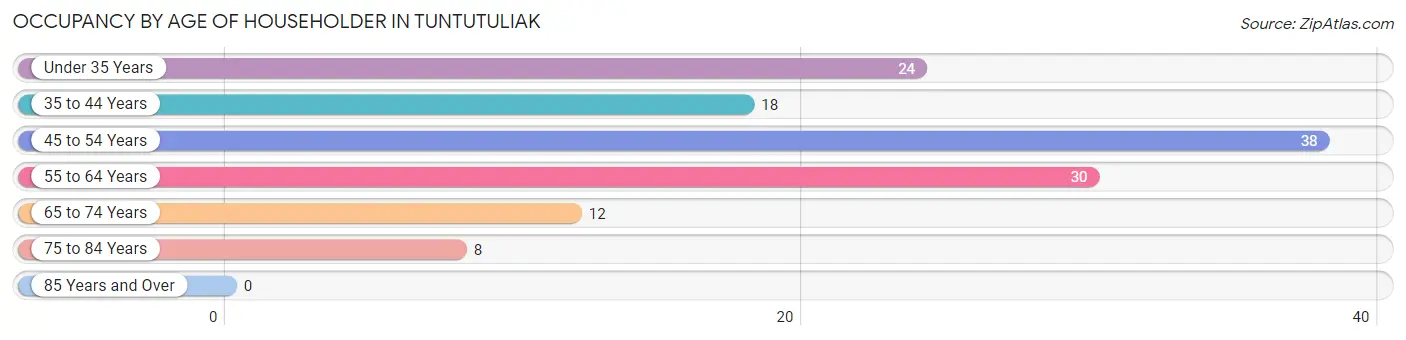
| Age Bracket | # Households | % Households |
| Under 35 Years | 24 | 18.5% |
| 35 to 44 Years | 18 | 13.9% |
| 45 to 54 Years | 38 | 29.2% |
| 55 to 64 Years | 30 | 23.1% |
| 65 to 74 Years | 12 | 9.2% |
| 75 to 84 Years | 8 | 6.1% |
| 85 Years and Over | 0 | 0.0% |
| Total | 130 | 100.0% |
Housing Finances in Tuntutuliak
Median Income by Occupancy in Tuntutuliak
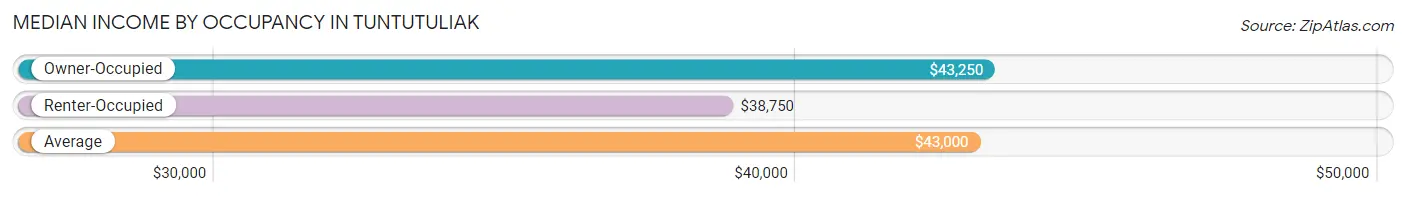
| Occupancy Type | # Households | Median Income |
| Owner-Occupied | 96 (73.9%) | $43,250 |
| Renter-Occupied | 34 (26.2%) | $38,750 |
| Average | 130 (100.0%) | $43,000 |
Occupancy by Householder Income Bracket in Tuntutuliak
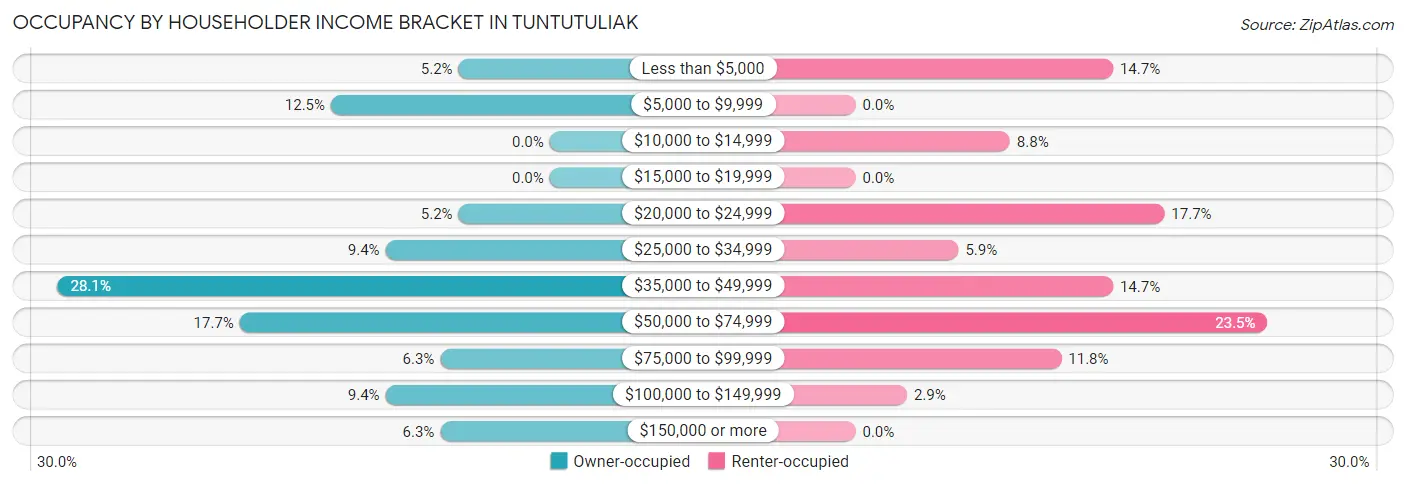
| Income Bracket | Owner-occupied | Renter-occupied |
| Less than $5,000 | 5 (5.2%) | 5 (14.7%) |
| $5,000 to $9,999 | 12 (12.5%) | 0 (0.0%) |
| $10,000 to $14,999 | 0 (0.0%) | 3 (8.8%) |
| $15,000 to $19,999 | 0 (0.0%) | 0 (0.0%) |
| $20,000 to $24,999 | 5 (5.2%) | 6 (17.6%) |
| $25,000 to $34,999 | 9 (9.4%) | 2 (5.9%) |
| $35,000 to $49,999 | 27 (28.1%) | 5 (14.7%) |
| $50,000 to $74,999 | 17 (17.7%) | 8 (23.5%) |
| $75,000 to $99,999 | 6 (6.2%) | 4 (11.8%) |
| $100,000 to $149,999 | 9 (9.4%) | 1 (2.9%) |
| $150,000 or more | 6 (6.2%) | 0 (0.0%) |
| Total | 96 (100.0%) | 34 (100.0%) |
Monthly Housing Cost Tiers in Tuntutuliak
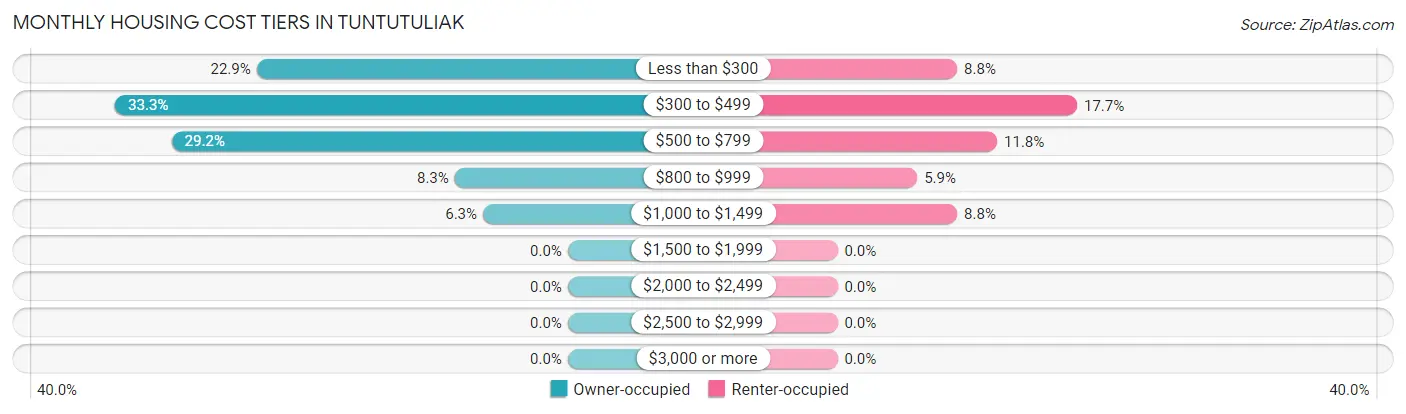
| Monthly Cost | Owner-occupied | Renter-occupied |
| Less than $300 | 22 (22.9%) | 3 (8.8%) |
| $300 to $499 | 32 (33.3%) | 6 (17.6%) |
| $500 to $799 | 28 (29.2%) | 4 (11.8%) |
| $800 to $999 | 8 (8.3%) | 2 (5.9%) |
| $1,000 to $1,499 | 6 (6.2%) | 3 (8.8%) |
| $1,500 to $1,999 | 0 (0.0%) | 0 (0.0%) |
| $2,000 to $2,499 | 0 (0.0%) | 0 (0.0%) |
| $2,500 to $2,999 | 0 (0.0%) | 0 (0.0%) |
| $3,000 or more | 0 (0.0%) | 0 (0.0%) |
| Total | 96 (100.0%) | 34 (100.0%) |
Physical Housing Characteristics in Tuntutuliak
Housing Structures in Tuntutuliak
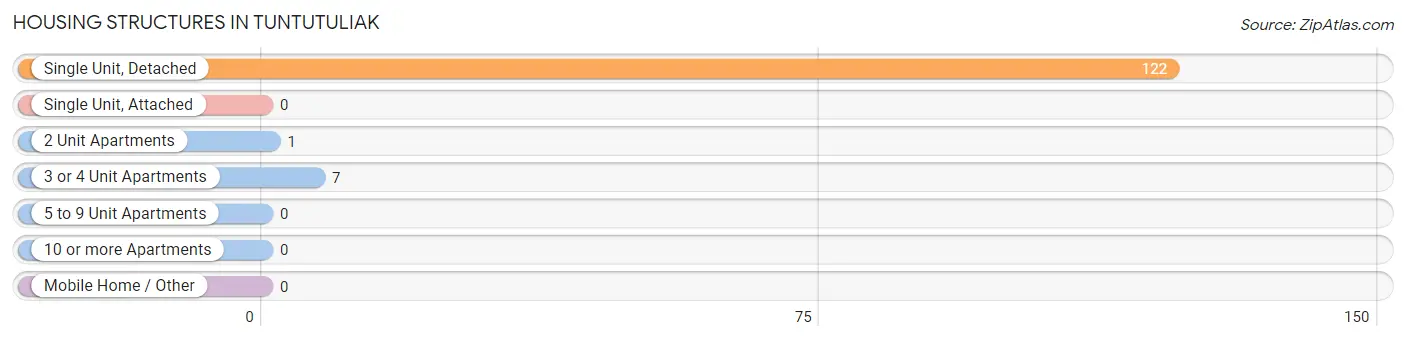
| Structure Type | # Housing Units | % Housing Units |
| Single Unit, Detached | 122 | 93.9% |
| Single Unit, Attached | 0 | 0.0% |
| 2 Unit Apartments | 1 | 0.8% |
| 3 or 4 Unit Apartments | 7 | 5.4% |
| 5 to 9 Unit Apartments | 0 | 0.0% |
| 10 or more Apartments | 0 | 0.0% |
| Mobile Home / Other | 0 | 0.0% |
| Total | 130 | 100.0% |
Housing Structures by Occupancy in Tuntutuliak
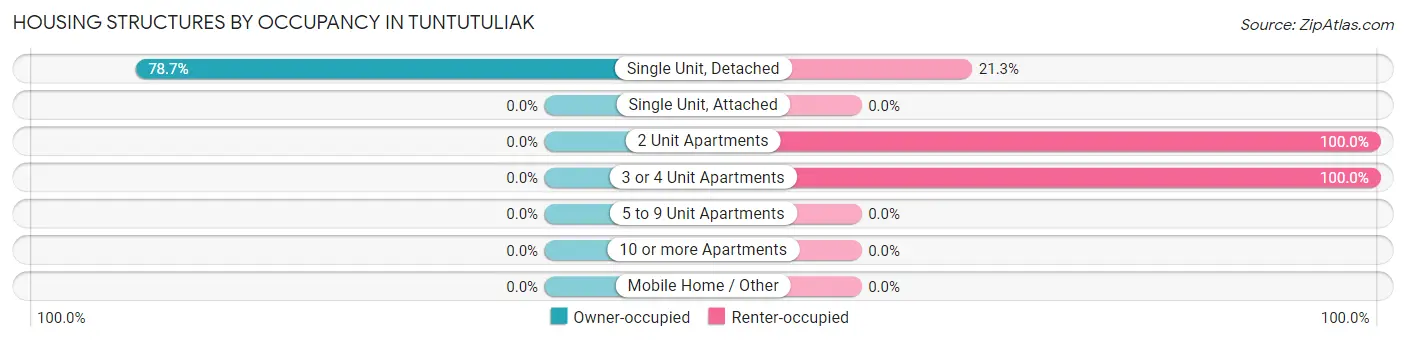
| Structure Type | Owner-occupied | Renter-occupied |
| Single Unit, Detached | 96 (78.7%) | 26 (21.3%) |
| Single Unit, Attached | 0 (0.0%) | 0 (0.0%) |
| 2 Unit Apartments | 0 (0.0%) | 1 (100.0%) |
| 3 or 4 Unit Apartments | 0 (0.0%) | 7 (100.0%) |
| 5 to 9 Unit Apartments | 0 (0.0%) | 0 (0.0%) |
| 10 or more Apartments | 0 (0.0%) | 0 (0.0%) |
| Mobile Home / Other | 0 (0.0%) | 0 (0.0%) |
| Total | 96 (73.9%) | 34 (26.2%) |
Housing Structures by Number of Rooms in Tuntutuliak
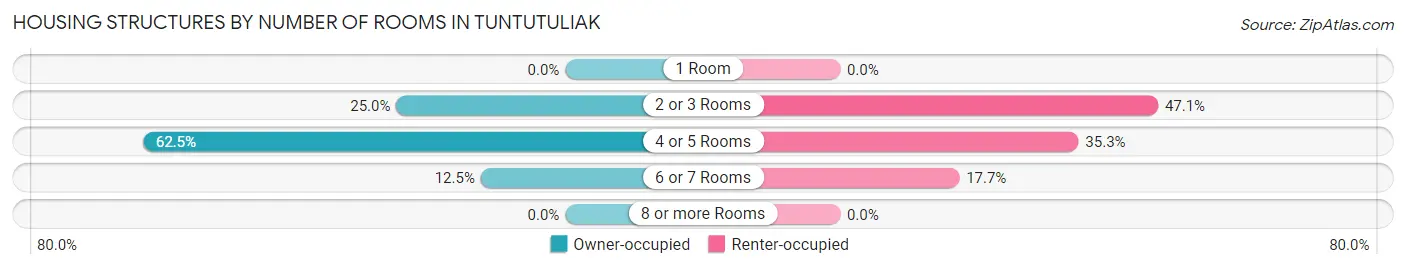
| Number of Rooms | Owner-occupied | Renter-occupied |
| 1 Room | 0 (0.0%) | 0 (0.0%) |
| 2 or 3 Rooms | 24 (25.0%) | 16 (47.1%) |
| 4 or 5 Rooms | 60 (62.5%) | 12 (35.3%) |
| 6 or 7 Rooms | 12 (12.5%) | 6 (17.6%) |
| 8 or more Rooms | 0 (0.0%) | 0 (0.0%) |
| Total | 96 (100.0%) | 34 (100.0%) |
Housing Structure by Heating Type in Tuntutuliak
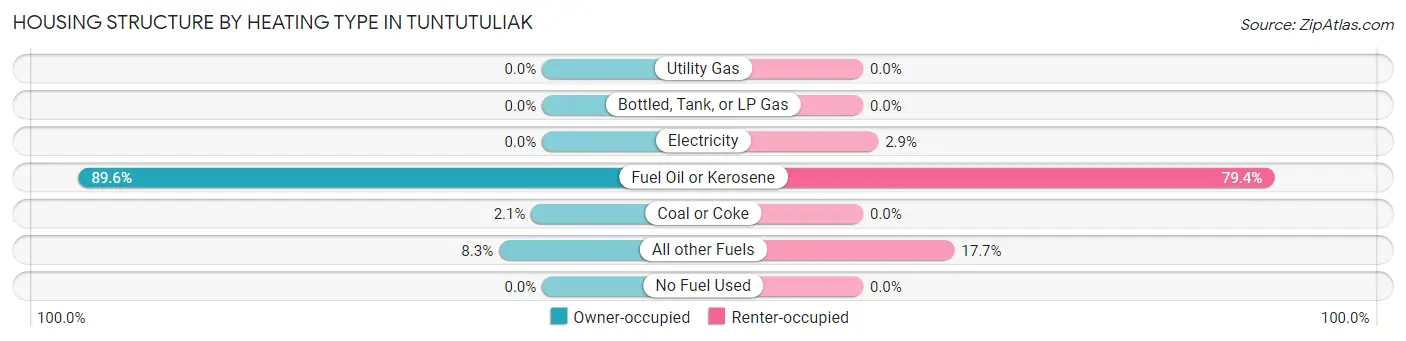
| Heating Type | Owner-occupied | Renter-occupied |
| Utility Gas | 0 (0.0%) | 0 (0.0%) |
| Bottled, Tank, or LP Gas | 0 (0.0%) | 0 (0.0%) |
| Electricity | 0 (0.0%) | 1 (2.9%) |
| Fuel Oil or Kerosene | 86 (89.6%) | 27 (79.4%) |
| Coal or Coke | 2 (2.1%) | 0 (0.0%) |
| All other Fuels | 8 (8.3%) | 6 (17.6%) |
| No Fuel Used | 0 (0.0%) | 0 (0.0%) |
| Total | 96 (100.0%) | 34 (100.0%) |
Household Vehicle Usage in Tuntutuliak
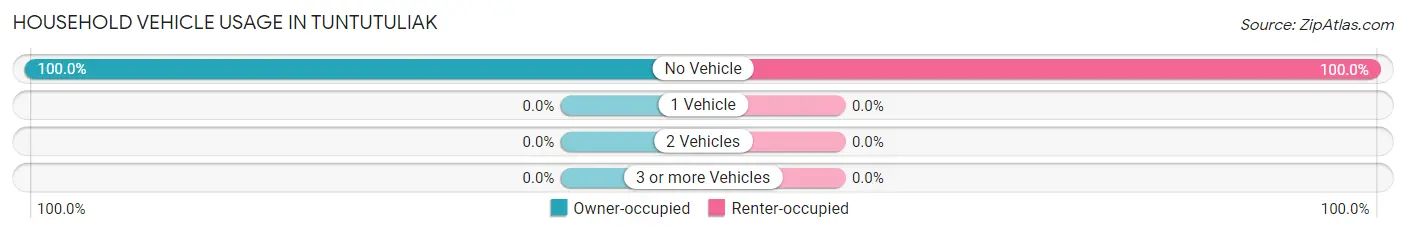
| Vehicles per Household | Owner-occupied | Renter-occupied |
| No Vehicle | 96 (100.0%) | 34 (100.0%) |
| 1 Vehicle | 0 (0.0%) | 0 (0.0%) |
| 2 Vehicles | 0 (0.0%) | 0 (0.0%) |
| 3 or more Vehicles | 0 (0.0%) | 0 (0.0%) |
| Total | 96 (100.0%) | 34 (100.0%) |
Real Estate & Mortgages in Tuntutuliak
Real Estate and Mortgage Overview in Tuntutuliak
| Characteristic | Without Mortgage | With Mortgage |
| Housing Units | 88 | 8 |
| Median Property Value | - | - |
| Median Household Income | $43,500 | $0 |
| Monthly Housing Costs | $388 | $0 |
| Real Estate Taxes | - | - |
Property Value by Mortgage Status in Tuntutuliak
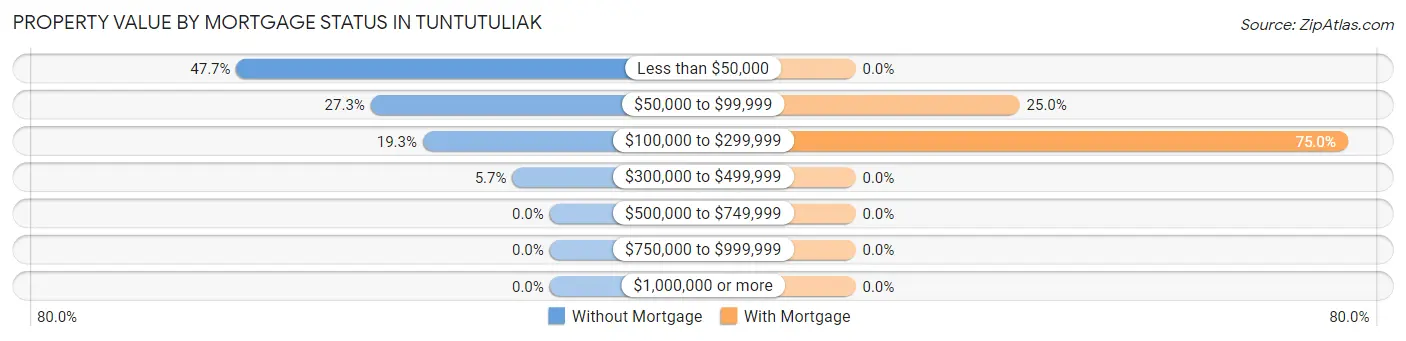
| Property Value | Without Mortgage | With Mortgage |
| Less than $50,000 | 42 (47.7%) | 0 (0.0%) |
| $50,000 to $99,999 | 24 (27.3%) | 2 (25.0%) |
| $100,000 to $299,999 | 17 (19.3%) | 6 (75.0%) |
| $300,000 to $499,999 | 5 (5.7%) | 0 (0.0%) |
| $500,000 to $749,999 | 0 (0.0%) | 0 (0.0%) |
| $750,000 to $999,999 | 0 (0.0%) | 0 (0.0%) |
| $1,000,000 or more | 0 (0.0%) | 0 (0.0%) |
| Total | 88 (100.0%) | 8 (100.0%) |
Household Income by Mortgage Status in Tuntutuliak
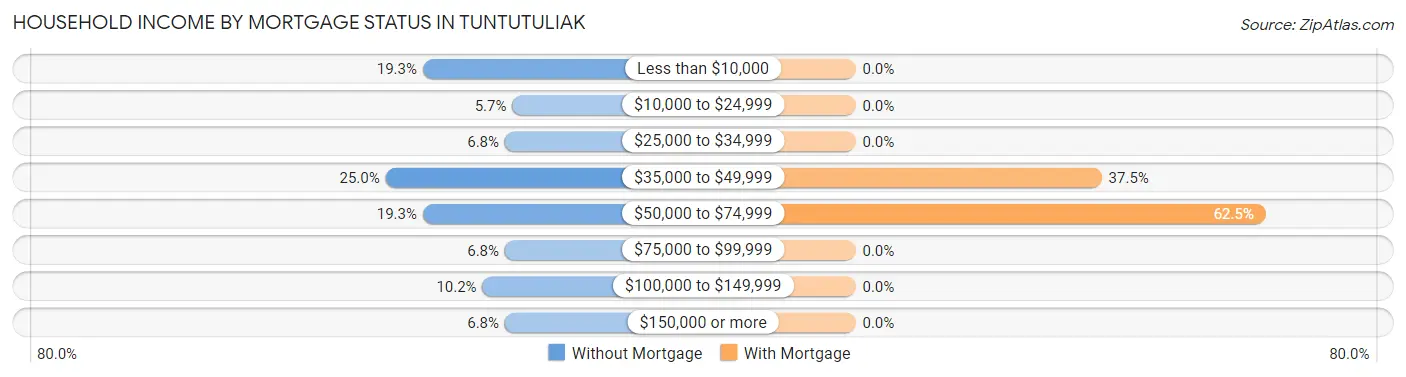
| Household Income | Without Mortgage | With Mortgage |
| Less than $10,000 | 17 (19.3%) | 0 (0.0%) |
| $10,000 to $24,999 | 5 (5.7%) | 0 (0.0%) |
| $25,000 to $34,999 | 6 (6.8%) | 0 (0.0%) |
| $35,000 to $49,999 | 22 (25.0%) | 3 (37.5%) |
| $50,000 to $74,999 | 17 (19.3%) | 5 (62.5%) |
| $75,000 to $99,999 | 6 (6.8%) | 0 (0.0%) |
| $100,000 to $149,999 | 9 (10.2%) | 0 (0.0%) |
| $150,000 or more | 6 (6.8%) | 0 (0.0%) |
| Total | 88 (100.0%) | 8 (100.0%) |
Property Value to Household Income Ratio in Tuntutuliak
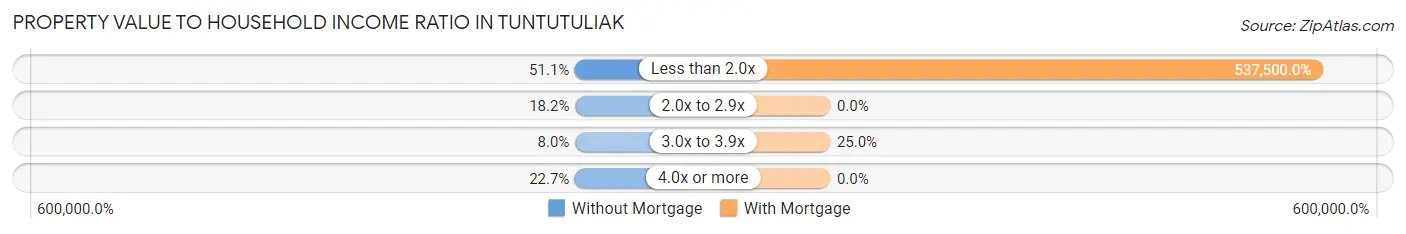
| Value-to-Income Ratio | Without Mortgage | With Mortgage |
| Less than 2.0x | 45 (51.1%) | 43,000 (537,500.0%) |
| 2.0x to 2.9x | 16 (18.2%) | 0 (0.0%) |
| 3.0x to 3.9x | 7 (8.0%) | 2 (25.0%) |
| 4.0x or more | 20 (22.7%) | 0 (0.0%) |
| Total | 88 (100.0%) | 8 (100.0%) |
Real Estate Taxes by Mortgage Status in Tuntutuliak
| Property Taxes | Without Mortgage | With Mortgage |
| Less than $800 | 0 (0.0%) | 0 (0.0%) |
| $800 to $1,499 | 0 (0.0%) | 0 (0.0%) |
| $800 to $1,499 | 0 (0.0%) | 0 (0.0%) |
| Total | 88 (100.0%) | 8 (100.0%) |
Health & Disability in Tuntutuliak
Health Insurance Coverage by Age in Tuntutuliak
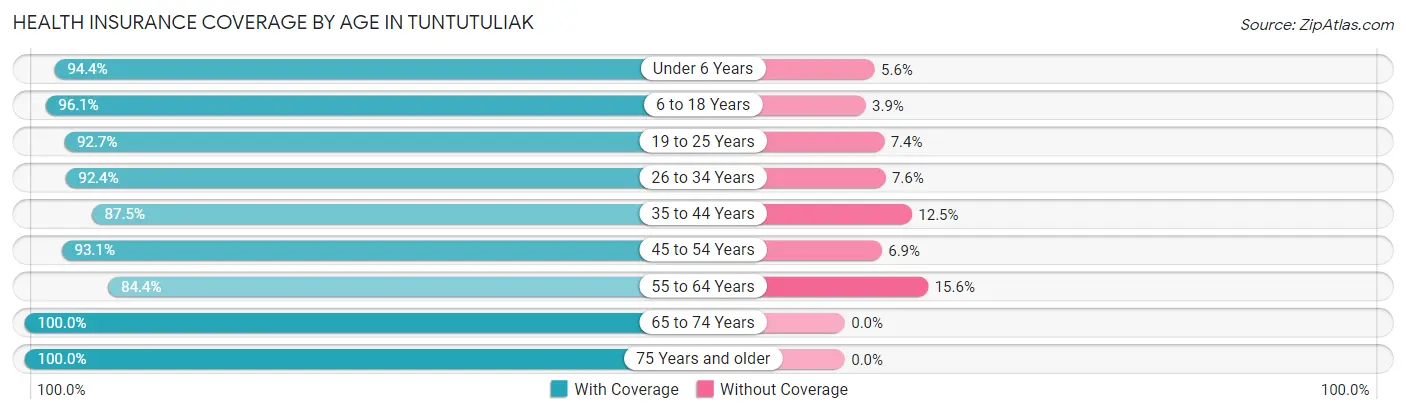
| Age Bracket | With Coverage | Without Coverage |
| Under 6 Years | 102 (94.4%) | 6 (5.6%) |
| 6 to 18 Years | 198 (96.1%) | 8 (3.9%) |
| 19 to 25 Years | 63 (92.6%) | 5 (7.3%) |
| 26 to 34 Years | 219 (92.4%) | 18 (7.6%) |
| 35 to 44 Years | 49 (87.5%) | 7 (12.5%) |
| 45 to 54 Years | 54 (93.1%) | 4 (6.9%) |
| 55 to 64 Years | 38 (84.4%) | 7 (15.6%) |
| 65 to 74 Years | 21 (100.0%) | 0 (0.0%) |
| 75 Years and older | 19 (100.0%) | 0 (0.0%) |
| Total | 763 (93.3%) | 55 (6.7%) |
Health Insurance Coverage by Citizenship Status in Tuntutuliak
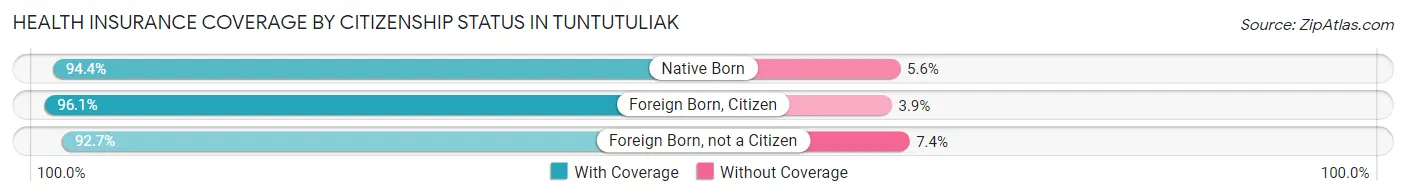
| Citizenship Status | With Coverage | Without Coverage |
| Native Born | 102 (94.4%) | 6 (5.6%) |
| Foreign Born, Citizen | 198 (96.1%) | 8 (3.9%) |
| Foreign Born, not a Citizen | 63 (92.6%) | 5 (7.3%) |
Health Insurance Coverage by Household Income in Tuntutuliak
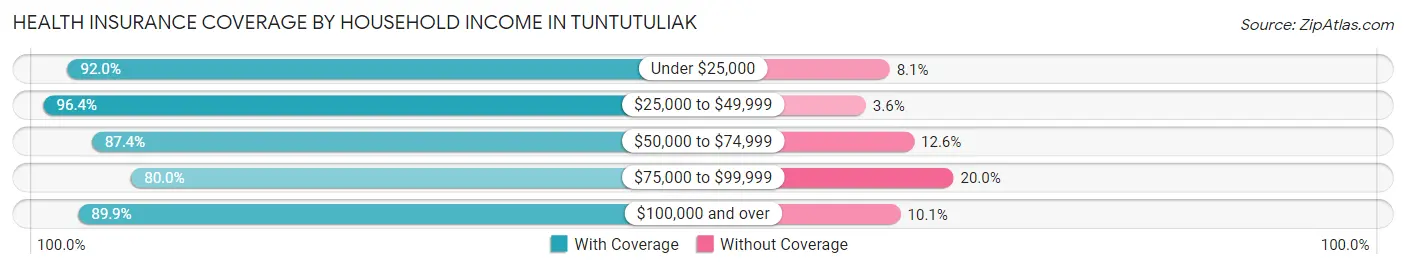
| Household Income | With Coverage | Without Coverage |
| Under $25,000 | 80 (91.9%) | 7 (8.1%) |
| $25,000 to $49,999 | 269 (96.4%) | 10 (3.6%) |
| $50,000 to $74,999 | 104 (87.4%) | 15 (12.6%) |
| $75,000 to $99,999 | 44 (80.0%) | 11 (20.0%) |
| $100,000 and over | 107 (89.9%) | 12 (10.1%) |
Public vs Private Health Insurance Coverage by Age in Tuntutuliak
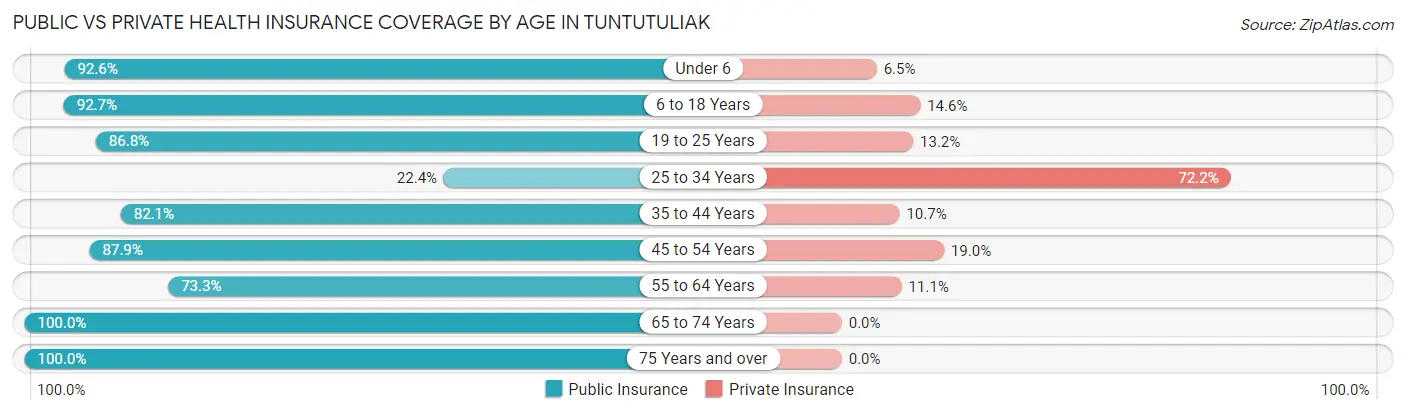
| Age Bracket | Public Insurance | Private Insurance |
| Under 6 | 100 (92.6%) | 7 (6.5%) |
| 6 to 18 Years | 191 (92.7%) | 30 (14.6%) |
| 19 to 25 Years | 59 (86.8%) | 9 (13.2%) |
| 25 to 34 Years | 53 (22.4%) | 171 (72.2%) |
| 35 to 44 Years | 46 (82.1%) | 6 (10.7%) |
| 45 to 54 Years | 51 (87.9%) | 11 (19.0%) |
| 55 to 64 Years | 33 (73.3%) | 5 (11.1%) |
| 65 to 74 Years | 21 (100.0%) | 0 (0.0%) |
| 75 Years and over | 19 (100.0%) | 0 (0.0%) |
| Total | 573 (70.1%) | 239 (29.2%) |
Disability Status by Sex by Age in Tuntutuliak
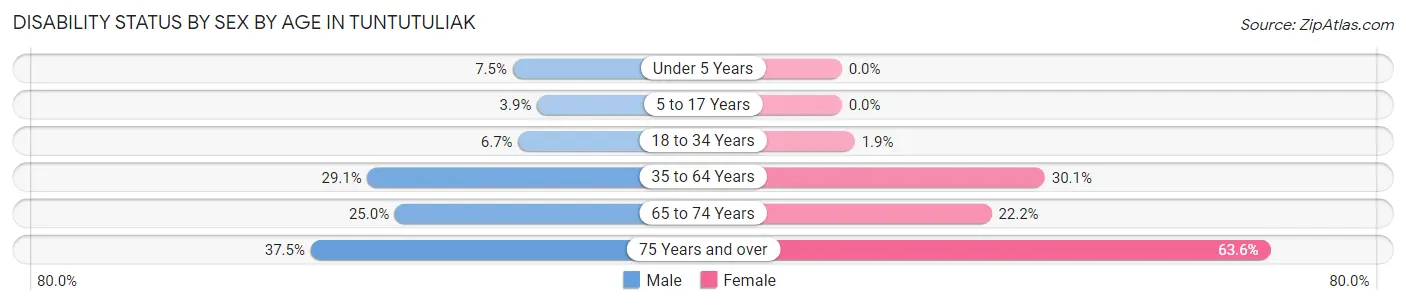
| Age Bracket | Male | Female |
| Under 5 Years | 3 (7.5%) | 0 (0.0%) |
| 5 to 17 Years | 4 (3.9%) | 0 (0.0%) |
| 18 to 34 Years | 5 (6.7%) | 5 (1.9%) |
| 35 to 64 Years | 25 (29.1%) | 22 (30.1%) |
| 65 to 74 Years | 3 (25.0%) | 2 (22.2%) |
| 75 Years and over | 3 (37.5%) | 7 (63.6%) |
Disability Class by Sex by Age in Tuntutuliak
Disability Class: Hearing Difficulty
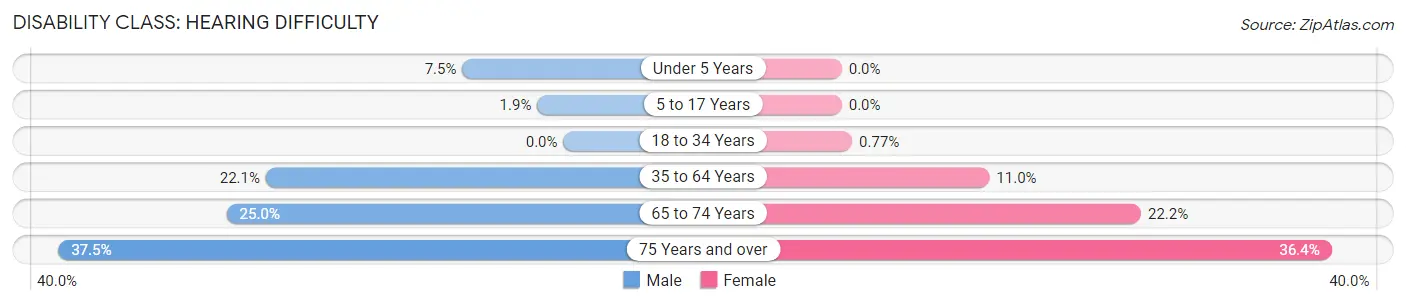
| Age Bracket | Male | Female |
| Under 5 Years | 3 (7.5%) | 0 (0.0%) |
| 5 to 17 Years | 2 (1.9%) | 0 (0.0%) |
| 18 to 34 Years | 0 (0.0%) | 2 (0.8%) |
| 35 to 64 Years | 19 (22.1%) | 8 (11.0%) |
| 65 to 74 Years | 3 (25.0%) | 2 (22.2%) |
| 75 Years and over | 3 (37.5%) | 4 (36.4%) |
Disability Class: Vision Difficulty
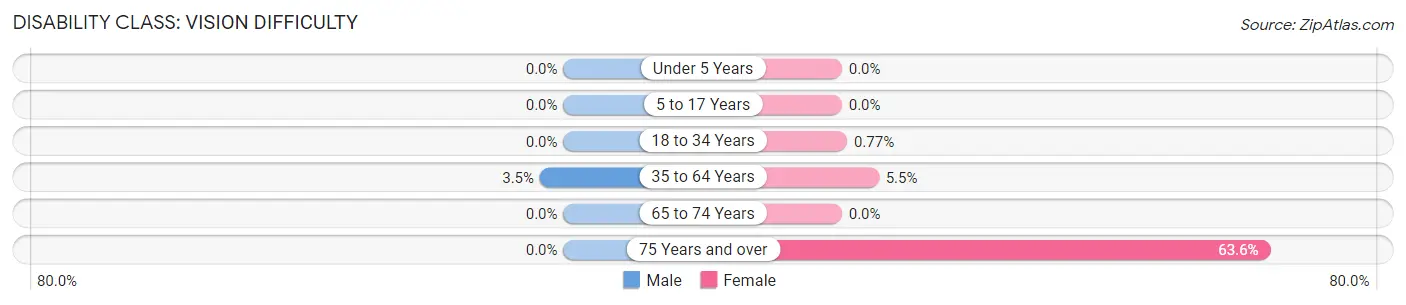
| Age Bracket | Male | Female |
| Under 5 Years | 0 (0.0%) | 0 (0.0%) |
| 5 to 17 Years | 0 (0.0%) | 0 (0.0%) |
| 18 to 34 Years | 0 (0.0%) | 2 (0.8%) |
| 35 to 64 Years | 3 (3.5%) | 4 (5.5%) |
| 65 to 74 Years | 0 (0.0%) | 0 (0.0%) |
| 75 Years and over | 0 (0.0%) | 7 (63.6%) |
Disability Class: Cognitive Difficulty
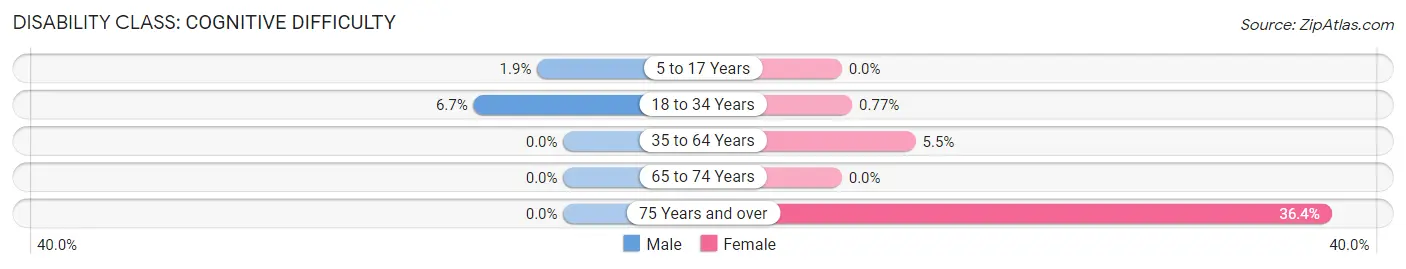
| Age Bracket | Male | Female |
| 5 to 17 Years | 2 (1.9%) | 0 (0.0%) |
| 18 to 34 Years | 5 (6.7%) | 2 (0.8%) |
| 35 to 64 Years | 0 (0.0%) | 4 (5.5%) |
| 65 to 74 Years | 0 (0.0%) | 0 (0.0%) |
| 75 Years and over | 0 (0.0%) | 4 (36.4%) |
Disability Class: Ambulatory Difficulty
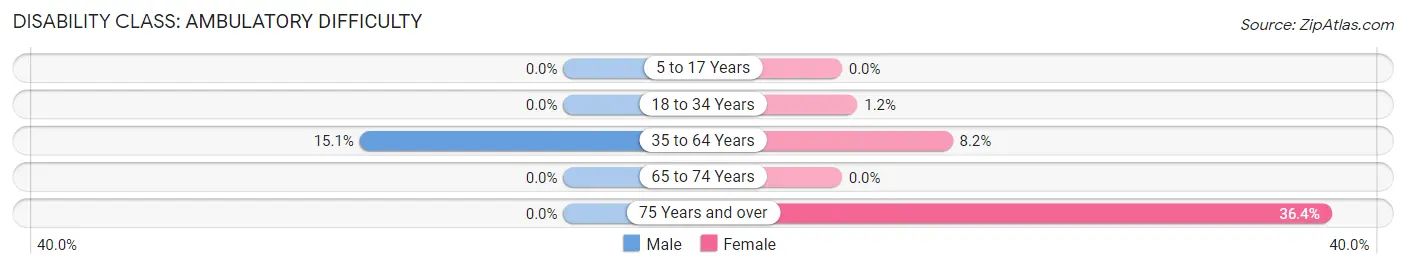
| Age Bracket | Male | Female |
| 5 to 17 Years | 0 (0.0%) | 0 (0.0%) |
| 18 to 34 Years | 0 (0.0%) | 3 (1.1%) |
| 35 to 64 Years | 13 (15.1%) | 6 (8.2%) |
| 65 to 74 Years | 0 (0.0%) | 0 (0.0%) |
| 75 Years and over | 0 (0.0%) | 4 (36.4%) |
Disability Class: Self-Care Difficulty
| Age Bracket | Male | Female |
| 5 to 17 Years | 0 (0.0%) | 0 (0.0%) |
| 18 to 34 Years | 0 (0.0%) | 0 (0.0%) |
| 35 to 64 Years | 0 (0.0%) | 0 (0.0%) |
| 65 to 74 Years | 0 (0.0%) | 0 (0.0%) |
| 75 Years and over | 0 (0.0%) | 0 (0.0%) |
Technology Access in Tuntutuliak
Computing Device Access in Tuntutuliak
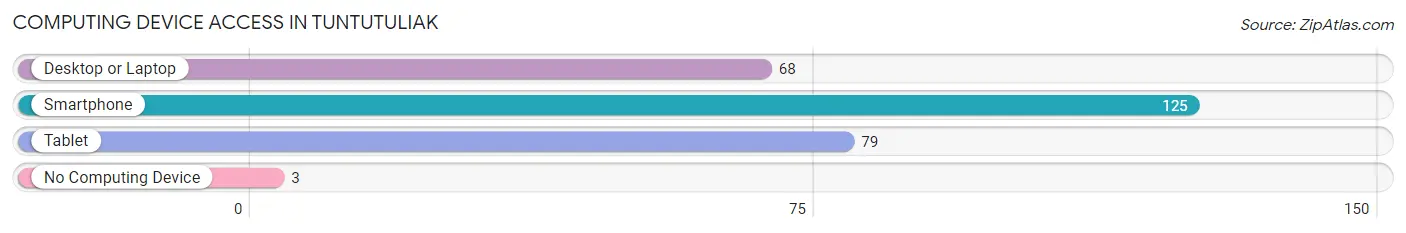
| Device Type | # Households | % Households |
| Desktop or Laptop | 68 | 52.3% |
| Smartphone | 125 | 96.2% |
| Tablet | 79 | 60.8% |
| No Computing Device | 3 | 2.3% |
| Total | 130 | 100.0% |
Internet Access in Tuntutuliak
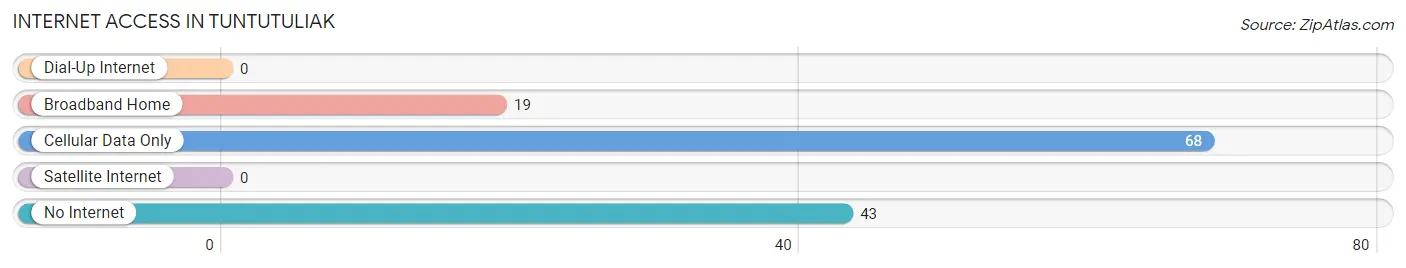
| Internet Type | # Households | % Households |
| Dial-Up Internet | 0 | 0.0% |
| Broadband Home | 19 | 14.6% |
| Cellular Data Only | 68 | 52.3% |
| Satellite Internet | 0 | 0.0% |
| No Internet | 43 | 33.1% |
| Total | 130 | 100.0% |
Tuntutuliak Summary
Tuntutuliak is a small city located in the Bethel Census Area of Alaska. It is situated on the Kuskokwim River, about 40 miles southwest of Bethel. The population of Tuntutuliak was 517 at the 2010 census, up from 463 in 2000.
History
Tuntutuliak was originally inhabited by Yup'ik Eskimos, who called the area “Tuntutulik,” meaning “place of the little hills.” The first non-native settlers arrived in the area in the late 1800s, and the town was officially established in 1912. The town was originally a trading post, and it was later used as a base for fur trapping and fishing.
In the early 1900s, the Alaska Native Brotherhood (ANB) was founded in Tuntutuliak. The ANB was a civil rights organization that advocated for the rights of Alaska Natives. In the 1950s, the ANB helped to establish the Alaska Federation of Natives (AFN), which is still active today.
Geography
Tuntutuliak is located in the Bethel Census Area of Alaska, about 40 miles southwest of Bethel. The city is situated on the Kuskokwim River, and it is surrounded by the Kuskokwim Mountains. The climate in Tuntutuliak is subarctic, with cold winters and mild summers.
Economy
The economy of Tuntutuliak is largely based on subsistence activities, such as fishing, hunting, and trapping. The city also has a small commercial fishing industry, and there are several small businesses in the area. The city is home to a number of government offices, including the Alaska Department of Fish and Game, the Alaska Department of Transportation, and the Alaska State Troopers.
Demographics
As of the 2010 census, the population of Tuntutuliak was 517, up from 463 in 2000. The racial makeup of the city was 95.2% Native American, 2.3% White, 0.2% Asian, and 2.3% from other races. The median household income in Tuntutuliak was $25,000, and the median family income was $30,000.
Conclusion
Tuntutuliak is a small city located in the Bethel Census Area of Alaska. It is situated on the Kuskokwim River, about 40 miles southwest of Bethel. The population of Tuntutuliak was 517 at the 2010 census, up from 463 in 2000. The economy of Tuntutuliak is largely based on subsistence activities, such as fishing, hunting, and trapping. The racial makeup of the city was 95.2% Native American, 2.3% White, 0.2% Asian, and 2.3% from other races. The median household income in Tuntutuliak was $25,000, and the median family income was $30,000.
Common Questions
What is Per Capita Income in Tuntutuliak?
Per Capita income in Tuntutuliak is $20,965.
What is the Median Family Income in Tuntutuliak?
Median Family Income in Tuntutuliak is $47,917.
What is the Median Household income in Tuntutuliak?
Median Household Income in Tuntutuliak is $43,000.
What is Family Income Deficit in Tuntutuliak?
Family Income Deficit in Tuntutuliak is $11,000.
Families that are below poverty line in Tuntutuliak earn $11,000 less on average than the poverty threshold level.
What is Inequality or Gini Index in Tuntutuliak?
Inequality or Gini Index in Tuntutuliak is 0.46.
What is the Total Population of Tuntutuliak?
Total Population of Tuntutuliak is 820.
What is the Total Male Population of Tuntutuliak?
Total Male Population of Tuntutuliak is 326.
What is the Total Female Population of Tuntutuliak?
Total Female Population of Tuntutuliak is 494.
What is the Ratio of Males per 100 Females in Tuntutuliak?
There are 65.99 Males per 100 Females in Tuntutuliak.
What is the Ratio of Females per 100 Males in Tuntutuliak?
There are 151.53 Females per 100 Males in Tuntutuliak.
What is the Median Population Age in Tuntutuliak?
Median Population Age in Tuntutuliak is 28.2 Years.
What is the Average Family Size in Tuntutuliak
Average Family Size in Tuntutuliak is 5.6 People.
What is the Average Household Size in Tuntutuliak
Average Household Size in Tuntutuliak is 5.1 People.
How Large is the Labor Force in Tuntutuliak?
There are 393 People in the Labor Forcein in Tuntutuliak.
What is the Percentage of People in the Labor Force in Tuntutuliak?
70.7% of People are in the Labor Force in Tuntutuliak.
What is the Unemployment Rate in Tuntutuliak?
Unemployment Rate in Tuntutuliak is 22.0%.