Harding Birch Lakes, AK Map & Demographics
Harding Birch Lakes Map
Harding Birch Lakes Overview
$33,664
PER CAPITA INCOME
$74,271
AVG FAMILY INCOME
$73,281
AVG HOUSEHOLD INCOME
0.31
INEQUALITY / GINI INDEX
285
TOTAL POPULATION
179
MALE POPULATION
106
FEMALE POPULATION
168.87
MALES / 100 FEMALES
59.22
FEMALES / 100 MALES
59.1
MEDIAN AGE
2.4
AVG FAMILY SIZE
2.5
AVG HOUSEHOLD SIZE
104
LABOR FORCE [ PEOPLE ]
37.1%
PERCENT IN LABOR FORCE
4.8%
UNEMPLOYMENT RATE
Income in Harding Birch Lakes
Income Overview in Harding Birch Lakes
Per Capita Income in Harding Birch Lakes is $33,664, while median incomes of families and households are $74,271 and $73,281 respectively.
| Characteristic | Number | Measure |
| Per Capita Income | 285 | $33,664 |
| Median Family Income | 84 | $74,271 |
| Mean Family Income | 84 | $72,076 |
| Median Household Income | 115 | $73,281 |
| Mean Household Income | 115 | $66,950 |
| Income Deficit | 84 | $0 |
| Wage / Income Gap (%) | 285 | 0.00% |
| Wage / Income Gap ($) | 285 | 100.00¢ per $1 |
| Gini / Inequality Index | 285 | 0.31 |
Earnings by Sex in Harding Birch Lakes
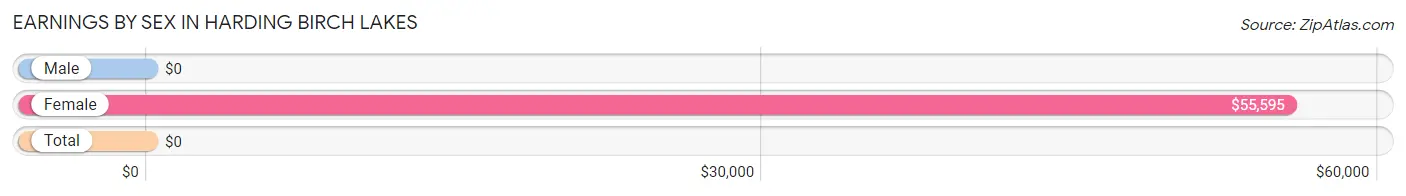
| Sex | Number | Average Earnings |
| Male | 115 (64.2%) | $0 |
| Female | 64 (35.7%) | $55,595 |
| Total | 179 (100.0%) | $0 |
Earnings by Sex by Income Bracket in Harding Birch Lakes
The most common earnings brackets in Harding Birch Lakes are $10,000 to $12,499 for men (56 | 48.7%) and $55,000 to $64,999 for women (42 | 65.6%).
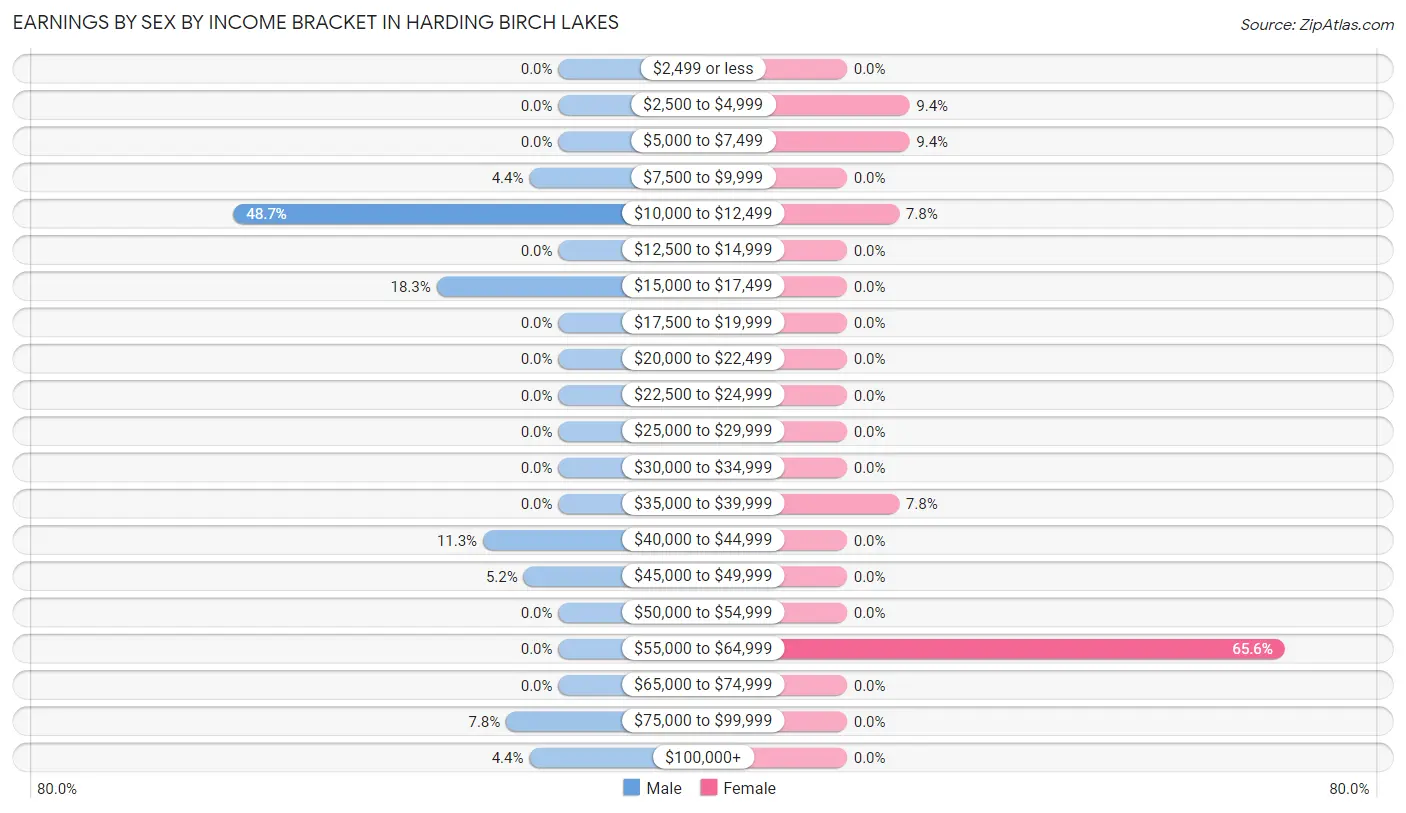
| Income | Male | Female |
| $2,499 or less | 0 (0.0%) | 0 (0.0%) |
| $2,500 to $4,999 | 0 (0.0%) | 6 (9.4%) |
| $5,000 to $7,499 | 0 (0.0%) | 6 (9.4%) |
| $7,500 to $9,999 | 5 (4.3%) | 0 (0.0%) |
| $10,000 to $12,499 | 56 (48.7%) | 5 (7.8%) |
| $12,500 to $14,999 | 0 (0.0%) | 0 (0.0%) |
| $15,000 to $17,499 | 21 (18.3%) | 0 (0.0%) |
| $17,500 to $19,999 | 0 (0.0%) | 0 (0.0%) |
| $20,000 to $22,499 | 0 (0.0%) | 0 (0.0%) |
| $22,500 to $24,999 | 0 (0.0%) | 0 (0.0%) |
| $25,000 to $29,999 | 0 (0.0%) | 0 (0.0%) |
| $30,000 to $34,999 | 0 (0.0%) | 0 (0.0%) |
| $35,000 to $39,999 | 0 (0.0%) | 5 (7.8%) |
| $40,000 to $44,999 | 13 (11.3%) | 0 (0.0%) |
| $45,000 to $49,999 | 6 (5.2%) | 0 (0.0%) |
| $50,000 to $54,999 | 0 (0.0%) | 0 (0.0%) |
| $55,000 to $64,999 | 0 (0.0%) | 42 (65.6%) |
| $65,000 to $74,999 | 0 (0.0%) | 0 (0.0%) |
| $75,000 to $99,999 | 9 (7.8%) | 0 (0.0%) |
| $100,000+ | 5 (4.3%) | 0 (0.0%) |
| Total | 115 (100.0%) | 64 (100.0%) |
Earnings by Sex by Educational Attainment in Harding Birch Lakes
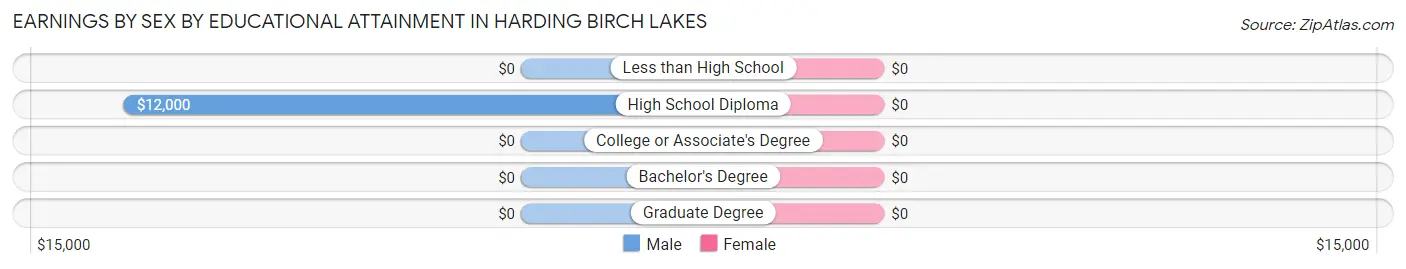
| Educational Attainment | Male Income | Female Income |
| Less than High School | - | - |
| High School Diploma | $12,000 | $0 |
| College or Associate's Degree | - | - |
| Bachelor's Degree | - | - |
| Graduate Degree | - | - |
| Total | - | - |
Family Income in Harding Birch Lakes
Family Income Brackets in Harding Birch Lakes
According to the Harding Birch Lakes family income data, there are 29 families falling into the $50,000 to $74,999 income range, which is the most common income bracket and makes up 34.5% of all families.
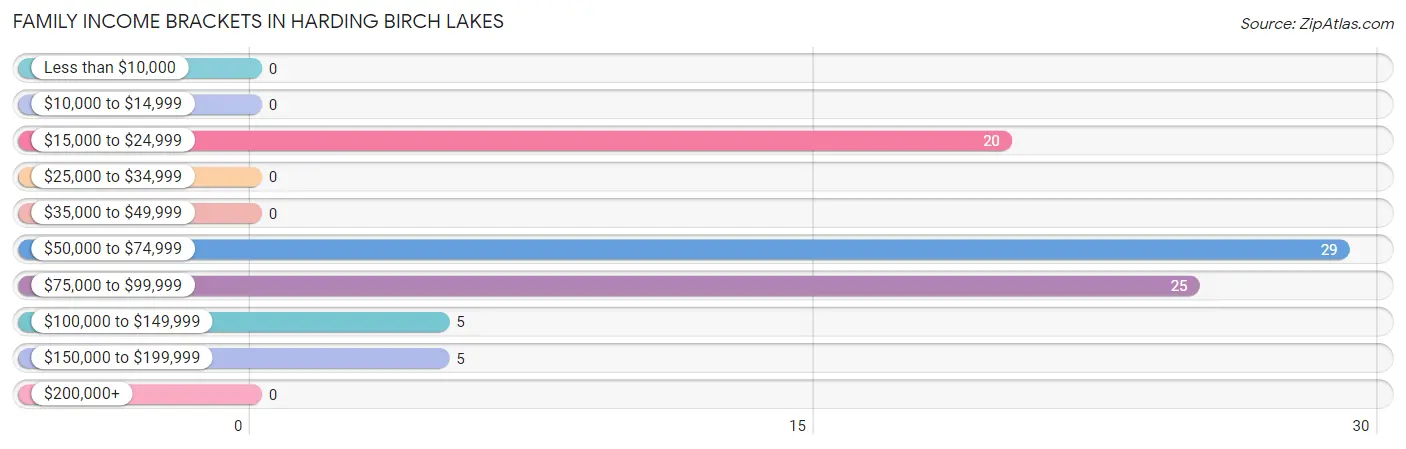
| Income Bracket | # Families | % Families |
| Less than $10,000 | 0 | 0.0% |
| $10,000 to $14,999 | 0 | 0.0% |
| $15,000 to $24,999 | 20 | 23.8% |
| $25,000 to $34,999 | 0 | 0.0% |
| $35,000 to $49,999 | 0 | 0.0% |
| $50,000 to $74,999 | 29 | 34.5% |
| $75,000 to $99,999 | 25 | 29.8% |
| $100,000 to $149,999 | 5 | 6.0% |
| $150,000 to $199,999 | 5 | 6.0% |
| $200,000+ | 0 | 0.0% |
Family Income by Famaliy Size in Harding Birch Lakes
2-person families (79 | 94.1%) account for the highest median family income in Harding Birch Lakes with $74,010 per family, while 2-person families (79 | 94.1%) have the highest median income of $37,005 per family member.
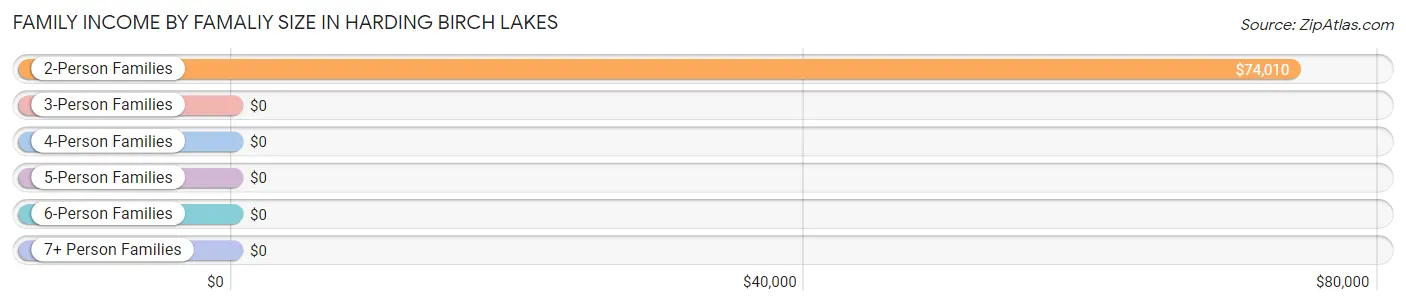
| Income Bracket | # Families | Median Income |
| 2-Person Families | 79 (94.1%) | $74,010 |
| 3-Person Families | 0 (0.0%) | $0 |
| 4-Person Families | 5 (5.9%) | $0 |
| 5-Person Families | 0 (0.0%) | $0 |
| 6-Person Families | 0 (0.0%) | $0 |
| 7+ Person Families | 0 (0.0%) | $0 |
| Total | 84 (100.0%) | $74,271 |
Family Income by Number of Earners in Harding Birch Lakes
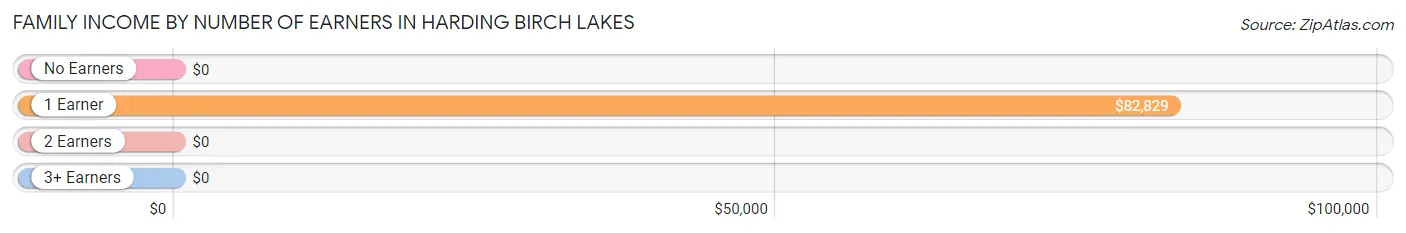
| Number of Earners | # Families | Median Income |
| No Earners | 24 (28.6%) | $0 |
| 1 Earner | 43 (51.2%) | $82,829 |
| 2 Earners | 17 (20.2%) | $0 |
| 3+ Earners | 0 (0.0%) | $0 |
| Total | 84 (100.0%) | $74,271 |
Household Income in Harding Birch Lakes
Household Income Brackets in Harding Birch Lakes
With 42 households falling in the category, the $50,000 to $74,999 income range is the most frequent in Harding Birch Lakes, accounting for 36.5% of all households.
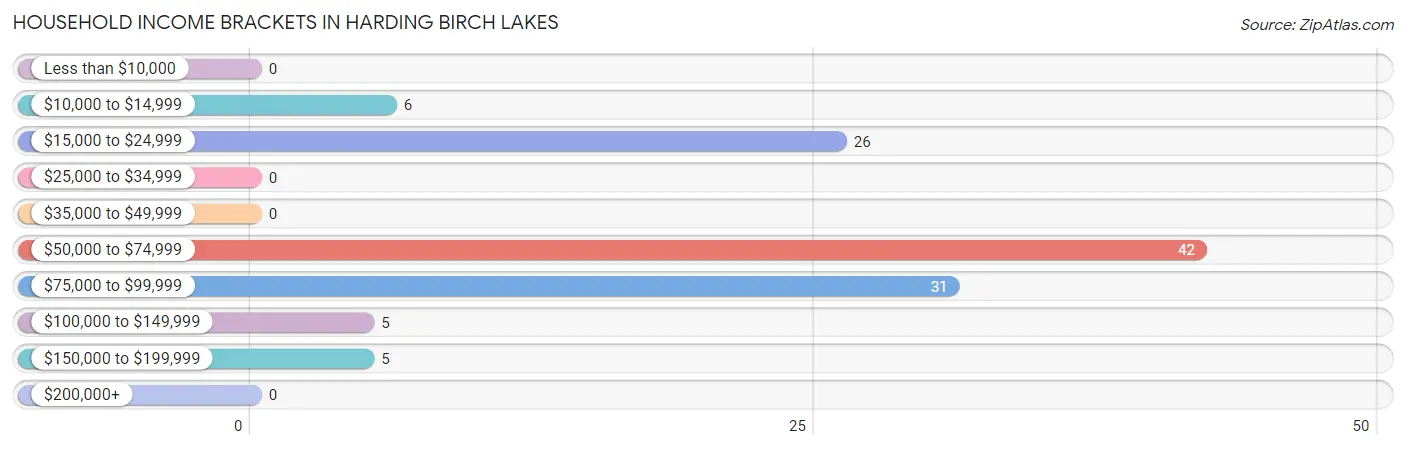
| Income Bracket | # Households | % Households |
| Less than $10,000 | 0 | 0.0% |
| $10,000 to $14,999 | 6 | 5.2% |
| $15,000 to $24,999 | 26 | 22.6% |
| $25,000 to $34,999 | 0 | 0.0% |
| $35,000 to $49,999 | 0 | 0.0% |
| $50,000 to $74,999 | 42 | 36.5% |
| $75,000 to $99,999 | 31 | 27.0% |
| $100,000 to $149,999 | 5 | 4.3% |
| $150,000 to $199,999 | 5 | 4.3% |
| $200,000+ | 0 | 0.0% |
Household Income by Householder Age in Harding Birch Lakes
The median household income in Harding Birch Lakes is $73,281, with the highest median household income of $77,292 found in the 45 to 64 years age bracket for the primary householder. A total of 61 households (53.0%) fall into this category.
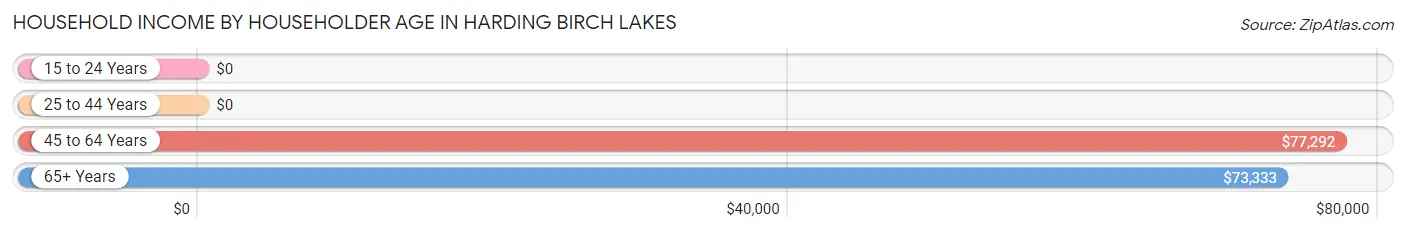
| Income Bracket | # Households | Median Income |
| 15 to 24 Years | 0 (0.0%) | $0 |
| 25 to 44 Years | 12 (10.4%) | $0 |
| 45 to 64 Years | 61 (53.0%) | $77,292 |
| 65+ Years | 42 (36.5%) | $73,333 |
| Total | 115 (100.0%) | $73,281 |
Poverty in Harding Birch Lakes
Income Below Poverty by Sex and Age in Harding Birch Lakes
With 39.1% poverty level for males and 15.1% for females among the residents of Harding Birch Lakes, 35 to 44 year old males and 35 to 44 year old females are the most vulnerable to poverty, with 6 males (100.0%) and 16 females (80.0%) in their respective age groups living below the poverty level.
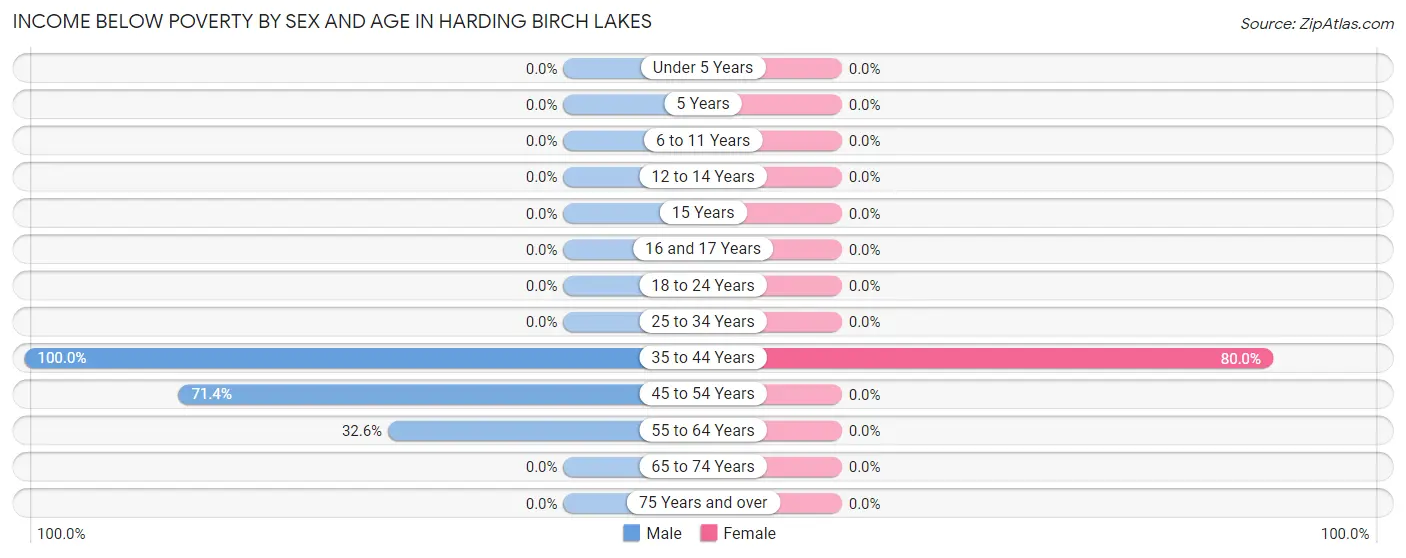
| Age Bracket | Male | Female |
| Under 5 Years | 0 (0.0%) | 0 (0.0%) |
| 5 Years | 0 (0.0%) | 0 (0.0%) |
| 6 to 11 Years | 0 (0.0%) | 0 (0.0%) |
| 12 to 14 Years | 0 (0.0%) | 0 (0.0%) |
| 15 Years | 0 (0.0%) | 0 (0.0%) |
| 16 and 17 Years | 0 (0.0%) | 0 (0.0%) |
| 18 to 24 Years | 0 (0.0%) | 0 (0.0%) |
| 25 to 34 Years | 0 (0.0%) | 0 (0.0%) |
| 35 to 44 Years | 6 (100.0%) | 16 (80.0%) |
| 45 to 54 Years | 50 (71.4%) | 0 (0.0%) |
| 55 to 64 Years | 14 (32.6%) | 0 (0.0%) |
| 65 to 74 Years | 0 (0.0%) | 0 (0.0%) |
| 75 Years and over | 0 (0.0%) | 0 (0.0%) |
| Total | 70 (39.1%) | 16 (15.1%) |
Income Above Poverty by Sex and Age in Harding Birch Lakes
According to the poverty statistics in Harding Birch Lakes, males aged 15 years and females aged 25 to 34 years are the age groups that are most secure financially, with 100.0% of males and 100.0% of females in these age groups living above the poverty line.
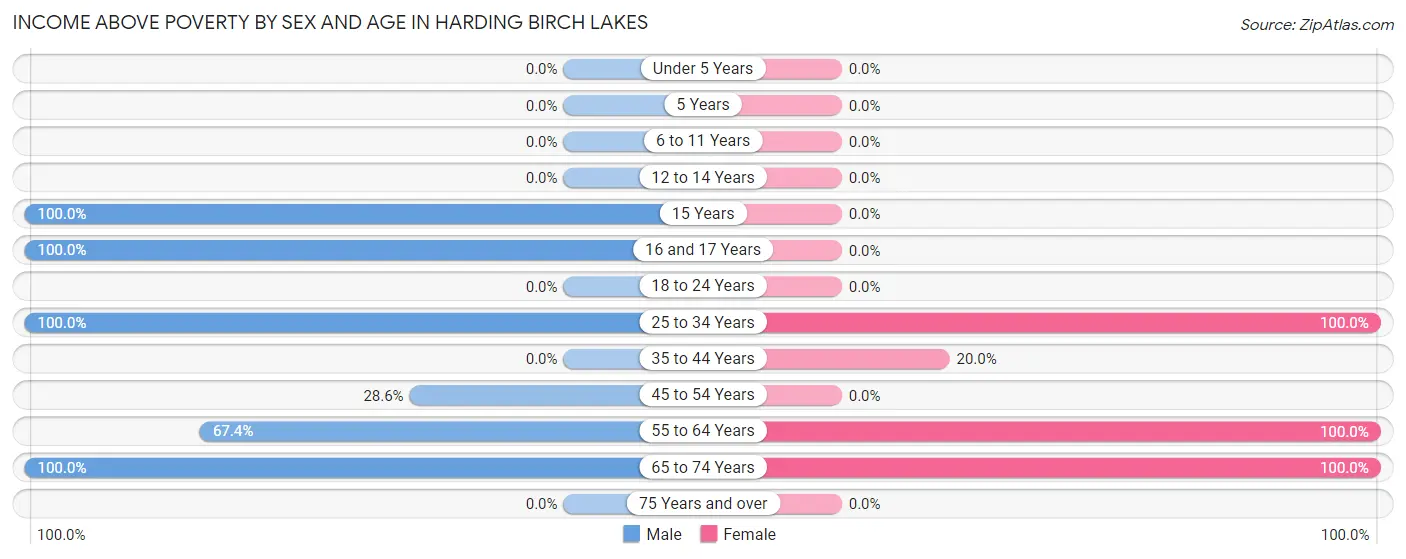
| Age Bracket | Male | Female |
| Under 5 Years | 0 (0.0%) | 0 (0.0%) |
| 5 Years | 0 (0.0%) | 0 (0.0%) |
| 6 to 11 Years | 0 (0.0%) | 0 (0.0%) |
| 12 to 14 Years | 0 (0.0%) | 0 (0.0%) |
| 15 Years | 5 (100.0%) | 0 (0.0%) |
| 16 and 17 Years | 5 (100.0%) | 0 (0.0%) |
| 18 to 24 Years | 0 (0.0%) | 0 (0.0%) |
| 25 to 34 Years | 7 (100.0%) | 6 (100.0%) |
| 35 to 44 Years | 0 (0.0%) | 4 (20.0%) |
| 45 to 54 Years | 20 (28.6%) | 0 (0.0%) |
| 55 to 64 Years | 29 (67.4%) | 53 (100.0%) |
| 65 to 74 Years | 43 (100.0%) | 27 (100.0%) |
| 75 Years and over | 0 (0.0%) | 0 (0.0%) |
| Total | 109 (60.9%) | 90 (84.9%) |
Income Below Poverty Among Married-Couple Families in Harding Birch Lakes
The poverty statistics for married-couple families in Harding Birch Lakes show that 16.7% or 14 of the total 84 families live below the poverty line. Families with no children have the highest poverty rate of 17.7%, comprising of 14 families. On the other hand, families with 1 or 2 children have the lowest poverty rate of 0.0%, which includes 0 families.
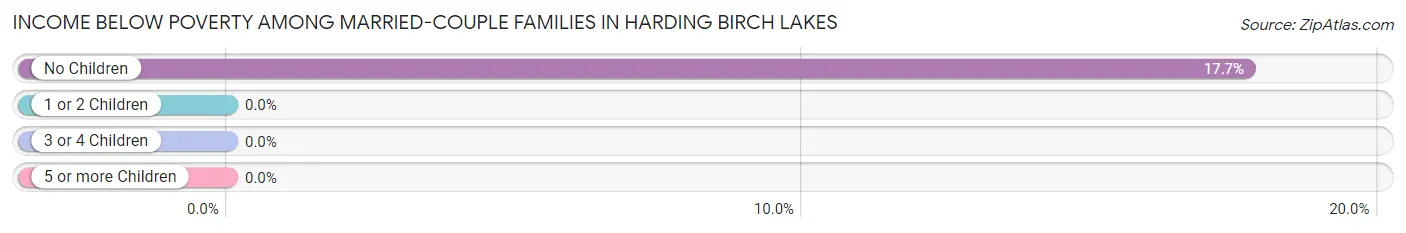
| Children | Above Poverty | Below Poverty |
| No Children | 65 (82.3%) | 14 (17.7%) |
| 1 or 2 Children | 5 (100.0%) | 0 (0.0%) |
| 3 or 4 Children | 0 (0.0%) | 0 (0.0%) |
| 5 or more Children | 0 (0.0%) | 0 (0.0%) |
| Total | 70 (83.3%) | 14 (16.7%) |
Income Below Poverty Among Single-Parent Households in Harding Birch Lakes
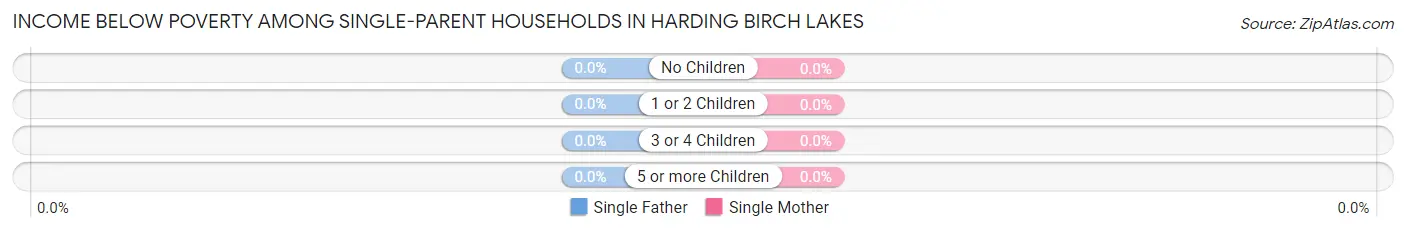
| Children | Single Father | Single Mother |
| No Children | 0 (0.0%) | 0 (0.0%) |
| 1 or 2 Children | 0 (0.0%) | 0 (0.0%) |
| 3 or 4 Children | 0 (0.0%) | 0 (0.0%) |
| 5 or more Children | 0 (0.0%) | 0 (0.0%) |
| Total | 0 (0.0%) | 0 (0.0%) |
Income Below Poverty Among Married-Couple vs Single-Parent Households in Harding Birch Lakes
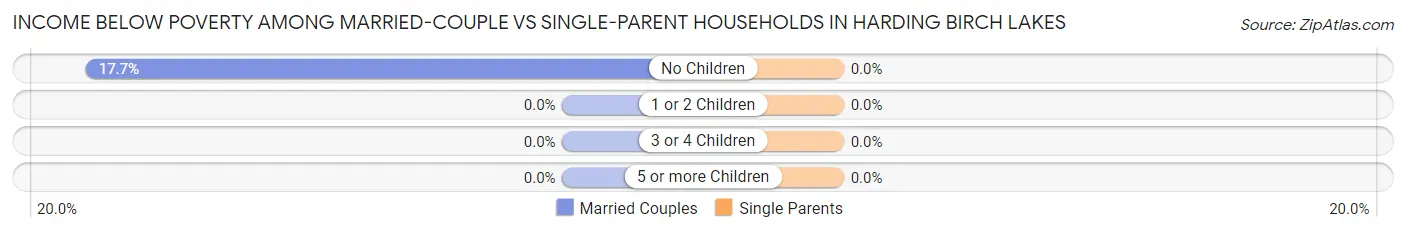
| Children | Married-Couple Families | Single-Parent Households |
| No Children | 14 (17.7%) | 0 (0.0%) |
| 1 or 2 Children | 0 (0.0%) | 0 (0.0%) |
| 3 or 4 Children | 0 (0.0%) | 0 (0.0%) |
| 5 or more Children | 0 (0.0%) | 0 (0.0%) |
| Total | 14 (16.7%) | 0 (0.0%) |
Race in Harding Birch Lakes
The most populous races in Harding Birch Lakes are White / Caucasian (269 | 94.4%), and Hawaiian / Pacific (16 | 5.6%).
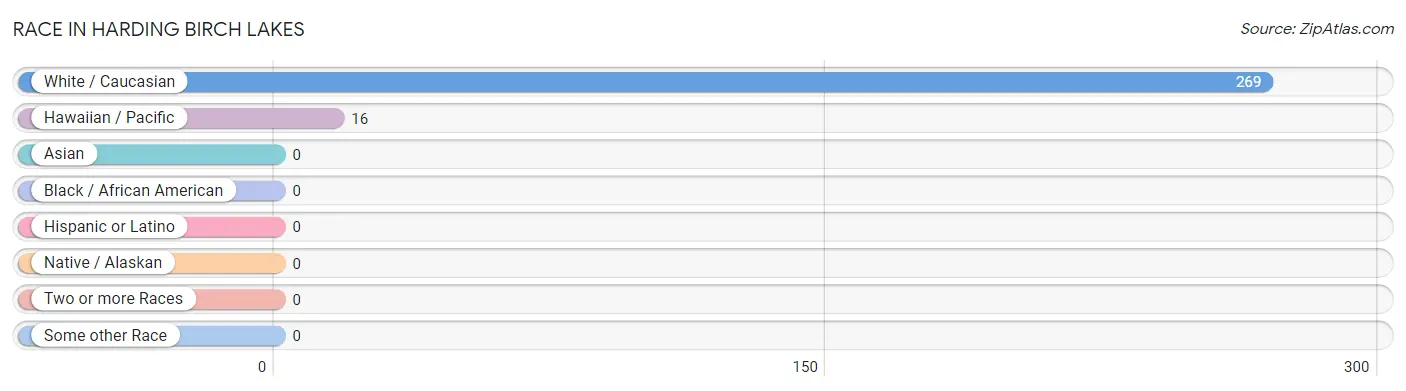
| Race | # Population | % Population |
| Asian | 0 | 0.0% |
| Black / African American | 0 | 0.0% |
| Hawaiian / Pacific | 16 | 5.6% |
| Hispanic or Latino | 0 | 0.0% |
| Native / Alaskan | 0 | 0.0% |
| White / Caucasian | 269 | 94.4% |
| Two or more Races | 0 | 0.0% |
| Some other Race | 0 | 0.0% |
| Total | 285 | 100.0% |
Ancestry in Harding Birch Lakes
The most populous ancestries reported in Harding Birch Lakes are English (141 | 49.5%), German (47 | 16.5%), Welsh (32 | 11.2%), Scotch-Irish (24 | 8.4%), and Northern European (15 | 5.3%), together accounting for 90.9% of all Harding Birch Lakes residents.
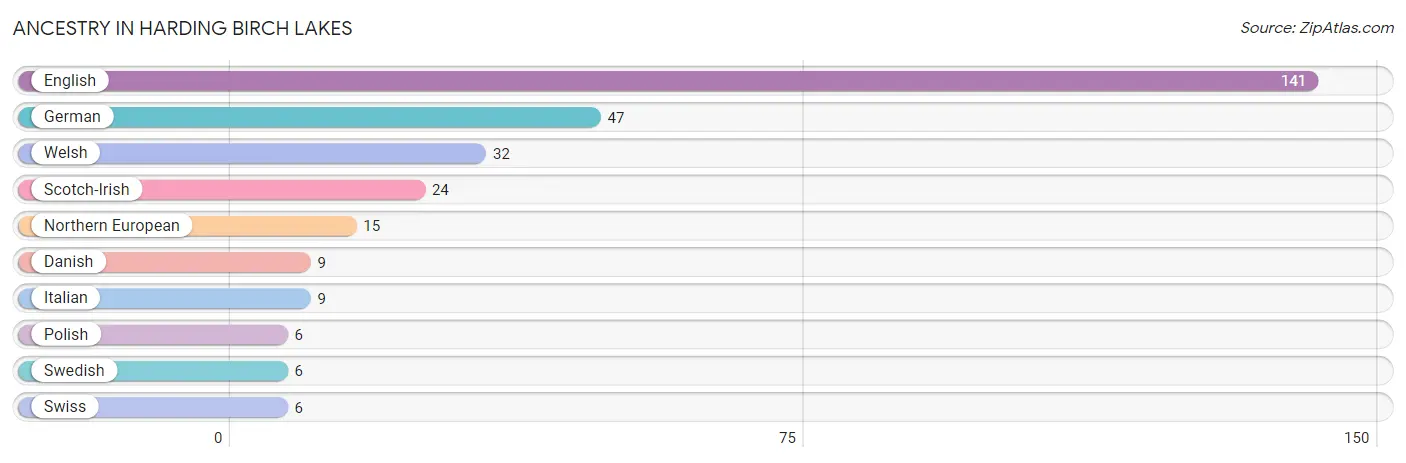
| Ancestry | # Population | % Population |
| Danish | 9 | 3.2% |
| English | 141 | 49.5% |
| German | 47 | 16.5% |
| Italian | 9 | 3.2% |
| Northern European | 15 | 5.3% |
| Polish | 6 | 2.1% |
| Scotch-Irish | 24 | 8.4% |
| Swedish | 6 | 2.1% |
| Swiss | 6 | 2.1% |
| Welsh | 32 | 11.2% | View All 10 Rows |
Immigrants in Harding Birch Lakes
The most numerous immigrant groups reported in Harding Birch Lakes came from , and Oceania (16 | 5.6%), together accounting for 5.6% of all Harding Birch Lakes residents.

| Immigration Origin | # Population | % Population |
| Oceania | 16 | 5.6% | View All 1 Rows |
Sex and Age in Harding Birch Lakes
Sex and Age in Harding Birch Lakes
The most populous age groups in Harding Birch Lakes are 50 to 54 Years (50 | 27.9%) for men and 55 to 59 Years (48 | 45.3%) for women.
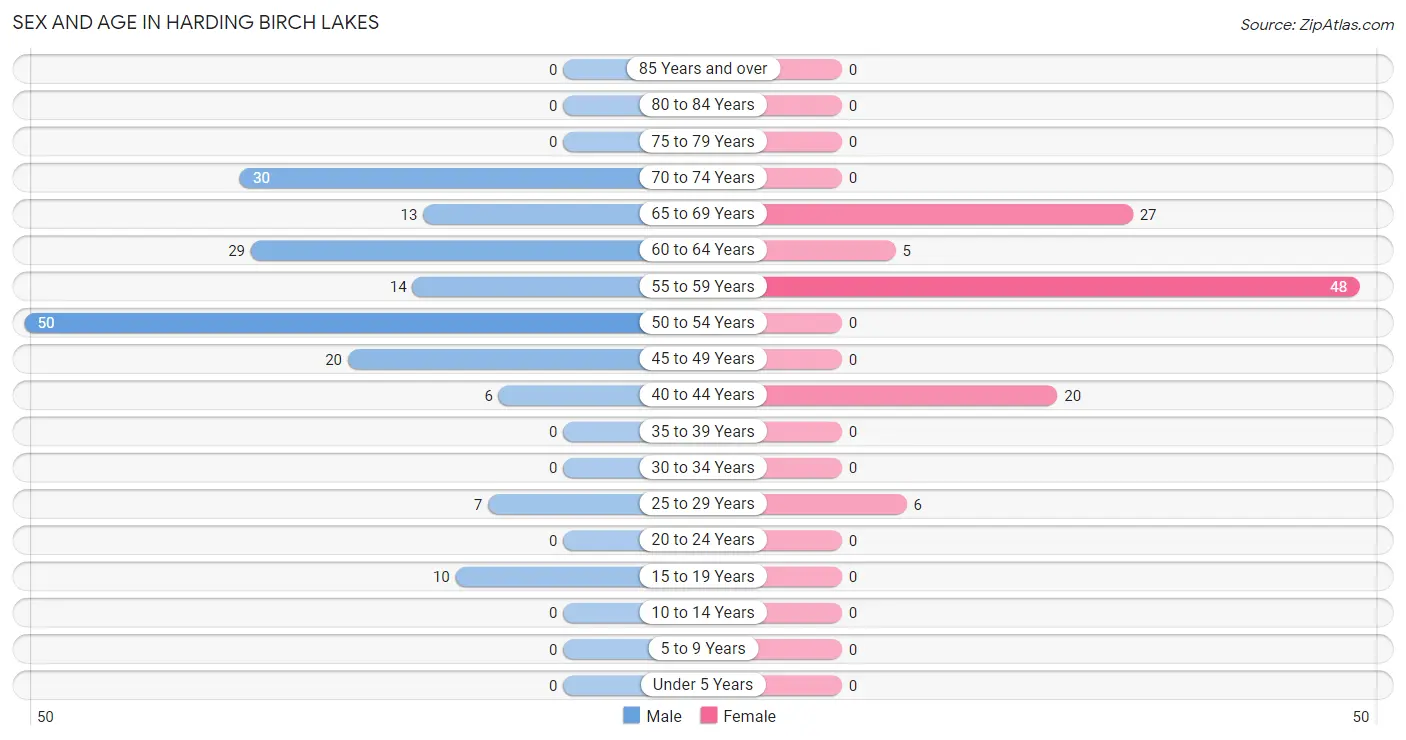
| Age Bracket | Male | Female |
| Under 5 Years | 0 (0.0%) | 0 (0.0%) |
| 5 to 9 Years | 0 (0.0%) | 0 (0.0%) |
| 10 to 14 Years | 0 (0.0%) | 0 (0.0%) |
| 15 to 19 Years | 10 (5.6%) | 0 (0.0%) |
| 20 to 24 Years | 0 (0.0%) | 0 (0.0%) |
| 25 to 29 Years | 7 (3.9%) | 6 (5.7%) |
| 30 to 34 Years | 0 (0.0%) | 0 (0.0%) |
| 35 to 39 Years | 0 (0.0%) | 0 (0.0%) |
| 40 to 44 Years | 6 (3.4%) | 20 (18.9%) |
| 45 to 49 Years | 20 (11.2%) | 0 (0.0%) |
| 50 to 54 Years | 50 (27.9%) | 0 (0.0%) |
| 55 to 59 Years | 14 (7.8%) | 48 (45.3%) |
| 60 to 64 Years | 29 (16.2%) | 5 (4.7%) |
| 65 to 69 Years | 13 (7.3%) | 27 (25.5%) |
| 70 to 74 Years | 30 (16.8%) | 0 (0.0%) |
| 75 to 79 Years | 0 (0.0%) | 0 (0.0%) |
| 80 to 84 Years | 0 (0.0%) | 0 (0.0%) |
| 85 Years and over | 0 (0.0%) | 0 (0.0%) |
| Total | 179 (100.0%) | 106 (100.0%) |
Families and Households in Harding Birch Lakes
Median Family Size in Harding Birch Lakes
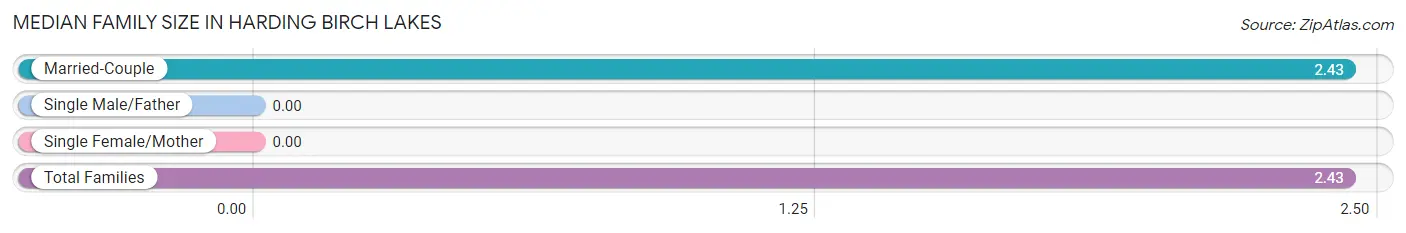
| Family Type | # Families | Family Size |
| Married-Couple | 84 (100.0%) | 2.43 |
| Single Male/Father | 0 (0.0%) | - |
| Single Female/Mother | 0 (0.0%) | - |
| Total Families | 84 (100.0%) | 2.43 |
Median Household Size in Harding Birch Lakes
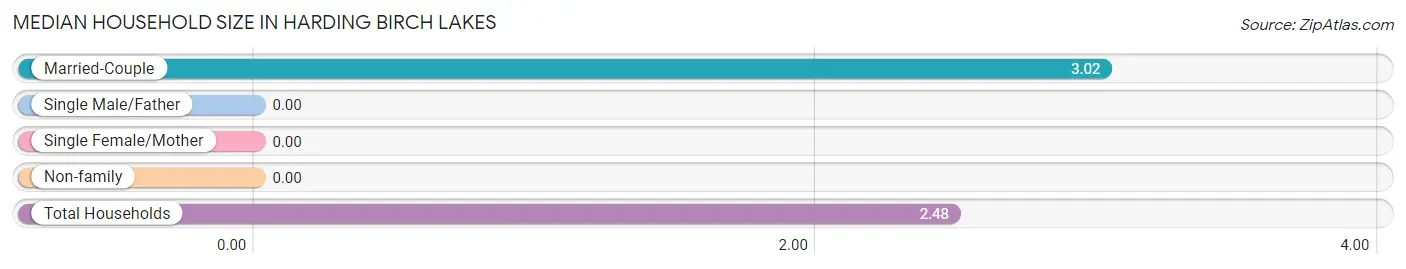
| Household Type | # Households | Household Size |
| Married-Couple | 84 (73.0%) | 3.02 |
| Single Male/Father | 0 (0.0%) | - |
| Single Female/Mother | 0 (0.0%) | - |
| Non-family | 31 (27.0%) | - |
| Total Households | 115 (100.0%) | 2.48 |
Household Size by Marriage Status in Harding Birch Lakes
Out of a total of 115 households in Harding Birch Lakes, 84 (73.0%) are family households, while 31 (27.0%) are nonfamily households. The most numerous type of family households are 2-person households, comprising 60, and the most common type of nonfamily households are 1-person households, comprising 31.
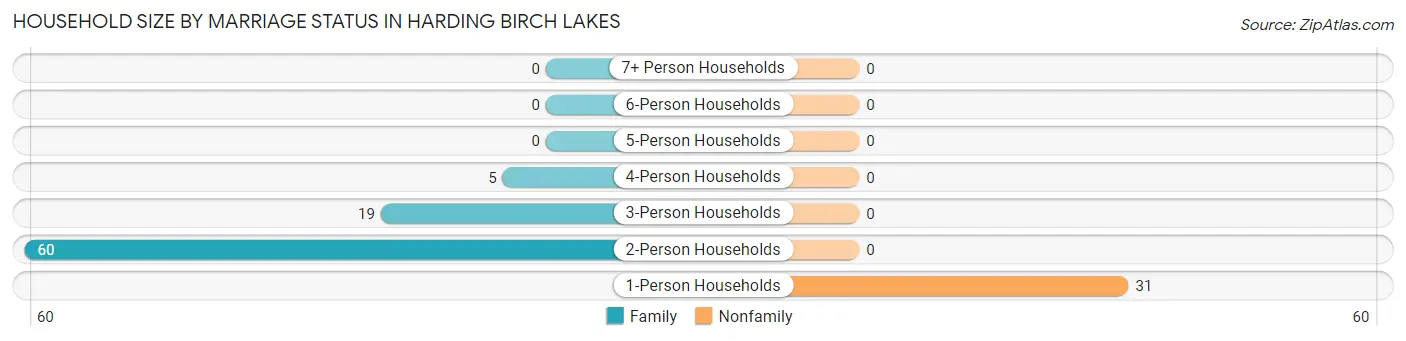
| Household Size | Family Households | Nonfamily Households |
| 1-Person Households | - | 31 (27.0%) |
| 2-Person Households | 60 (52.2%) | 0 (0.0%) |
| 3-Person Households | 19 (16.5%) | 0 (0.0%) |
| 4-Person Households | 5 (4.3%) | 0 (0.0%) |
| 5-Person Households | 0 (0.0%) | 0 (0.0%) |
| 6-Person Households | 0 (0.0%) | 0 (0.0%) |
| 7+ Person Households | 0 (0.0%) | 0 (0.0%) |
| Total | 84 (73.0%) | 31 (27.0%) |
Female Fertility in Harding Birch Lakes
Fertility by Age in Harding Birch Lakes
| Age Bracket | Women with Births | Births / 1,000 Women |
| 15 to 19 years | 0 (0.0%) | 0.0 |
| 20 to 34 years | 0 (0.0%) | 0.0 |
| 35 to 50 years | 0 (0.0%) | 0.0 |
| Total | 0 (0.0%) | 0.0 |
Fertility by Age by Marriage Status in Harding Birch Lakes
| Age Bracket | Married | Unmarried |
| 15 to 19 years | 0 (0.0%) | 0 (0.0%) |
| 20 to 34 years | 0 (0.0%) | 0 (0.0%) |
| 35 to 50 years | 0 (0.0%) | 0 (0.0%) |
| Total | 0 (0.0%) | 0 (0.0%) |
Fertility by Education in Harding Birch Lakes
| Educational Attainment | Women with Births | Births / 1,000 Women |
| Less than High School | 0 (0.0%) | 0.0 |
| High School Diploma | 0 (0.0%) | 0.0 |
| College or Associate's Degree | 0 (0.0%) | 0.0 |
| Bachelor's Degree | 0 (0.0%) | 0.0 |
| Graduate Degree | 0 (0.0%) | 0.0 |
| Total | 0 (0.0%) | 0.0 |
Fertility by Education by Marriage Status in Harding Birch Lakes
| Educational Attainment | Married | Unmarried |
| Less than High School | 0 (0.0%) | 0 (0.0%) |
| High School Diploma | 0 (0.0%) | 0 (0.0%) |
| College or Associate's Degree | 0 (0.0%) | 0 (0.0%) |
| Bachelor's Degree | 0 (0.0%) | 0 (0.0%) |
| Graduate Degree | 0 (0.0%) | 0 (0.0%) |
| Total | 0 (0.0%) | 0 (0.0%) |
Employment Characteristics in Harding Birch Lakes
Employment by Class of Employer in Harding Birch Lakes
Among the 99 employed individuals in Harding Birch Lakes, private company employees (69 | 69.7%), local government employees (19 | 19.2%), and not-for-profit organizations (6 | 6.1%) make up the most common classes of employment.
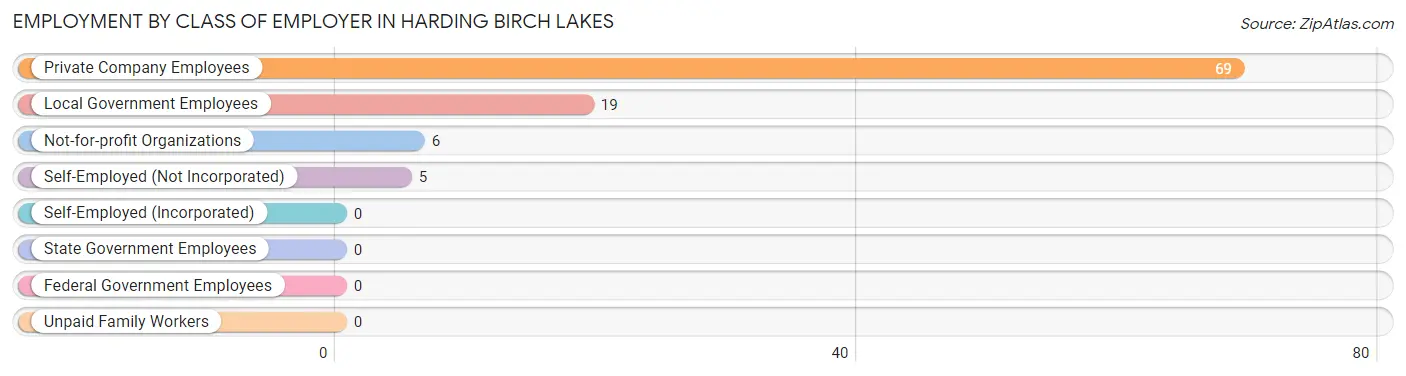
| Employer Class | # Employees | % Employees |
| Private Company Employees | 69 | 69.7% |
| Self-Employed (Incorporated) | 0 | 0.0% |
| Self-Employed (Not Incorporated) | 5 | 5.1% |
| Not-for-profit Organizations | 6 | 6.1% |
| Local Government Employees | 19 | 19.2% |
| State Government Employees | 0 | 0.0% |
| Federal Government Employees | 0 | 0.0% |
| Unpaid Family Workers | 0 | 0.0% |
| Total | 99 | 100.0% |
Employment Status by Age in Harding Birch Lakes
According to the labor force statistics for Harding Birch Lakes, out of the total population over 16 years of age (280), 37.1% or 104 individuals are in the labor force, with 4.8% or 5 of them unemployed. The age group with the highest labor force participation rate is 16 to 19 years, with 100.0% or 5 individuals in the labor force. Within the labor force, the 16 to 19 years age range has the highest percentage of unemployed individuals, with 100.0% or 5 of them being unemployed.
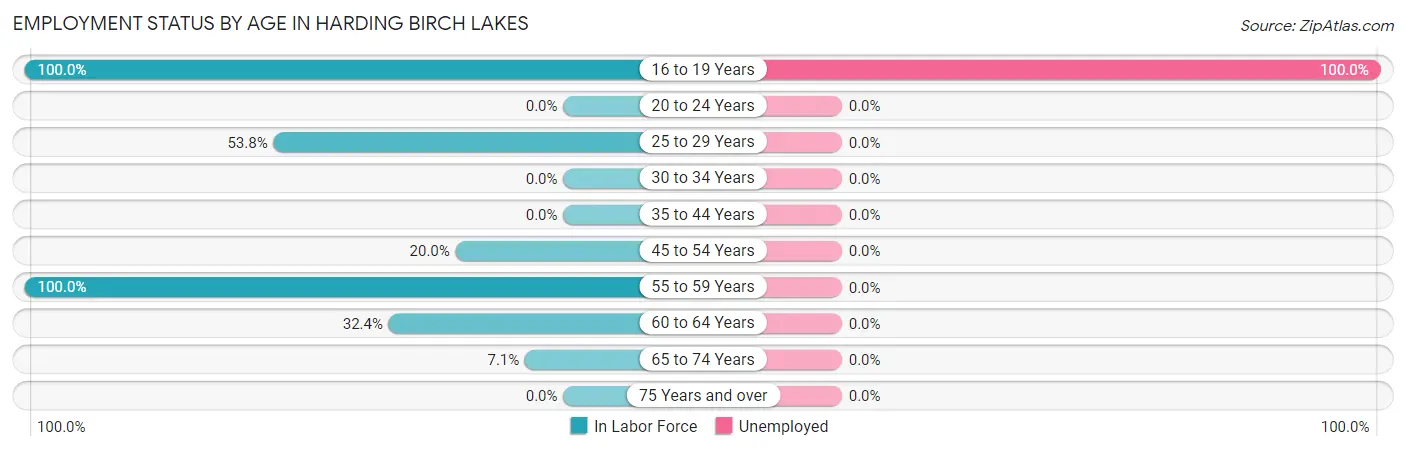
| Age Bracket | In Labor Force | Unemployed |
| 16 to 19 Years | 5 (100.0%) | 5 (100.0%) |
| 20 to 24 Years | 0 (0.0%) | 0 (0.0%) |
| 25 to 29 Years | 7 (53.8%) | 0 (0.0%) |
| 30 to 34 Years | 0 (0.0%) | 0 (0.0%) |
| 35 to 44 Years | 0 (0.0%) | 0 (0.0%) |
| 45 to 54 Years | 14 (20.0%) | 0 (0.0%) |
| 55 to 59 Years | 62 (100.0%) | 0 (0.0%) |
| 60 to 64 Years | 11 (32.4%) | 0 (0.0%) |
| 65 to 74 Years | 5 (7.1%) | 0 (0.0%) |
| 75 Years and over | 0 (0.0%) | 0 (0.0%) |
| Total | 104 (37.1%) | 5 (4.8%) |
Employment Status by Educational Attainment in Harding Birch Lakes
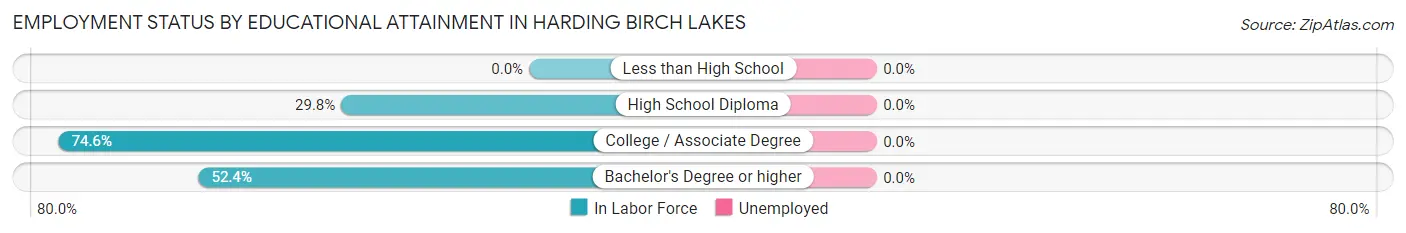
| Educational Attainment | In Labor Force | Unemployed |
| Less than High School | 0 (0.0%) | 0 (0.0%) |
| High School Diploma | 36 (29.8%) | 0 (0.0%) |
| College / Associate Degree | 47 (74.6%) | 0 (0.0%) |
| Bachelor's Degree or higher | 11 (52.4%) | 0 (0.0%) |
| Total | 94 (45.9%) | 0 (0.0%) |
Employment Occupations by Sex in Harding Birch Lakes
Management, Business, Science and Arts Occupations
The most common Management, Business, Science and Arts occupations in Harding Birch Lakes are Community & Social Service (19 | 19.2%), Education Instruction & Library (19 | 19.2%), and Management (11 | 11.1%).
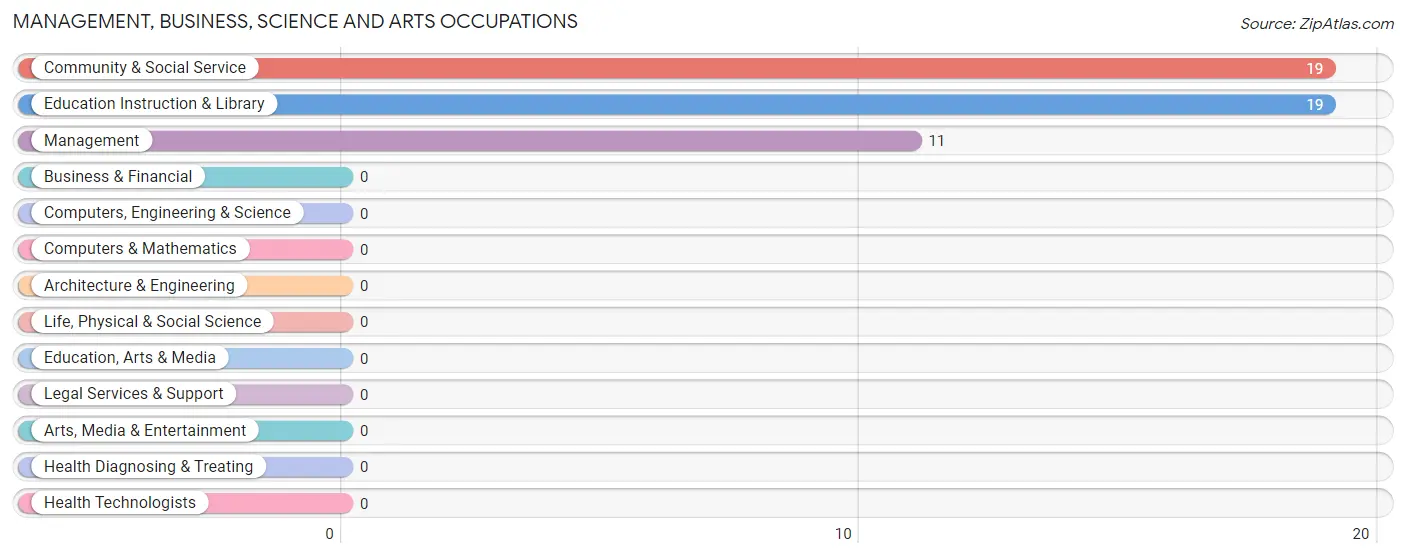
Management, Business, Science and Arts Occupations by Sex
Within the Management, Business, Science and Arts occupations in Harding Birch Lakes, the most male-oriented occupations are Management (100.0%), Community & Social Service (73.7%), and Education Instruction & Library (73.7%), while the most female-oriented occupations are Community & Social Service (26.3%), and Education Instruction & Library (26.3%).
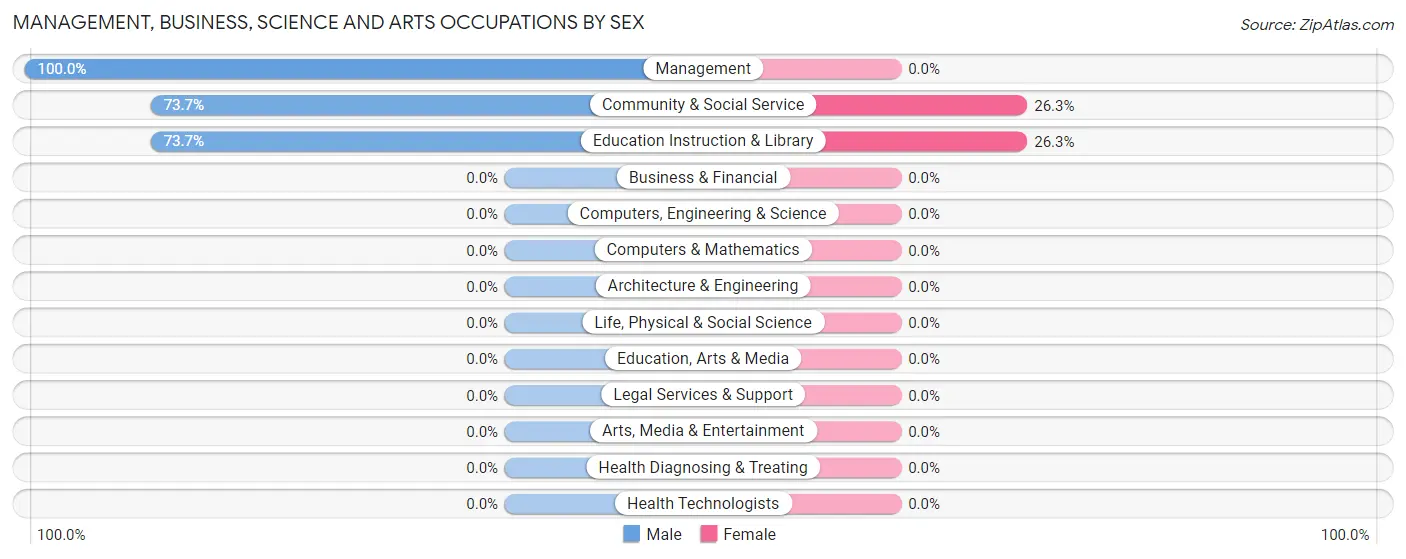
| Occupation | Male | Female |
| Management | 11 (100.0%) | 0 (0.0%) |
| Business & Financial | 0 (0.0%) | 0 (0.0%) |
| Computers, Engineering & Science | 0 (0.0%) | 0 (0.0%) |
| Computers & Mathematics | 0 (0.0%) | 0 (0.0%) |
| Architecture & Engineering | 0 (0.0%) | 0 (0.0%) |
| Life, Physical & Social Science | 0 (0.0%) | 0 (0.0%) |
| Community & Social Service | 14 (73.7%) | 5 (26.3%) |
| Education, Arts & Media | 0 (0.0%) | 0 (0.0%) |
| Legal Services & Support | 0 (0.0%) | 0 (0.0%) |
| Education Instruction & Library | 14 (73.7%) | 5 (26.3%) |
| Arts, Media & Entertainment | 0 (0.0%) | 0 (0.0%) |
| Health Diagnosing & Treating | 0 (0.0%) | 0 (0.0%) |
| Health Technologists | 0 (0.0%) | 0 (0.0%) |
| Total (Category) | 25 (83.3%) | 5 (16.7%) |
| Total (Overall) | 41 (41.4%) | 58 (58.6%) |
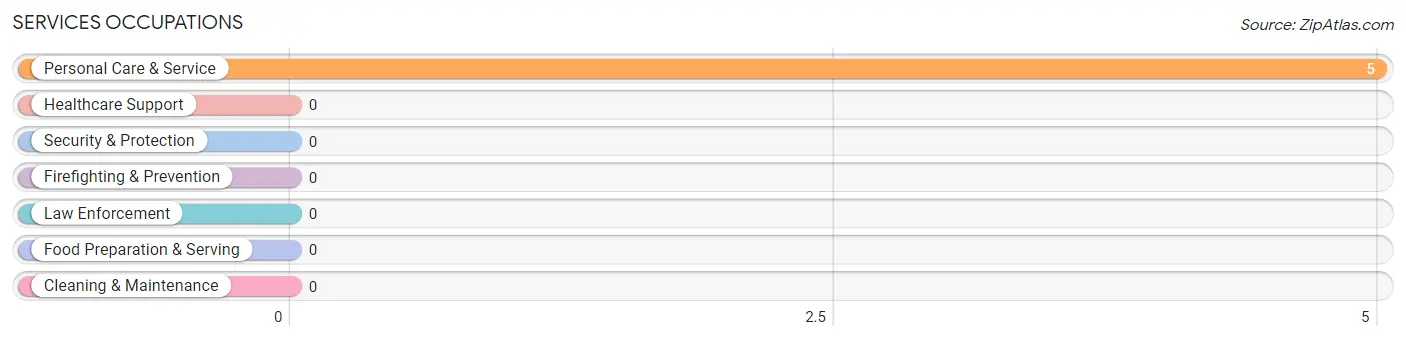
Services Occupations
The most common Services occupations in Harding Birch Lakes are , and Personal Care & Service (5 | 5.1%).
Services Occupations by Sex
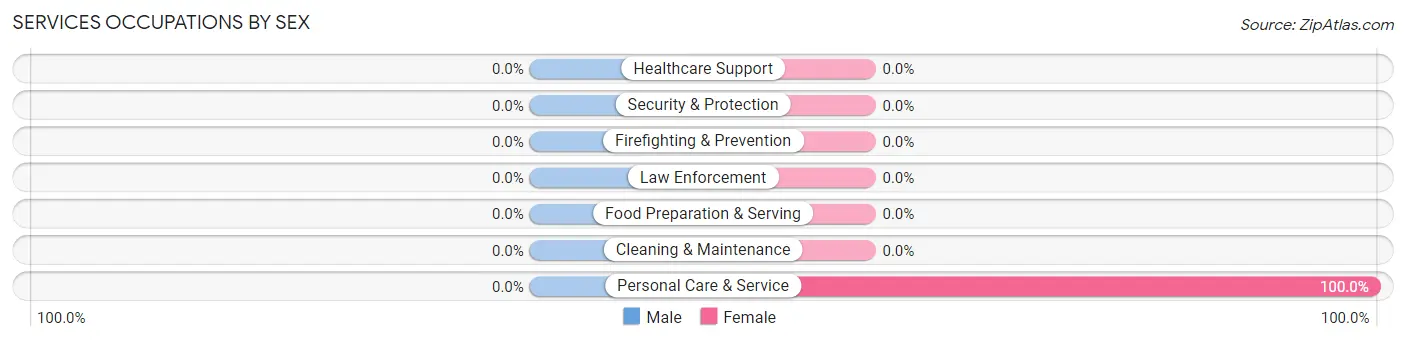
| Occupation | Male | Female |
| Healthcare Support | 0 (0.0%) | 0 (0.0%) |
| Security & Protection | 0 (0.0%) | 0 (0.0%) |
| Firefighting & Prevention | 0 (0.0%) | 0 (0.0%) |
| Law Enforcement | 0 (0.0%) | 0 (0.0%) |
| Food Preparation & Serving | 0 (0.0%) | 0 (0.0%) |
| Cleaning & Maintenance | 0 (0.0%) | 0 (0.0%) |
| Personal Care & Service | 0 (0.0%) | 5 (100.0%) |
| Total (Category) | 0 (0.0%) | 5 (100.0%) |
| Total (Overall) | 41 (41.4%) | 58 (58.6%) |
Sales and Office Occupations
The most common Sales and Office occupations in Harding Birch Lakes are , and Office & Administration (48 | 48.5%).
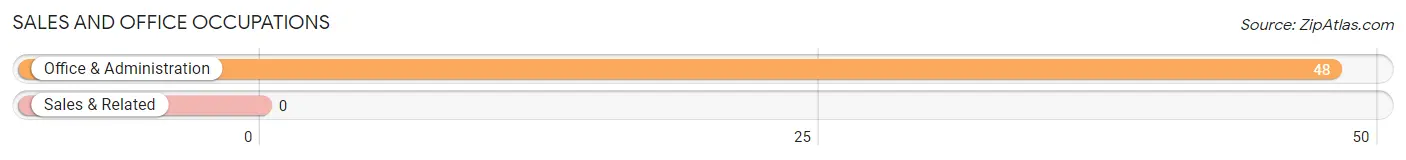
Sales and Office Occupations by Sex
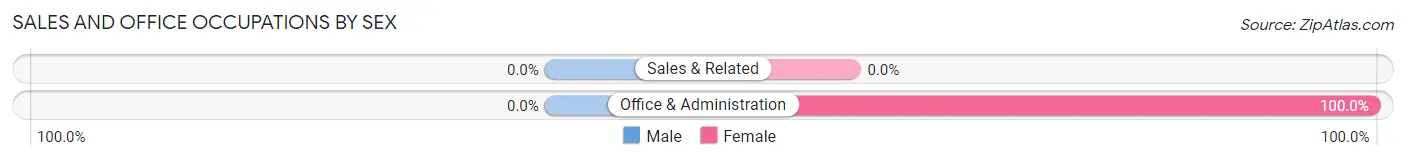
| Occupation | Male | Female |
| Sales & Related | 0 (0.0%) | 0 (0.0%) |
| Office & Administration | 0 (0.0%) | 48 (100.0%) |
| Total (Category) | 0 (0.0%) | 48 (100.0%) |
| Total (Overall) | 41 (41.4%) | 58 (58.6%) |
Natural Resources, Construction and Maintenance Occupations
The most common Natural Resources, Construction and Maintenance occupations in Harding Birch Lakes are , and Installation, Maintenance & Repair (16 | 16.2%).
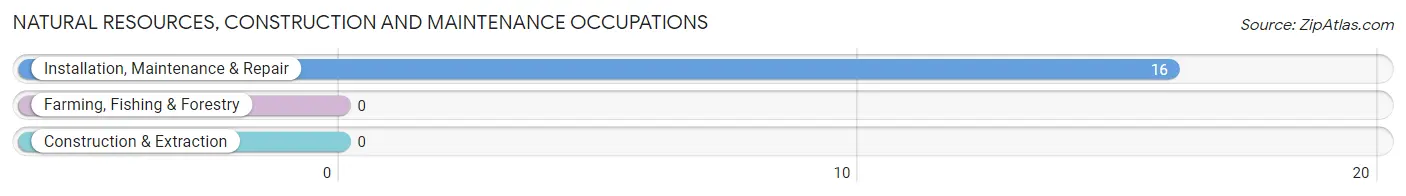
Natural Resources, Construction and Maintenance Occupations by Sex
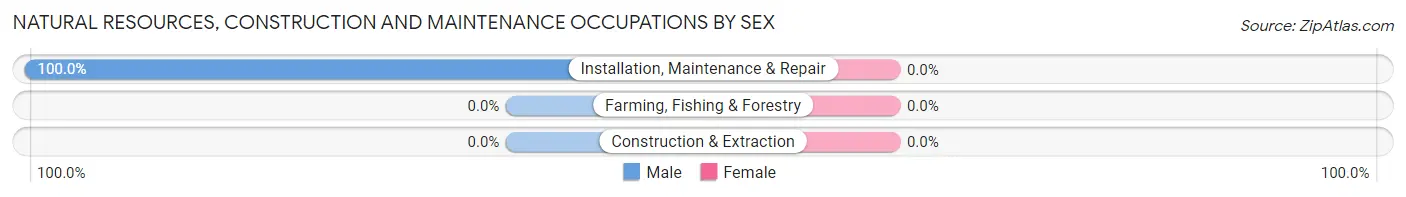
| Occupation | Male | Female |
| Farming, Fishing & Forestry | 0 (0.0%) | 0 (0.0%) |
| Construction & Extraction | 0 (0.0%) | 0 (0.0%) |
| Installation, Maintenance & Repair | 16 (100.0%) | 0 (0.0%) |
| Total (Category) | 16 (100.0%) | 0 (0.0%) |
| Total (Overall) | 41 (41.4%) | 58 (58.6%) |
Production, Transportation and Moving Occupations
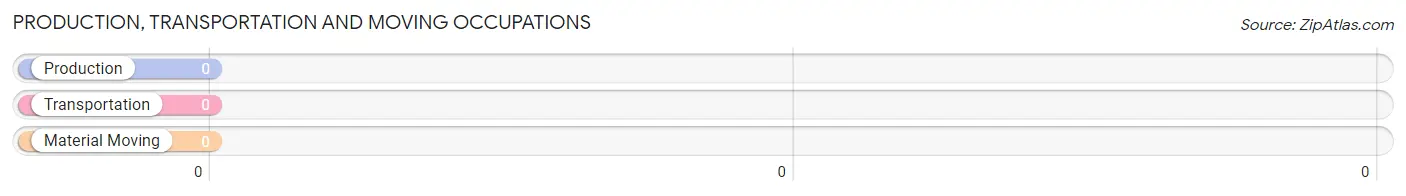
Production, Transportation and Moving Occupations by Sex
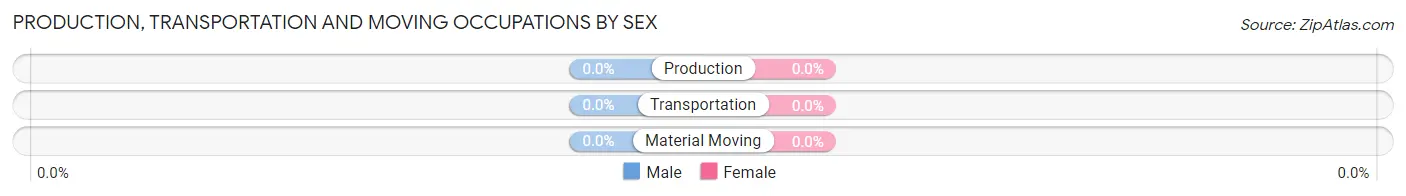
| Occupation | Male | Female |
| Production | 0 (0.0%) | 0 (0.0%) |
| Transportation | 0 (0.0%) | 0 (0.0%) |
| Material Moving | 0 (0.0%) | 0 (0.0%) |
| Total (Category) | 0 (0.0%) | 0 (0.0%) |
| Total (Overall) | 41 (41.4%) | 58 (58.6%) |
Employment Industries by Sex in Harding Birch Lakes
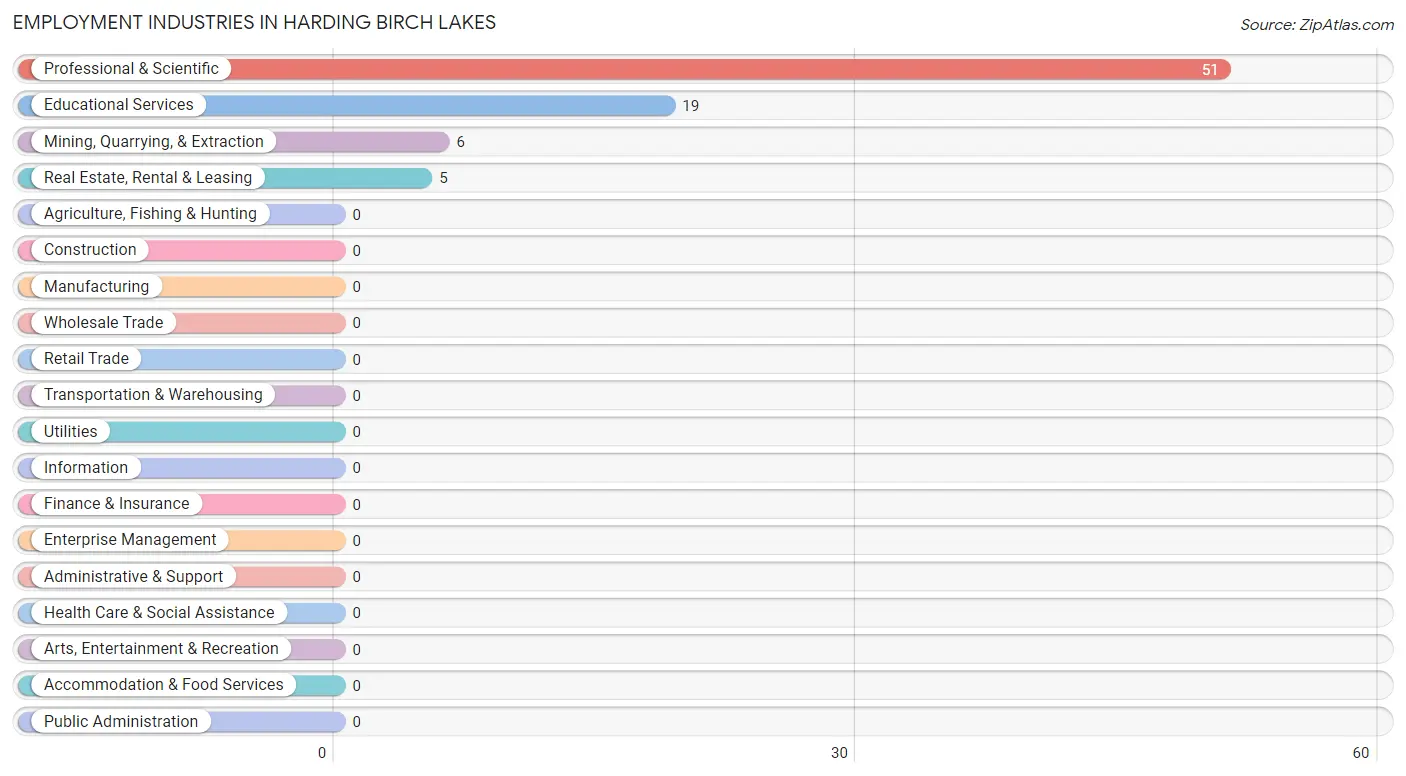
Employment Industries in Harding Birch Lakes
The major employment industries in Harding Birch Lakes include Professional & Scientific (51 | 51.5%), Educational Services (19 | 19.2%), Mining, Quarrying, & Extraction (6 | 6.1%), and Real Estate, Rental & Leasing (5 | 5.1%).
Employment Industries by Sex in Harding Birch Lakes
The Harding Birch Lakes industries that see more men than women are Real Estate, Rental & Leasing (100.0%), Educational Services (73.7%), and Professional & Scientific (17.6%), whereas the industries that tend to have a higher number of women are Mining, Quarrying, & Extraction (100.0%), Professional & Scientific (82.4%), and Educational Services (26.3%).
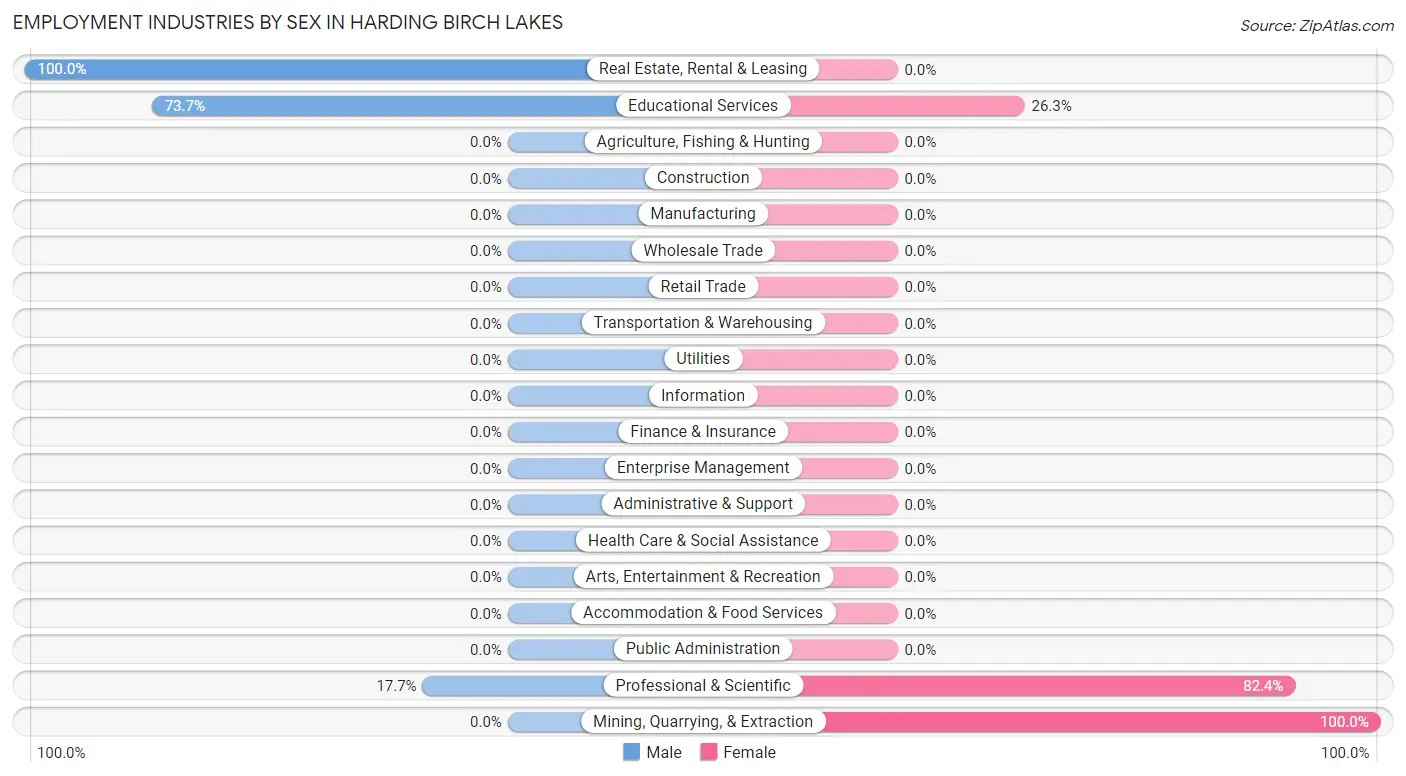
| Industry | Male | Female |
| Agriculture, Fishing & Hunting | 0 (0.0%) | 0 (0.0%) |
| Mining, Quarrying, & Extraction | 0 (0.0%) | 6 (100.0%) |
| Construction | 0 (0.0%) | 0 (0.0%) |
| Manufacturing | 0 (0.0%) | 0 (0.0%) |
| Wholesale Trade | 0 (0.0%) | 0 (0.0%) |
| Retail Trade | 0 (0.0%) | 0 (0.0%) |
| Transportation & Warehousing | 0 (0.0%) | 0 (0.0%) |
| Utilities | 0 (0.0%) | 0 (0.0%) |
| Information | 0 (0.0%) | 0 (0.0%) |
| Finance & Insurance | 0 (0.0%) | 0 (0.0%) |
| Real Estate, Rental & Leasing | 5 (100.0%) | 0 (0.0%) |
| Professional & Scientific | 9 (17.6%) | 42 (82.4%) |
| Enterprise Management | 0 (0.0%) | 0 (0.0%) |
| Administrative & Support | 0 (0.0%) | 0 (0.0%) |
| Educational Services | 14 (73.7%) | 5 (26.3%) |
| Health Care & Social Assistance | 0 (0.0%) | 0 (0.0%) |
| Arts, Entertainment & Recreation | 0 (0.0%) | 0 (0.0%) |
| Accommodation & Food Services | 0 (0.0%) | 0 (0.0%) |
| Public Administration | 0 (0.0%) | 0 (0.0%) |
| Total | 41 (41.4%) | 58 (58.6%) |
Education in Harding Birch Lakes
School Enrollment in Harding Birch Lakes
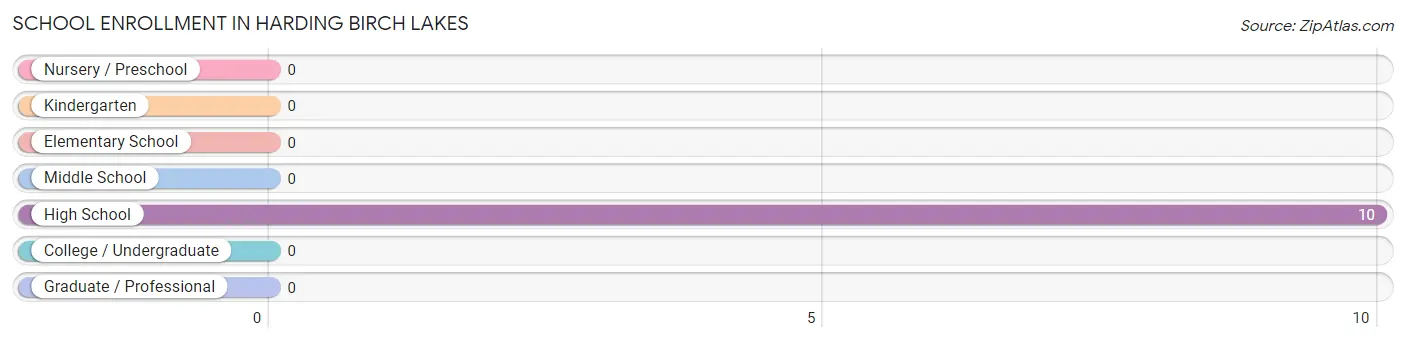
| School Level | # Students | % Students |
| Nursery / Preschool | 0 | 0.0% |
| Kindergarten | 0 | 0.0% |
| Elementary School | 0 | 0.0% |
| Middle School | 0 | 0.0% |
| High School | 10 | 100.0% |
| College / Undergraduate | 0 | 0.0% |
| Graduate / Professional | 0 | 0.0% |
| Total | 10 | 100.0% |
School Enrollment by Age by Funding Source in Harding Birch Lakes
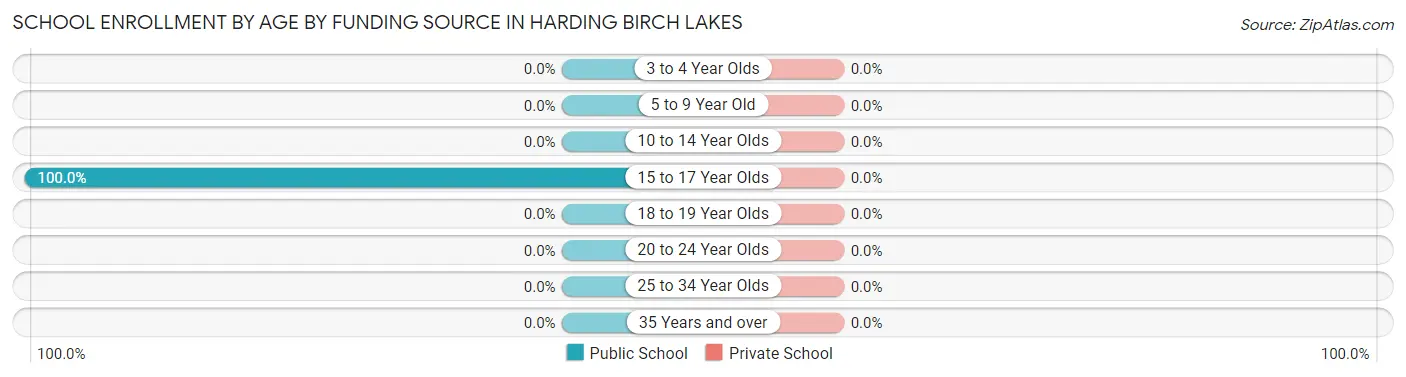
| Age Bracket | Public School | Private School |
| 3 to 4 Year Olds | 0 (0.0%) | 0 (0.0%) |
| 5 to 9 Year Old | 0 (0.0%) | 0 (0.0%) |
| 10 to 14 Year Olds | 0 (0.0%) | 0 (0.0%) |
| 15 to 17 Year Olds | 10 (100.0%) | 0 (0.0%) |
| 18 to 19 Year Olds | 0 (0.0%) | 0 (0.0%) |
| 20 to 24 Year Olds | 0 (0.0%) | 0 (0.0%) |
| 25 to 34 Year Olds | 0 (0.0%) | 0 (0.0%) |
| 35 Years and over | 0 (0.0%) | 0 (0.0%) |
| Total | 10 (100.0%) | 0 (0.0%) |
Educational Attainment by Field of Study in Harding Birch Lakes
Bio, nature & agricultural (36 | 42.9%), business (27 | 32.1%), education (6 | 7.1%), arts & humanities (6 | 7.1%), and physical & health sciences (5 | 5.9%) are the most common fields of study among 84 individuals in Harding Birch Lakes who have obtained a bachelor's degree or higher.
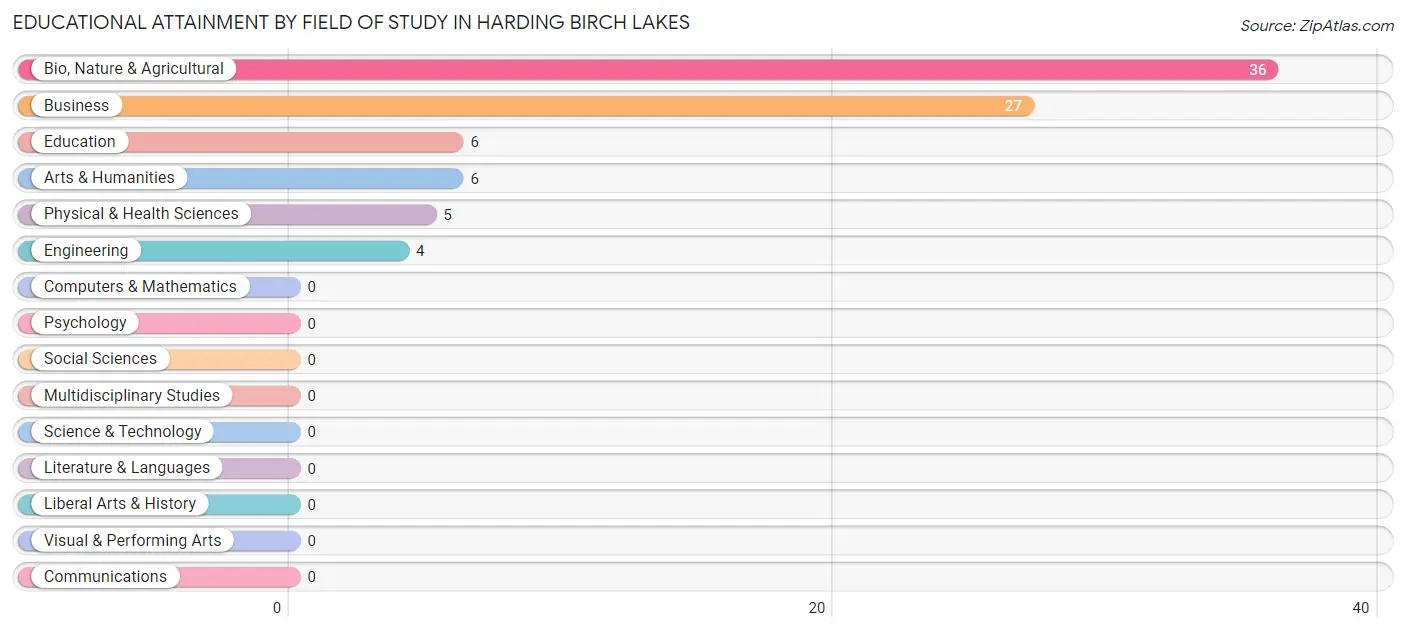
| Field of Study | # Graduates | % Graduates |
| Computers & Mathematics | 0 | 0.0% |
| Bio, Nature & Agricultural | 36 | 42.9% |
| Physical & Health Sciences | 5 | 5.9% |
| Psychology | 0 | 0.0% |
| Social Sciences | 0 | 0.0% |
| Engineering | 4 | 4.8% |
| Multidisciplinary Studies | 0 | 0.0% |
| Science & Technology | 0 | 0.0% |
| Business | 27 | 32.1% |
| Education | 6 | 7.1% |
| Literature & Languages | 0 | 0.0% |
| Liberal Arts & History | 0 | 0.0% |
| Visual & Performing Arts | 0 | 0.0% |
| Communications | 0 | 0.0% |
| Arts & Humanities | 6 | 7.1% |
| Total | 84 | 100.0% |
Transportation & Commute in Harding Birch Lakes
Vehicle Availability by Sex in Harding Birch Lakes
The most prevalent vehicle ownership categories in Harding Birch Lakes are males with 1 vehicle (14, accounting for 34.2%) and females with 1 vehicle (0, making up 24.1%).
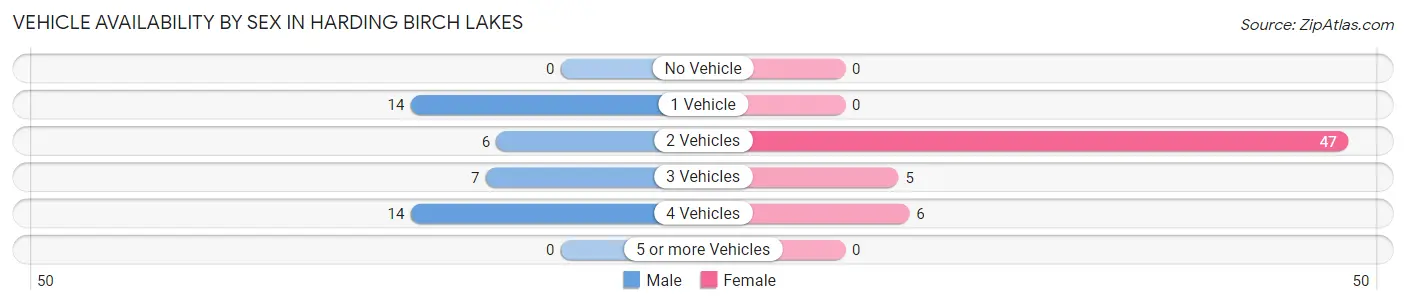
| Vehicles Available | Male | Female |
| No Vehicle | 0 (0.0%) | 0 (0.0%) |
| 1 Vehicle | 14 (34.2%) | 0 (0.0%) |
| 2 Vehicles | 6 (14.6%) | 47 (81.0%) |
| 3 Vehicles | 7 (17.1%) | 5 (8.6%) |
| 4 Vehicles | 14 (34.2%) | 6 (10.3%) |
| 5 or more Vehicles | 0 (0.0%) | 0 (0.0%) |
| Total | 41 (100.0%) | 58 (100.0%) |
Commute Time in Harding Birch Lakes
The most frequently occuring commute durations in Harding Birch Lakes are 60 to 89 minutes (42 commuters, 42.4%), 45 to 59 minutes (30 commuters, 30.3%), and less than 5 minutes (6 commuters, 6.1%).
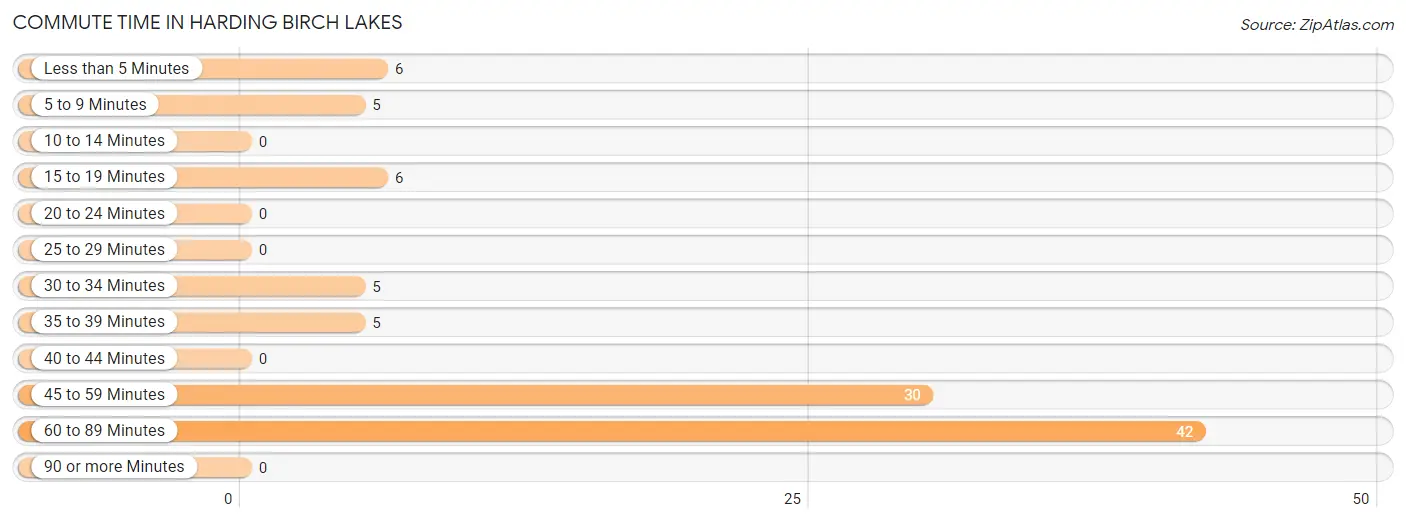
| Commute Time | # Commuters | % Commuters |
| Less than 5 Minutes | 6 | 6.1% |
| 5 to 9 Minutes | 5 | 5.1% |
| 10 to 14 Minutes | 0 | 0.0% |
| 15 to 19 Minutes | 6 | 6.1% |
| 20 to 24 Minutes | 0 | 0.0% |
| 25 to 29 Minutes | 0 | 0.0% |
| 30 to 34 Minutes | 5 | 5.1% |
| 35 to 39 Minutes | 5 | 5.1% |
| 40 to 44 Minutes | 0 | 0.0% |
| 45 to 59 Minutes | 30 | 30.3% |
| 60 to 89 Minutes | 42 | 42.4% |
| 90 or more Minutes | 0 | 0.0% |
Commute Time by Sex in Harding Birch Lakes
The most common commute times in Harding Birch Lakes are 45 to 59 minutes (30 commuters, 73.2%) for males and 60 to 89 minutes (42 commuters, 72.4%) for females.
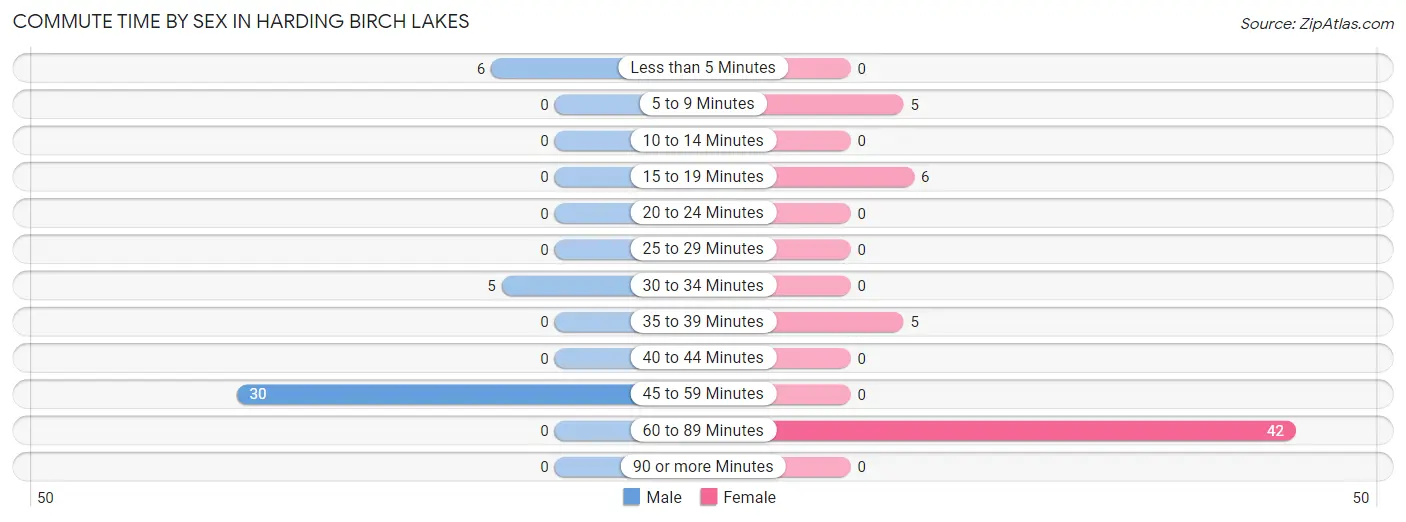
| Commute Time | Male | Female |
| Less than 5 Minutes | 6 (14.6%) | 0 (0.0%) |
| 5 to 9 Minutes | 0 (0.0%) | 5 (8.6%) |
| 10 to 14 Minutes | 0 (0.0%) | 0 (0.0%) |
| 15 to 19 Minutes | 0 (0.0%) | 6 (10.3%) |
| 20 to 24 Minutes | 0 (0.0%) | 0 (0.0%) |
| 25 to 29 Minutes | 0 (0.0%) | 0 (0.0%) |
| 30 to 34 Minutes | 5 (12.2%) | 0 (0.0%) |
| 35 to 39 Minutes | 0 (0.0%) | 5 (8.6%) |
| 40 to 44 Minutes | 0 (0.0%) | 0 (0.0%) |
| 45 to 59 Minutes | 30 (73.2%) | 0 (0.0%) |
| 60 to 89 Minutes | 0 (0.0%) | 42 (72.4%) |
| 90 or more Minutes | 0 (0.0%) | 0 (0.0%) |
Time of Departure to Work by Sex in Harding Birch Lakes
The most frequent times of departure to work in Harding Birch Lakes are 6:30 AM to 6:59 AM (30, 73.2%) for males and 7:30 AM to 7:59 AM (42, 72.4%) for females.
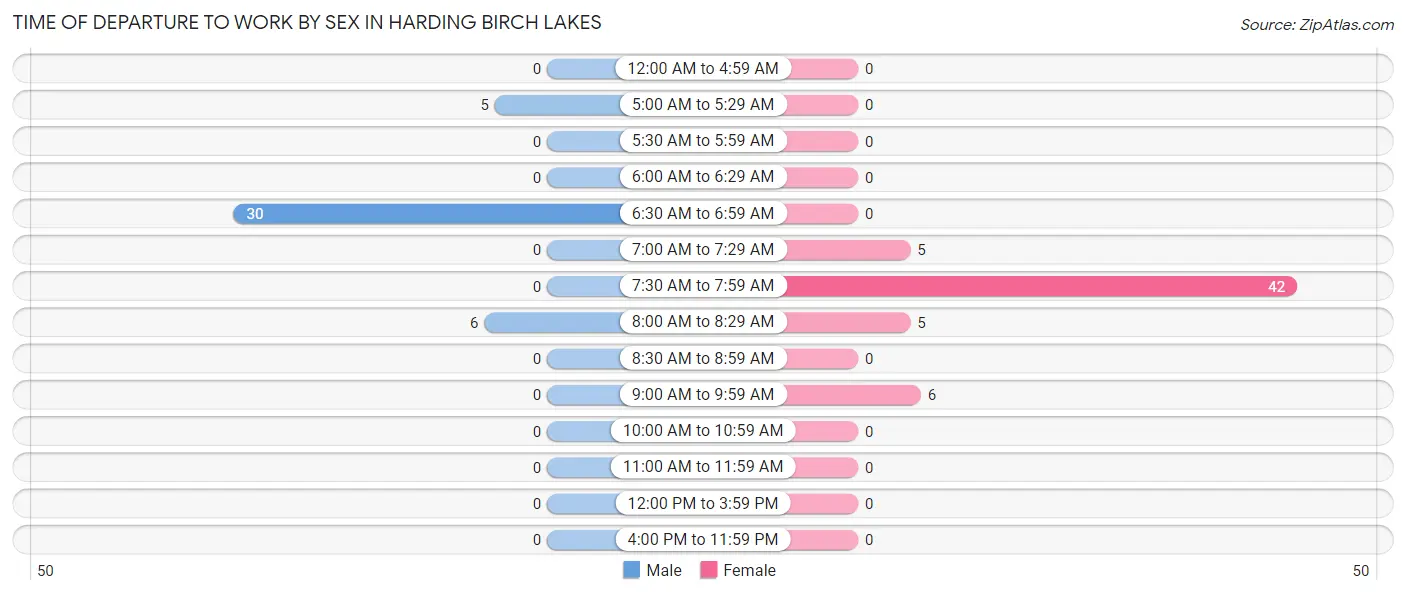
| Time of Departure | Male | Female |
| 12:00 AM to 4:59 AM | 0 (0.0%) | 0 (0.0%) |
| 5:00 AM to 5:29 AM | 5 (12.2%) | 0 (0.0%) |
| 5:30 AM to 5:59 AM | 0 (0.0%) | 0 (0.0%) |
| 6:00 AM to 6:29 AM | 0 (0.0%) | 0 (0.0%) |
| 6:30 AM to 6:59 AM | 30 (73.2%) | 0 (0.0%) |
| 7:00 AM to 7:29 AM | 0 (0.0%) | 5 (8.6%) |
| 7:30 AM to 7:59 AM | 0 (0.0%) | 42 (72.4%) |
| 8:00 AM to 8:29 AM | 6 (14.6%) | 5 (8.6%) |
| 8:30 AM to 8:59 AM | 0 (0.0%) | 0 (0.0%) |
| 9:00 AM to 9:59 AM | 0 (0.0%) | 6 (10.3%) |
| 10:00 AM to 10:59 AM | 0 (0.0%) | 0 (0.0%) |
| 11:00 AM to 11:59 AM | 0 (0.0%) | 0 (0.0%) |
| 12:00 PM to 3:59 PM | 0 (0.0%) | 0 (0.0%) |
| 4:00 PM to 11:59 PM | 0 (0.0%) | 0 (0.0%) |
| Total | 41 (100.0%) | 58 (100.0%) |
Housing Occupancy in Harding Birch Lakes
Occupancy by Ownership in Harding Birch Lakes
Of the total 115 dwellings in Harding Birch Lakes, owner-occupied units account for 109 (94.8%), while renter-occupied units make up 6 (5.2%).
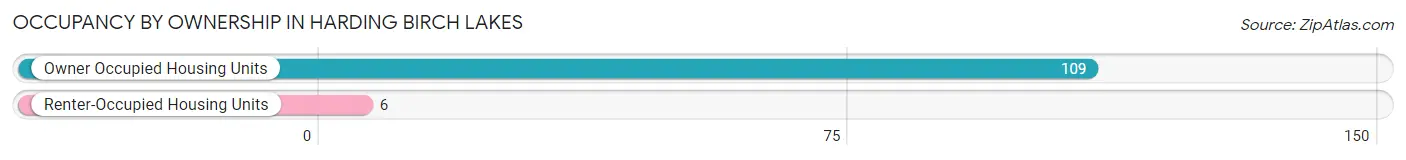
| Occupancy | # Housing Units | % Housing Units |
| Owner Occupied Housing Units | 109 | 94.8% |
| Renter-Occupied Housing Units | 6 | 5.2% |
| Total Occupied Housing Units | 115 | 100.0% |
Occupancy by Household Size in Harding Birch Lakes
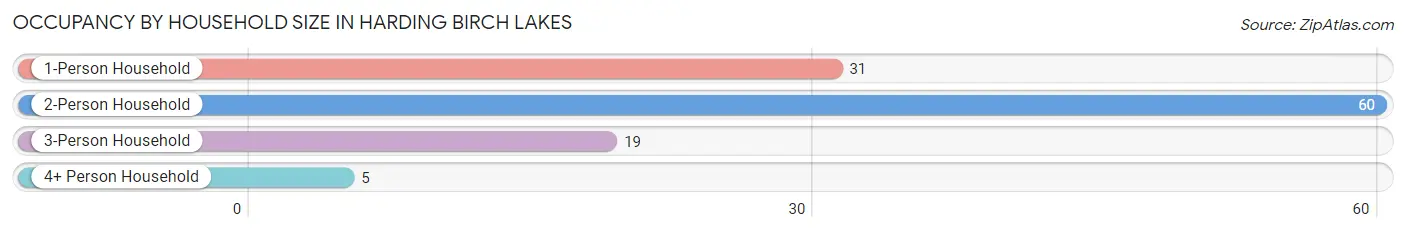
| Household Size | # Housing Units | % Housing Units |
| 1-Person Household | 31 | 27.0% |
| 2-Person Household | 60 | 52.2% |
| 3-Person Household | 19 | 16.5% |
| 4+ Person Household | 5 | 4.3% |
| Total Housing Units | 115 | 100.0% |
Occupancy by Ownership by Household Size in Harding Birch Lakes
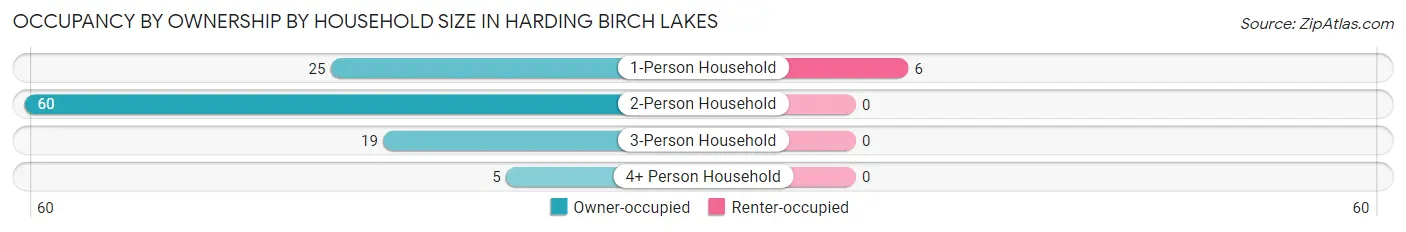
| Household Size | Owner-occupied | Renter-occupied |
| 1-Person Household | 25 (80.6%) | 6 (19.4%) |
| 2-Person Household | 60 (100.0%) | 0 (0.0%) |
| 3-Person Household | 19 (100.0%) | 0 (0.0%) |
| 4+ Person Household | 5 (100.0%) | 0 (0.0%) |
| Total Housing Units | 109 (94.8%) | 6 (5.2%) |
Occupancy by Educational Attainment in Harding Birch Lakes
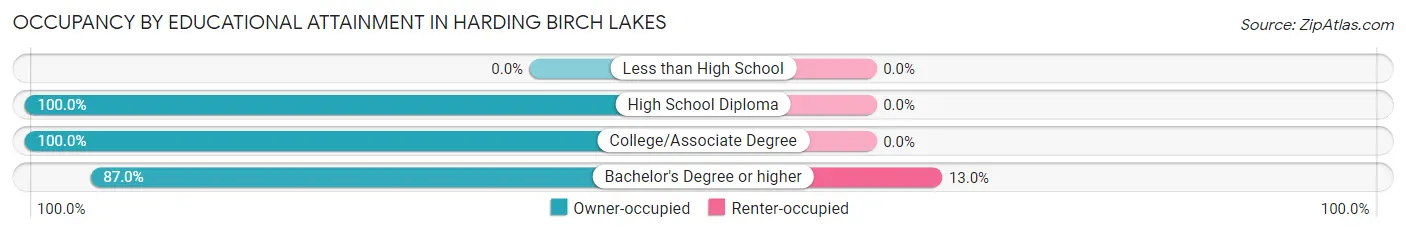
| Household Size | Owner-occupied | Renter-occupied |
| Less than High School | 0 (0.0%) | 0 (0.0%) |
| High School Diploma | 39 (100.0%) | 0 (0.0%) |
| College/Associate Degree | 30 (100.0%) | 0 (0.0%) |
| Bachelor's Degree or higher | 40 (87.0%) | 6 (13.0%) |
Occupancy by Age of Householder in Harding Birch Lakes
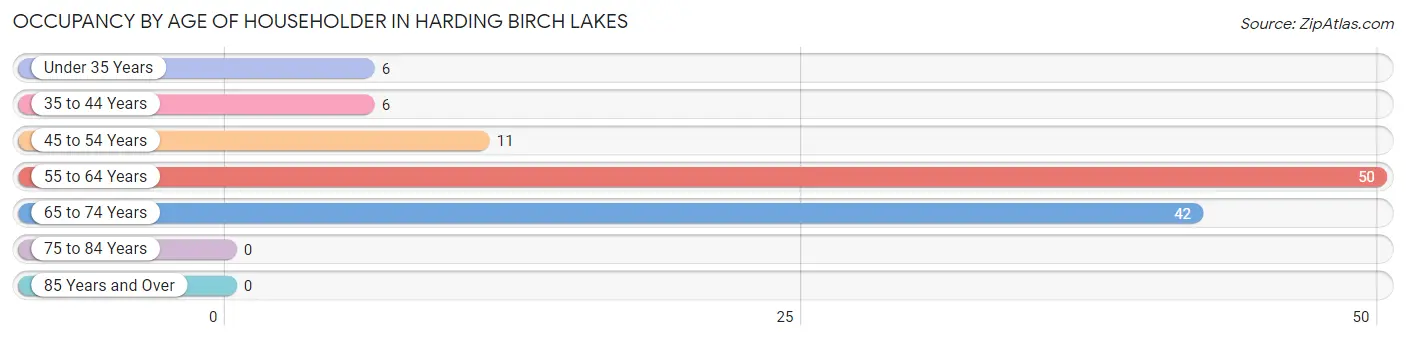
| Age Bracket | # Households | % Households |
| Under 35 Years | 6 | 5.2% |
| 35 to 44 Years | 6 | 5.2% |
| 45 to 54 Years | 11 | 9.6% |
| 55 to 64 Years | 50 | 43.5% |
| 65 to 74 Years | 42 | 36.5% |
| 75 to 84 Years | 0 | 0.0% |
| 85 Years and Over | 0 | 0.0% |
| Total | 115 | 100.0% |
Housing Finances in Harding Birch Lakes
Median Income by Occupancy in Harding Birch Lakes
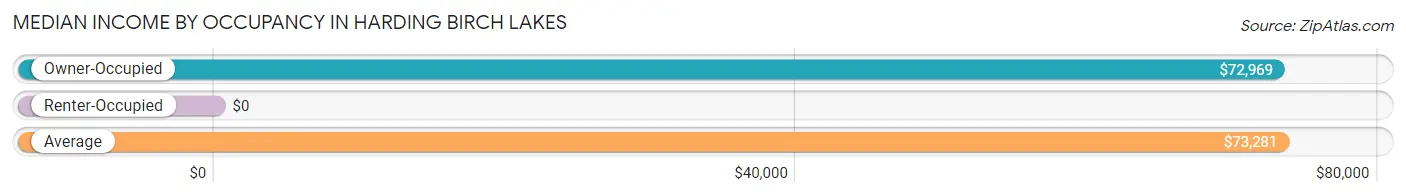
| Occupancy Type | # Households | Median Income |
| Owner-Occupied | 109 (94.8%) | $72,969 |
| Renter-Occupied | 6 (5.2%) | $0 |
| Average | 115 (100.0%) | $73,281 |
Occupancy by Householder Income Bracket in Harding Birch Lakes
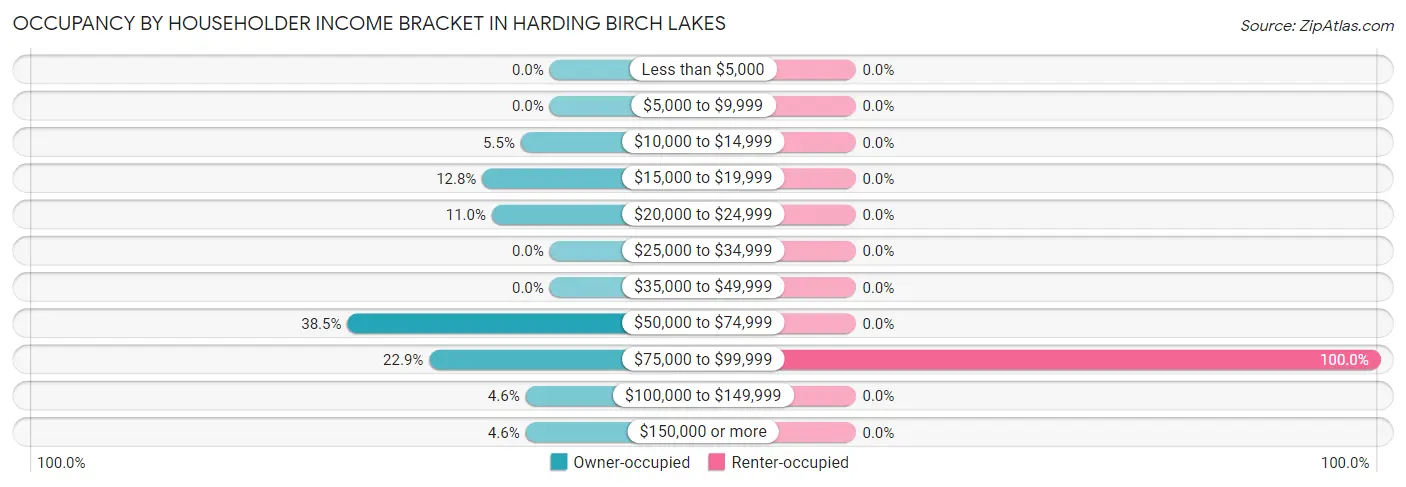
| Income Bracket | Owner-occupied | Renter-occupied |
| Less than $5,000 | 0 (0.0%) | 0 (0.0%) |
| $5,000 to $9,999 | 0 (0.0%) | 0 (0.0%) |
| $10,000 to $14,999 | 6 (5.5%) | 0 (0.0%) |
| $15,000 to $19,999 | 14 (12.8%) | 0 (0.0%) |
| $20,000 to $24,999 | 12 (11.0%) | 0 (0.0%) |
| $25,000 to $34,999 | 0 (0.0%) | 0 (0.0%) |
| $35,000 to $49,999 | 0 (0.0%) | 0 (0.0%) |
| $50,000 to $74,999 | 42 (38.5%) | 0 (0.0%) |
| $75,000 to $99,999 | 25 (22.9%) | 6 (100.0%) |
| $100,000 to $149,999 | 5 (4.6%) | 0 (0.0%) |
| $150,000 or more | 5 (4.6%) | 0 (0.0%) |
| Total | 109 (100.0%) | 6 (100.0%) |
Monthly Housing Cost Tiers in Harding Birch Lakes
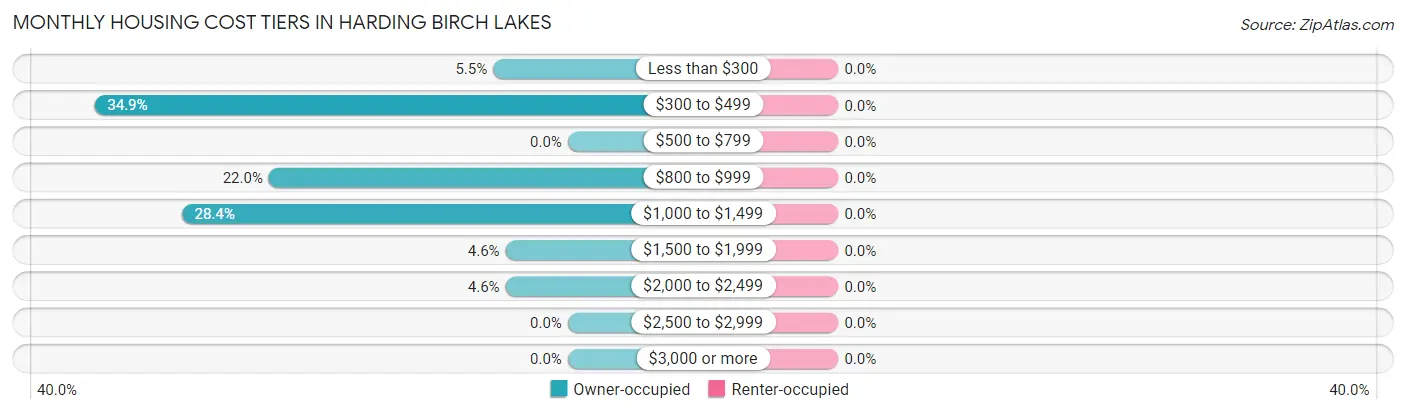
| Monthly Cost | Owner-occupied | Renter-occupied |
| Less than $300 | 6 (5.5%) | 0 (0.0%) |
| $300 to $499 | 38 (34.9%) | 0 (0.0%) |
| $500 to $799 | 0 (0.0%) | 0 (0.0%) |
| $800 to $999 | 24 (22.0%) | 0 (0.0%) |
| $1,000 to $1,499 | 31 (28.4%) | 0 (0.0%) |
| $1,500 to $1,999 | 5 (4.6%) | 0 (0.0%) |
| $2,000 to $2,499 | 5 (4.6%) | 0 (0.0%) |
| $2,500 to $2,999 | 0 (0.0%) | 0 (0.0%) |
| $3,000 or more | 0 (0.0%) | 0 (0.0%) |
| Total | 109 (100.0%) | 6 (100.0%) |
Physical Housing Characteristics in Harding Birch Lakes
Housing Structures in Harding Birch Lakes
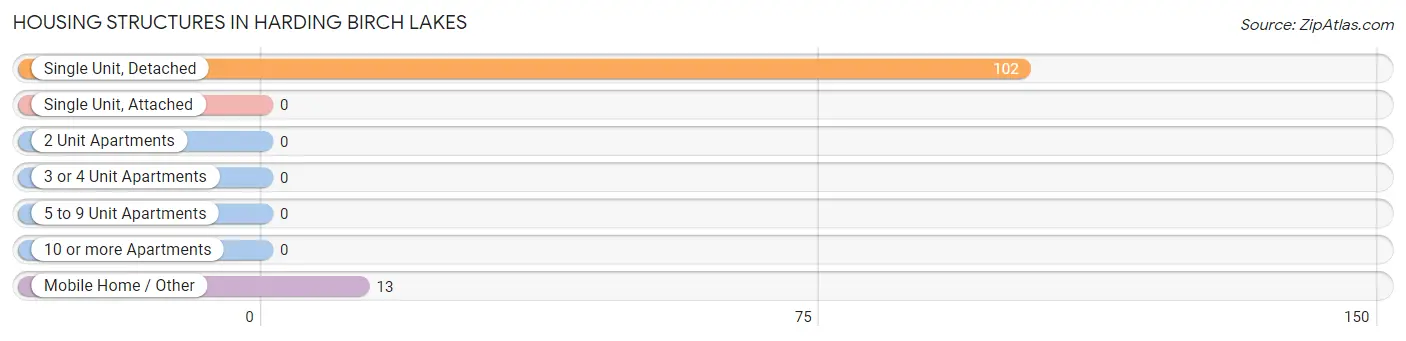
| Structure Type | # Housing Units | % Housing Units |
| Single Unit, Detached | 102 | 88.7% |
| Single Unit, Attached | 0 | 0.0% |
| 2 Unit Apartments | 0 | 0.0% |
| 3 or 4 Unit Apartments | 0 | 0.0% |
| 5 to 9 Unit Apartments | 0 | 0.0% |
| 10 or more Apartments | 0 | 0.0% |
| Mobile Home / Other | 13 | 11.3% |
| Total | 115 | 100.0% |
Housing Structures by Occupancy in Harding Birch Lakes
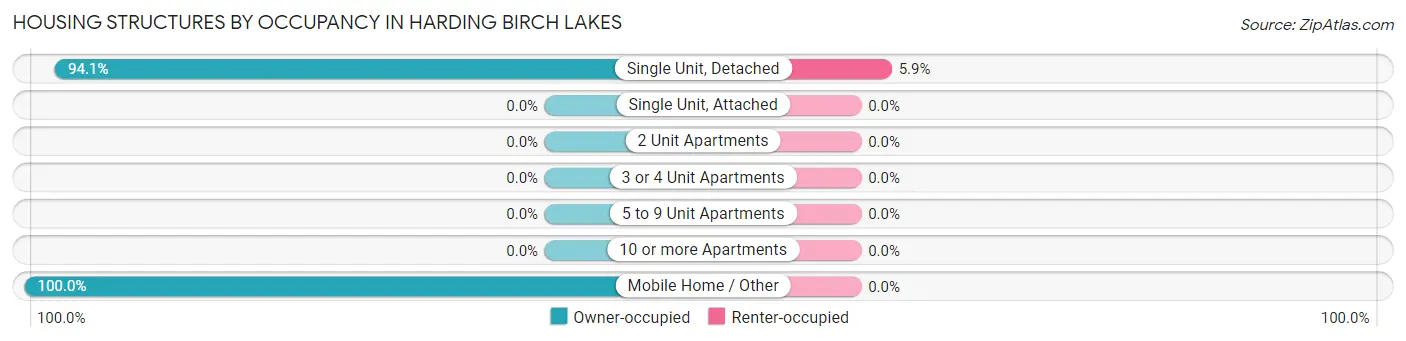
| Structure Type | Owner-occupied | Renter-occupied |
| Single Unit, Detached | 96 (94.1%) | 6 (5.9%) |
| Single Unit, Attached | 0 (0.0%) | 0 (0.0%) |
| 2 Unit Apartments | 0 (0.0%) | 0 (0.0%) |
| 3 or 4 Unit Apartments | 0 (0.0%) | 0 (0.0%) |
| 5 to 9 Unit Apartments | 0 (0.0%) | 0 (0.0%) |
| 10 or more Apartments | 0 (0.0%) | 0 (0.0%) |
| Mobile Home / Other | 13 (100.0%) | 0 (0.0%) |
| Total | 109 (94.8%) | 6 (5.2%) |
Housing Structures by Number of Rooms in Harding Birch Lakes
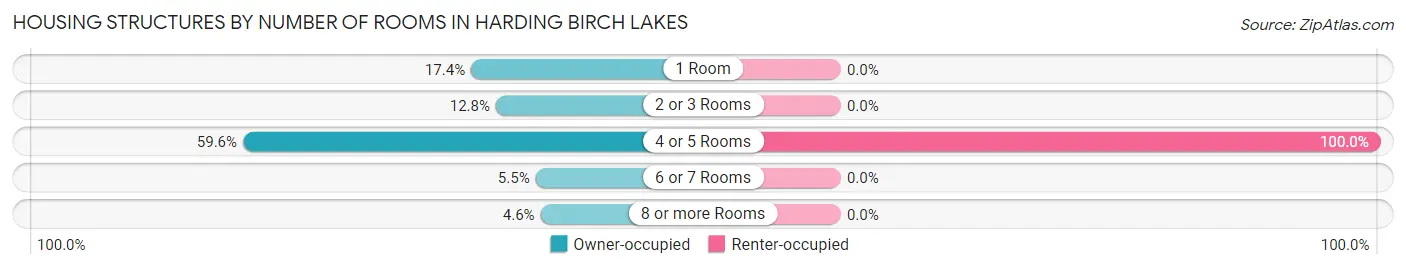
| Number of Rooms | Owner-occupied | Renter-occupied |
| 1 Room | 19 (17.4%) | 0 (0.0%) |
| 2 or 3 Rooms | 14 (12.8%) | 0 (0.0%) |
| 4 or 5 Rooms | 65 (59.6%) | 6 (100.0%) |
| 6 or 7 Rooms | 6 (5.5%) | 0 (0.0%) |
| 8 or more Rooms | 5 (4.6%) | 0 (0.0%) |
| Total | 109 (100.0%) | 6 (100.0%) |
Housing Structure by Heating Type in Harding Birch Lakes
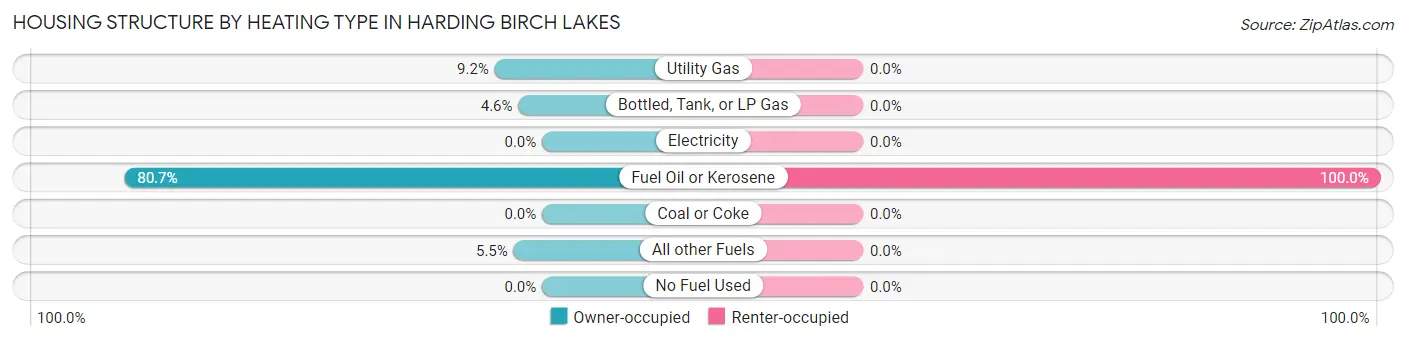
| Heating Type | Owner-occupied | Renter-occupied |
| Utility Gas | 10 (9.2%) | 0 (0.0%) |
| Bottled, Tank, or LP Gas | 5 (4.6%) | 0 (0.0%) |
| Electricity | 0 (0.0%) | 0 (0.0%) |
| Fuel Oil or Kerosene | 88 (80.7%) | 6 (100.0%) |
| Coal or Coke | 0 (0.0%) | 0 (0.0%) |
| All other Fuels | 6 (5.5%) | 0 (0.0%) |
| No Fuel Used | 0 (0.0%) | 0 (0.0%) |
| Total | 109 (100.0%) | 6 (100.0%) |
Household Vehicle Usage in Harding Birch Lakes
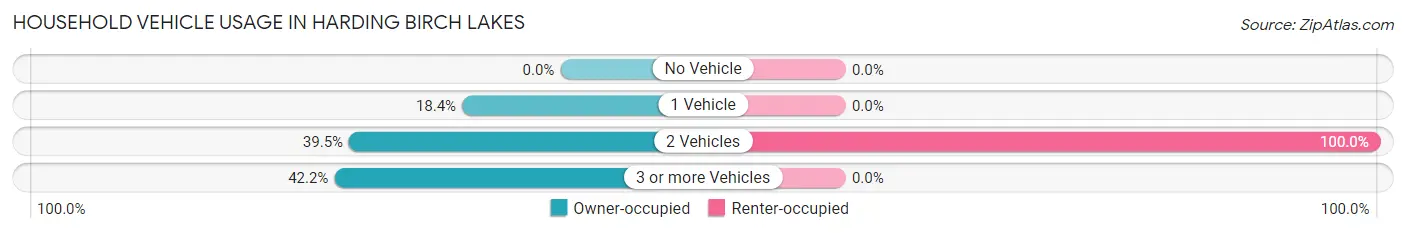
| Vehicles per Household | Owner-occupied | Renter-occupied |
| No Vehicle | 0 (0.0%) | 0 (0.0%) |
| 1 Vehicle | 20 (18.3%) | 0 (0.0%) |
| 2 Vehicles | 43 (39.5%) | 6 (100.0%) |
| 3 or more Vehicles | 46 (42.2%) | 0 (0.0%) |
| Total | 109 (100.0%) | 6 (100.0%) |
Real Estate & Mortgages in Harding Birch Lakes
Real Estate and Mortgage Overview in Harding Birch Lakes
| Characteristic | Without Mortgage | With Mortgage |
| Housing Units | 87 | 22 |
| Median Property Value | - | - |
| Median Household Income | $73,073 | $5 |
| Monthly Housing Costs | - | - |
| Real Estate Taxes | - | - |
Property Value by Mortgage Status in Harding Birch Lakes
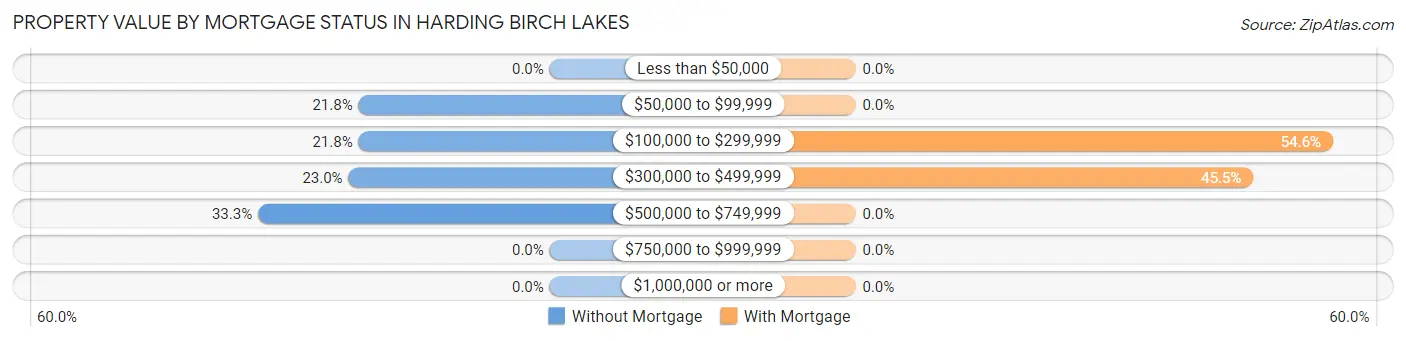
| Property Value | Without Mortgage | With Mortgage |
| Less than $50,000 | 0 (0.0%) | 0 (0.0%) |
| $50,000 to $99,999 | 19 (21.8%) | 0 (0.0%) |
| $100,000 to $299,999 | 19 (21.8%) | 12 (54.5%) |
| $300,000 to $499,999 | 20 (23.0%) | 10 (45.5%) |
| $500,000 to $749,999 | 29 (33.3%) | 0 (0.0%) |
| $750,000 to $999,999 | 0 (0.0%) | 0 (0.0%) |
| $1,000,000 or more | 0 (0.0%) | 0 (0.0%) |
| Total | 87 (100.0%) | 22 (100.0%) |
Household Income by Mortgage Status in Harding Birch Lakes
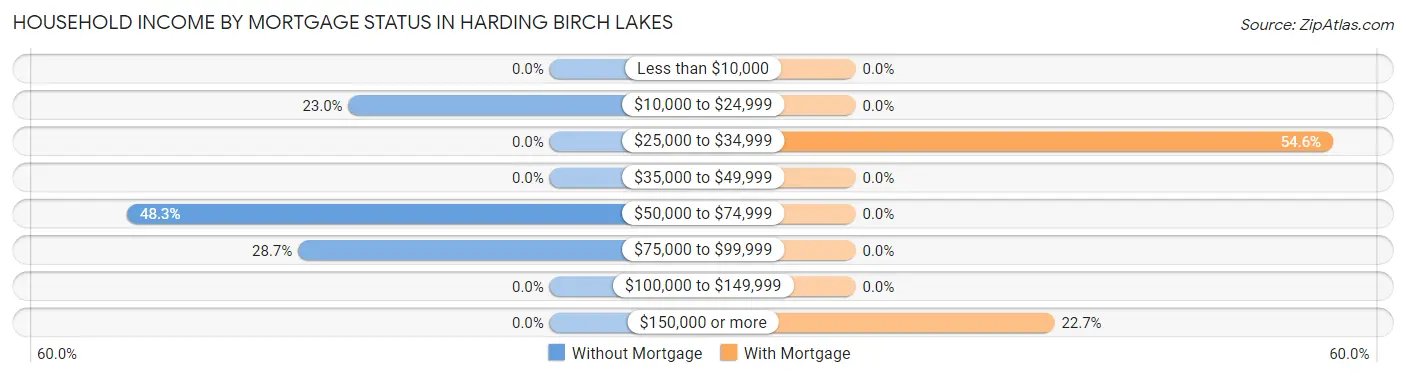
| Household Income | Without Mortgage | With Mortgage |
| Less than $10,000 | 0 (0.0%) | 0 (0.0%) |
| $10,000 to $24,999 | 20 (23.0%) | 0 (0.0%) |
| $25,000 to $34,999 | 0 (0.0%) | 12 (54.5%) |
| $35,000 to $49,999 | 0 (0.0%) | 0 (0.0%) |
| $50,000 to $74,999 | 42 (48.3%) | 0 (0.0%) |
| $75,000 to $99,999 | 25 (28.7%) | 0 (0.0%) |
| $100,000 to $149,999 | 0 (0.0%) | 0 (0.0%) |
| $150,000 or more | 0 (0.0%) | 5 (22.7%) |
| Total | 87 (100.0%) | 22 (100.0%) |
Property Value to Household Income Ratio in Harding Birch Lakes
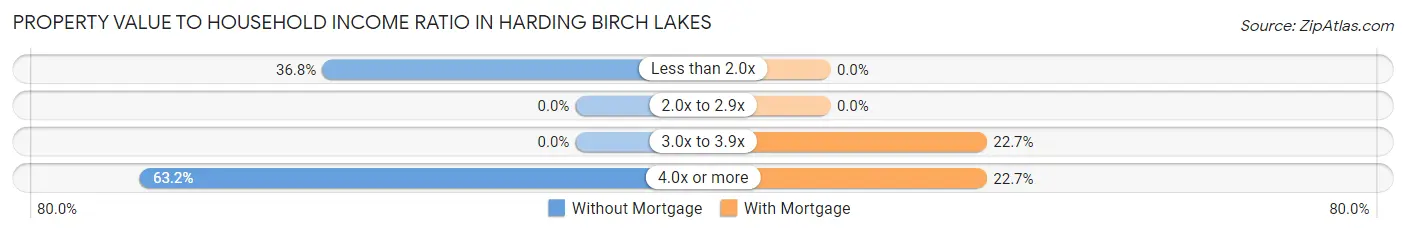
| Value-to-Income Ratio | Without Mortgage | With Mortgage |
| Less than 2.0x | 32 (36.8%) | 0 (0.0%) |
| 2.0x to 2.9x | 0 (0.0%) | 0 (0.0%) |
| 3.0x to 3.9x | 0 (0.0%) | 5 (22.7%) |
| 4.0x or more | 55 (63.2%) | 5 (22.7%) |
| Total | 87 (100.0%) | 22 (100.0%) |
Real Estate Taxes by Mortgage Status in Harding Birch Lakes
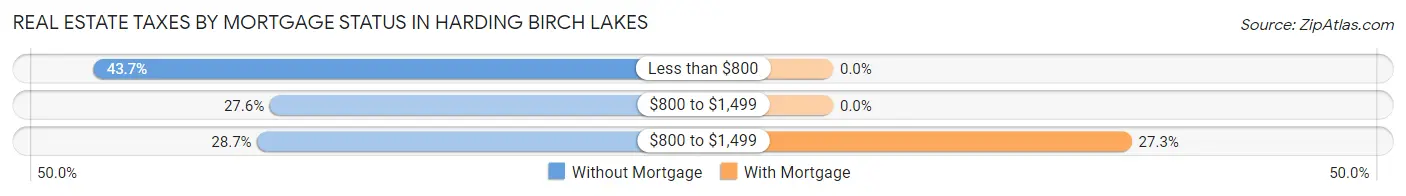
| Property Taxes | Without Mortgage | With Mortgage |
| Less than $800 | 38 (43.7%) | 0 (0.0%) |
| $800 to $1,499 | 24 (27.6%) | 0 (0.0%) |
| $800 to $1,499 | 25 (28.7%) | 6 (27.3%) |
| Total | 87 (100.0%) | 22 (100.0%) |
Health & Disability in Harding Birch Lakes
Health Insurance Coverage by Age in Harding Birch Lakes
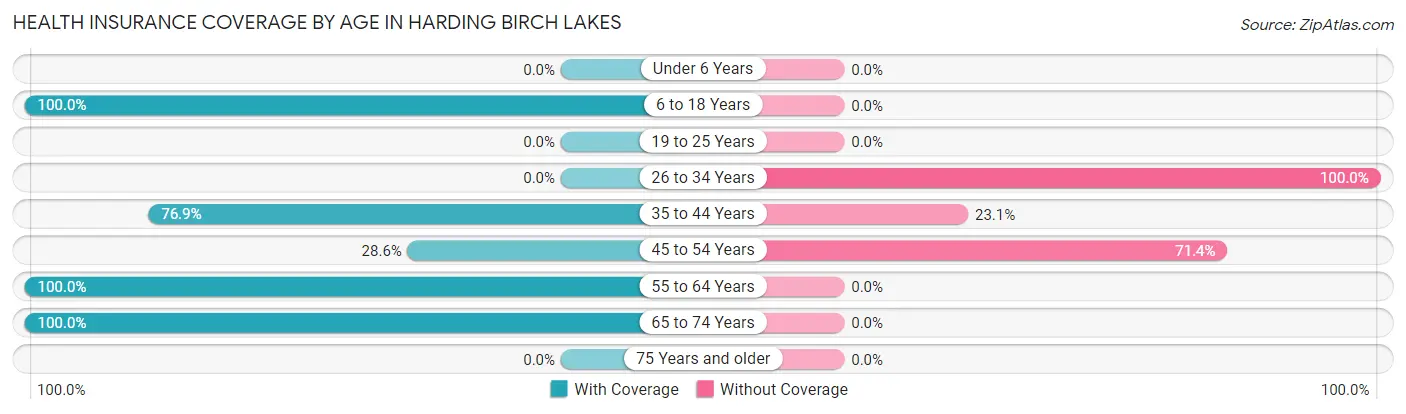
| Age Bracket | With Coverage | Without Coverage |
| Under 6 Years | 0 (0.0%) | 0 (0.0%) |
| 6 to 18 Years | 10 (100.0%) | 0 (0.0%) |
| 19 to 25 Years | 0 (0.0%) | 0 (0.0%) |
| 26 to 34 Years | 0 (0.0%) | 13 (100.0%) |
| 35 to 44 Years | 20 (76.9%) | 6 (23.1%) |
| 45 to 54 Years | 20 (28.6%) | 50 (71.4%) |
| 55 to 64 Years | 96 (100.0%) | 0 (0.0%) |
| 65 to 74 Years | 70 (100.0%) | 0 (0.0%) |
| 75 Years and older | 0 (0.0%) | 0 (0.0%) |
| Total | 216 (75.8%) | 69 (24.2%) |
Health Insurance Coverage by Citizenship Status in Harding Birch Lakes
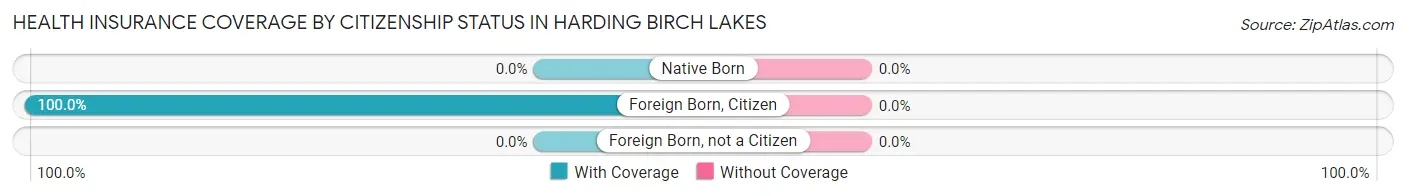
| Citizenship Status | With Coverage | Without Coverage |
| Native Born | 0 (0.0%) | 0 (0.0%) |
| Foreign Born, Citizen | 10 (100.0%) | 0 (0.0%) |
| Foreign Born, not a Citizen | 0 (0.0%) | 0 (0.0%) |
Health Insurance Coverage by Household Income in Harding Birch Lakes
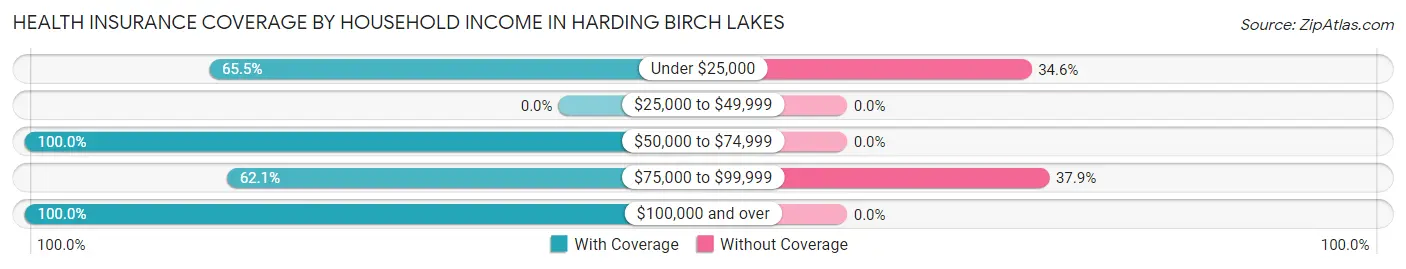
| Household Income | With Coverage | Without Coverage |
| Under $25,000 | 36 (65.4%) | 19 (34.5%) |
| $25,000 to $49,999 | 0 (0.0%) | 0 (0.0%) |
| $50,000 to $74,999 | 68 (100.0%) | 0 (0.0%) |
| $75,000 to $99,999 | 82 (62.1%) | 50 (37.9%) |
| $100,000 and over | 30 (100.0%) | 0 (0.0%) |
Public vs Private Health Insurance Coverage by Age in Harding Birch Lakes
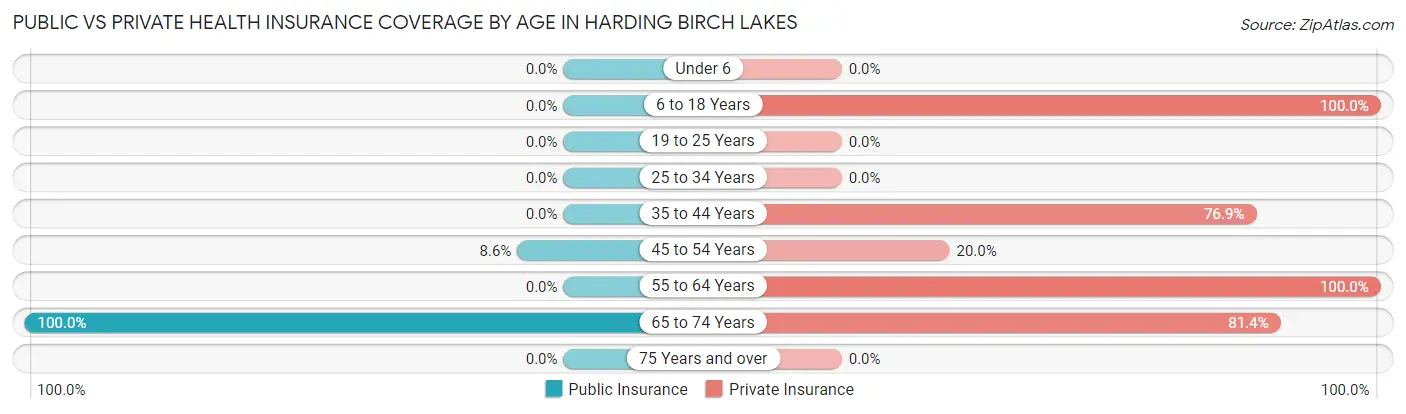
| Age Bracket | Public Insurance | Private Insurance |
| Under 6 | 0 (0.0%) | 0 (0.0%) |
| 6 to 18 Years | 0 (0.0%) | 10 (100.0%) |
| 19 to 25 Years | 0 (0.0%) | 0 (0.0%) |
| 25 to 34 Years | 0 (0.0%) | 0 (0.0%) |
| 35 to 44 Years | 0 (0.0%) | 20 (76.9%) |
| 45 to 54 Years | 6 (8.6%) | 14 (20.0%) |
| 55 to 64 Years | 0 (0.0%) | 96 (100.0%) |
| 65 to 74 Years | 70 (100.0%) | 57 (81.4%) |
| 75 Years and over | 0 (0.0%) | 0 (0.0%) |
| Total | 76 (26.7%) | 197 (69.1%) |
Disability Status by Sex by Age in Harding Birch Lakes
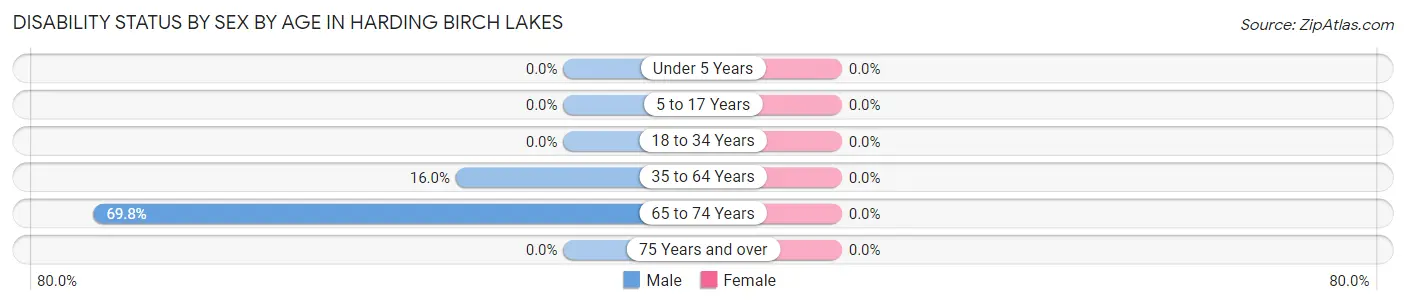
| Age Bracket | Male | Female |
| Under 5 Years | 0 (0.0%) | 0 (0.0%) |
| 5 to 17 Years | 0 (0.0%) | 0 (0.0%) |
| 18 to 34 Years | 0 (0.0%) | 0 (0.0%) |
| 35 to 64 Years | 19 (16.0%) | 0 (0.0%) |
| 65 to 74 Years | 30 (69.8%) | 0 (0.0%) |
| 75 Years and over | 0 (0.0%) | 0 (0.0%) |
Disability Class by Sex by Age in Harding Birch Lakes
Disability Class: Hearing Difficulty
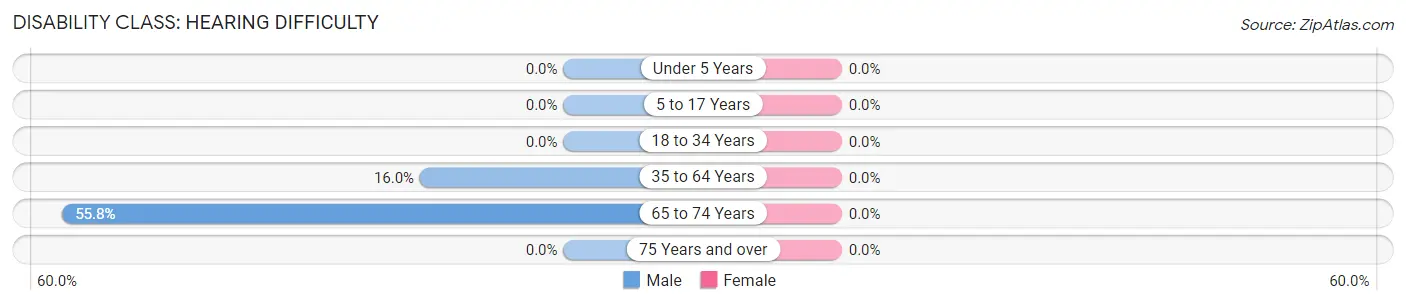
| Age Bracket | Male | Female |
| Under 5 Years | 0 (0.0%) | 0 (0.0%) |
| 5 to 17 Years | 0 (0.0%) | 0 (0.0%) |
| 18 to 34 Years | 0 (0.0%) | 0 (0.0%) |
| 35 to 64 Years | 19 (16.0%) | 0 (0.0%) |
| 65 to 74 Years | 24 (55.8%) | 0 (0.0%) |
| 75 Years and over | 0 (0.0%) | 0 (0.0%) |
Disability Class: Vision Difficulty
| Age Bracket | Male | Female |
| Under 5 Years | 0 (0.0%) | 0 (0.0%) |
| 5 to 17 Years | 0 (0.0%) | 0 (0.0%) |
| 18 to 34 Years | 0 (0.0%) | 0 (0.0%) |
| 35 to 64 Years | 0 (0.0%) | 0 (0.0%) |
| 65 to 74 Years | 0 (0.0%) | 0 (0.0%) |
| 75 Years and over | 0 (0.0%) | 0 (0.0%) |
Disability Class: Cognitive Difficulty
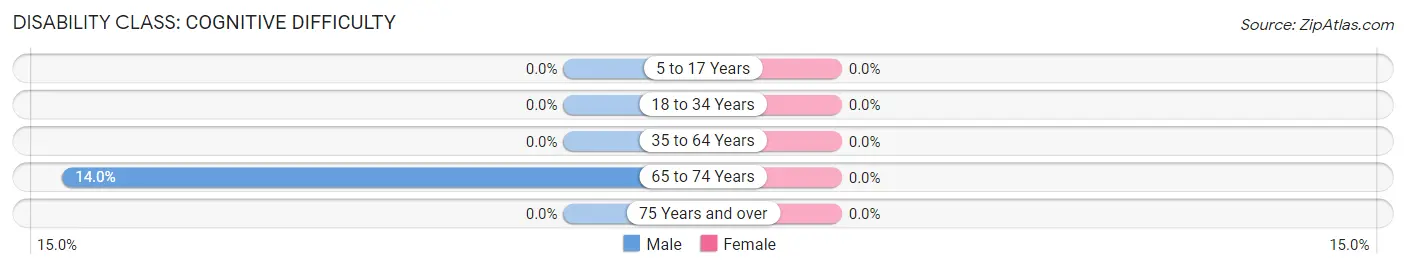
| Age Bracket | Male | Female |
| 5 to 17 Years | 0 (0.0%) | 0 (0.0%) |
| 18 to 34 Years | 0 (0.0%) | 0 (0.0%) |
| 35 to 64 Years | 0 (0.0%) | 0 (0.0%) |
| 65 to 74 Years | 6 (14.0%) | 0 (0.0%) |
| 75 Years and over | 0 (0.0%) | 0 (0.0%) |
Disability Class: Ambulatory Difficulty
| Age Bracket | Male | Female |
| 5 to 17 Years | 0 (0.0%) | 0 (0.0%) |
| 18 to 34 Years | 0 (0.0%) | 0 (0.0%) |
| 35 to 64 Years | 0 (0.0%) | 0 (0.0%) |
| 65 to 74 Years | 0 (0.0%) | 0 (0.0%) |
| 75 Years and over | 0 (0.0%) | 0 (0.0%) |
Disability Class: Self-Care Difficulty
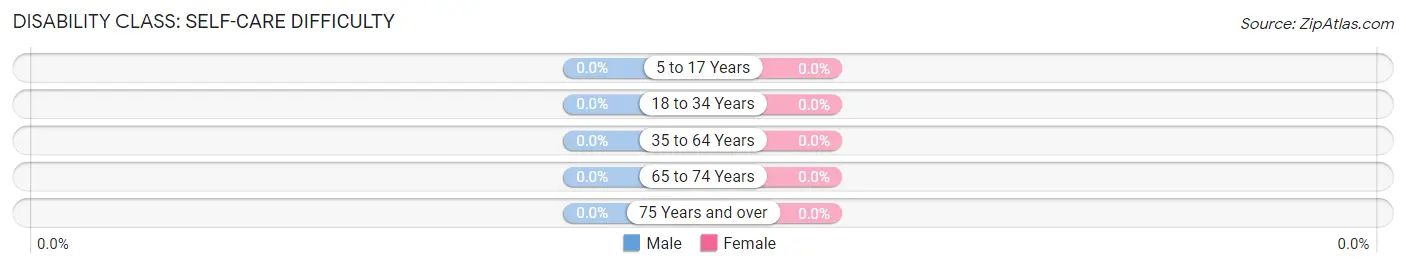
| Age Bracket | Male | Female |
| 5 to 17 Years | 0 (0.0%) | 0 (0.0%) |
| 18 to 34 Years | 0 (0.0%) | 0 (0.0%) |
| 35 to 64 Years | 0 (0.0%) | 0 (0.0%) |
| 65 to 74 Years | 0 (0.0%) | 0 (0.0%) |
| 75 Years and over | 0 (0.0%) | 0 (0.0%) |
Technology Access in Harding Birch Lakes
Computing Device Access in Harding Birch Lakes
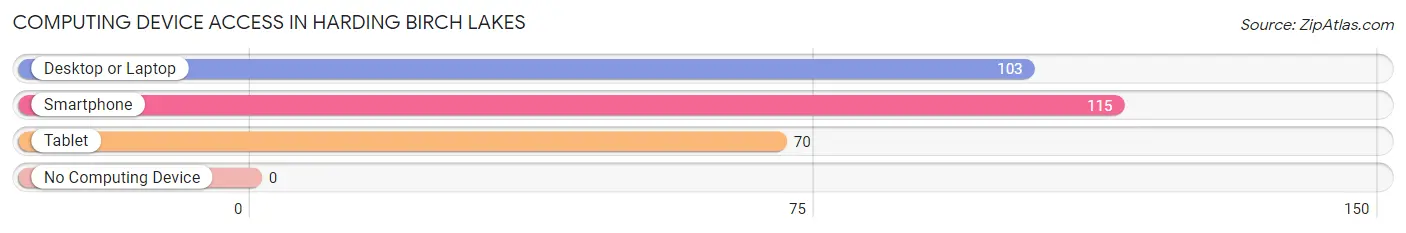
| Device Type | # Households | % Households |
| Desktop or Laptop | 103 | 89.6% |
| Smartphone | 115 | 100.0% |
| Tablet | 70 | 60.9% |
| No Computing Device | 0 | 0.0% |
| Total | 115 | 100.0% |
Internet Access in Harding Birch Lakes
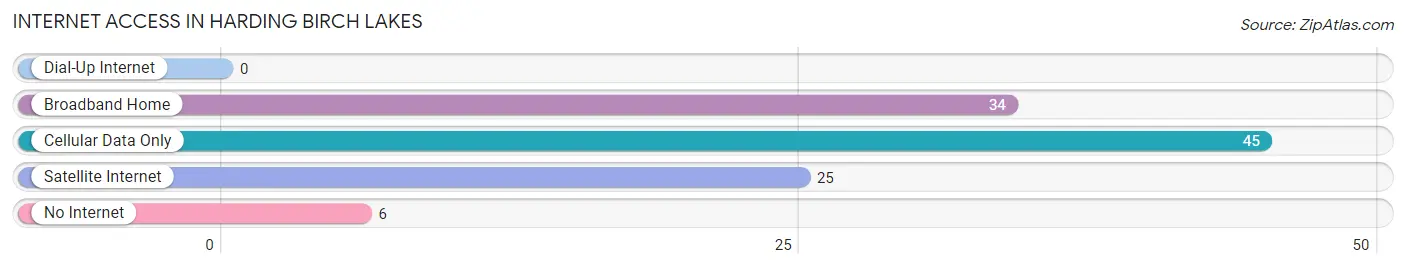
| Internet Type | # Households | % Households |
| Dial-Up Internet | 0 | 0.0% |
| Broadband Home | 34 | 29.6% |
| Cellular Data Only | 45 | 39.1% |
| Satellite Internet | 25 | 21.7% |
| No Internet | 6 | 5.2% |
| Total | 115 | 100.0% |
Harding Birch Lakes Summary
Harding Birch Lakes is a census-designated place (CDP) located in the Matanuska-Susitna Borough of Alaska. It is situated in the south-central part of the state, approximately 40 miles northeast of Anchorage. The CDP is comprised of two small lakes, Harding Lake and Birch Lake, and the surrounding area. As of the 2010 census, the population of Harding Birch Lakes was 1,072.
Geography
Harding Birch Lakes is located at 61°25'N 149°25'W. It is situated in the Matanuska-Susitna Borough, approximately 40 miles northeast of Anchorage. The CDP is comprised of two small lakes, Harding Lake and Birch Lake, and the surrounding area. The total area of the CDP is 11.3 square miles, of which 10.9 square miles is land and 0.4 square miles is water.
The terrain of the CDP is mostly flat, with some rolling hills. The area is heavily forested, with a mix of coniferous and deciduous trees. The climate is subarctic, with cold winters and mild summers.
History
Harding Birch Lakes was first settled in the early 1900s by homesteaders. The area was originally known as "Harding Lake," after the Harding family who settled there. The name was changed to "Harding Birch Lakes" in the 1950s, when the Birch family also settled in the area.
The area was officially designated as a census designated place CDP in 1980
Economy
The economy of Harding Birch Lakes is largely based on tourism and recreation. The area is popular for fishing, hunting, and camping. There are several lodges and resorts in the area, as well as a number of small businesses.
Demographics
As of the 2010 census, the population of Harding Birch Lakes was 1,072. The racial makeup of the CDP was 94.2% White, 0.7% Native American, 0.3% Asian, 0.2% Pacific Islander, 0.1% Black or African American, and 4.5% from other races. The median household income was $50,938, and the median family income was $54,375.
The population of Harding Birch Lakes is largely rural, with most residents living in single-family homes. The area is served by the Matanuska-Susitna Borough School District.
Common Questions
What is Per Capita Income in Harding Birch Lakes?
Per Capita income in Harding Birch Lakes is $33,664.
What is the Median Family Income in Harding Birch Lakes?
Median Family Income in Harding Birch Lakes is $74,271.
What is the Median Household income in Harding Birch Lakes?
Median Household Income in Harding Birch Lakes is $73,281.
What is Inequality or Gini Index in Harding Birch Lakes?
Inequality or Gini Index in Harding Birch Lakes is 0.31.
What is the Total Population of Harding Birch Lakes?
Total Population of Harding Birch Lakes is 285.
What is the Total Male Population of Harding Birch Lakes?
Total Male Population of Harding Birch Lakes is 179.
What is the Total Female Population of Harding Birch Lakes?
Total Female Population of Harding Birch Lakes is 106.
What is the Ratio of Males per 100 Females in Harding Birch Lakes?
There are 168.87 Males per 100 Females in Harding Birch Lakes.
What is the Ratio of Females per 100 Males in Harding Birch Lakes?
There are 59.22 Females per 100 Males in Harding Birch Lakes.
What is the Median Population Age in Harding Birch Lakes?
Median Population Age in Harding Birch Lakes is 59.1 Years.
What is the Average Family Size in Harding Birch Lakes
Average Family Size in Harding Birch Lakes is 2.4 People.
What is the Average Household Size in Harding Birch Lakes
Average Household Size in Harding Birch Lakes is 2.5 People.
How Large is the Labor Force in Harding Birch Lakes?
There are 104 People in the Labor Forcein in Harding Birch Lakes.
What is the Percentage of People in the Labor Force in Harding Birch Lakes?
37.1% of People are in the Labor Force in Harding Birch Lakes.
What is the Unemployment Rate in Harding Birch Lakes?
Unemployment Rate in Harding Birch Lakes is 4.8%.