Brevig Mission, AK Map & Demographics
Brevig Mission Map
Brevig Mission Overview
$13,032
PER CAPITA INCOME
$36,736
AVG FAMILY INCOME
$58,438
AVG HOUSEHOLD INCOME
19.6%
WAGE / INCOME GAP [ % ]
80.4¢/ $1
WAGE / INCOME GAP [ $ ]
0.42
INEQUALITY / GINI INDEX
625
TOTAL POPULATION
296
MALE POPULATION
329
FEMALE POPULATION
89.97
MALES / 100 FEMALES
111.15
FEMALES / 100 MALES
22.0
MEDIAN AGE
4.8
AVG FAMILY SIZE
4.8
AVG HOUSEHOLD SIZE
190
LABOR FORCE [ PEOPLE ]
52.5%
PERCENT IN LABOR FORCE
20.5%
UNEMPLOYMENT RATE
Brevig Mission Zip Codes
Brevig Mission Area Codes
Income in Brevig Mission
Income Overview in Brevig Mission
Per Capita Income in Brevig Mission is $13,032, while median incomes of families and households are $36,736 and $58,438 respectively.
| Characteristic | Number | Measure |
| Per Capita Income | 625 | $13,032 |
| Median Family Income | 115 | $36,736 |
| Mean Family Income | 115 | $54,081 |
| Median Household Income | 129 | $58,438 |
| Mean Household Income | 129 | $63,191 |
| Income Deficit | 115 | $0 |
| Wage / Income Gap (%) | 625 | 19.61% |
| Wage / Income Gap ($) | 625 | 80.39¢ per $1 |
| Gini / Inequality Index | 625 | 0.42 |
Earnings by Sex in Brevig Mission
Average Earnings in Brevig Mission are $23,558, $22,500 for men and $27,989 for women, a difference of 19.6%.
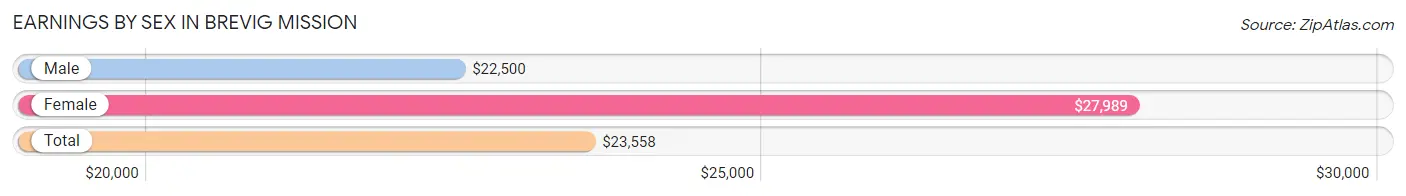
| Sex | Number | Average Earnings |
| Male | 94 (46.3%) | $22,500 |
| Female | 109 (53.7%) | $27,989 |
| Total | 203 (100.0%) | $23,558 |
Earnings by Sex by Income Bracket in Brevig Mission
The most common earnings brackets in Brevig Mission are $2,499 or less for men (16 | 17.0%) and $25,000 to $29,999 for women (24 | 22.0%).
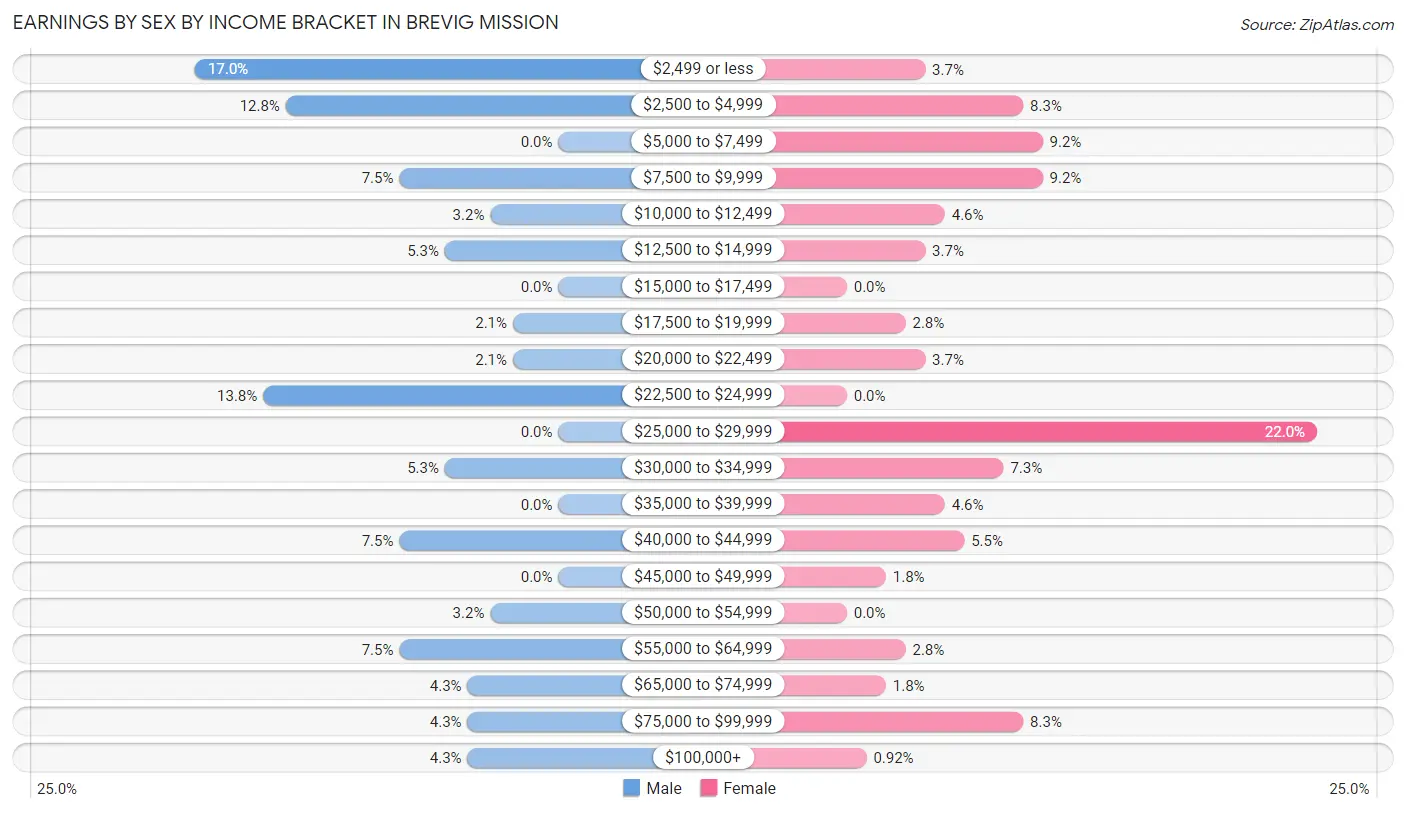
| Income | Male | Female |
| $2,499 or less | 16 (17.0%) | 4 (3.7%) |
| $2,500 to $4,999 | 12 (12.8%) | 9 (8.3%) |
| $5,000 to $7,499 | 0 (0.0%) | 10 (9.2%) |
| $7,500 to $9,999 | 7 (7.4%) | 10 (9.2%) |
| $10,000 to $12,499 | 3 (3.2%) | 5 (4.6%) |
| $12,500 to $14,999 | 5 (5.3%) | 4 (3.7%) |
| $15,000 to $17,499 | 0 (0.0%) | 0 (0.0%) |
| $17,500 to $19,999 | 2 (2.1%) | 3 (2.8%) |
| $20,000 to $22,499 | 2 (2.1%) | 4 (3.7%) |
| $22,500 to $24,999 | 13 (13.8%) | 0 (0.0%) |
| $25,000 to $29,999 | 0 (0.0%) | 24 (22.0%) |
| $30,000 to $34,999 | 5 (5.3%) | 8 (7.3%) |
| $35,000 to $39,999 | 0 (0.0%) | 5 (4.6%) |
| $40,000 to $44,999 | 7 (7.4%) | 6 (5.5%) |
| $45,000 to $49,999 | 0 (0.0%) | 2 (1.8%) |
| $50,000 to $54,999 | 3 (3.2%) | 0 (0.0%) |
| $55,000 to $64,999 | 7 (7.4%) | 3 (2.8%) |
| $65,000 to $74,999 | 4 (4.3%) | 2 (1.8%) |
| $75,000 to $99,999 | 4 (4.3%) | 9 (8.3%) |
| $100,000+ | 4 (4.3%) | 1 (0.9%) |
| Total | 94 (100.0%) | 109 (100.0%) |
Earnings by Sex by Educational Attainment in Brevig Mission
Average earnings in Brevig Mission are $23,558 for men and $28,967 for women, a difference of 18.7%. Men with an educational attainment of college or associate's degree enjoy the highest average annual earnings of $31,250, while those with college or associate's degree education earn the least with $31,250. Women with an educational attainment of bachelor's degree earn the most with the average annual earnings of $72,500, while those with high school diploma education have the smallest earnings of $28,125.
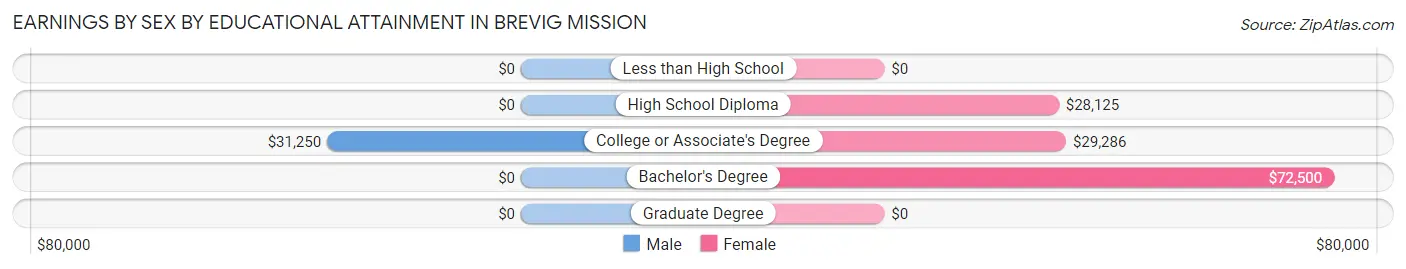
| Educational Attainment | Male Income | Female Income |
| Less than High School | - | - |
| High School Diploma | - | - |
| College or Associate's Degree | $31,250 | $29,286 |
| Bachelor's Degree | - | - |
| Graduate Degree | - | - |
| Total | $23,558 | $28,967 |
Family Income in Brevig Mission
Family Income Brackets in Brevig Mission
According to the Brevig Mission family income data, there are 22 families falling into the $35,000 to $49,999 income range, which is the most common income bracket and makes up 19.1% of all families. Conversely, the $150,000 to $199,999 income bracket is the least frequent group with only 3 families (2.6%) belonging to this category.
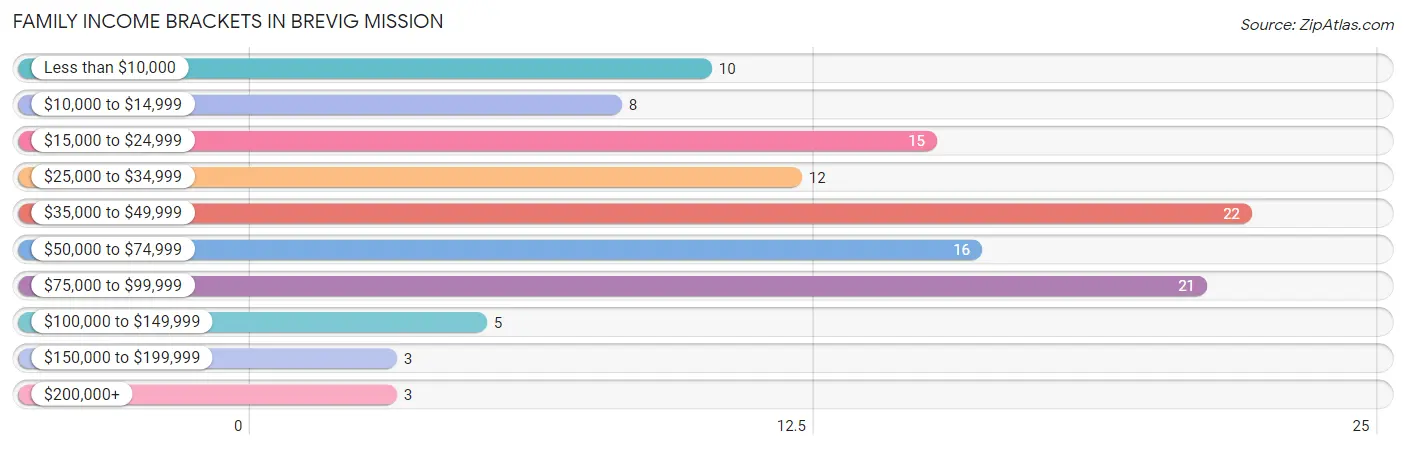
| Income Bracket | # Families | % Families |
| Less than $10,000 | 10 | 8.7% |
| $10,000 to $14,999 | 8 | 7.0% |
| $15,000 to $24,999 | 15 | 13.0% |
| $25,000 to $34,999 | 12 | 10.4% |
| $35,000 to $49,999 | 22 | 19.1% |
| $50,000 to $74,999 | 16 | 13.9% |
| $75,000 to $99,999 | 21 | 18.3% |
| $100,000 to $149,999 | 5 | 4.3% |
| $150,000 to $199,999 | 3 | 2.6% |
| $200,000+ | 3 | 2.6% |
Family Income by Famaliy Size in Brevig Mission
4-person families (8 | 7.0%) account for the highest median family income in Brevig Mission with $102,500 per family, while 4-person families (8 | 7.0%) have the highest median income of $25,625 per family member.
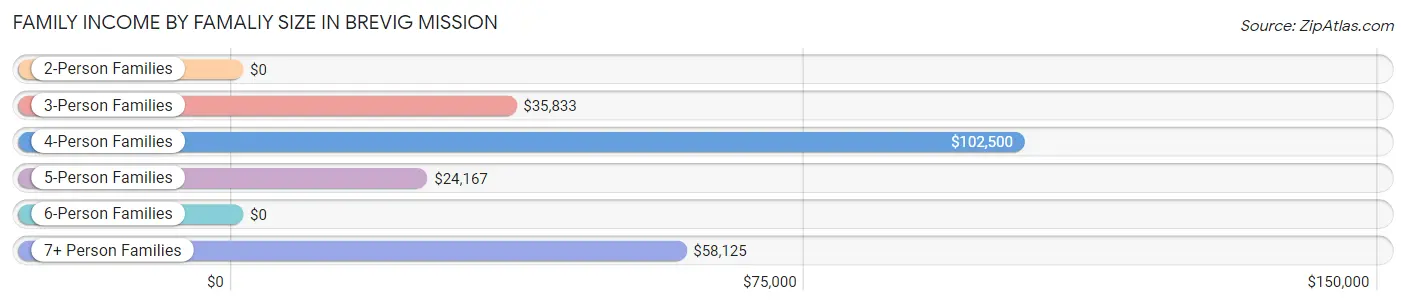
| Income Bracket | # Families | Median Income |
| 2-Person Families | 17 (14.8%) | $0 |
| 3-Person Families | 24 (20.9%) | $35,833 |
| 4-Person Families | 8 (7.0%) | $102,500 |
| 5-Person Families | 20 (17.4%) | $24,167 |
| 6-Person Families | 2 (1.7%) | $0 |
| 7+ Person Families | 44 (38.3%) | $58,125 |
| Total | 115 (100.0%) | $36,736 |
Family Income by Number of Earners in Brevig Mission
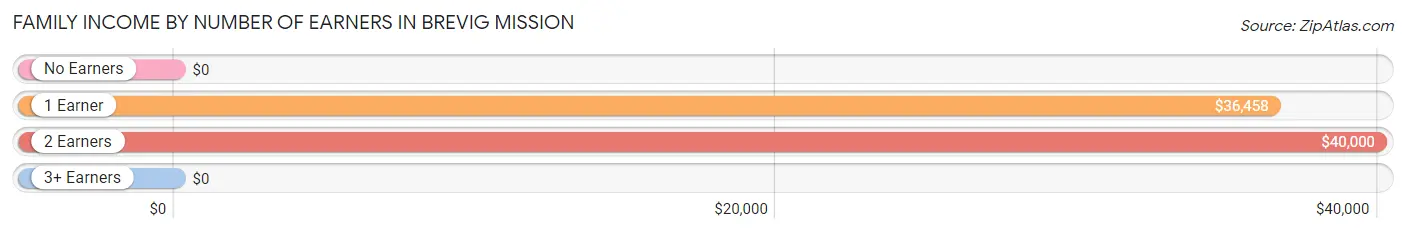
| Number of Earners | # Families | Median Income |
| No Earners | 33 (28.7%) | $0 |
| 1 Earner | 27 (23.5%) | $36,458 |
| 2 Earners | 48 (41.7%) | $40,000 |
| 3+ Earners | 7 (6.1%) | $0 |
| Total | 115 (100.0%) | $36,736 |
Household Income in Brevig Mission
Household Income Brackets in Brevig Mission
With 30 households falling in the category, the $75,000 to $99,999 income range is the most frequent in Brevig Mission, accounting for 23.3% of all households. In contrast, only 3 households (2.3%) fall into the $200,000+ income bracket, making it the least populous group.
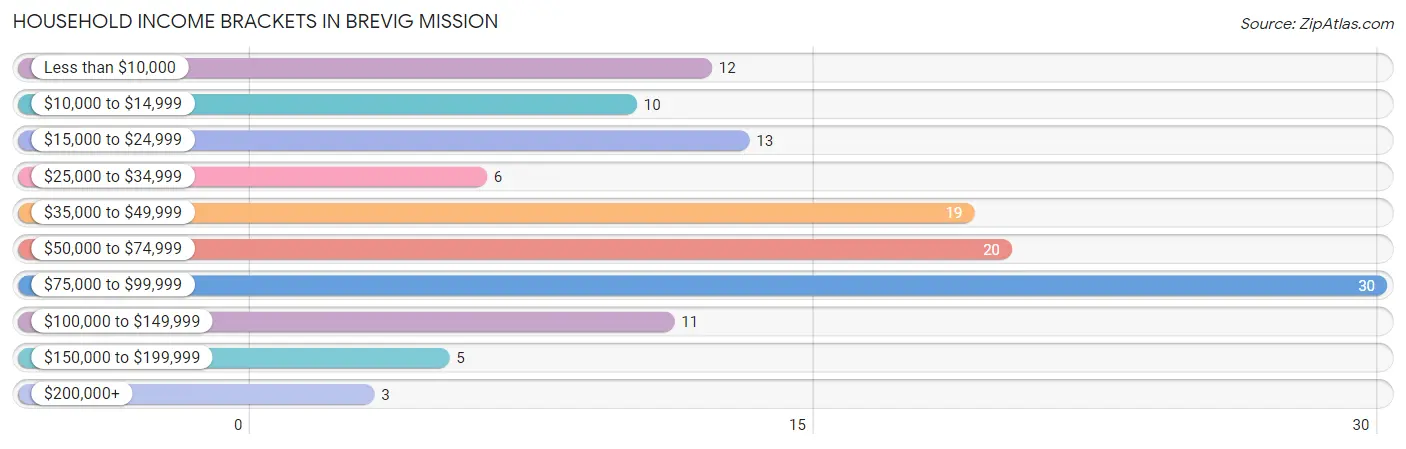
| Income Bracket | # Households | % Households |
| Less than $10,000 | 12 | 9.3% |
| $10,000 to $14,999 | 10 | 7.8% |
| $15,000 to $24,999 | 13 | 10.1% |
| $25,000 to $34,999 | 6 | 4.7% |
| $35,000 to $49,999 | 19 | 14.7% |
| $50,000 to $74,999 | 20 | 15.5% |
| $75,000 to $99,999 | 30 | 23.3% |
| $100,000 to $149,999 | 11 | 8.5% |
| $150,000 to $199,999 | 5 | 3.9% |
| $200,000+ | 3 | 2.3% |
Household Income by Householder Age in Brevig Mission
The median household income in Brevig Mission is $58,438, with the highest median household income of $65,000 found in the 25 to 44 years age bracket for the primary householder. A total of 48 households (37.2%) fall into this category.
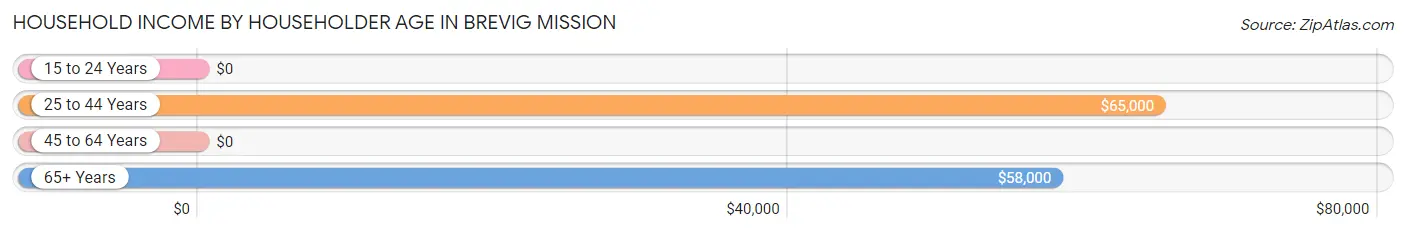
| Income Bracket | # Households | Median Income |
| 15 to 24 Years | 0 (0.0%) | $0 |
| 25 to 44 Years | 48 (37.2%) | $65,000 |
| 45 to 64 Years | 51 (39.5%) | $0 |
| 65+ Years | 30 (23.3%) | $58,000 |
| Total | 129 (100.0%) | $58,438 |
Poverty in Brevig Mission
Income Below Poverty by Sex and Age in Brevig Mission
With 50.3% poverty level for males and 57.1% for females among the residents of Brevig Mission, 5 year old males and 5 year old females are the most vulnerable to poverty, with 2 males (100.0%) and 22 females (91.7%) in their respective age groups living below the poverty level.
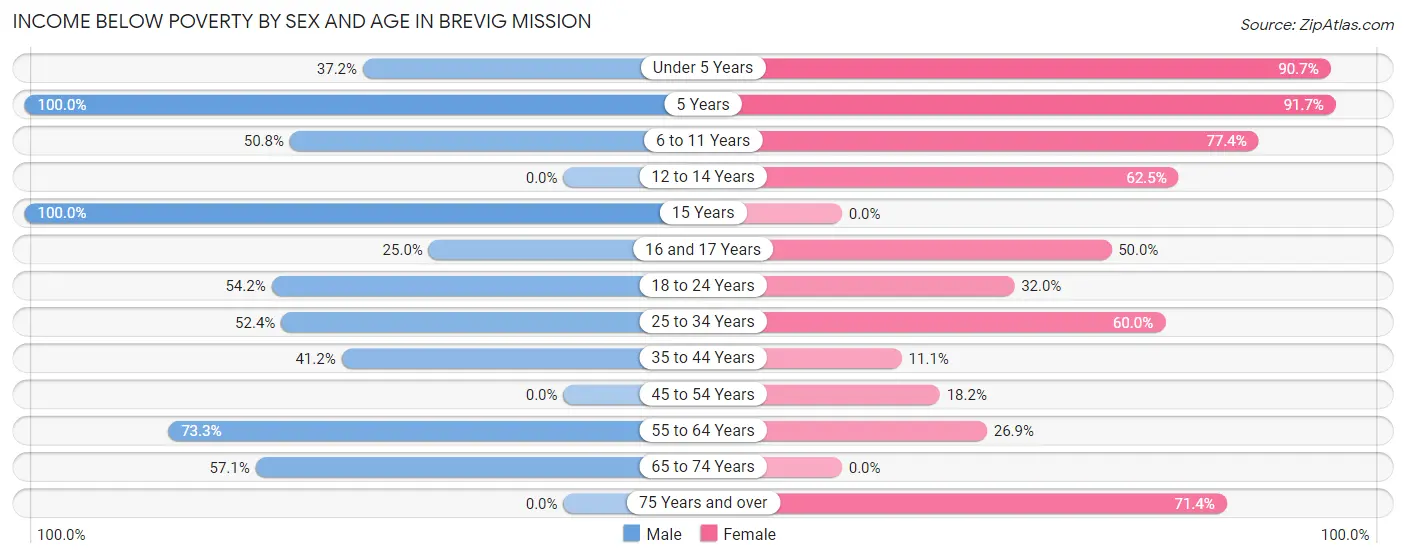
| Age Bracket | Male | Female |
| Under 5 Years | 16 (37.2%) | 39 (90.7%) |
| 5 Years | 2 (100.0%) | 22 (91.7%) |
| 6 to 11 Years | 33 (50.8%) | 41 (77.4%) |
| 12 to 14 Years | 0 (0.0%) | 15 (62.5%) |
| 15 Years | 1 (100.0%) | 0 (0.0%) |
| 16 and 17 Years | 2 (25.0%) | 4 (50.0%) |
| 18 to 24 Years | 13 (54.2%) | 8 (32.0%) |
| 25 to 34 Years | 22 (52.4%) | 36 (60.0%) |
| 35 to 44 Years | 14 (41.2%) | 2 (11.1%) |
| 45 to 54 Years | 0 (0.0%) | 4 (18.2%) |
| 55 to 64 Years | 33 (73.3%) | 7 (26.9%) |
| 65 to 74 Years | 12 (57.1%) | 0 (0.0%) |
| 75 Years and over | 0 (0.0%) | 10 (71.4%) |
| Total | 148 (50.3%) | 188 (57.1%) |
Income Above Poverty by Sex and Age in Brevig Mission
According to the poverty statistics in Brevig Mission, males aged 12 to 14 years and females aged 15 years are the age groups that are most secure financially, with 100.0% of males and 100.0% of females in these age groups living above the poverty line.
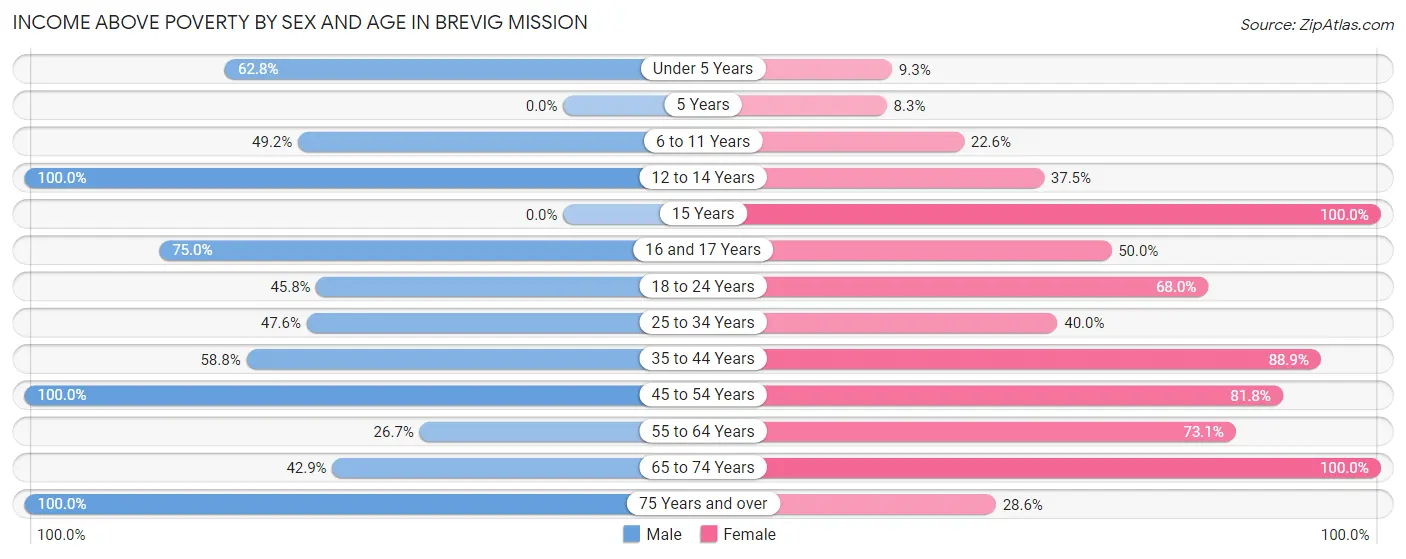
| Age Bracket | Male | Female |
| Under 5 Years | 27 (62.8%) | 4 (9.3%) |
| 5 Years | 0 (0.0%) | 2 (8.3%) |
| 6 to 11 Years | 32 (49.2%) | 12 (22.6%) |
| 12 to 14 Years | 4 (100.0%) | 9 (37.5%) |
| 15 Years | 0 (0.0%) | 2 (100.0%) |
| 16 and 17 Years | 6 (75.0%) | 4 (50.0%) |
| 18 to 24 Years | 11 (45.8%) | 17 (68.0%) |
| 25 to 34 Years | 20 (47.6%) | 24 (40.0%) |
| 35 to 44 Years | 20 (58.8%) | 16 (88.9%) |
| 45 to 54 Years | 4 (100.0%) | 18 (81.8%) |
| 55 to 64 Years | 12 (26.7%) | 19 (73.1%) |
| 65 to 74 Years | 9 (42.9%) | 10 (100.0%) |
| 75 Years and over | 1 (100.0%) | 4 (28.6%) |
| Total | 146 (49.7%) | 141 (42.9%) |
Income Below Poverty Among Married-Couple Families in Brevig Mission
The poverty statistics for married-couple families in Brevig Mission show that 7.7% or 2 of the total 26 families live below the poverty line. Families with 1 or 2 children have the highest poverty rate of 25.0%, comprising of 2 families. On the other hand, families with no children have the lowest poverty rate of 0.0%, which includes 0 families.
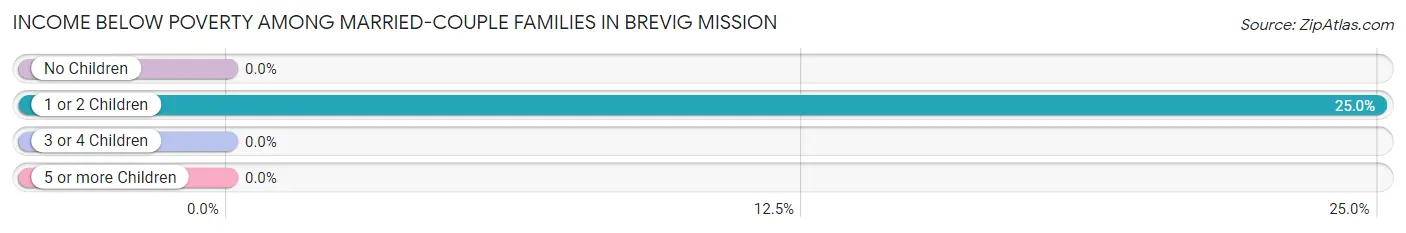
| Children | Above Poverty | Below Poverty |
| No Children | 12 (100.0%) | 0 (0.0%) |
| 1 or 2 Children | 6 (75.0%) | 2 (25.0%) |
| 3 or 4 Children | 4 (100.0%) | 0 (0.0%) |
| 5 or more Children | 2 (100.0%) | 0 (0.0%) |
| Total | 24 (92.3%) | 2 (7.7%) |
Income Below Poverty Among Single-Parent Households in Brevig Mission
According to the poverty data in Brevig Mission, 85.0% or 34 single-father households and 46.9% or 23 single-mother households are living below the poverty line. Among single-father households, those with 3 or 4 children have the highest poverty rate, with 20 households (87.0%) experiencing poverty. Likewise, among single-mother households, those with 5 or more children have the highest poverty rate, with 18 households (72.0%) falling below the poverty line.
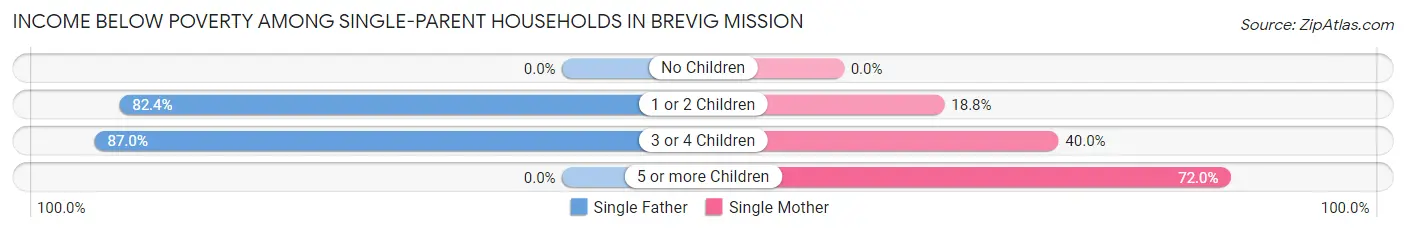
| Children | Single Father | Single Mother |
| No Children | 0 (0.0%) | 0 (0.0%) |
| 1 or 2 Children | 14 (82.4%) | 3 (18.8%) |
| 3 or 4 Children | 20 (87.0%) | 2 (40.0%) |
| 5 or more Children | 0 (0.0%) | 18 (72.0%) |
| Total | 34 (85.0%) | 23 (46.9%) |
Income Below Poverty Among Married-Couple vs Single-Parent Households in Brevig Mission
The poverty data for Brevig Mission shows that 2 of the married-couple family households (7.7%) and 57 of the single-parent households (64.0%) are living below the poverty level. Within the married-couple family households, those with 1 or 2 children have the highest poverty rate, with 2 households (25.0%) falling below the poverty line. Among the single-parent households, those with 3 or 4 children have the highest poverty rate, with 22 household (78.6%) living below poverty.
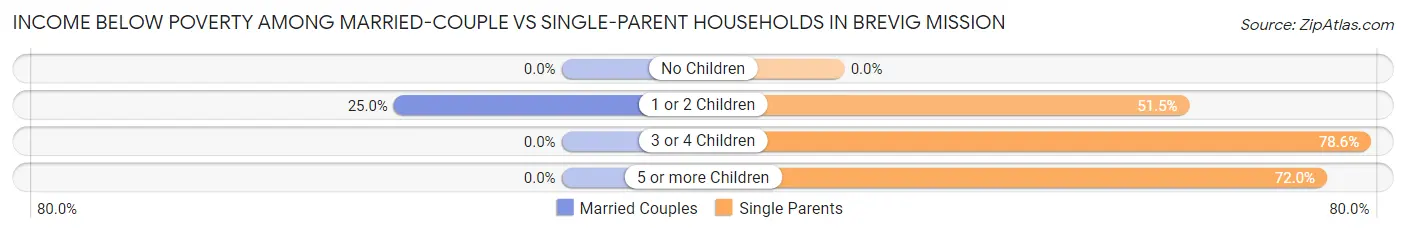
| Children | Married-Couple Families | Single-Parent Households |
| No Children | 0 (0.0%) | 0 (0.0%) |
| 1 or 2 Children | 2 (25.0%) | 17 (51.5%) |
| 3 or 4 Children | 0 (0.0%) | 22 (78.6%) |
| 5 or more Children | 0 (0.0%) | 18 (72.0%) |
| Total | 2 (7.7%) | 57 (64.0%) |
Race in Brevig Mission
The most populous races in Brevig Mission are Native / Alaskan (585 | 93.6%), Two or more Races (25 | 4.0%), and White / Caucasian (15 | 2.4%).
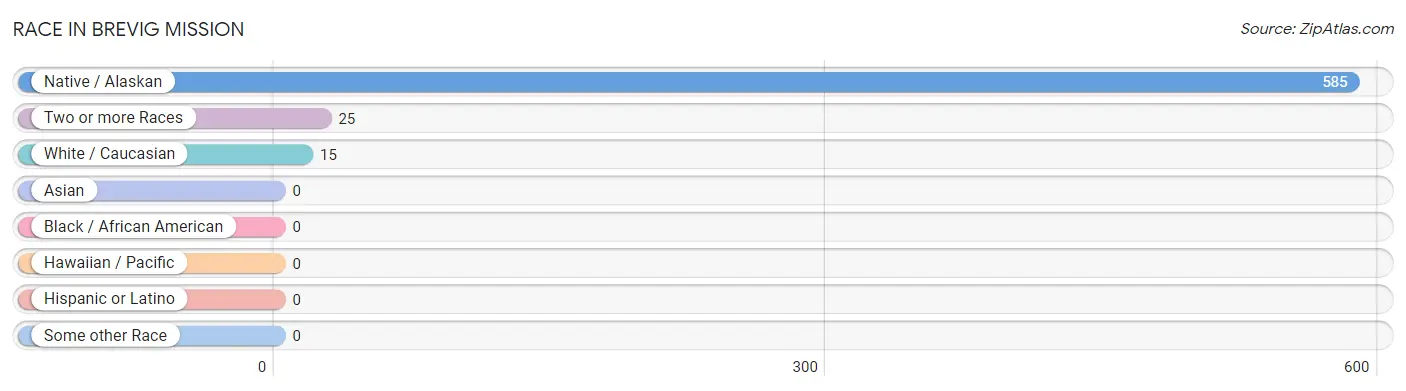
| Race | # Population | % Population |
| Asian | 0 | 0.0% |
| Black / African American | 0 | 0.0% |
| Hawaiian / Pacific | 0 | 0.0% |
| Hispanic or Latino | 0 | 0.0% |
| Native / Alaskan | 585 | 93.6% |
| White / Caucasian | 15 | 2.4% |
| Two or more Races | 25 | 4.0% |
| Some other Race | 0 | 0.0% |
| Total | 625 | 100.0% |
Ancestry in Brevig Mission
The most populous ancestries reported in Brevig Mission are Inupiat (590 | 94.4%), Yup'ik (14 | 2.2%), English (13 | 2.1%), Alaska Native (12 | 1.9%), and German (12 | 1.9%), together accounting for 102.6% of all Brevig Mission residents.
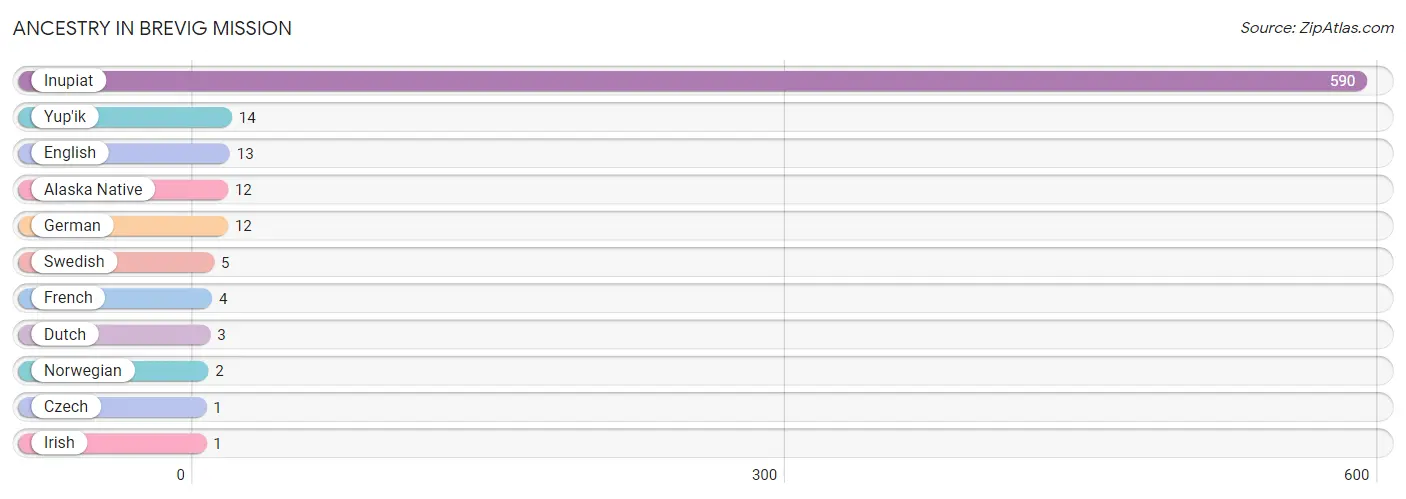
| Ancestry | # Population | % Population |
| Alaska Native | 12 | 1.9% |
| Czech | 1 | 0.2% |
| Dutch | 3 | 0.5% |
| English | 13 | 2.1% |
| French | 4 | 0.6% |
| German | 12 | 1.9% |
| Inupiat | 590 | 94.4% |
| Irish | 1 | 0.2% |
| Norwegian | 2 | 0.3% |
| Swedish | 5 | 0.8% |
| Yup'ik | 14 | 2.2% | View All 11 Rows |
Immigrants in Brevig Mission

| Immigration Origin | # Population | % Population | View All 0 Rows |
Sex and Age in Brevig Mission
Sex and Age in Brevig Mission
The most populous age groups in Brevig Mission are 5 to 9 Years (51 | 17.2%) for men and 10 to 14 Years (59 | 17.9%) for women.
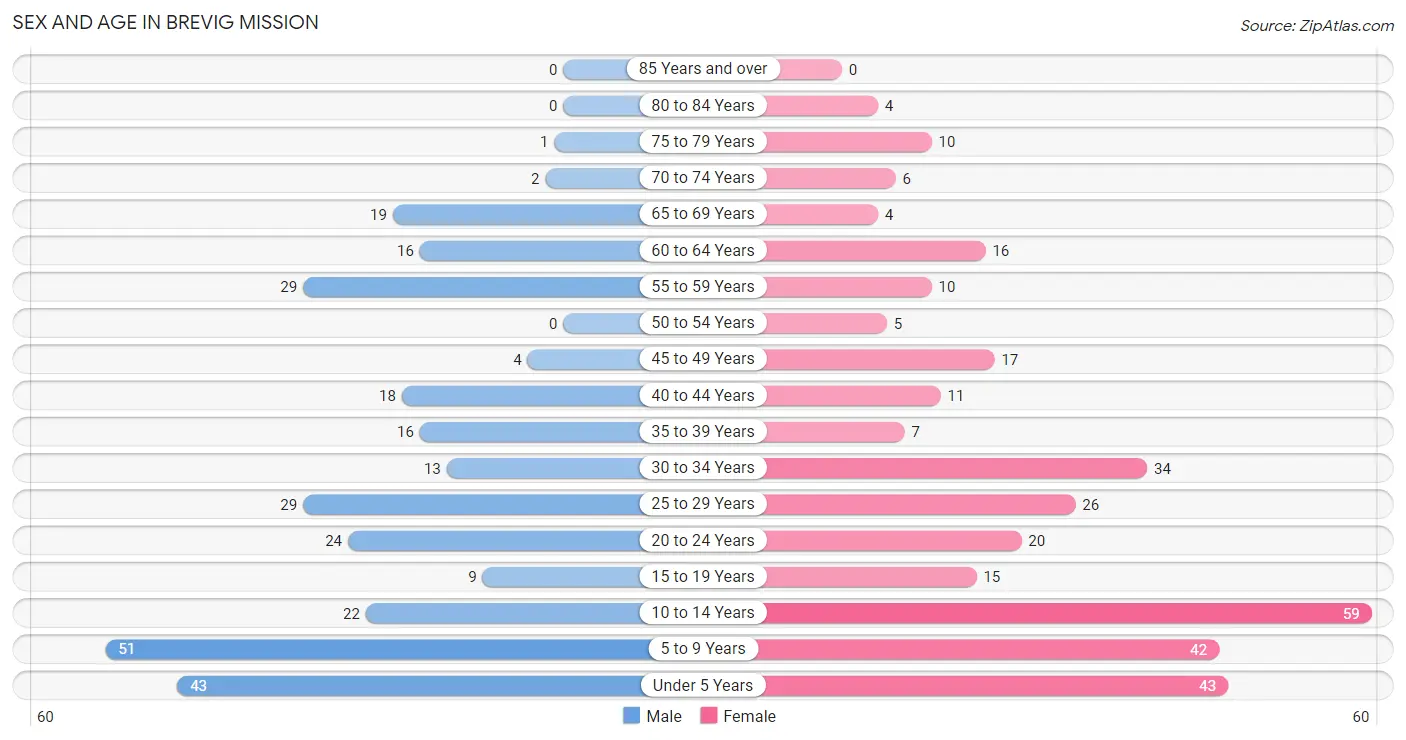
| Age Bracket | Male | Female |
| Under 5 Years | 43 (14.5%) | 43 (13.1%) |
| 5 to 9 Years | 51 (17.2%) | 42 (12.8%) |
| 10 to 14 Years | 22 (7.4%) | 59 (17.9%) |
| 15 to 19 Years | 9 (3.0%) | 15 (4.6%) |
| 20 to 24 Years | 24 (8.1%) | 20 (6.1%) |
| 25 to 29 Years | 29 (9.8%) | 26 (7.9%) |
| 30 to 34 Years | 13 (4.4%) | 34 (10.3%) |
| 35 to 39 Years | 16 (5.4%) | 7 (2.1%) |
| 40 to 44 Years | 18 (6.1%) | 11 (3.3%) |
| 45 to 49 Years | 4 (1.3%) | 17 (5.2%) |
| 50 to 54 Years | 0 (0.0%) | 5 (1.5%) |
| 55 to 59 Years | 29 (9.8%) | 10 (3.0%) |
| 60 to 64 Years | 16 (5.4%) | 16 (4.9%) |
| 65 to 69 Years | 19 (6.4%) | 4 (1.2%) |
| 70 to 74 Years | 2 (0.7%) | 6 (1.8%) |
| 75 to 79 Years | 1 (0.3%) | 10 (3.0%) |
| 80 to 84 Years | 0 (0.0%) | 4 (1.2%) |
| 85 Years and over | 0 (0.0%) | 0 (0.0%) |
| Total | 296 (100.0%) | 329 (100.0%) |
Families and Households in Brevig Mission
Median Family Size in Brevig Mission
The median family size in Brevig Mission is 4.77 persons per family, with single female/mother families (49 | 42.6%) accounting for the largest median family size of 6.33 persons per family. On the other hand, single male/father families (40 | 34.8%) represent the smallest median family size with 3.05 persons per family.
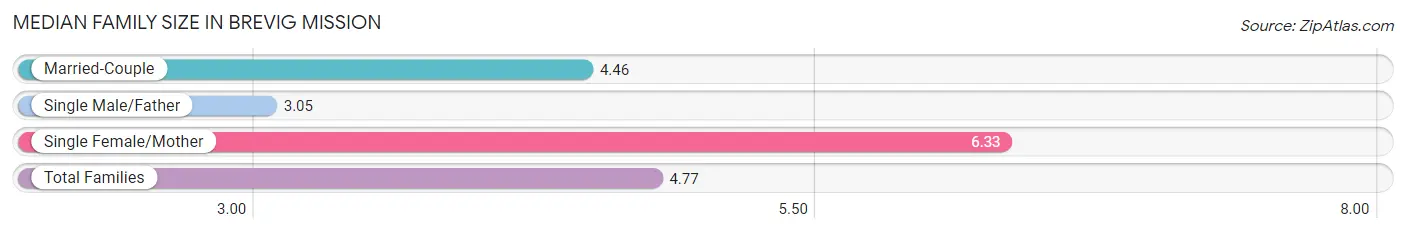
| Family Type | # Families | Family Size |
| Married-Couple | 26 (22.6%) | 4.46 |
| Single Male/Father | 40 (34.8%) | 3.05 |
| Single Female/Mother | 49 (42.6%) | 6.33 |
| Total Families | 115 (100.0%) | 4.77 |
Median Household Size in Brevig Mission
The median household size in Brevig Mission is 4.84 persons per household, with single female/mother households (49 | 38.0%) accounting for the largest median household size of 7 persons per household. non-family households (14 | 10.8%) represent the smallest median household size with 1.50 persons per household.
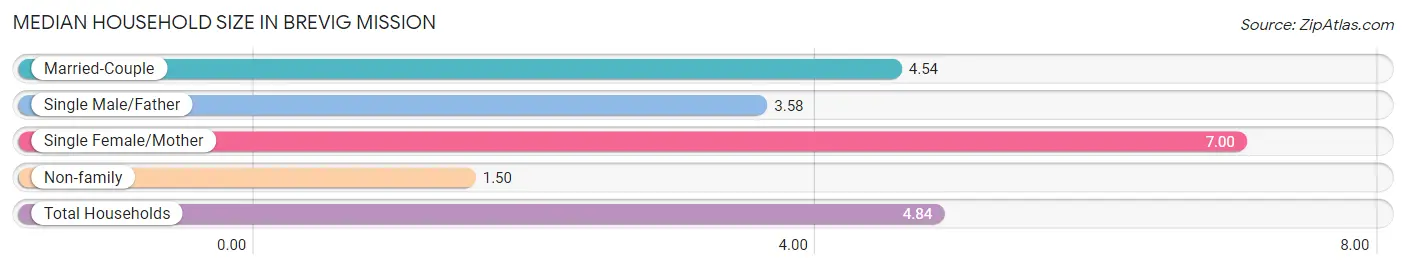
| Household Type | # Households | Household Size |
| Married-Couple | 26 (20.2%) | 4.54 |
| Single Male/Father | 40 (31.0%) | 3.58 |
| Single Female/Mother | 49 (38.0%) | 7.00 |
| Non-family | 14 (10.8%) | 1.50 |
| Total Households | 129 (100.0%) | 4.84 |
Household Size by Marriage Status in Brevig Mission
Out of a total of 129 households in Brevig Mission, 115 (89.1%) are family households, while 14 (10.8%) are nonfamily households. The most numerous type of family households are 7+ person households, comprising 44, and the most common type of nonfamily households are 1-person households, comprising 12.
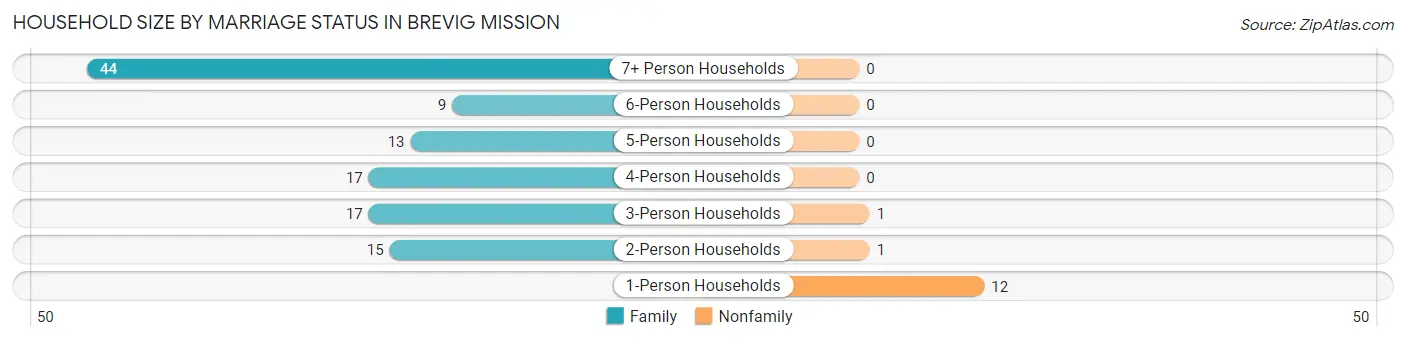
| Household Size | Family Households | Nonfamily Households |
| 1-Person Households | - | 12 (9.3%) |
| 2-Person Households | 15 (11.6%) | 1 (0.8%) |
| 3-Person Households | 17 (13.2%) | 1 (0.8%) |
| 4-Person Households | 17 (13.2%) | 0 (0.0%) |
| 5-Person Households | 13 (10.1%) | 0 (0.0%) |
| 6-Person Households | 9 (7.0%) | 0 (0.0%) |
| 7+ Person Households | 44 (34.1%) | 0 (0.0%) |
| Total | 115 (89.1%) | 14 (10.8%) |
Female Fertility in Brevig Mission
Fertility by Age in Brevig Mission
Average fertility rate in Brevig Mission is 144.0 births per 1,000 women. Women in the age bracket of 20 to 34 years have the highest fertility rate with 213.0 births per 1,000 women. Women in the age bracket of 20 to 34 years acount for 89.5% of all women with births.
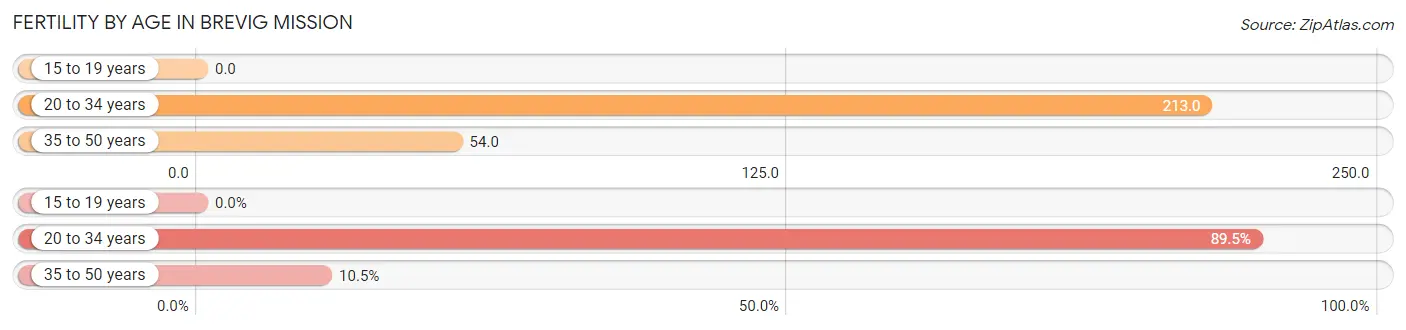
| Age Bracket | Women with Births | Births / 1,000 Women |
| 15 to 19 years | 0 (0.0%) | 0.0 |
| 20 to 34 years | 17 (89.5%) | 213.0 |
| 35 to 50 years | 2 (10.5%) | 54.0 |
| Total | 19 (100.0%) | 144.0 |
Fertility by Age by Marriage Status in Brevig Mission
10.5% of women with births (19) in Brevig Mission are married. The highest percentage of unmarried women with births falls into 35 to 50 years age bracket with 100.0% of them unmarried at the time of birth, while the lowest percentage of unmarried women with births belong to 20 to 34 years age bracket with 88.2% of them unmarried.
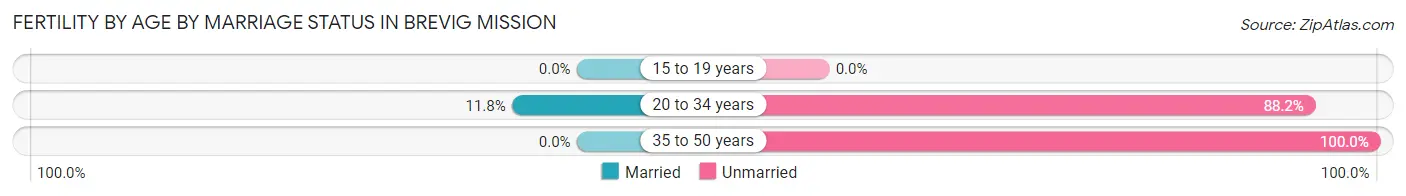
| Age Bracket | Married | Unmarried |
| 15 to 19 years | 0 (0.0%) | 0 (0.0%) |
| 20 to 34 years | 2 (11.8%) | 15 (88.2%) |
| 35 to 50 years | 0 (0.0%) | 2 (100.0%) |
| Total | 2 (10.5%) | 17 (89.5%) |
Fertility by Education in Brevig Mission
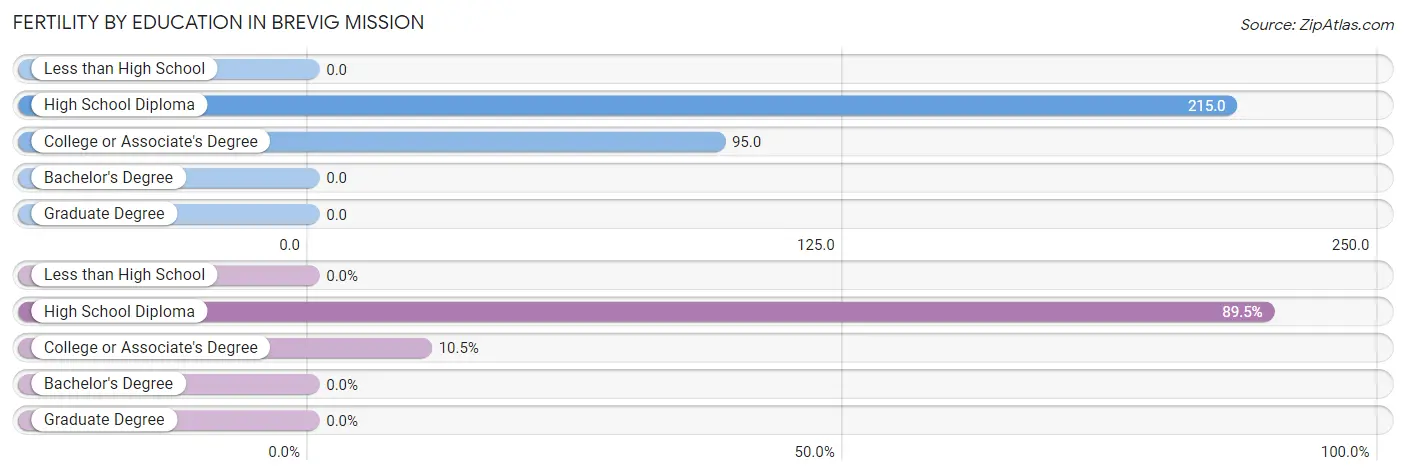
| Educational Attainment | Women with Births | Births / 1,000 Women |
| Less than High School | 0 (0.0%) | 0.0 |
| High School Diploma | 17 (89.5%) | 215.0 |
| College or Associate's Degree | 2 (10.5%) | 95.0 |
| Bachelor's Degree | 0 (0.0%) | 0.0 |
| Graduate Degree | 0 (0.0%) | 0.0 |
| Total | 19 (100.0%) | 144.0 |
Fertility by Education by Marriage Status in Brevig Mission
89.5% of women with births in Brevig Mission are unmarried. Women with the educational attainment of college or associate's degree are most likely to be married with 100.0% of them married at childbirth, while women with the educational attainment of high school diploma are least likely to be married with 100.0% of them unmarried at childbirth.
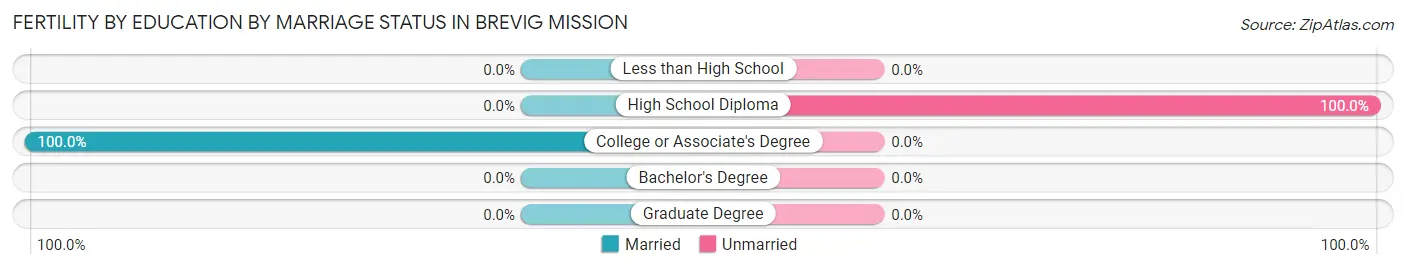
| Educational Attainment | Married | Unmarried |
| Less than High School | 0 (0.0%) | 0 (0.0%) |
| High School Diploma | 0 (0.0%) | 17 (100.0%) |
| College or Associate's Degree | 2 (100.0%) | 0 (0.0%) |
| Bachelor's Degree | 0 (0.0%) | 0 (0.0%) |
| Graduate Degree | 0 (0.0%) | 0 (0.0%) |
| Total | 2 (10.5%) | 17 (89.5%) |
Employment Characteristics in Brevig Mission
Employment by Class of Employer in Brevig Mission
Among the 151 employed individuals in Brevig Mission, local government employees (53 | 35.1%), state government employees (29 | 19.2%), and not-for-profit organizations (26 | 17.2%) make up the most common classes of employment.
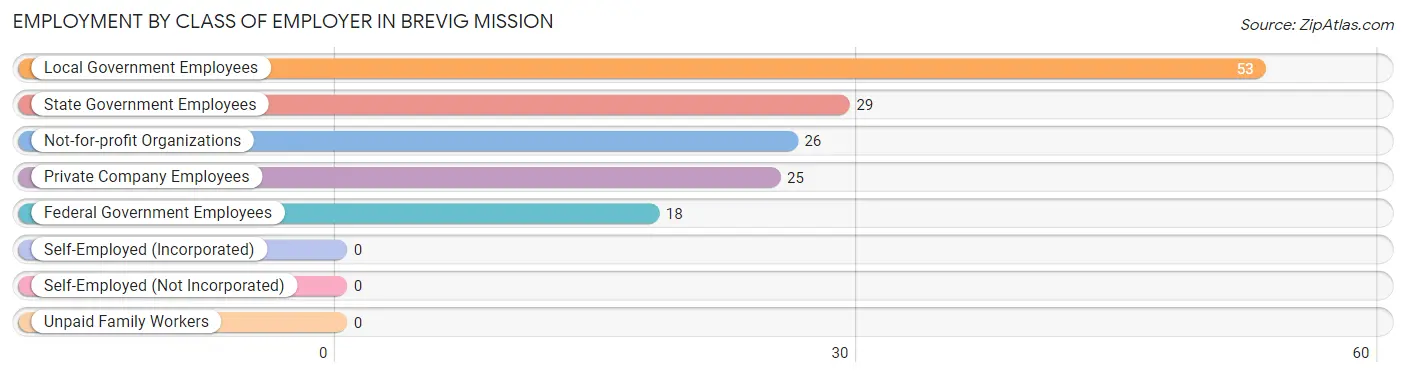
| Employer Class | # Employees | % Employees |
| Private Company Employees | 25 | 16.6% |
| Self-Employed (Incorporated) | 0 | 0.0% |
| Self-Employed (Not Incorporated) | 0 | 0.0% |
| Not-for-profit Organizations | 26 | 17.2% |
| Local Government Employees | 53 | 35.1% |
| State Government Employees | 29 | 19.2% |
| Federal Government Employees | 18 | 11.9% |
| Unpaid Family Workers | 0 | 0.0% |
| Total | 151 | 100.0% |
Employment Status by Age in Brevig Mission
According to the labor force statistics for Brevig Mission, out of the total population over 16 years of age (362), 52.5% or 190 individuals are in the labor force, with 20.5% or 39 of them unemployed. The age group with the highest labor force participation rate is 35 to 44 years, with 82.7% or 43 individuals in the labor force. Within the labor force, the 20 to 24 years age range has the highest percentage of unemployed individuals, with 57.6% or 19 of them being unemployed.
| Age Bracket | In Labor Force | Unemployed |
| 16 to 19 Years | 4 (19.0%) | 0 (0.0%) |
| 20 to 24 Years | 33 (75.0%) | 19 (57.6%) |
| 25 to 29 Years | 33 (60.0%) | 7 (21.2%) |
| 30 to 34 Years | 23 (48.9%) | 3 (13.0%) |
| 35 to 44 Years | 43 (82.7%) | 2 (4.7%) |
| 45 to 54 Years | 20 (76.9%) | 5 (25.0%) |
| 55 to 59 Years | 15 (38.5%) | 1 (6.7%) |
| 60 to 64 Years | 11 (34.4%) | 2 (18.2%) |
| 65 to 74 Years | 8 (25.8%) | 0 (0.0%) |
| 75 Years and over | 0 (0.0%) | 0 (0.0%) |
| Total | 190 (52.5%) | 39 (20.5%) |
Employment Status by Educational Attainment in Brevig Mission
According to labor force statistics for Brevig Mission, 57.8% of individuals (145) out of the total population between 25 and 64 years of age (251) are in the labor force, with 13.8% or 20 of them being unemployed. The group with the highest labor force participation rate are those with the educational attainment of bachelor's degree or higher, with 83.3% or 10 individuals in the labor force. Within the labor force, individuals with less than high school education have the highest percentage of unemployment, with 30.8% or 4 of them being unemployed.
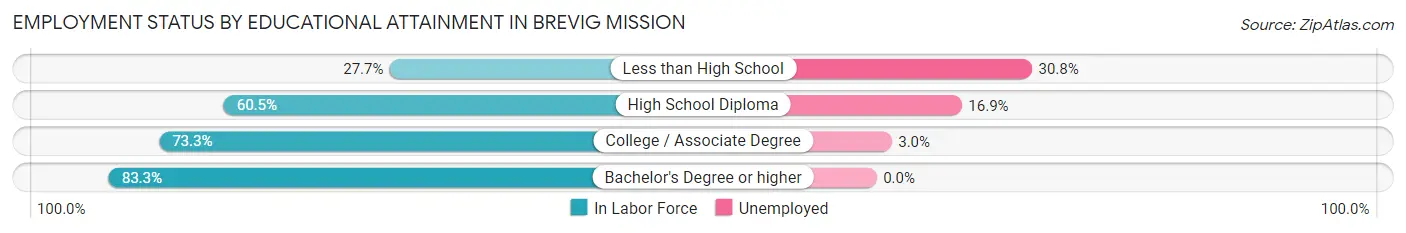
| Educational Attainment | In Labor Force | Unemployed |
| Less than High School | 13 (27.7%) | 14 (30.8%) |
| High School Diploma | 89 (60.5%) | 25 (16.9%) |
| College / Associate Degree | 33 (73.3%) | 1 (3.0%) |
| Bachelor's Degree or higher | 10 (83.3%) | 0 (0.0%) |
| Total | 145 (57.8%) | 35 (13.8%) |
Employment Occupations by Sex in Brevig Mission
Management, Business, Science and Arts Occupations
The most common Management, Business, Science and Arts occupations in Brevig Mission are Community & Social Service (41 | 27.2%), Education Instruction & Library (34 | 22.5%), Management (17 | 11.3%), Health Diagnosing & Treating (6 | 4.0%), and Health Technologists (6 | 4.0%).
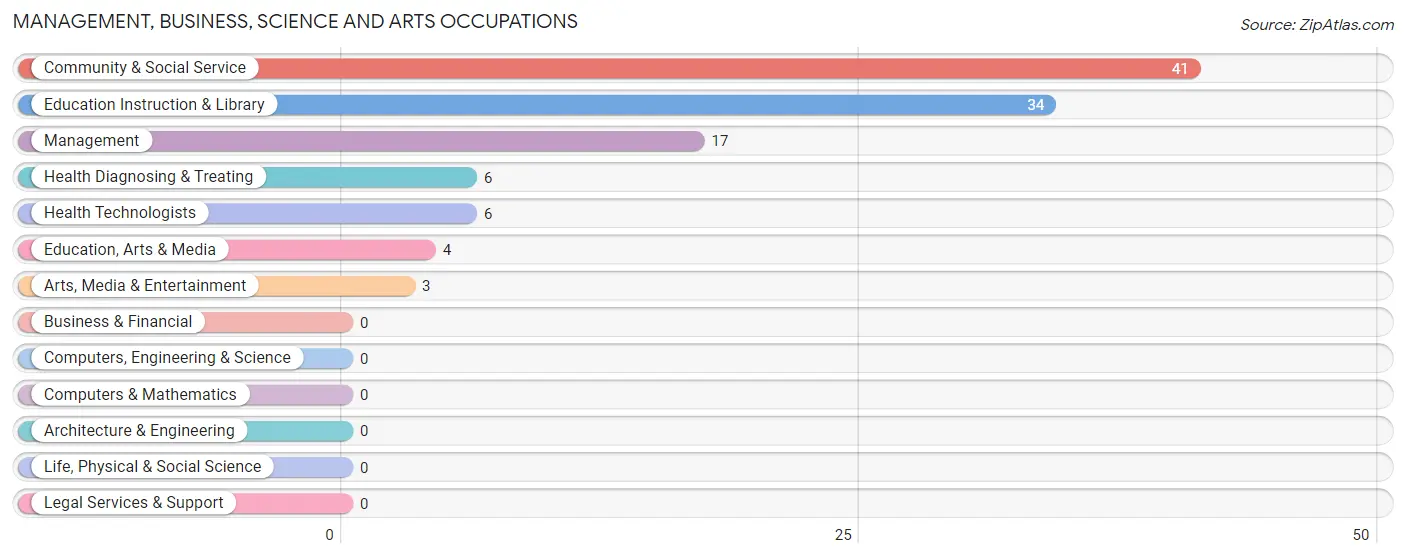
Management, Business, Science and Arts Occupations by Sex
Within the Management, Business, Science and Arts occupations in Brevig Mission, the most male-oriented occupations are Management (47.1%), Education Instruction & Library (20.6%), and Community & Social Service (17.1%), while the most female-oriented occupations are Education, Arts & Media (100.0%), Arts, Media & Entertainment (100.0%), and Health Diagnosing & Treating (100.0%).
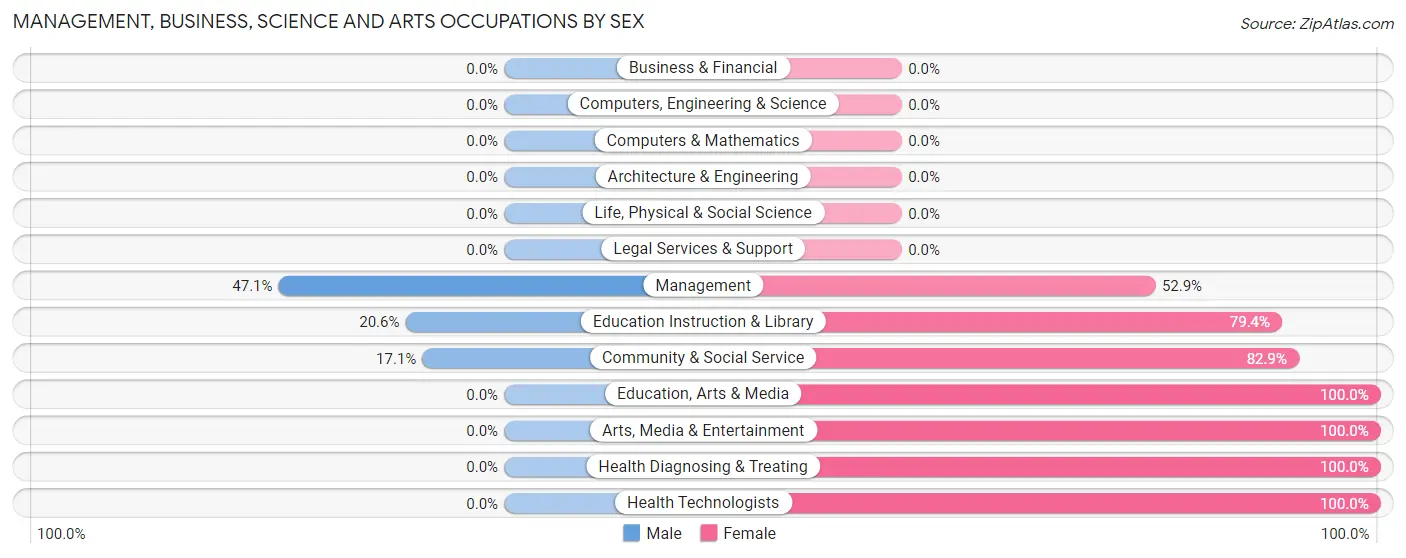
| Occupation | Male | Female |
| Management | 8 (47.1%) | 9 (52.9%) |
| Business & Financial | 0 (0.0%) | 0 (0.0%) |
| Computers, Engineering & Science | 0 (0.0%) | 0 (0.0%) |
| Computers & Mathematics | 0 (0.0%) | 0 (0.0%) |
| Architecture & Engineering | 0 (0.0%) | 0 (0.0%) |
| Life, Physical & Social Science | 0 (0.0%) | 0 (0.0%) |
| Community & Social Service | 7 (17.1%) | 34 (82.9%) |
| Education, Arts & Media | 0 (0.0%) | 4 (100.0%) |
| Legal Services & Support | 0 (0.0%) | 0 (0.0%) |
| Education Instruction & Library | 7 (20.6%) | 27 (79.4%) |
| Arts, Media & Entertainment | 0 (0.0%) | 3 (100.0%) |
| Health Diagnosing & Treating | 0 (0.0%) | 6 (100.0%) |
| Health Technologists | 0 (0.0%) | 6 (100.0%) |
| Total (Category) | 15 (23.4%) | 49 (76.6%) |
| Total (Overall) | 69 (45.7%) | 82 (54.3%) |
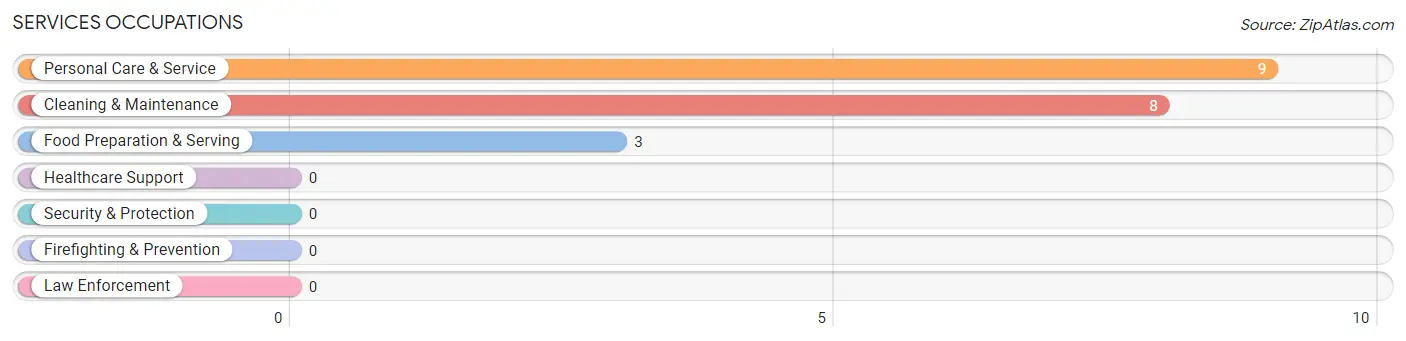
Services Occupations
The most common Services occupations in Brevig Mission are Personal Care & Service (9 | 6.0%), Cleaning & Maintenance (8 | 5.3%), and Food Preparation & Serving (3 | 2.0%).
Services Occupations by Sex
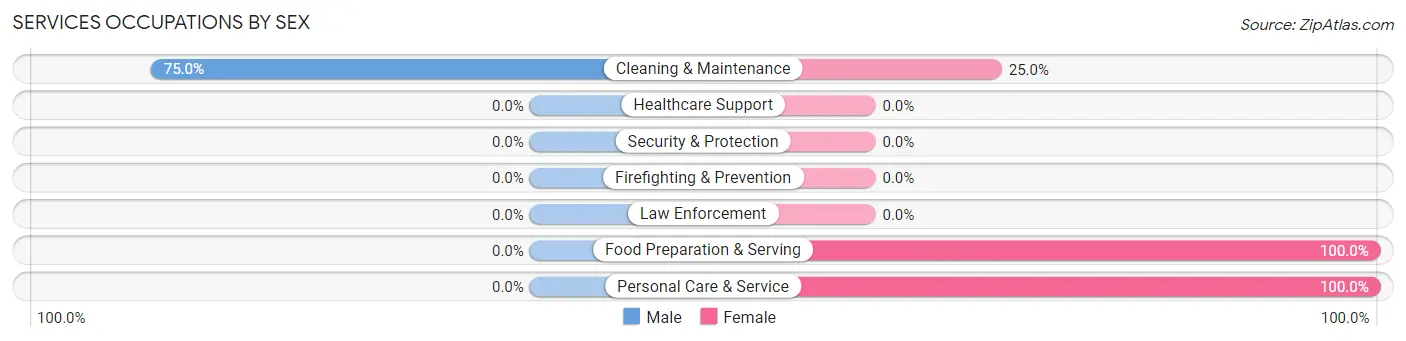
| Occupation | Male | Female |
| Healthcare Support | 0 (0.0%) | 0 (0.0%) |
| Security & Protection | 0 (0.0%) | 0 (0.0%) |
| Firefighting & Prevention | 0 (0.0%) | 0 (0.0%) |
| Law Enforcement | 0 (0.0%) | 0 (0.0%) |
| Food Preparation & Serving | 0 (0.0%) | 3 (100.0%) |
| Cleaning & Maintenance | 6 (75.0%) | 2 (25.0%) |
| Personal Care & Service | 0 (0.0%) | 9 (100.0%) |
| Total (Category) | 6 (30.0%) | 14 (70.0%) |
| Total (Overall) | 69 (45.7%) | 82 (54.3%) |
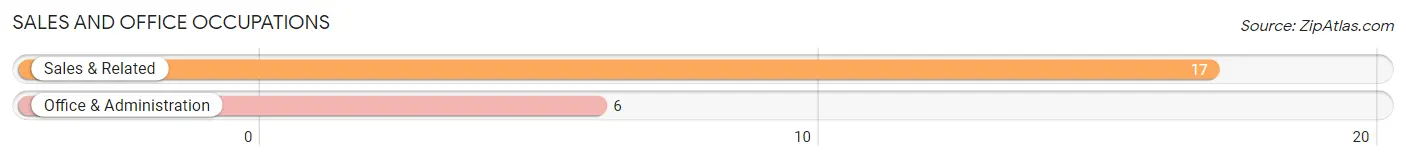
Sales and Office Occupations
The most common Sales and Office occupations in Brevig Mission are Sales & Related (17 | 11.3%), and Office & Administration (6 | 4.0%).
Sales and Office Occupations by Sex
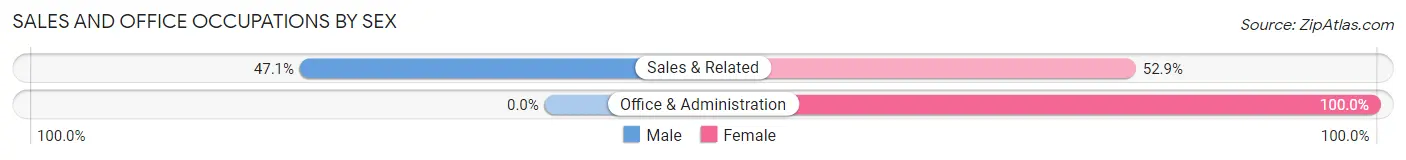
| Occupation | Male | Female |
| Sales & Related | 8 (47.1%) | 9 (52.9%) |
| Office & Administration | 0 (0.0%) | 6 (100.0%) |
| Total (Category) | 8 (34.8%) | 15 (65.2%) |
| Total (Overall) | 69 (45.7%) | 82 (54.3%) |
Natural Resources, Construction and Maintenance Occupations
The most common Natural Resources, Construction and Maintenance occupations in Brevig Mission are , and Installation, Maintenance & Repair (16 | 10.6%).
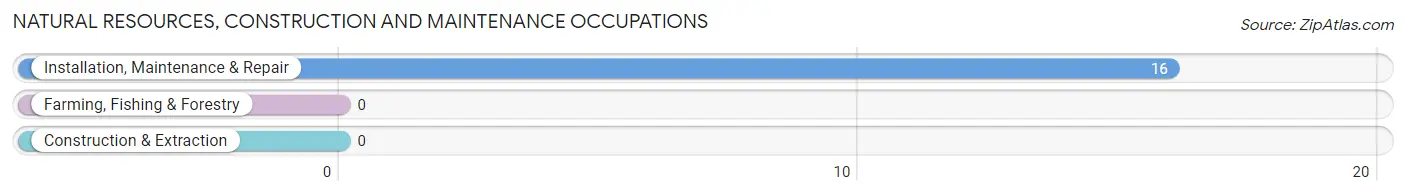
Natural Resources, Construction and Maintenance Occupations by Sex
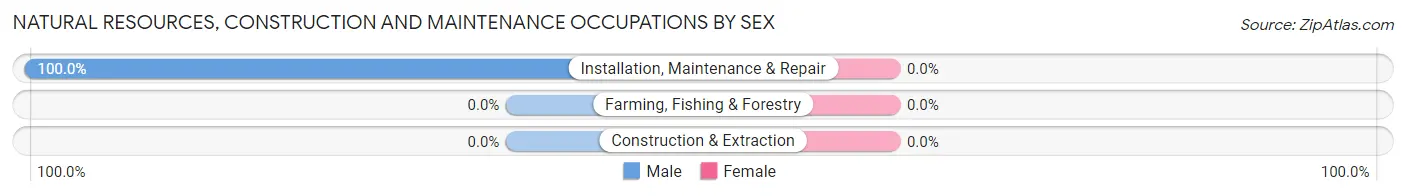
| Occupation | Male | Female |
| Farming, Fishing & Forestry | 0 (0.0%) | 0 (0.0%) |
| Construction & Extraction | 0 (0.0%) | 0 (0.0%) |
| Installation, Maintenance & Repair | 16 (100.0%) | 0 (0.0%) |
| Total (Category) | 16 (100.0%) | 0 (0.0%) |
| Total (Overall) | 69 (45.7%) | 82 (54.3%) |
Production, Transportation and Moving Occupations
The most common Production, Transportation and Moving occupations in Brevig Mission are Production (17 | 11.3%), Transportation (9 | 6.0%), and Material Moving (2 | 1.3%).
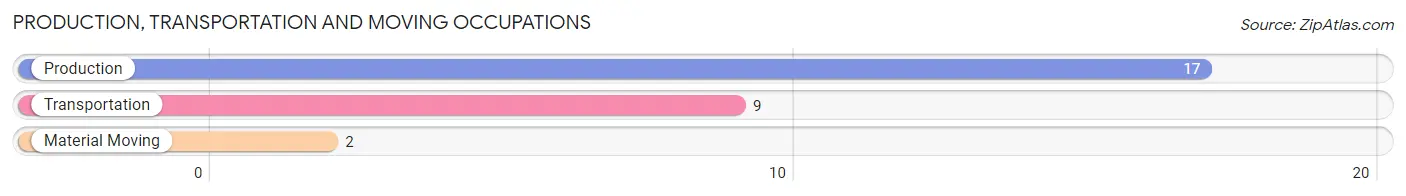
Production, Transportation and Moving Occupations by Sex
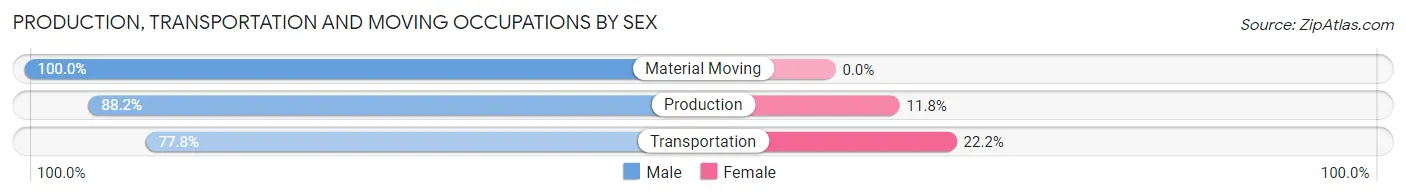
| Occupation | Male | Female |
| Production | 15 (88.2%) | 2 (11.8%) |
| Transportation | 7 (77.8%) | 2 (22.2%) |
| Material Moving | 2 (100.0%) | 0 (0.0%) |
| Total (Category) | 24 (85.7%) | 4 (14.3%) |
| Total (Overall) | 69 (45.7%) | 82 (54.3%) |
Employment Industries by Sex in Brevig Mission
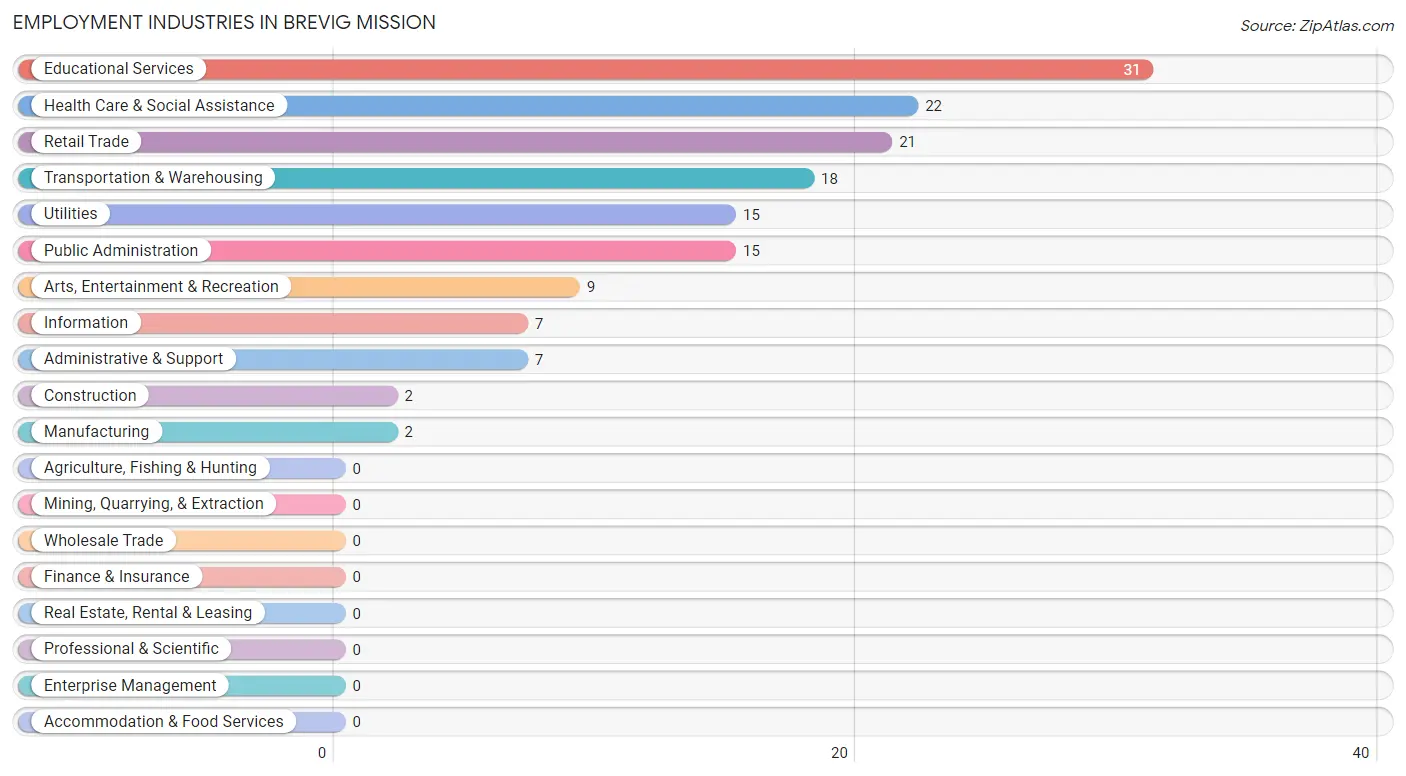
Employment Industries in Brevig Mission
The major employment industries in Brevig Mission include Educational Services (31 | 20.5%), Health Care & Social Assistance (22 | 14.6%), Retail Trade (21 | 13.9%), Transportation & Warehousing (18 | 11.9%), and Utilities (15 | 9.9%).
Employment Industries by Sex in Brevig Mission
The Brevig Mission industries that see more men than women are Construction (100.0%), Utilities (100.0%), and Information (100.0%), whereas the industries that tend to have a higher number of women are Manufacturing (100.0%), Health Care & Social Assistance (100.0%), and Arts, Entertainment & Recreation (100.0%).
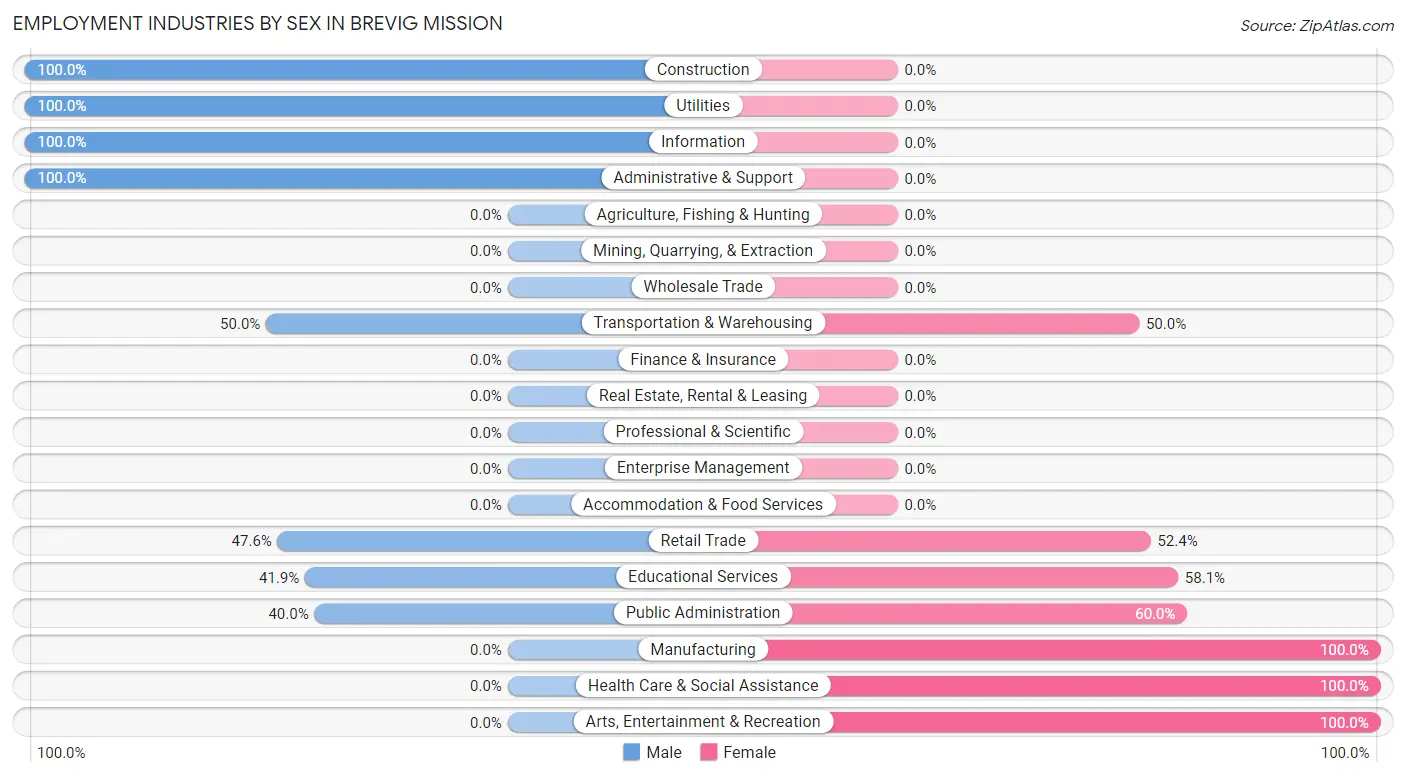
| Industry | Male | Female |
| Agriculture, Fishing & Hunting | 0 (0.0%) | 0 (0.0%) |
| Mining, Quarrying, & Extraction | 0 (0.0%) | 0 (0.0%) |
| Construction | 2 (100.0%) | 0 (0.0%) |
| Manufacturing | 0 (0.0%) | 2 (100.0%) |
| Wholesale Trade | 0 (0.0%) | 0 (0.0%) |
| Retail Trade | 10 (47.6%) | 11 (52.4%) |
| Transportation & Warehousing | 9 (50.0%) | 9 (50.0%) |
| Utilities | 15 (100.0%) | 0 (0.0%) |
| Information | 7 (100.0%) | 0 (0.0%) |
| Finance & Insurance | 0 (0.0%) | 0 (0.0%) |
| Real Estate, Rental & Leasing | 0 (0.0%) | 0 (0.0%) |
| Professional & Scientific | 0 (0.0%) | 0 (0.0%) |
| Enterprise Management | 0 (0.0%) | 0 (0.0%) |
| Administrative & Support | 7 (100.0%) | 0 (0.0%) |
| Educational Services | 13 (41.9%) | 18 (58.1%) |
| Health Care & Social Assistance | 0 (0.0%) | 22 (100.0%) |
| Arts, Entertainment & Recreation | 0 (0.0%) | 9 (100.0%) |
| Accommodation & Food Services | 0 (0.0%) | 0 (0.0%) |
| Public Administration | 6 (40.0%) | 9 (60.0%) |
| Total | 69 (45.7%) | 82 (54.3%) |
Education in Brevig Mission
School Enrollment in Brevig Mission
The most common levels of schooling among the 223 students in Brevig Mission are middle school (62 | 27.8%), elementary school (61 | 27.4%), and kindergarten (41 | 18.4%).
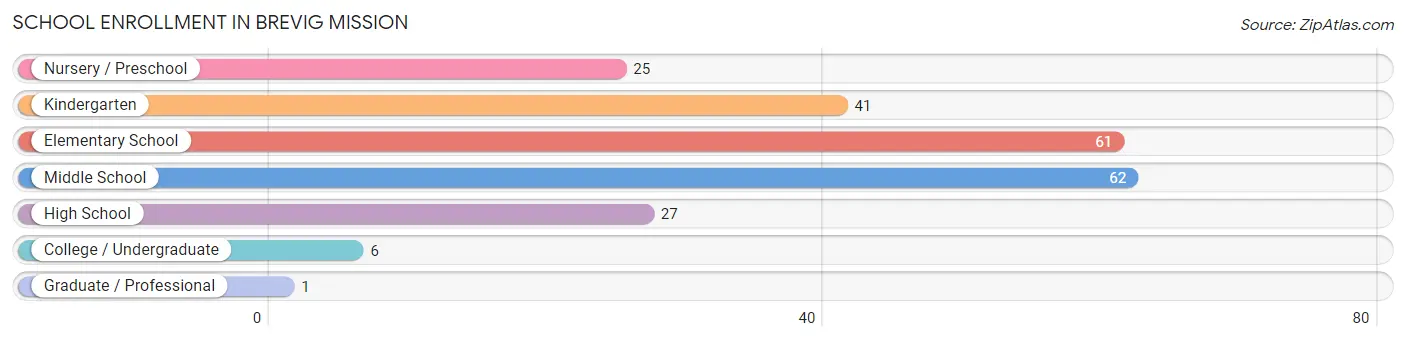
| School Level | # Students | % Students |
| Nursery / Preschool | 25 | 11.2% |
| Kindergarten | 41 | 18.4% |
| Elementary School | 61 | 27.4% |
| Middle School | 62 | 27.8% |
| High School | 27 | 12.1% |
| College / Undergraduate | 6 | 2.7% |
| Graduate / Professional | 1 | 0.4% |
| Total | 223 | 100.0% |
School Enrollment by Age by Funding Source in Brevig Mission
Out of a total of 223 students who are enrolled in schools in Brevig Mission, 5 (2.2%) attend a private institution, while the remaining 218 (97.8%) are enrolled in public schools. The age group of 15 to 17 year olds has the highest likelihood of being enrolled in private schools, with 2 (10.5% in the age bracket) enrolled. Conversely, the age group of 3 to 4 year olds has the lowest likelihood of being enrolled in a private school, with 25 (100.0% in the age bracket) attending a public institution.
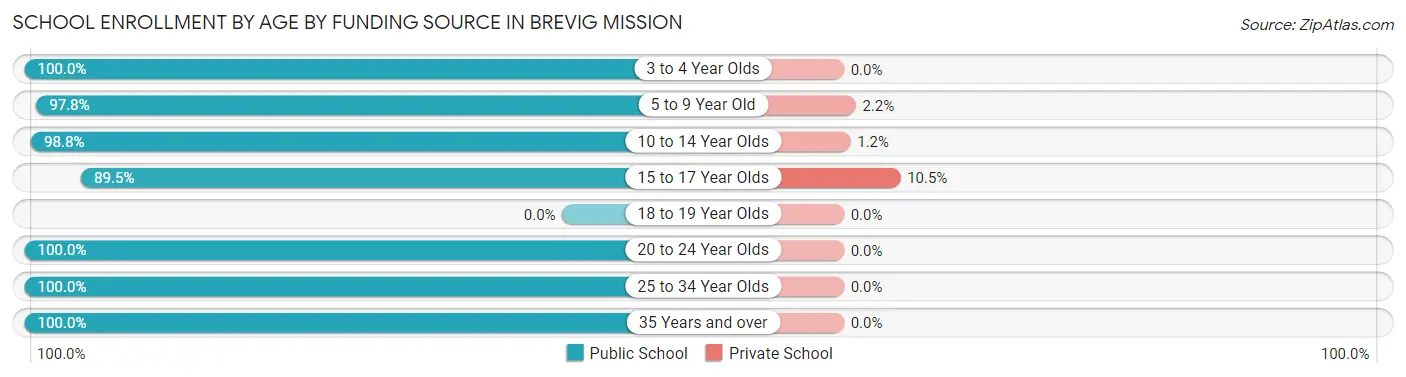
| Age Bracket | Public School | Private School |
| 3 to 4 Year Olds | 25 (100.0%) | 0 (0.0%) |
| 5 to 9 Year Old | 89 (97.8%) | 2 (2.2%) |
| 10 to 14 Year Olds | 80 (98.8%) | 1 (1.2%) |
| 15 to 17 Year Olds | 17 (89.5%) | 2 (10.5%) |
| 18 to 19 Year Olds | 0 (0.0%) | 0 (0.0%) |
| 20 to 24 Year Olds | 1 (100.0%) | 0 (0.0%) |
| 25 to 34 Year Olds | 2 (100.0%) | 0 (0.0%) |
| 35 Years and over | 4 (100.0%) | 0 (0.0%) |
| Total | 218 (97.8%) | 5 (2.2%) |
Educational Attainment by Field of Study in Brevig Mission
Education (6 | 40.0%), science & technology (3 | 20.0%), social sciences (2 | 13.3%), arts & humanities (2 | 13.3%), and literature & languages (1 | 6.7%) are the most common fields of study among 15 individuals in Brevig Mission who have obtained a bachelor's degree or higher.
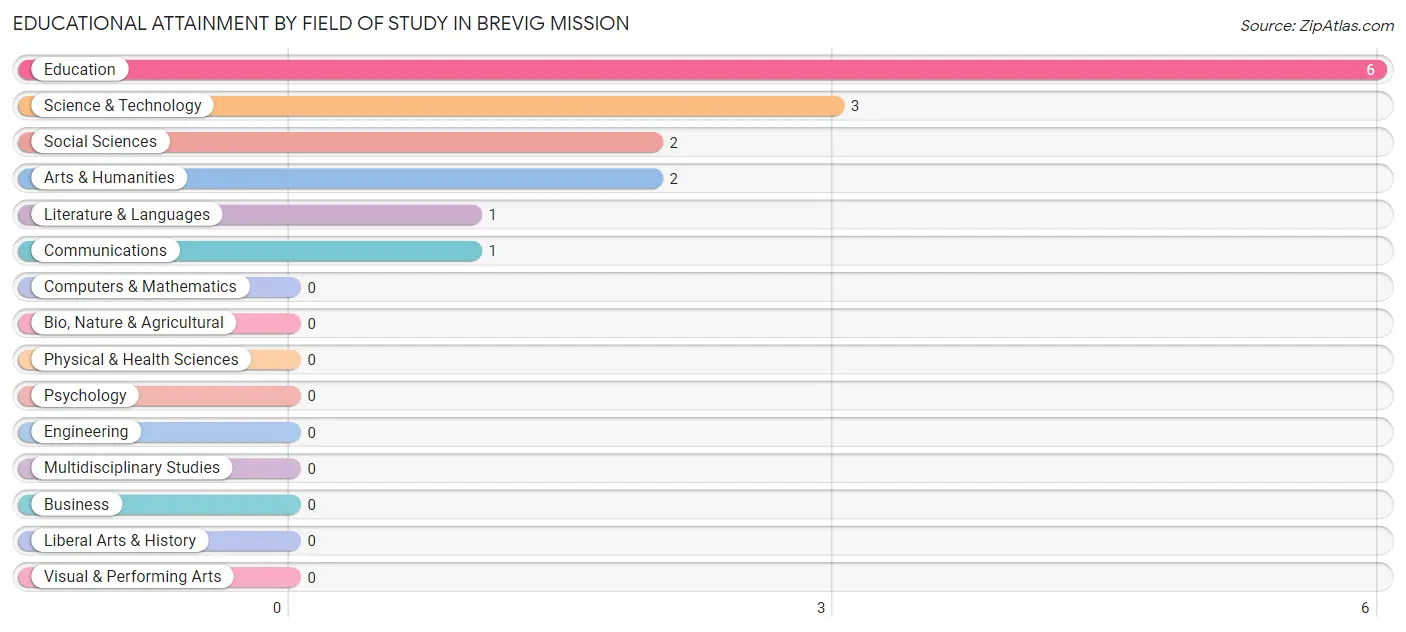
| Field of Study | # Graduates | % Graduates |
| Computers & Mathematics | 0 | 0.0% |
| Bio, Nature & Agricultural | 0 | 0.0% |
| Physical & Health Sciences | 0 | 0.0% |
| Psychology | 0 | 0.0% |
| Social Sciences | 2 | 13.3% |
| Engineering | 0 | 0.0% |
| Multidisciplinary Studies | 0 | 0.0% |
| Science & Technology | 3 | 20.0% |
| Business | 0 | 0.0% |
| Education | 6 | 40.0% |
| Literature & Languages | 1 | 6.7% |
| Liberal Arts & History | 0 | 0.0% |
| Visual & Performing Arts | 0 | 0.0% |
| Communications | 1 | 6.7% |
| Arts & Humanities | 2 | 13.3% |
| Total | 15 | 100.0% |
Transportation & Commute in Brevig Mission
Vehicle Availability by Sex in Brevig Mission
The most prevalent vehicle ownership categories in Brevig Mission are males with no vehicle (60, accounting for 87.0%) and females with no vehicle (75, making up 73.2%).
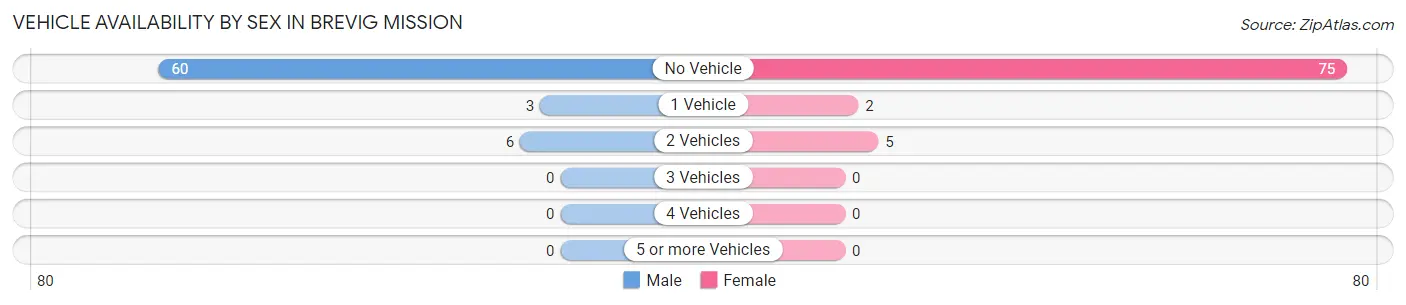
| Vehicles Available | Male | Female |
| No Vehicle | 60 (87.0%) | 75 (91.5%) |
| 1 Vehicle | 3 (4.3%) | 2 (2.4%) |
| 2 Vehicles | 6 (8.7%) | 5 (6.1%) |
| 3 Vehicles | 0 (0.0%) | 0 (0.0%) |
| 4 Vehicles | 0 (0.0%) | 0 (0.0%) |
| 5 or more Vehicles | 0 (0.0%) | 0 (0.0%) |
| Total | 69 (100.0%) | 82 (100.0%) |
Commute Time in Brevig Mission
The most frequently occuring commute durations in Brevig Mission are less than 5 minutes (92 commuters, 60.9%), 5 to 9 minutes (49 commuters, 32.5%), and 10 to 14 minutes (6 commuters, 4.0%).
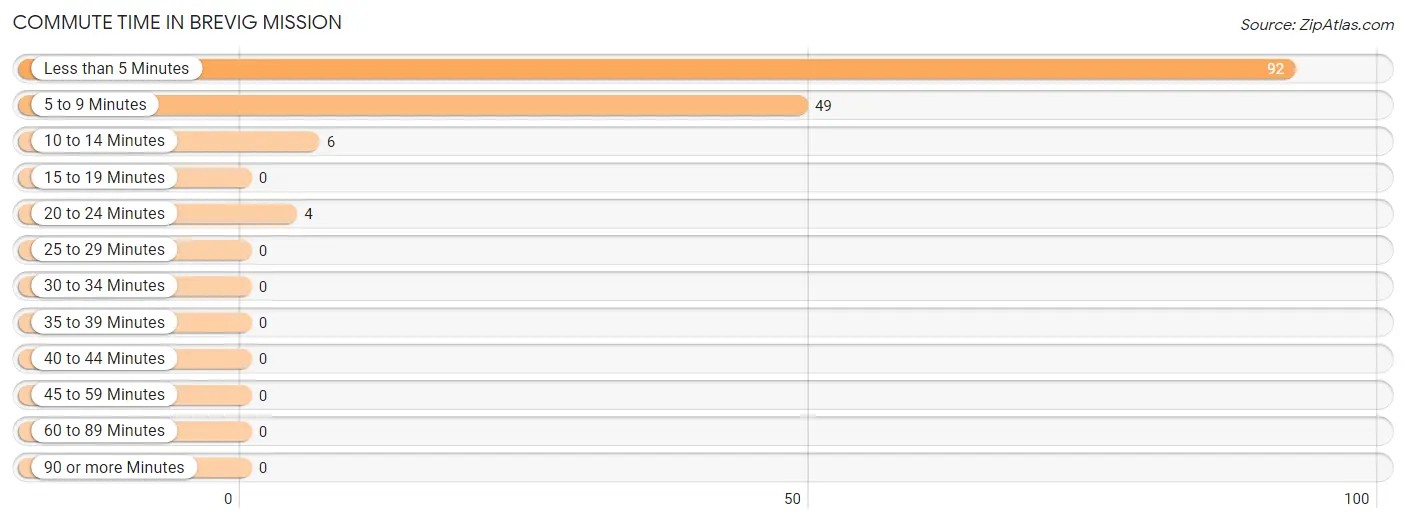
| Commute Time | # Commuters | % Commuters |
| Less than 5 Minutes | 92 | 60.9% |
| 5 to 9 Minutes | 49 | 32.5% |
| 10 to 14 Minutes | 6 | 4.0% |
| 15 to 19 Minutes | 0 | 0.0% |
| 20 to 24 Minutes | 4 | 2.6% |
| 25 to 29 Minutes | 0 | 0.0% |
| 30 to 34 Minutes | 0 | 0.0% |
| 35 to 39 Minutes | 0 | 0.0% |
| 40 to 44 Minutes | 0 | 0.0% |
| 45 to 59 Minutes | 0 | 0.0% |
| 60 to 89 Minutes | 0 | 0.0% |
| 90 or more Minutes | 0 | 0.0% |
Commute Time by Sex in Brevig Mission
The most common commute times in Brevig Mission are less than 5 minutes (43 commuters, 62.3%) for males and less than 5 minutes (49 commuters, 59.8%) for females.
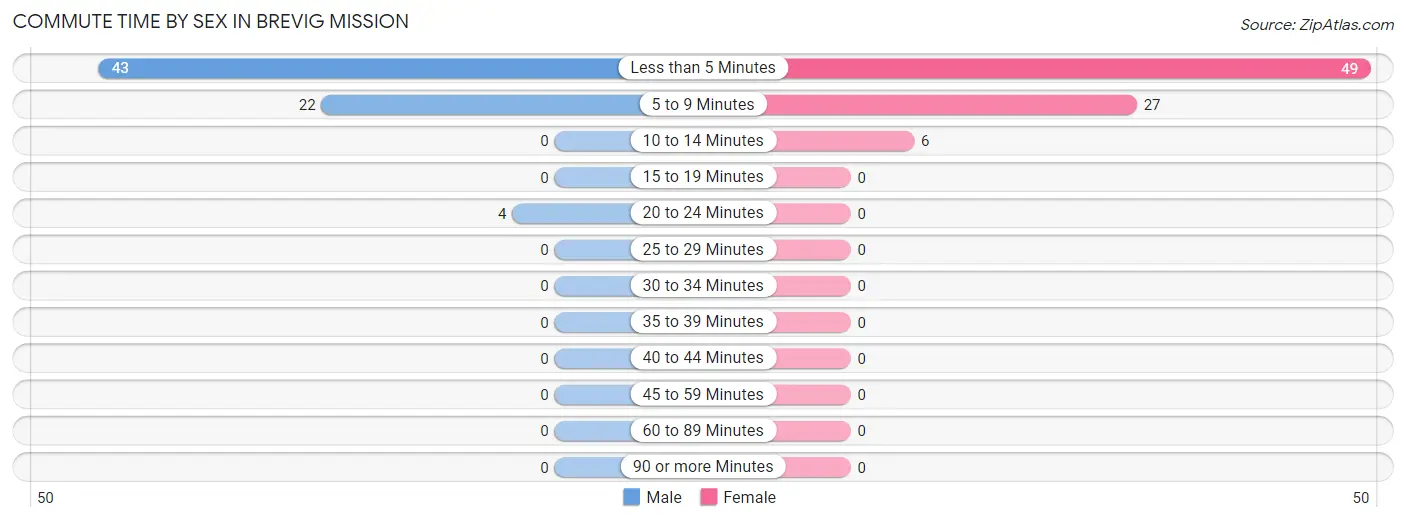
| Commute Time | Male | Female |
| Less than 5 Minutes | 43 (62.3%) | 49 (59.8%) |
| 5 to 9 Minutes | 22 (31.9%) | 27 (32.9%) |
| 10 to 14 Minutes | 0 (0.0%) | 6 (7.3%) |
| 15 to 19 Minutes | 0 (0.0%) | 0 (0.0%) |
| 20 to 24 Minutes | 4 (5.8%) | 0 (0.0%) |
| 25 to 29 Minutes | 0 (0.0%) | 0 (0.0%) |
| 30 to 34 Minutes | 0 (0.0%) | 0 (0.0%) |
| 35 to 39 Minutes | 0 (0.0%) | 0 (0.0%) |
| 40 to 44 Minutes | 0 (0.0%) | 0 (0.0%) |
| 45 to 59 Minutes | 0 (0.0%) | 0 (0.0%) |
| 60 to 89 Minutes | 0 (0.0%) | 0 (0.0%) |
| 90 or more Minutes | 0 (0.0%) | 0 (0.0%) |
Time of Departure to Work by Sex in Brevig Mission
The most frequent times of departure to work in Brevig Mission are 8:30 AM to 8:59 AM (31, 44.9%) for males and 8:30 AM to 8:59 AM (26, 31.7%) for females.
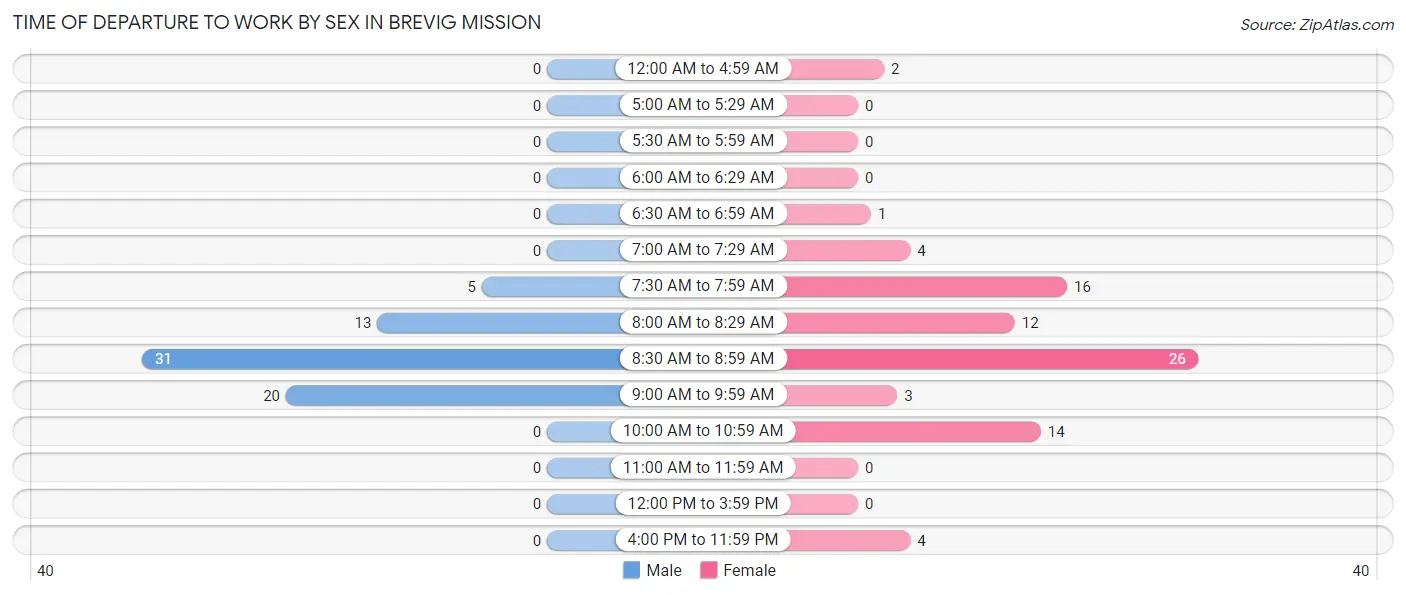
| Time of Departure | Male | Female |
| 12:00 AM to 4:59 AM | 0 (0.0%) | 2 (2.4%) |
| 5:00 AM to 5:29 AM | 0 (0.0%) | 0 (0.0%) |
| 5:30 AM to 5:59 AM | 0 (0.0%) | 0 (0.0%) |
| 6:00 AM to 6:29 AM | 0 (0.0%) | 0 (0.0%) |
| 6:30 AM to 6:59 AM | 0 (0.0%) | 1 (1.2%) |
| 7:00 AM to 7:29 AM | 0 (0.0%) | 4 (4.9%) |
| 7:30 AM to 7:59 AM | 5 (7.2%) | 16 (19.5%) |
| 8:00 AM to 8:29 AM | 13 (18.8%) | 12 (14.6%) |
| 8:30 AM to 8:59 AM | 31 (44.9%) | 26 (31.7%) |
| 9:00 AM to 9:59 AM | 20 (29.0%) | 3 (3.7%) |
| 10:00 AM to 10:59 AM | 0 (0.0%) | 14 (17.1%) |
| 11:00 AM to 11:59 AM | 0 (0.0%) | 0 (0.0%) |
| 12:00 PM to 3:59 PM | 0 (0.0%) | 0 (0.0%) |
| 4:00 PM to 11:59 PM | 0 (0.0%) | 4 (4.9%) |
| Total | 69 (100.0%) | 82 (100.0%) |
Housing Occupancy in Brevig Mission
Occupancy by Ownership in Brevig Mission
Of the total 129 dwellings in Brevig Mission, owner-occupied units account for 103 (79.8%), while renter-occupied units make up 26 (20.2%).
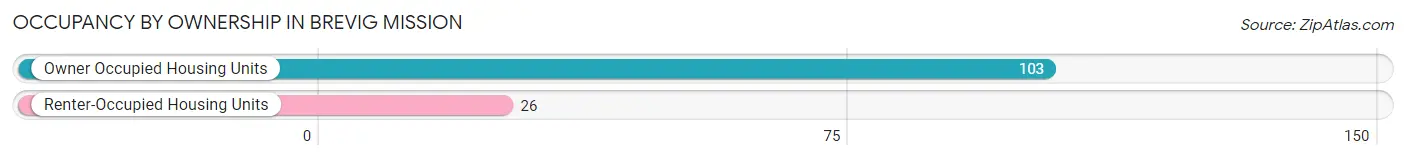
| Occupancy | # Housing Units | % Housing Units |
| Owner Occupied Housing Units | 103 | 79.8% |
| Renter-Occupied Housing Units | 26 | 20.2% |
| Total Occupied Housing Units | 129 | 100.0% |
Occupancy by Household Size in Brevig Mission
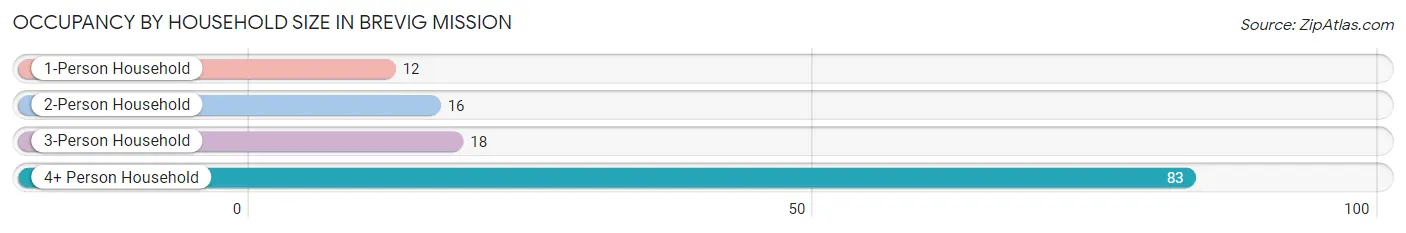
| Household Size | # Housing Units | % Housing Units |
| 1-Person Household | 12 | 9.3% |
| 2-Person Household | 16 | 12.4% |
| 3-Person Household | 18 | 14.0% |
| 4+ Person Household | 83 | 64.3% |
| Total Housing Units | 129 | 100.0% |
Occupancy by Ownership by Household Size in Brevig Mission
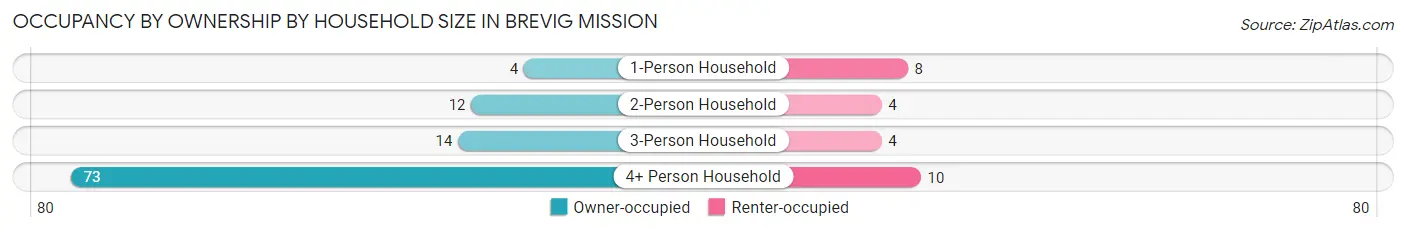
| Household Size | Owner-occupied | Renter-occupied |
| 1-Person Household | 4 (33.3%) | 8 (66.7%) |
| 2-Person Household | 12 (75.0%) | 4 (25.0%) |
| 3-Person Household | 14 (77.8%) | 4 (22.2%) |
| 4+ Person Household | 73 (87.9%) | 10 (12.0%) |
| Total Housing Units | 103 (79.8%) | 26 (20.2%) |
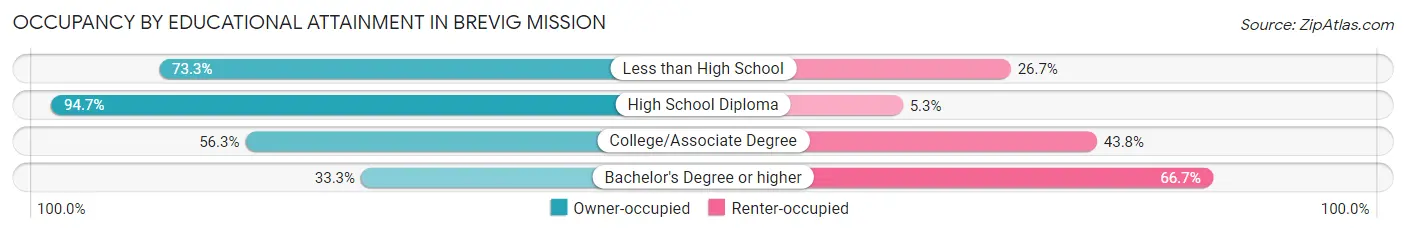
Occupancy by Educational Attainment in Brevig Mission
| Household Size | Owner-occupied | Renter-occupied |
| Less than High School | 11 (73.3%) | 4 (26.7%) |
| High School Diploma | 72 (94.7%) | 4 (5.3%) |
| College/Associate Degree | 18 (56.2%) | 14 (43.8%) |
| Bachelor's Degree or higher | 2 (33.3%) | 4 (66.7%) |
Occupancy by Age of Householder in Brevig Mission
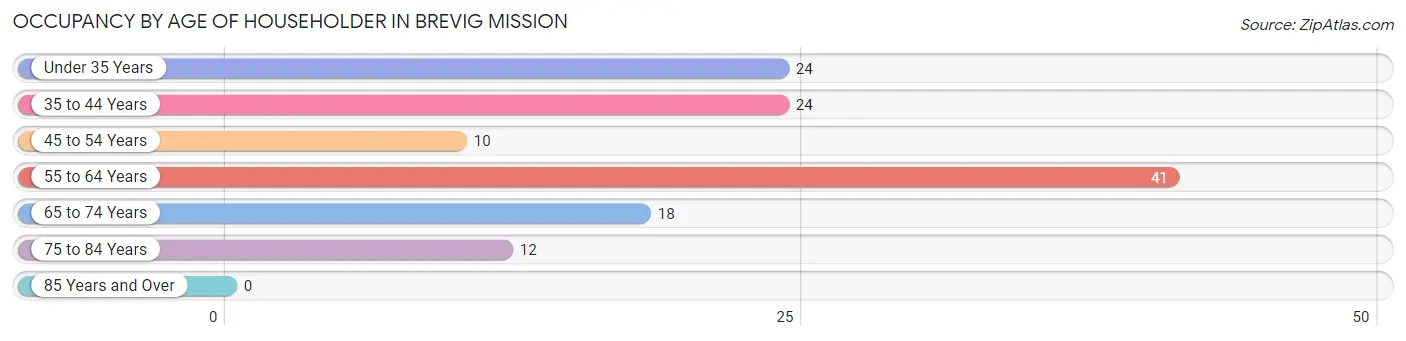
| Age Bracket | # Households | % Households |
| Under 35 Years | 24 | 18.6% |
| 35 to 44 Years | 24 | 18.6% |
| 45 to 54 Years | 10 | 7.7% |
| 55 to 64 Years | 41 | 31.8% |
| 65 to 74 Years | 18 | 14.0% |
| 75 to 84 Years | 12 | 9.3% |
| 85 Years and Over | 0 | 0.0% |
| Total | 129 | 100.0% |
Housing Finances in Brevig Mission
Median Income by Occupancy in Brevig Mission
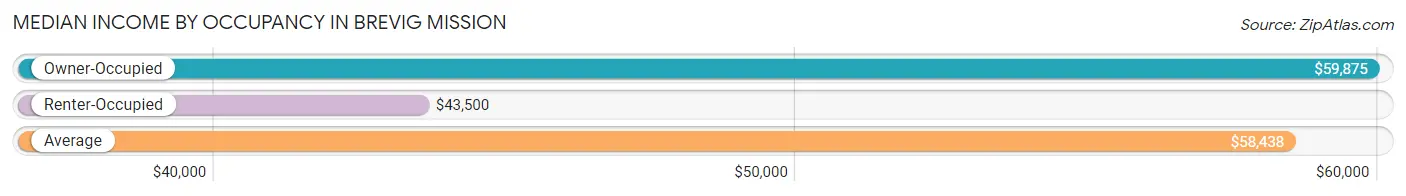
| Occupancy Type | # Households | Median Income |
| Owner-Occupied | 103 (79.8%) | $59,875 |
| Renter-Occupied | 26 (20.2%) | $43,500 |
| Average | 129 (100.0%) | $58,438 |
Occupancy by Householder Income Bracket in Brevig Mission
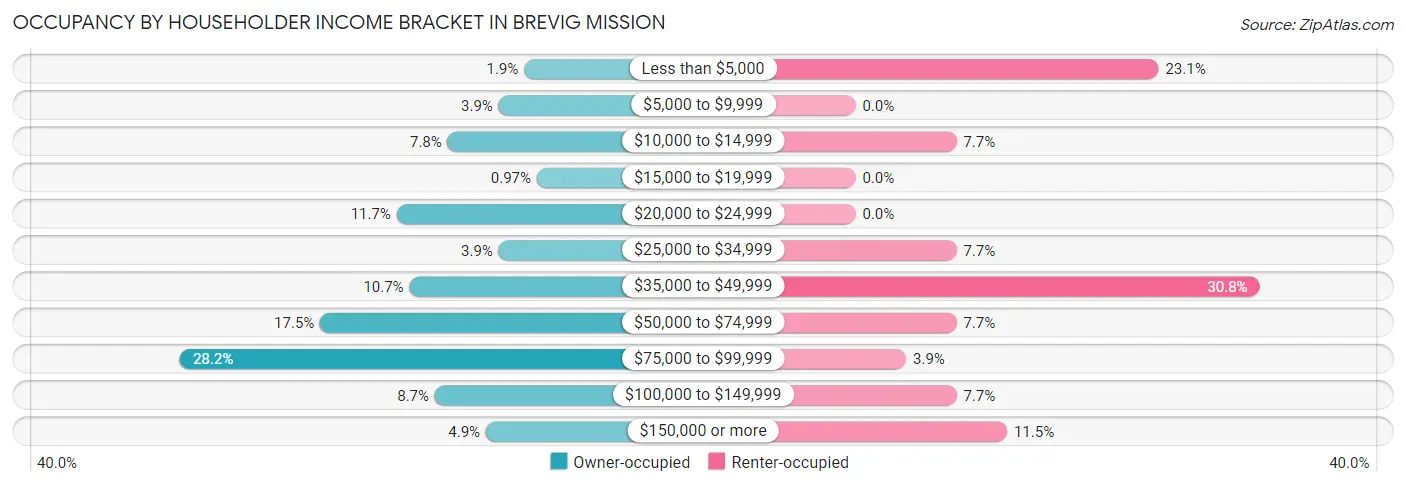
| Income Bracket | Owner-occupied | Renter-occupied |
| Less than $5,000 | 2 (1.9%) | 6 (23.1%) |
| $5,000 to $9,999 | 4 (3.9%) | 0 (0.0%) |
| $10,000 to $14,999 | 8 (7.8%) | 2 (7.7%) |
| $15,000 to $19,999 | 1 (1.0%) | 0 (0.0%) |
| $20,000 to $24,999 | 12 (11.7%) | 0 (0.0%) |
| $25,000 to $34,999 | 4 (3.9%) | 2 (7.7%) |
| $35,000 to $49,999 | 11 (10.7%) | 8 (30.8%) |
| $50,000 to $74,999 | 18 (17.5%) | 2 (7.7%) |
| $75,000 to $99,999 | 29 (28.2%) | 1 (3.8%) |
| $100,000 to $149,999 | 9 (8.7%) | 2 (7.7%) |
| $150,000 or more | 5 (4.9%) | 3 (11.5%) |
| Total | 103 (100.0%) | 26 (100.0%) |
Monthly Housing Cost Tiers in Brevig Mission
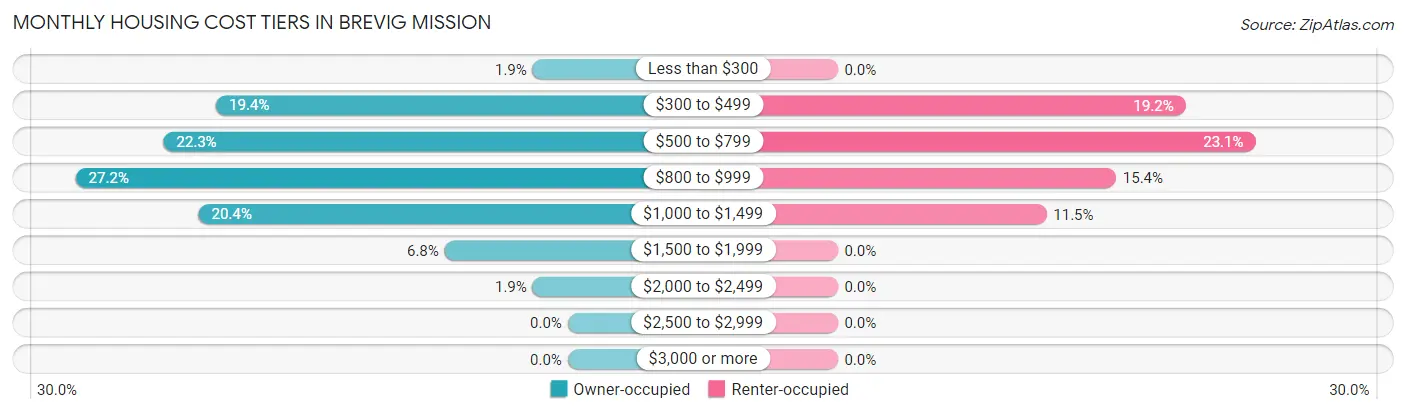
| Monthly Cost | Owner-occupied | Renter-occupied |
| Less than $300 | 2 (1.9%) | 0 (0.0%) |
| $300 to $499 | 20 (19.4%) | 5 (19.2%) |
| $500 to $799 | 23 (22.3%) | 6 (23.1%) |
| $800 to $999 | 28 (27.2%) | 4 (15.4%) |
| $1,000 to $1,499 | 21 (20.4%) | 3 (11.5%) |
| $1,500 to $1,999 | 7 (6.8%) | 0 (0.0%) |
| $2,000 to $2,499 | 2 (1.9%) | 0 (0.0%) |
| $2,500 to $2,999 | 0 (0.0%) | 0 (0.0%) |
| $3,000 or more | 0 (0.0%) | 0 (0.0%) |
| Total | 103 (100.0%) | 26 (100.0%) |
Physical Housing Characteristics in Brevig Mission
Housing Structures in Brevig Mission
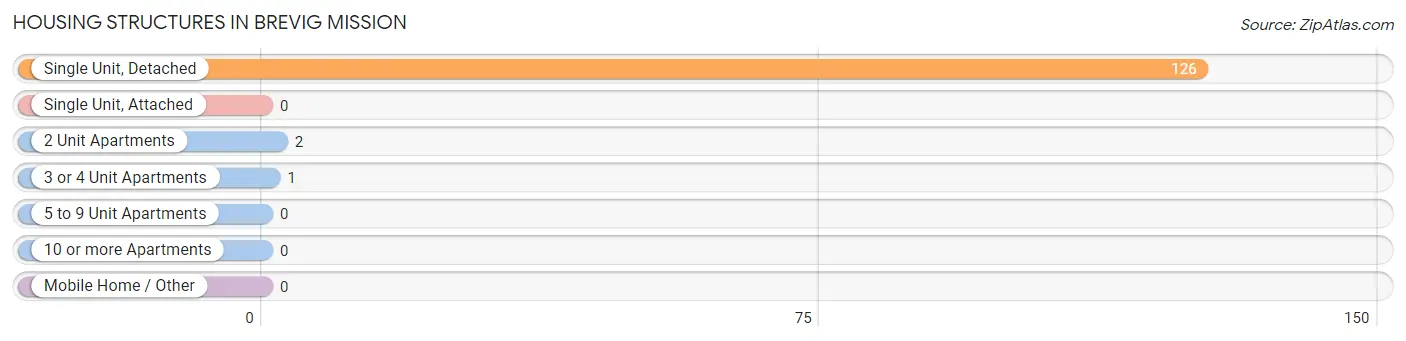
| Structure Type | # Housing Units | % Housing Units |
| Single Unit, Detached | 126 | 97.7% |
| Single Unit, Attached | 0 | 0.0% |
| 2 Unit Apartments | 2 | 1.5% |
| 3 or 4 Unit Apartments | 1 | 0.8% |
| 5 to 9 Unit Apartments | 0 | 0.0% |
| 10 or more Apartments | 0 | 0.0% |
| Mobile Home / Other | 0 | 0.0% |
| Total | 129 | 100.0% |
Housing Structures by Occupancy in Brevig Mission
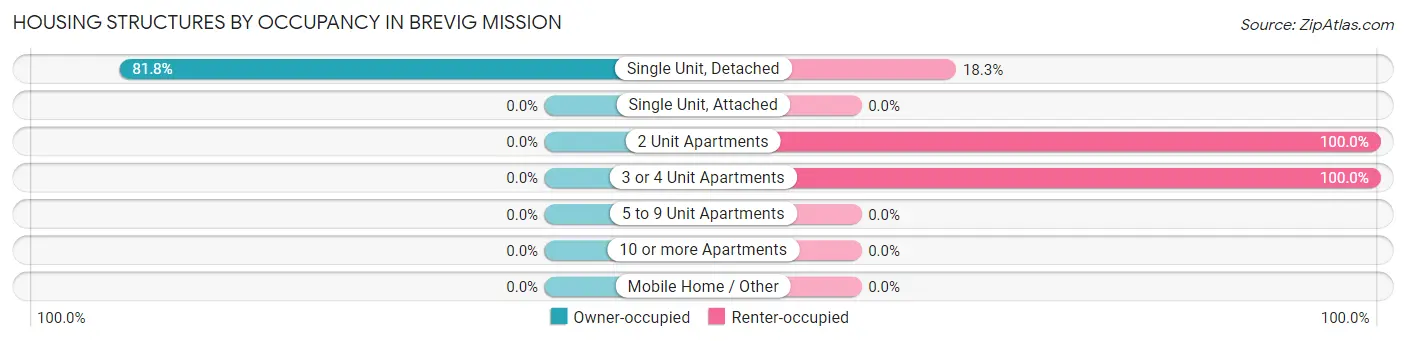
| Structure Type | Owner-occupied | Renter-occupied |
| Single Unit, Detached | 103 (81.8%) | 23 (18.2%) |
| Single Unit, Attached | 0 (0.0%) | 0 (0.0%) |
| 2 Unit Apartments | 0 (0.0%) | 2 (100.0%) |
| 3 or 4 Unit Apartments | 0 (0.0%) | 1 (100.0%) |
| 5 to 9 Unit Apartments | 0 (0.0%) | 0 (0.0%) |
| 10 or more Apartments | 0 (0.0%) | 0 (0.0%) |
| Mobile Home / Other | 0 (0.0%) | 0 (0.0%) |
| Total | 103 (79.8%) | 26 (20.2%) |
Housing Structures by Number of Rooms in Brevig Mission
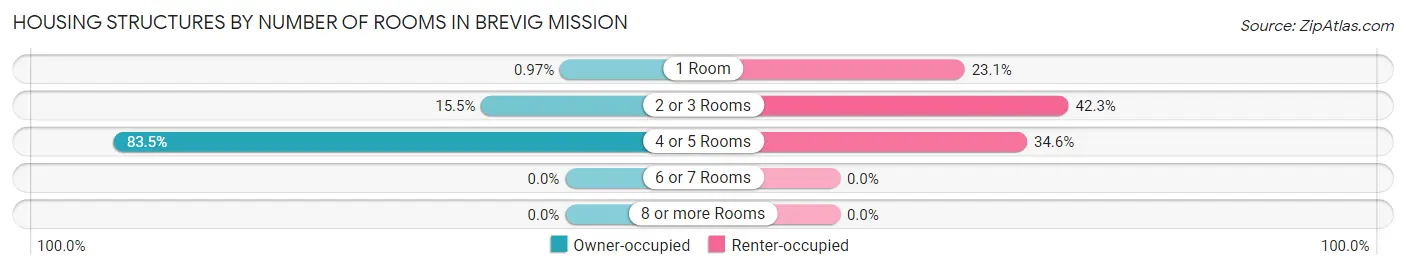
| Number of Rooms | Owner-occupied | Renter-occupied |
| 1 Room | 1 (1.0%) | 6 (23.1%) |
| 2 or 3 Rooms | 16 (15.5%) | 11 (42.3%) |
| 4 or 5 Rooms | 86 (83.5%) | 9 (34.6%) |
| 6 or 7 Rooms | 0 (0.0%) | 0 (0.0%) |
| 8 or more Rooms | 0 (0.0%) | 0 (0.0%) |
| Total | 103 (100.0%) | 26 (100.0%) |
Housing Structure by Heating Type in Brevig Mission
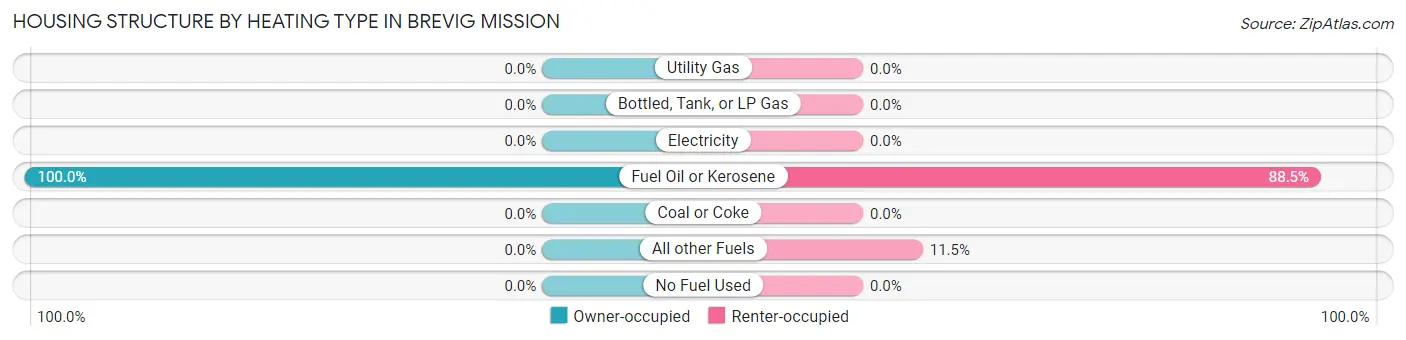
| Heating Type | Owner-occupied | Renter-occupied |
| Utility Gas | 0 (0.0%) | 0 (0.0%) |
| Bottled, Tank, or LP Gas | 0 (0.0%) | 0 (0.0%) |
| Electricity | 0 (0.0%) | 0 (0.0%) |
| Fuel Oil or Kerosene | 103 (100.0%) | 23 (88.5%) |
| Coal or Coke | 0 (0.0%) | 0 (0.0%) |
| All other Fuels | 0 (0.0%) | 3 (11.5%) |
| No Fuel Used | 0 (0.0%) | 0 (0.0%) |
| Total | 103 (100.0%) | 26 (100.0%) |
Household Vehicle Usage in Brevig Mission
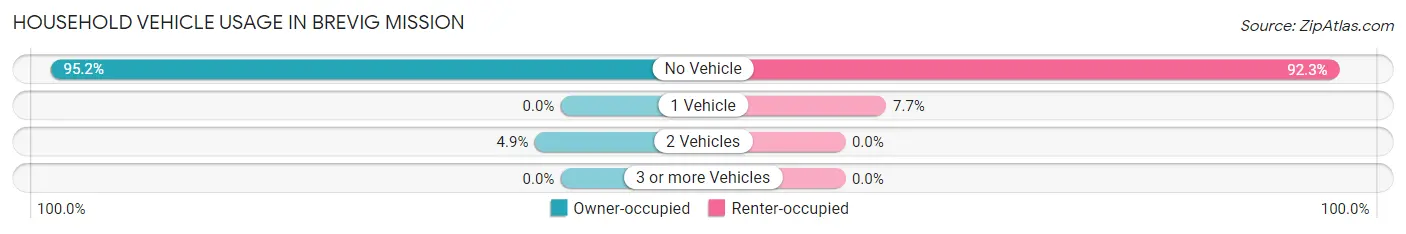
| Vehicles per Household | Owner-occupied | Renter-occupied |
| No Vehicle | 98 (95.2%) | 24 (92.3%) |
| 1 Vehicle | 0 (0.0%) | 2 (7.7%) |
| 2 Vehicles | 5 (4.9%) | 0 (0.0%) |
| 3 or more Vehicles | 0 (0.0%) | 0 (0.0%) |
| Total | 103 (100.0%) | 26 (100.0%) |
Real Estate & Mortgages in Brevig Mission
Real Estate and Mortgage Overview in Brevig Mission
| Characteristic | Without Mortgage | With Mortgage |
| Housing Units | 44 | 59 |
| Median Property Value | - | - |
| Median Household Income | $58,000 | $5 |
| Monthly Housing Costs | $500 | $0 |
| Real Estate Taxes | - | - |
Property Value by Mortgage Status in Brevig Mission
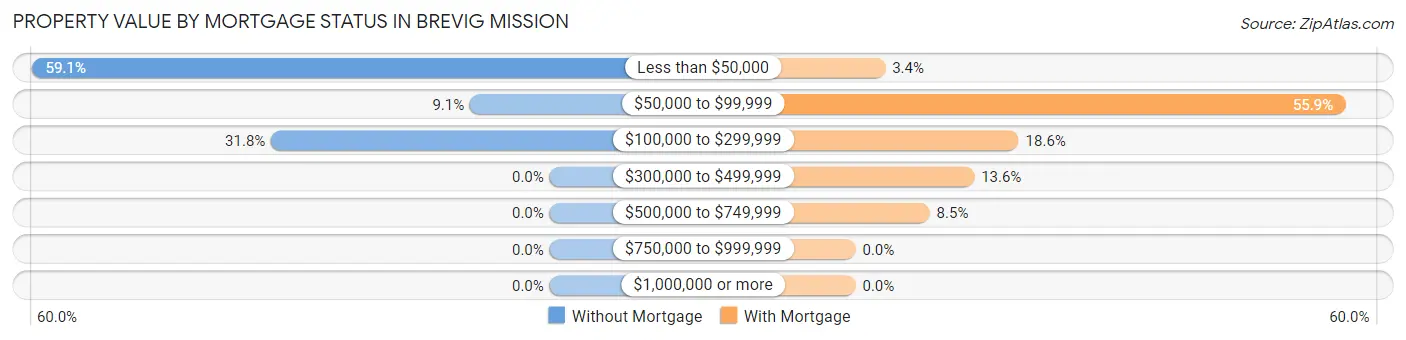
| Property Value | Without Mortgage | With Mortgage |
| Less than $50,000 | 26 (59.1%) | 2 (3.4%) |
| $50,000 to $99,999 | 4 (9.1%) | 33 (55.9%) |
| $100,000 to $299,999 | 14 (31.8%) | 11 (18.6%) |
| $300,000 to $499,999 | 0 (0.0%) | 8 (13.6%) |
| $500,000 to $749,999 | 0 (0.0%) | 5 (8.5%) |
| $750,000 to $999,999 | 0 (0.0%) | 0 (0.0%) |
| $1,000,000 or more | 0 (0.0%) | 0 (0.0%) |
| Total | 44 (100.0%) | 59 (100.0%) |
Household Income by Mortgage Status in Brevig Mission
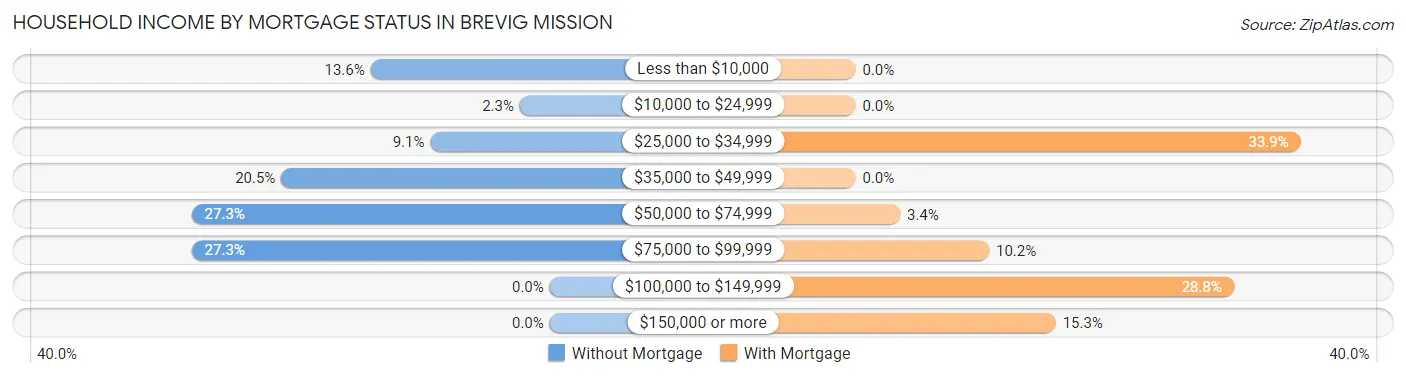
| Household Income | Without Mortgage | With Mortgage |
| Less than $10,000 | 6 (13.6%) | 0 (0.0%) |
| $10,000 to $24,999 | 1 (2.3%) | 0 (0.0%) |
| $25,000 to $34,999 | 4 (9.1%) | 20 (33.9%) |
| $35,000 to $49,999 | 9 (20.4%) | 0 (0.0%) |
| $50,000 to $74,999 | 12 (27.3%) | 2 (3.4%) |
| $75,000 to $99,999 | 12 (27.3%) | 6 (10.2%) |
| $100,000 to $149,999 | 0 (0.0%) | 17 (28.8%) |
| $150,000 or more | 0 (0.0%) | 9 (15.2%) |
| Total | 44 (100.0%) | 59 (100.0%) |
Property Value to Household Income Ratio in Brevig Mission
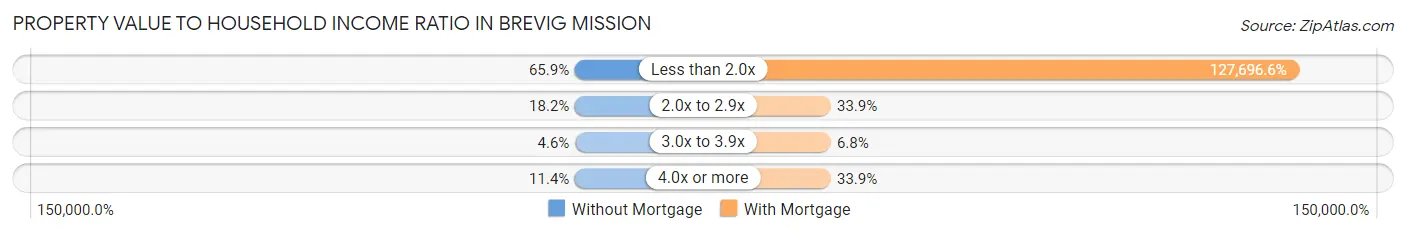
| Value-to-Income Ratio | Without Mortgage | With Mortgage |
| Less than 2.0x | 29 (65.9%) | 75,341 (127,696.6%) |
| 2.0x to 2.9x | 8 (18.2%) | 20 (33.9%) |
| 3.0x to 3.9x | 2 (4.5%) | 4 (6.8%) |
| 4.0x or more | 5 (11.4%) | 20 (33.9%) |
| Total | 44 (100.0%) | 59 (100.0%) |
Real Estate Taxes by Mortgage Status in Brevig Mission
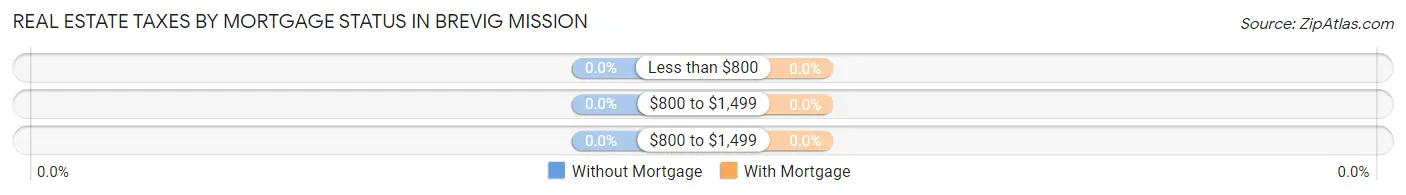
| Property Taxes | Without Mortgage | With Mortgage |
| Less than $800 | 0 (0.0%) | 0 (0.0%) |
| $800 to $1,499 | 0 (0.0%) | 0 (0.0%) |
| $800 to $1,499 | 0 (0.0%) | 0 (0.0%) |
| Total | 44 (100.0%) | 59 (100.0%) |
Health & Disability in Brevig Mission
Health Insurance Coverage by Age in Brevig Mission
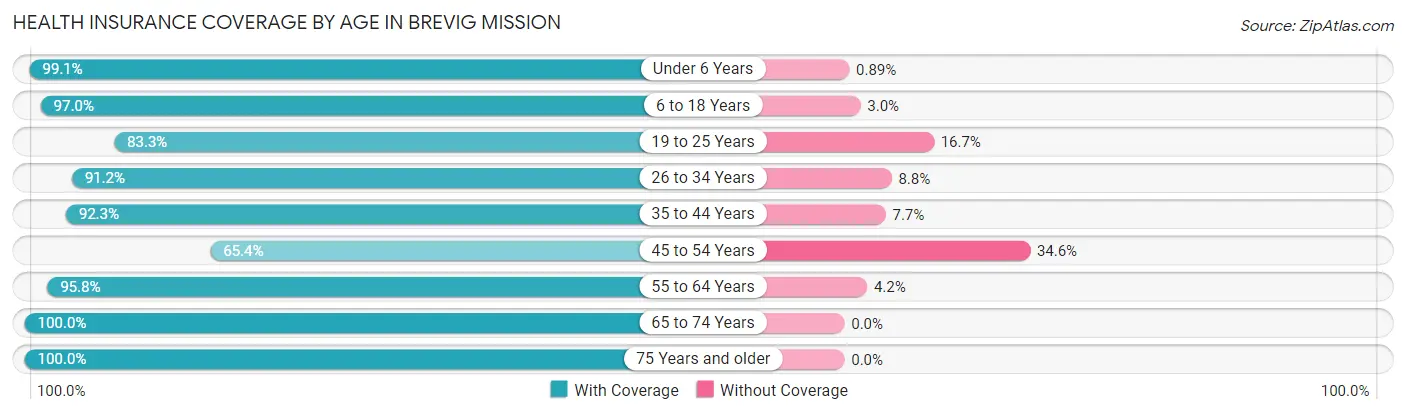
| Age Bracket | With Coverage | Without Coverage |
| Under 6 Years | 111 (99.1%) | 1 (0.9%) |
| 6 to 18 Years | 162 (97.0%) | 5 (3.0%) |
| 19 to 25 Years | 50 (83.3%) | 10 (16.7%) |
| 26 to 34 Years | 83 (91.2%) | 8 (8.8%) |
| 35 to 44 Years | 48 (92.3%) | 4 (7.7%) |
| 45 to 54 Years | 17 (65.4%) | 9 (34.6%) |
| 55 to 64 Years | 68 (95.8%) | 3 (4.2%) |
| 65 to 74 Years | 31 (100.0%) | 0 (0.0%) |
| 75 Years and older | 15 (100.0%) | 0 (0.0%) |
| Total | 585 (93.6%) | 40 (6.4%) |
Health Insurance Coverage by Citizenship Status in Brevig Mission
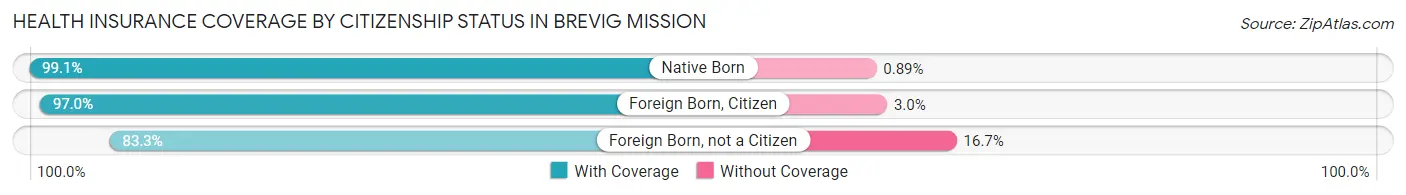
| Citizenship Status | With Coverage | Without Coverage |
| Native Born | 111 (99.1%) | 1 (0.9%) |
| Foreign Born, Citizen | 162 (97.0%) | 5 (3.0%) |
| Foreign Born, not a Citizen | 50 (83.3%) | 10 (16.7%) |
Health Insurance Coverage by Household Income in Brevig Mission
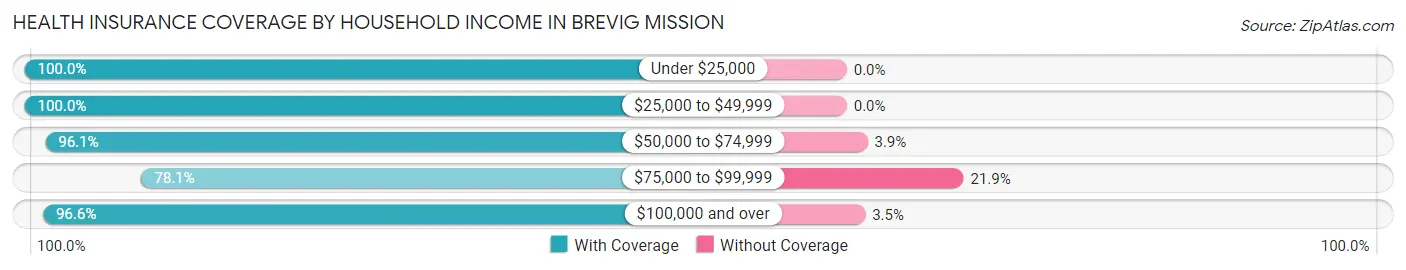
| Household Income | With Coverage | Without Coverage |
| Under $25,000 | 86 (100.0%) | 0 (0.0%) |
| $25,000 to $49,999 | 89 (100.0%) | 0 (0.0%) |
| $50,000 to $74,999 | 198 (96.1%) | 8 (3.9%) |
| $75,000 to $99,999 | 100 (78.1%) | 28 (21.9%) |
| $100,000 and over | 112 (96.6%) | 4 (3.5%) |
Public vs Private Health Insurance Coverage by Age in Brevig Mission
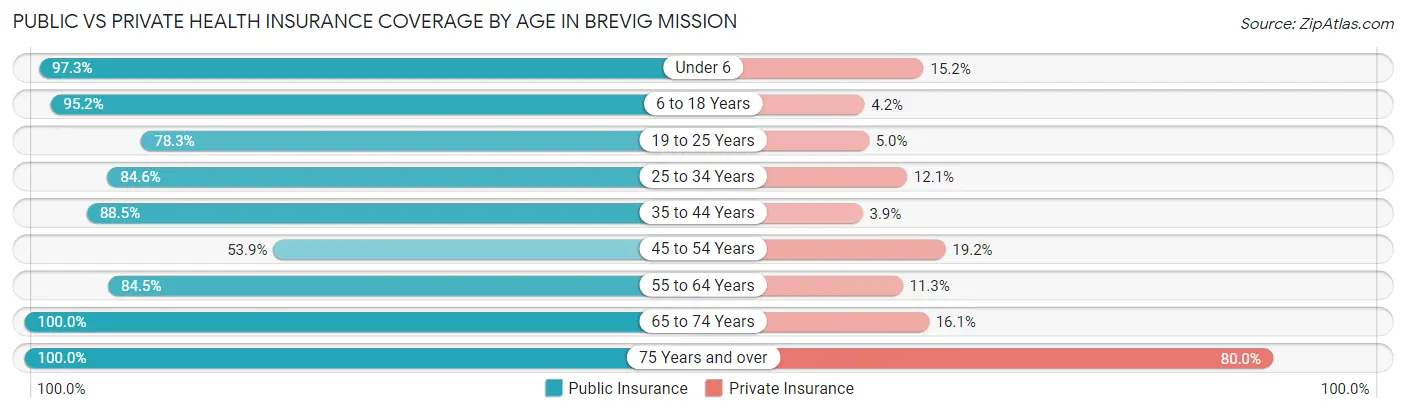
| Age Bracket | Public Insurance | Private Insurance |
| Under 6 | 109 (97.3%) | 17 (15.2%) |
| 6 to 18 Years | 159 (95.2%) | 7 (4.2%) |
| 19 to 25 Years | 47 (78.3%) | 3 (5.0%) |
| 25 to 34 Years | 77 (84.6%) | 11 (12.1%) |
| 35 to 44 Years | 46 (88.5%) | 2 (3.8%) |
| 45 to 54 Years | 14 (53.8%) | 5 (19.2%) |
| 55 to 64 Years | 60 (84.5%) | 8 (11.3%) |
| 65 to 74 Years | 31 (100.0%) | 5 (16.1%) |
| 75 Years and over | 15 (100.0%) | 12 (80.0%) |
| Total | 558 (89.3%) | 70 (11.2%) |
Disability Status by Sex by Age in Brevig Mission
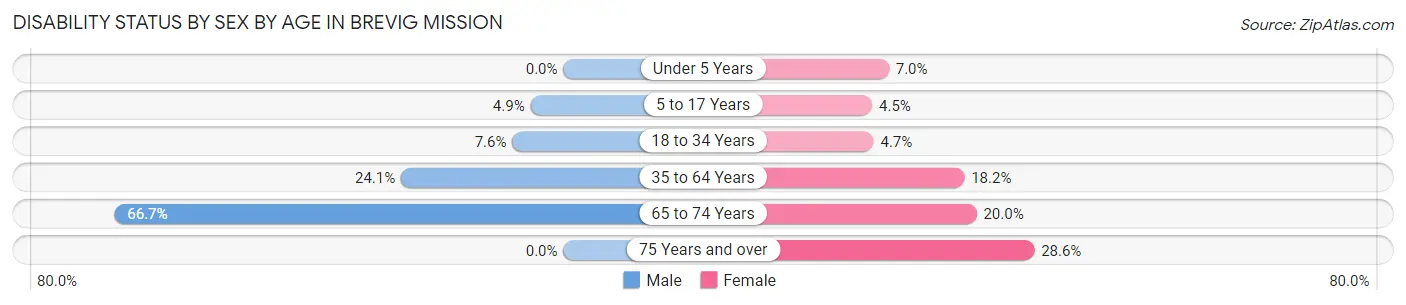
| Age Bracket | Male | Female |
| Under 5 Years | 0 (0.0%) | 3 (7.0%) |
| 5 to 17 Years | 4 (4.9%) | 5 (4.5%) |
| 18 to 34 Years | 5 (7.6%) | 4 (4.7%) |
| 35 to 64 Years | 20 (24.1%) | 12 (18.2%) |
| 65 to 74 Years | 14 (66.7%) | 2 (20.0%) |
| 75 Years and over | 0 (0.0%) | 4 (28.6%) |
Disability Class by Sex by Age in Brevig Mission
Disability Class: Hearing Difficulty
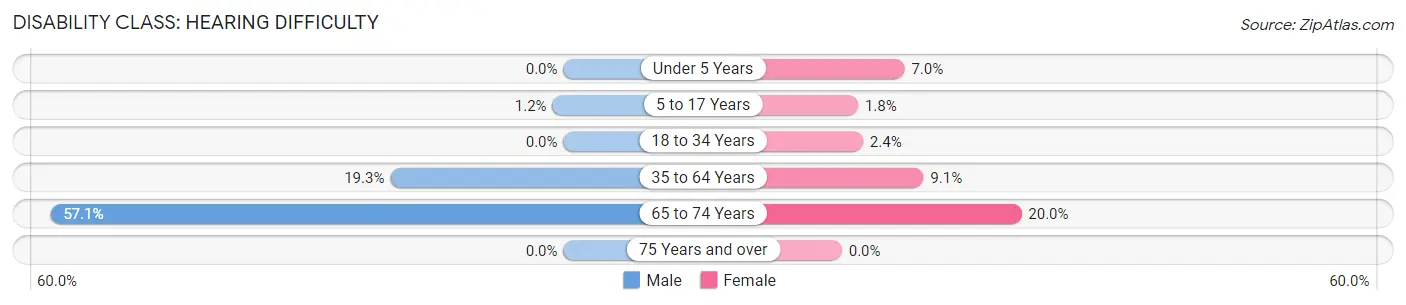
| Age Bracket | Male | Female |
| Under 5 Years | 0 (0.0%) | 3 (7.0%) |
| 5 to 17 Years | 1 (1.2%) | 2 (1.8%) |
| 18 to 34 Years | 0 (0.0%) | 2 (2.4%) |
| 35 to 64 Years | 16 (19.3%) | 6 (9.1%) |
| 65 to 74 Years | 12 (57.1%) | 2 (20.0%) |
| 75 Years and over | 0 (0.0%) | 0 (0.0%) |
Disability Class: Vision Difficulty
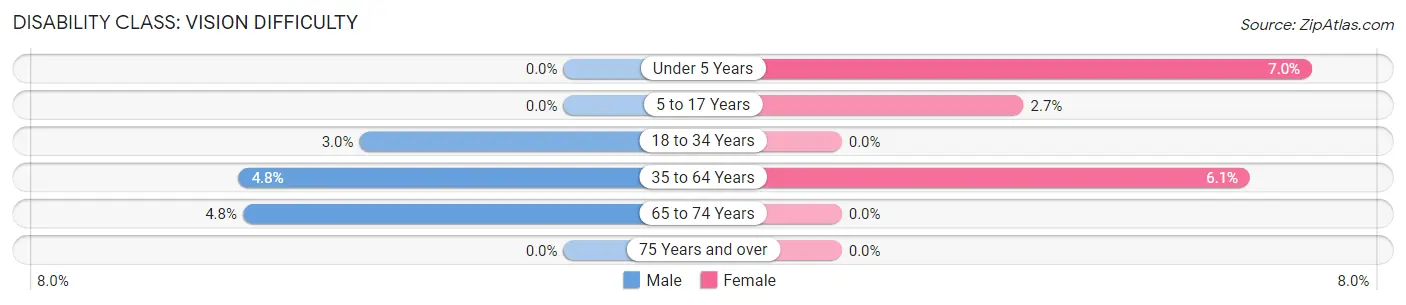
| Age Bracket | Male | Female |
| Under 5 Years | 0 (0.0%) | 3 (7.0%) |
| 5 to 17 Years | 0 (0.0%) | 3 (2.7%) |
| 18 to 34 Years | 2 (3.0%) | 0 (0.0%) |
| 35 to 64 Years | 4 (4.8%) | 4 (6.1%) |
| 65 to 74 Years | 1 (4.8%) | 0 (0.0%) |
| 75 Years and over | 0 (0.0%) | 0 (0.0%) |
Disability Class: Cognitive Difficulty
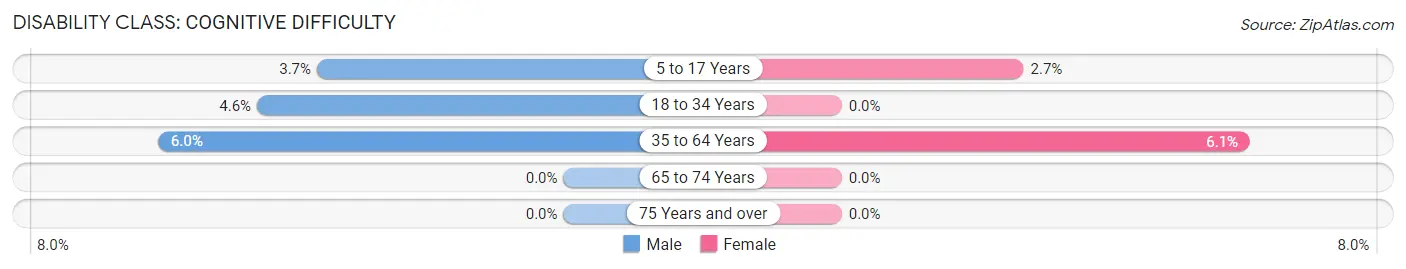
| Age Bracket | Male | Female |
| 5 to 17 Years | 3 (3.7%) | 3 (2.7%) |
| 18 to 34 Years | 3 (4.5%) | 0 (0.0%) |
| 35 to 64 Years | 5 (6.0%) | 4 (6.1%) |
| 65 to 74 Years | 0 (0.0%) | 0 (0.0%) |
| 75 Years and over | 0 (0.0%) | 0 (0.0%) |
Disability Class: Ambulatory Difficulty
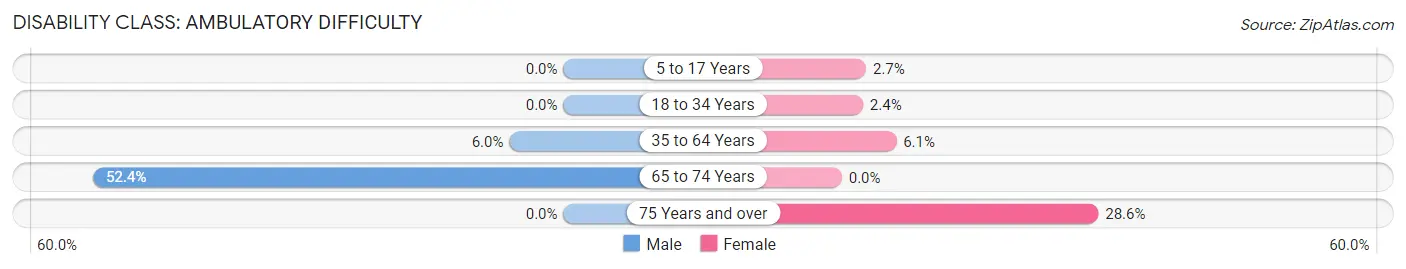
| Age Bracket | Male | Female |
| 5 to 17 Years | 0 (0.0%) | 3 (2.7%) |
| 18 to 34 Years | 0 (0.0%) | 2 (2.4%) |
| 35 to 64 Years | 5 (6.0%) | 4 (6.1%) |
| 65 to 74 Years | 11 (52.4%) | 0 (0.0%) |
| 75 Years and over | 0 (0.0%) | 4 (28.6%) |
Disability Class: Self-Care Difficulty
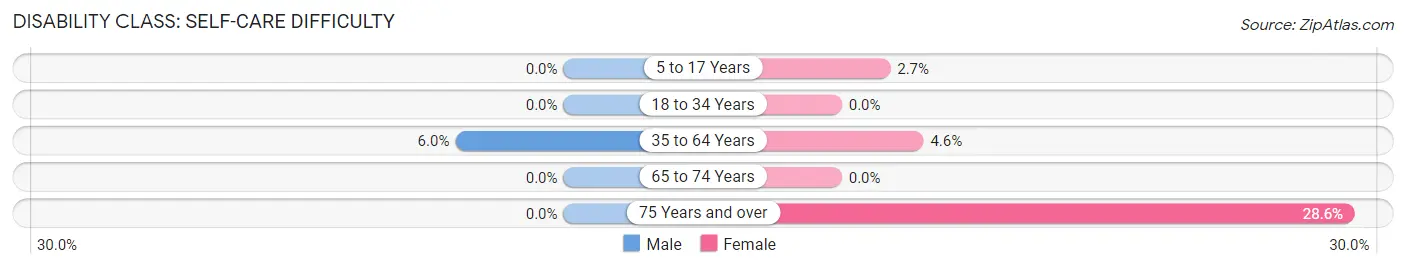
| Age Bracket | Male | Female |
| 5 to 17 Years | 0 (0.0%) | 3 (2.7%) |
| 18 to 34 Years | 0 (0.0%) | 0 (0.0%) |
| 35 to 64 Years | 5 (6.0%) | 3 (4.5%) |
| 65 to 74 Years | 0 (0.0%) | 0 (0.0%) |
| 75 Years and over | 0 (0.0%) | 4 (28.6%) |
Technology Access in Brevig Mission
Computing Device Access in Brevig Mission
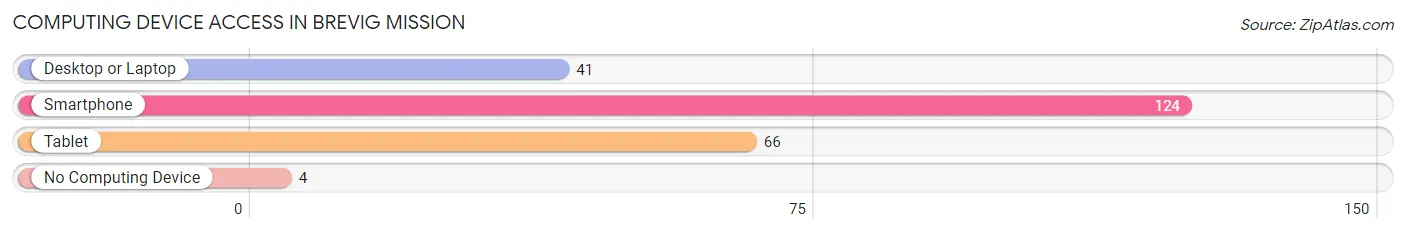
| Device Type | # Households | % Households |
| Desktop or Laptop | 41 | 31.8% |
| Smartphone | 124 | 96.1% |
| Tablet | 66 | 51.2% |
| No Computing Device | 4 | 3.1% |
| Total | 129 | 100.0% |
Internet Access in Brevig Mission
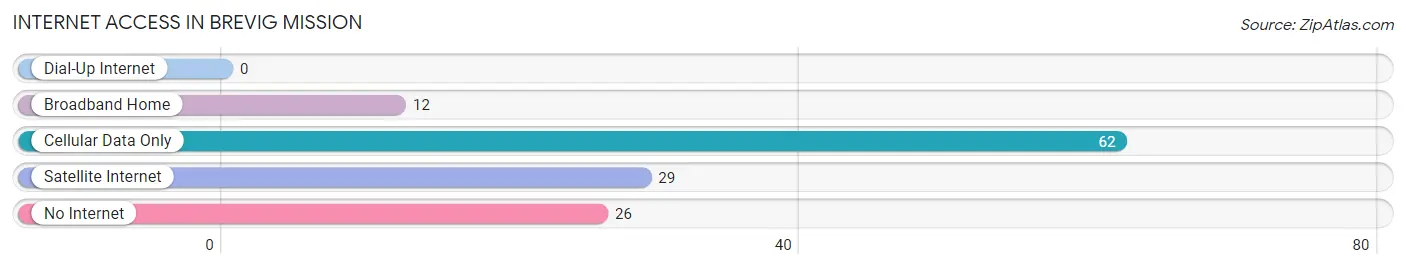
| Internet Type | # Households | % Households |
| Dial-Up Internet | 0 | 0.0% |
| Broadband Home | 12 | 9.3% |
| Cellular Data Only | 62 | 48.1% |
| Satellite Internet | 29 | 22.5% |
| No Internet | 26 | 20.2% |
| Total | 129 | 100.0% |
Brevig Mission Summary
Brevig Mission is a small city located in the Nome Census Area of Alaska. It is situated on the Seward Peninsula, approximately 30 miles northwest of Nome. The city is home to a population of approximately 300 people, most of whom are of Inupiat Eskimo descent.
History
The area around Brevig Mission has been inhabited by the Inupiat Eskimos for centuries. The first recorded contact with Europeans was in 1786, when the Russian explorer Gerasim Izmailov visited the area. In 1867, the United States purchased Alaska from Russia, and the area around Brevig Mission became part of the newly formed Alaska Territory.
In the early 1900s, the area around Brevig Mission was settled by Norwegian immigrants. The settlement was named after the Norwegian missionary, Reverend Martin Brevig, who established a mission in the area in 1915. The mission was used to provide religious services to the local Inupiat population.
In the 1920s, the area around Brevig Mission was opened up to gold prospectors. The gold rush brought an influx of people to the area, and the population of Brevig Mission grew rapidly. In the 1930s, the federal government established a post office in the town, and the population continued to grow.
In the 1950s, the federal government began to provide services to the local population, including a school, a health clinic, and a post office. The population of Brevig Mission peaked in the 1960s, with a population of over 500 people.
Geography
Brevig Mission is located on the Seward Peninsula, approximately 30 miles northwest of Nome. The city is situated on the shore of the Bering Sea, and is surrounded by mountains and tundra. The climate in Brevig Mission is subarctic, with cold winters and mild summers.
The city is located in the Nome Census Area, and is part of the Bering Straits Native Corporation. The city is accessible by air and by sea, and is served by the Brevig Mission Airport.
Economy
The economy of Brevig Mission is largely based on subsistence fishing and hunting. The local population relies heavily on the resources of the Bering Sea, and the city is home to several fish processing plants.
The city is also home to a number of small businesses, including a grocery store, a hardware store, and a restaurant. The city is served by the Brevig Mission School, which provides educational services to the local population.
Demographics
As of the 2010 census, the population of Brevig Mission was 294 people. The racial makeup of the city was 95.3% Native American, 2.7% White, 0.3% Asian, and 1.7% from two or more races.
The median household income in Brevig Mission was $25,000, and the median family income was $30,000. The per capita income in the city was $14,000. The unemployment rate in Brevig Mission was 8.3%.
Conclusion
Brevig Mission is a small city located in the Nome Census Area of Alaska. It is home to a population of approximately 300 people, most of whom are of Inupiat Eskimo descent. The economy of Brevig Mission is largely based on subsistence fishing and hunting, and the city is served by the Brevig Mission School. The population of Brevig Mission is predominantly Native American, and the median household income is $25,000.
Common Questions
What is Per Capita Income in Brevig Mission?
Per Capita income in Brevig Mission is $13,032.
What is the Median Family Income in Brevig Mission?
Median Family Income in Brevig Mission is $36,736.
What is the Median Household income in Brevig Mission?
Median Household Income in Brevig Mission is $58,438.
What is Income or Wage Gap in Brevig Mission?
Income or Wage Gap in Brevig Mission is 19.6%.
Women in Brevig Mission earn 80.4 cents for every dollar earned by a man.
What is Inequality or Gini Index in Brevig Mission?
Inequality or Gini Index in Brevig Mission is 0.42.
What is the Total Population of Brevig Mission?
Total Population of Brevig Mission is 625.
What is the Total Male Population of Brevig Mission?
Total Male Population of Brevig Mission is 296.
What is the Total Female Population of Brevig Mission?
Total Female Population of Brevig Mission is 329.
What is the Ratio of Males per 100 Females in Brevig Mission?
There are 89.97 Males per 100 Females in Brevig Mission.
What is the Ratio of Females per 100 Males in Brevig Mission?
There are 111.15 Females per 100 Males in Brevig Mission.
What is the Median Population Age in Brevig Mission?
Median Population Age in Brevig Mission is 22.0 Years.
What is the Average Family Size in Brevig Mission
Average Family Size in Brevig Mission is 4.8 People.
What is the Average Household Size in Brevig Mission
Average Household Size in Brevig Mission is 4.8 People.
How Large is the Labor Force in Brevig Mission?
There are 190 People in the Labor Forcein in Brevig Mission.
What is the Percentage of People in the Labor Force in Brevig Mission?
52.5% of People are in the Labor Force in Brevig Mission.
What is the Unemployment Rate in Brevig Mission?
Unemployment Rate in Brevig Mission is 20.5%.