Pitkas Point, AK Map & Demographics
Pitkas Point Map
Pitkas Point Overview
$14,731
PER CAPITA INCOME
$55,833
AVG FAMILY INCOME
$57,679
AVG HOUSEHOLD INCOME
0.40
INEQUALITY / GINI INDEX
239
TOTAL POPULATION
134
MALE POPULATION
105
FEMALE POPULATION
127.62
MALES / 100 FEMALES
78.36
FEMALES / 100 MALES
22.4
MEDIAN AGE
4.3
AVG FAMILY SIZE
4.3
AVG HOUSEHOLD SIZE
74
LABOR FORCE [ PEOPLE ]
51.4%
PERCENT IN LABOR FORCE
23.0%
UNEMPLOYMENT RATE
Income in Pitkas Point
Income Overview in Pitkas Point
Per Capita Income in Pitkas Point is $14,731, while median incomes of families and households are $55,833 and $57,679 respectively.
| Characteristic | Number | Measure |
| Per Capita Income | 239 | $14,731 |
| Median Family Income | 52 | $55,833 |
| Mean Family Income | 52 | $58,840 |
| Median Household Income | 55 | $57,679 |
| Mean Household Income | 55 | $63,356 |
| Income Deficit | 52 | $0 |
| Wage / Income Gap (%) | 239 | 0.00% |
| Wage / Income Gap ($) | 239 | 100.00¢ per $1 |
| Gini / Inequality Index | 239 | 0.40 |
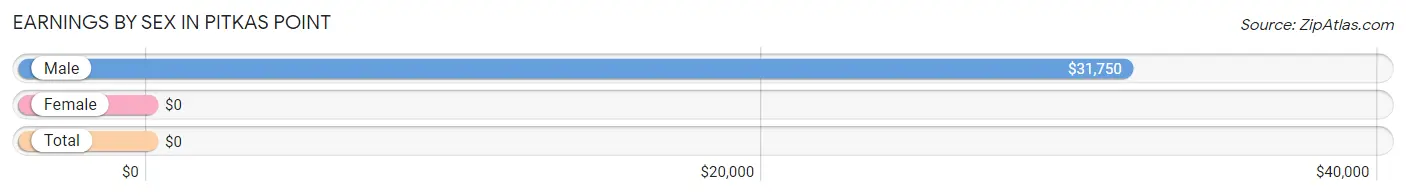
Earnings by Sex in Pitkas Point
| Sex | Number | Average Earnings |
| Male | 63 (65.6%) | $31,750 |
| Female | 33 (34.4%) | $0 |
| Total | 96 (100.0%) | $0 |
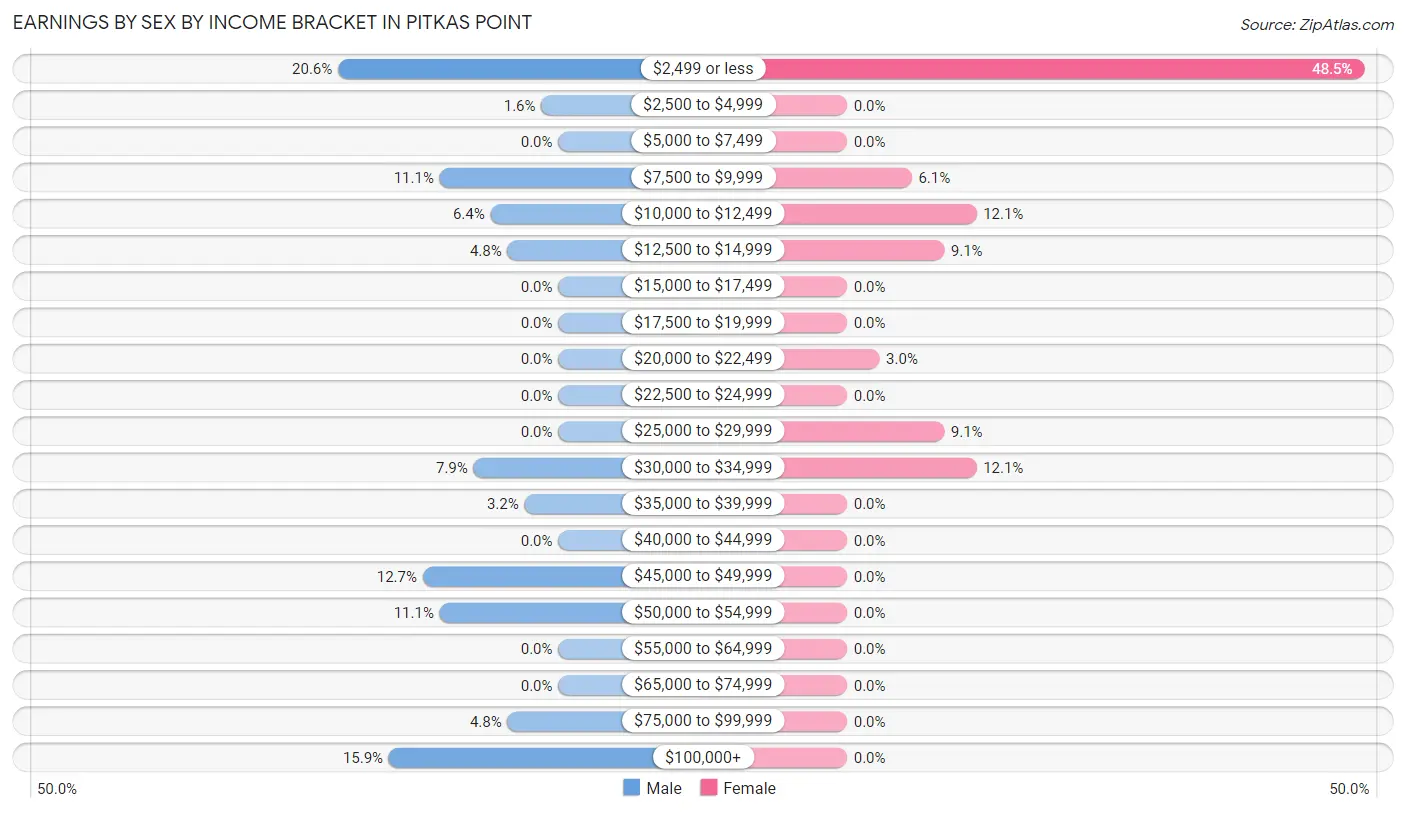
Earnings by Sex by Income Bracket in Pitkas Point
The most common earnings brackets in Pitkas Point are $2,499 or less for men (13 | 20.6%) and $2,499 or less for women (16 | 48.5%).
| Income | Male | Female |
| $2,499 or less | 13 (20.6%) | 16 (48.5%) |
| $2,500 to $4,999 | 1 (1.6%) | 0 (0.0%) |
| $5,000 to $7,499 | 0 (0.0%) | 0 (0.0%) |
| $7,500 to $9,999 | 7 (11.1%) | 2 (6.1%) |
| $10,000 to $12,499 | 4 (6.4%) | 4 (12.1%) |
| $12,500 to $14,999 | 3 (4.8%) | 3 (9.1%) |
| $15,000 to $17,499 | 0 (0.0%) | 0 (0.0%) |
| $17,500 to $19,999 | 0 (0.0%) | 0 (0.0%) |
| $20,000 to $22,499 | 0 (0.0%) | 1 (3.0%) |
| $22,500 to $24,999 | 0 (0.0%) | 0 (0.0%) |
| $25,000 to $29,999 | 0 (0.0%) | 3 (9.1%) |
| $30,000 to $34,999 | 5 (7.9%) | 4 (12.1%) |
| $35,000 to $39,999 | 2 (3.2%) | 0 (0.0%) |
| $40,000 to $44,999 | 0 (0.0%) | 0 (0.0%) |
| $45,000 to $49,999 | 8 (12.7%) | 0 (0.0%) |
| $50,000 to $54,999 | 7 (11.1%) | 0 (0.0%) |
| $55,000 to $64,999 | 0 (0.0%) | 0 (0.0%) |
| $65,000 to $74,999 | 0 (0.0%) | 0 (0.0%) |
| $75,000 to $99,999 | 3 (4.8%) | 0 (0.0%) |
| $100,000+ | 10 (15.9%) | 0 (0.0%) |
| Total | 63 (100.0%) | 33 (100.0%) |
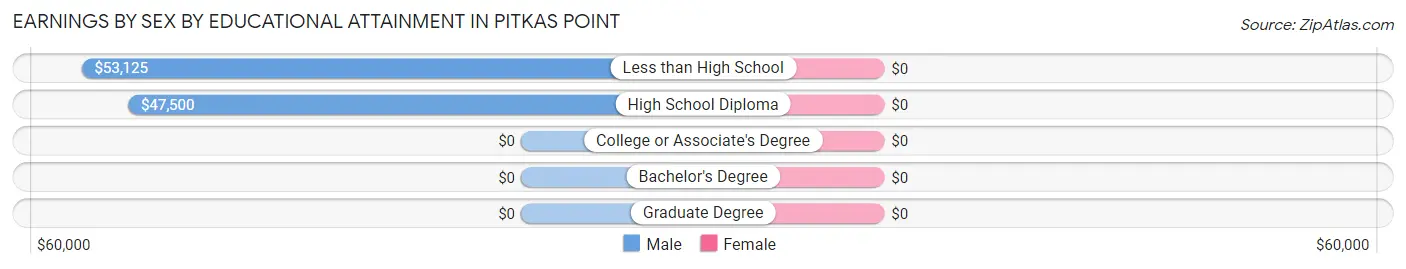
Earnings by Sex by Educational Attainment in Pitkas Point
| Educational Attainment | Male Income | Female Income |
| Less than High School | $53,125 | $0 |
| High School Diploma | $47,500 | $0 |
| College or Associate's Degree | - | - |
| Bachelor's Degree | - | - |
| Graduate Degree | - | - |
| Total | $46,750 | $12,500 |
Family Income in Pitkas Point
Family Income Brackets in Pitkas Point
According to the Pitkas Point family income data, there are 18 families falling into the $50,000 to $74,999 income range, which is the most common income bracket and makes up 34.6% of all families.
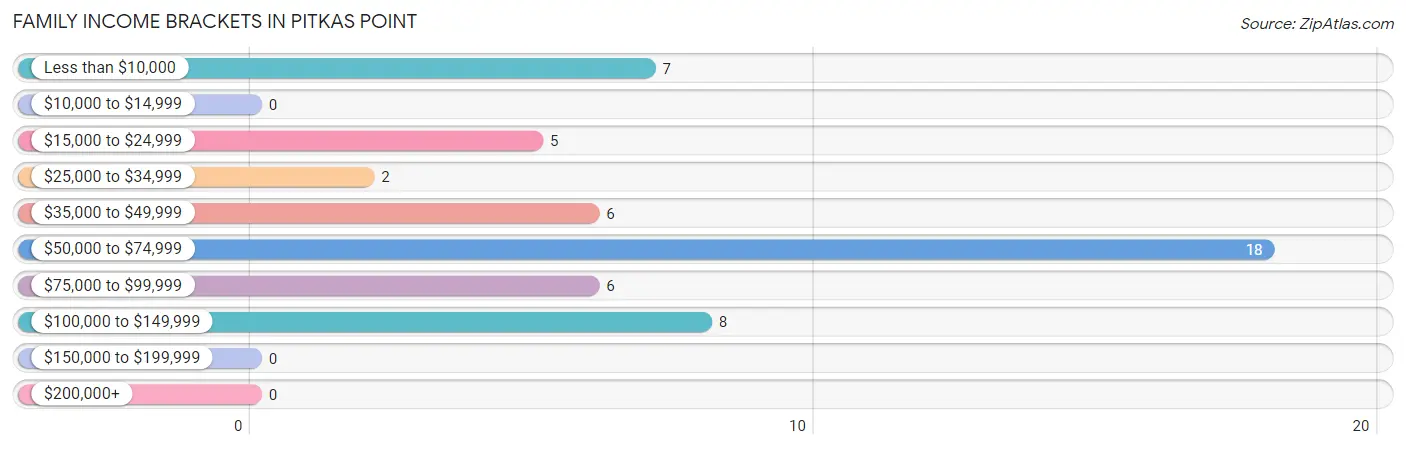
| Income Bracket | # Families | % Families |
| Less than $10,000 | 7 | 13.5% |
| $10,000 to $14,999 | 0 | 0.0% |
| $15,000 to $24,999 | 5 | 9.6% |
| $25,000 to $34,999 | 2 | 3.8% |
| $35,000 to $49,999 | 6 | 11.5% |
| $50,000 to $74,999 | 18 | 34.6% |
| $75,000 to $99,999 | 6 | 11.5% |
| $100,000 to $149,999 | 8 | 15.4% |
| $150,000 to $199,999 | 0 | 0.0% |
| $200,000+ | 0 | 0.0% |
Family Income by Famaliy Size in Pitkas Point
5-person families (9 | 17.3%) account for the highest median family income in Pitkas Point with $89,063 per family, while 3-person families (10 | 19.2%) have the highest median income of $18,000 per family member.
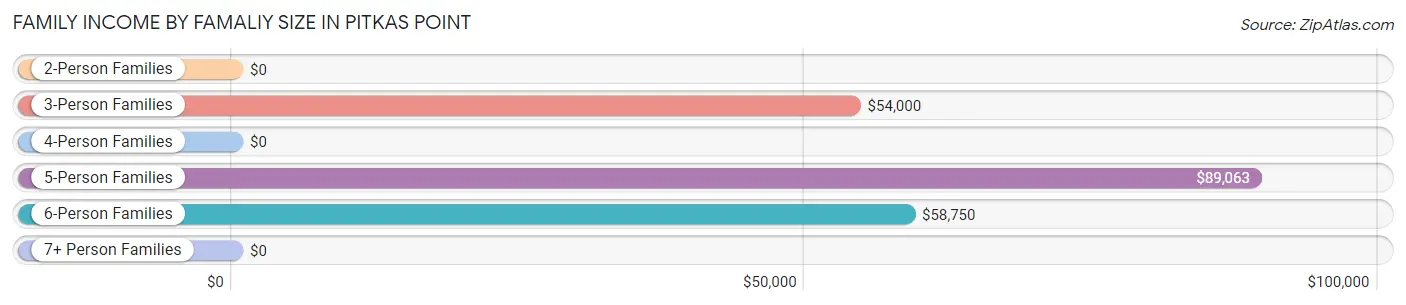
| Income Bracket | # Families | Median Income |
| 2-Person Families | 10 (19.2%) | $0 |
| 3-Person Families | 10 (19.2%) | $54,000 |
| 4-Person Families | 8 (15.4%) | $0 |
| 5-Person Families | 9 (17.3%) | $89,063 |
| 6-Person Families | 9 (17.3%) | $58,750 |
| 7+ Person Families | 6 (11.5%) | $0 |
| Total | 52 (100.0%) | $55,833 |
Family Income by Number of Earners in Pitkas Point
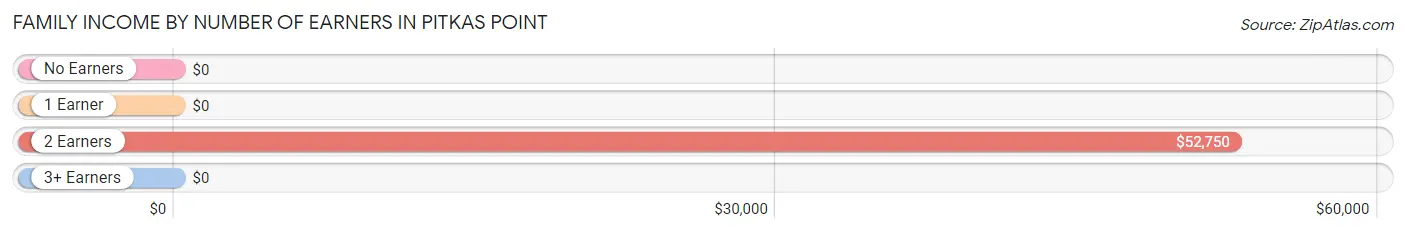
| Number of Earners | # Families | Median Income |
| No Earners | 2 (3.8%) | $0 |
| 1 Earner | 20 (38.5%) | $0 |
| 2 Earners | 23 (44.2%) | $52,750 |
| 3+ Earners | 7 (13.5%) | $0 |
| Total | 52 (100.0%) | $55,833 |
Household Income in Pitkas Point
Household Income Brackets in Pitkas Point
With 18 households falling in the category, the $50,000 to $74,999 income range is the most frequent in Pitkas Point, accounting for 32.7% of all households.
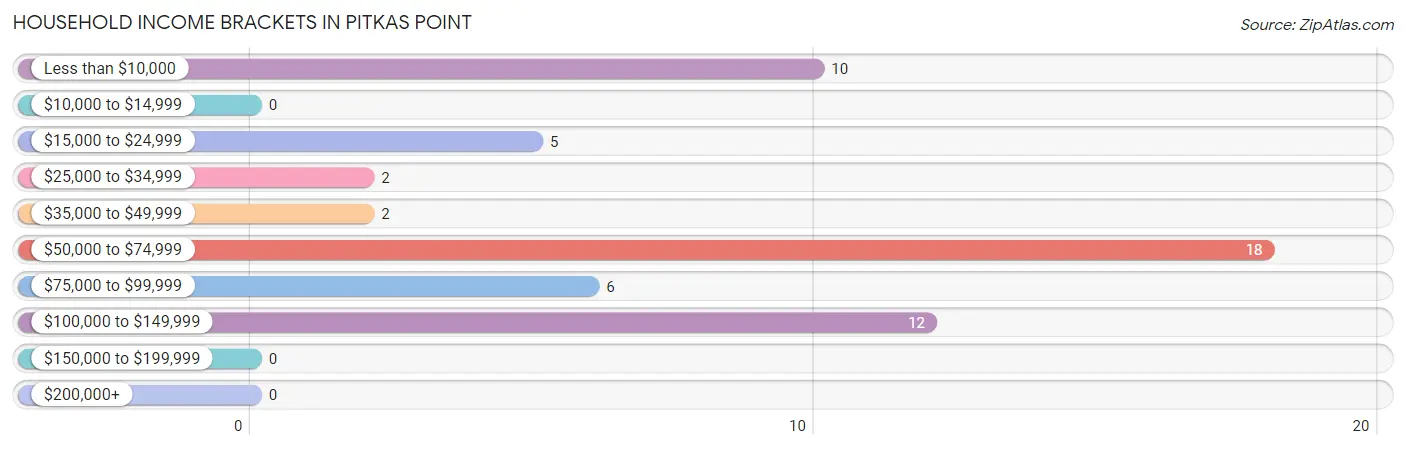
| Income Bracket | # Households | % Households |
| Less than $10,000 | 10 | 18.2% |
| $10,000 to $14,999 | 0 | 0.0% |
| $15,000 to $24,999 | 5 | 9.1% |
| $25,000 to $34,999 | 2 | 3.6% |
| $35,000 to $49,999 | 2 | 3.6% |
| $50,000 to $74,999 | 18 | 32.7% |
| $75,000 to $99,999 | 6 | 10.9% |
| $100,000 to $149,999 | 12 | 21.8% |
| $150,000 to $199,999 | 0 | 0.0% |
| $200,000+ | 0 | 0.0% |
Household Income by Householder Age in Pitkas Point
The median household income in Pitkas Point is $57,679, with the highest median household income of $79,375 found in the 65+ years age bracket for the primary householder. A total of 9 households (16.4%) fall into this category. Meanwhile, the 15 to 24 years age bracket for the primary householder has the lowest median household income of $0, with 7 households (12.7%) in this group.
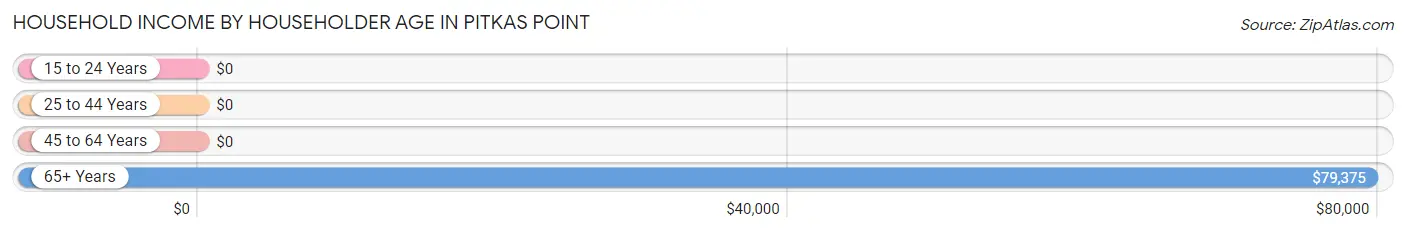
| Income Bracket | # Households | Median Income |
| 15 to 24 Years | 7 (12.7%) | $0 |
| 25 to 44 Years | 19 (34.5%) | $0 |
| 45 to 64 Years | 20 (36.4%) | $0 |
| 65+ Years | 9 (16.4%) | $79,375 |
| Total | 55 (100.0%) | $57,679 |
Poverty in Pitkas Point
Income Below Poverty by Sex and Age in Pitkas Point
With 39.6% poverty level for males and 38.1% for females among the residents of Pitkas Point, 15 year old males and 35 to 44 year old females are the most vulnerable to poverty, with 7 males (100.0%) and 4 females (100.0%) in their respective age groups living below the poverty level.
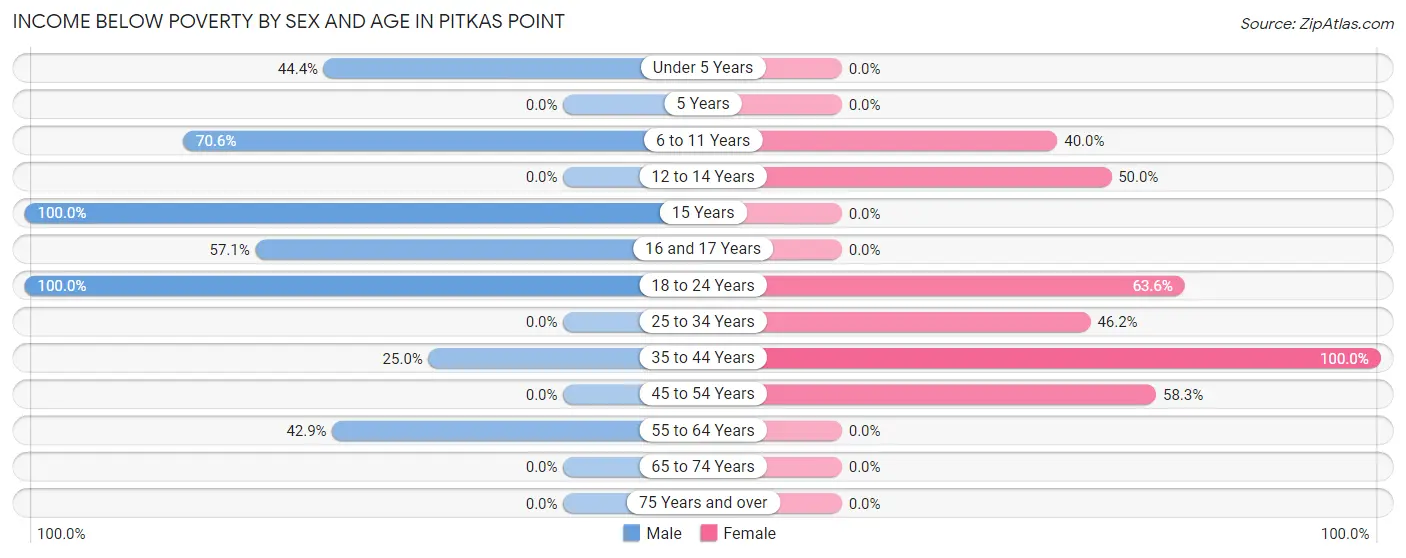
| Age Bracket | Male | Female |
| Under 5 Years | 8 (44.4%) | 0 (0.0%) |
| 5 Years | 0 (0.0%) | 0 (0.0%) |
| 6 to 11 Years | 12 (70.6%) | 12 (40.0%) |
| 12 to 14 Years | 0 (0.0%) | 4 (50.0%) |
| 15 Years | 7 (100.0%) | 0 (0.0%) |
| 16 and 17 Years | 4 (57.1%) | 0 (0.0%) |
| 18 to 24 Years | 11 (100.0%) | 7 (63.6%) |
| 25 to 34 Years | 0 (0.0%) | 6 (46.2%) |
| 35 to 44 Years | 5 (25.0%) | 4 (100.0%) |
| 45 to 54 Years | 0 (0.0%) | 7 (58.3%) |
| 55 to 64 Years | 6 (42.9%) | 0 (0.0%) |
| 65 to 74 Years | 0 (0.0%) | 0 (0.0%) |
| 75 Years and over | 0 (0.0%) | 0 (0.0%) |
| Total | 53 (39.6%) | 40 (38.1%) |
Income Above Poverty by Sex and Age in Pitkas Point
According to the poverty statistics in Pitkas Point, males aged 5 years and females aged under 5 years are the age groups that are most secure financially, with 100.0% of males and 100.0% of females in these age groups living above the poverty line.
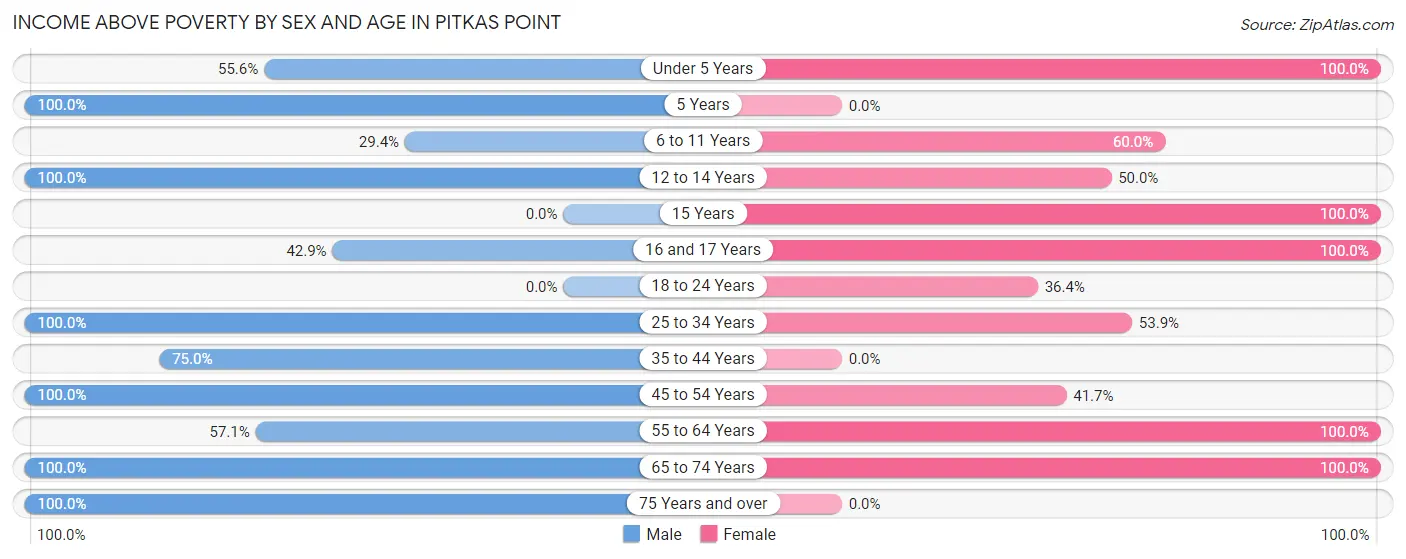
| Age Bracket | Male | Female |
| Under 5 Years | 10 (55.6%) | 3 (100.0%) |
| 5 Years | 3 (100.0%) | 0 (0.0%) |
| 6 to 11 Years | 5 (29.4%) | 18 (60.0%) |
| 12 to 14 Years | 6 (100.0%) | 4 (50.0%) |
| 15 Years | 0 (0.0%) | 3 (100.0%) |
| 16 and 17 Years | 3 (42.9%) | 7 (100.0%) |
| 18 to 24 Years | 0 (0.0%) | 4 (36.4%) |
| 25 to 34 Years | 22 (100.0%) | 7 (53.8%) |
| 35 to 44 Years | 15 (75.0%) | 0 (0.0%) |
| 45 to 54 Years | 3 (100.0%) | 5 (41.7%) |
| 55 to 64 Years | 8 (57.1%) | 5 (100.0%) |
| 65 to 74 Years | 4 (100.0%) | 9 (100.0%) |
| 75 Years and over | 2 (100.0%) | 0 (0.0%) |
| Total | 81 (60.5%) | 65 (61.9%) |
Income Below Poverty Among Married-Couple Families in Pitkas Point
The poverty statistics for married-couple families in Pitkas Point show that 9.5% or 2 of the total 21 families live below the poverty line. Families with 1 or 2 children have the highest poverty rate of 16.7%, comprising of 2 families. On the other hand, families with 3 or 4 children have the lowest poverty rate of 0.0%, which includes 0 families.
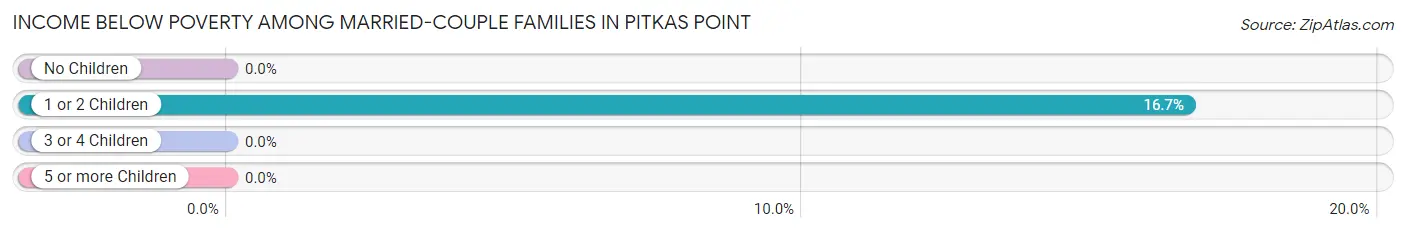
| Children | Above Poverty | Below Poverty |
| No Children | 0 (0.0%) | 0 (0.0%) |
| 1 or 2 Children | 10 (83.3%) | 2 (16.7%) |
| 3 or 4 Children | 9 (100.0%) | 0 (0.0%) |
| 5 or more Children | 0 (0.0%) | 0 (0.0%) |
| Total | 19 (90.5%) | 2 (9.5%) |
Income Below Poverty Among Single-Parent Households in Pitkas Point
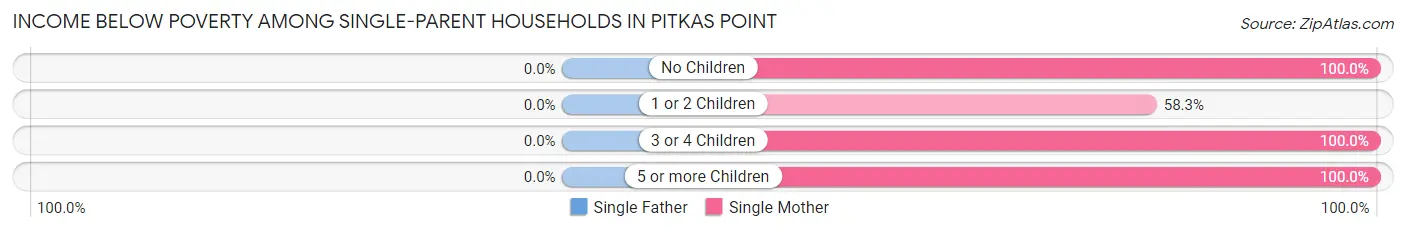
| Children | Single Father | Single Mother |
| No Children | 0 (0.0%) | 3 (100.0%) |
| 1 or 2 Children | 0 (0.0%) | 7 (58.3%) |
| 3 or 4 Children | 0 (0.0%) | 2 (100.0%) |
| 5 or more Children | 0 (0.0%) | 4 (100.0%) |
| Total | 0 (0.0%) | 16 (76.2%) |
Income Below Poverty Among Married-Couple vs Single-Parent Households in Pitkas Point
The poverty data for Pitkas Point shows that 2 of the married-couple family households (9.5%) and 16 of the single-parent households (51.6%) are living below the poverty level. Within the married-couple family households, those with 1 or 2 children have the highest poverty rate, with 2 households (16.7%) falling below the poverty line. Among the single-parent households, those with 3 or 4 children have the highest poverty rate, with 2 household (100.0%) living below poverty.
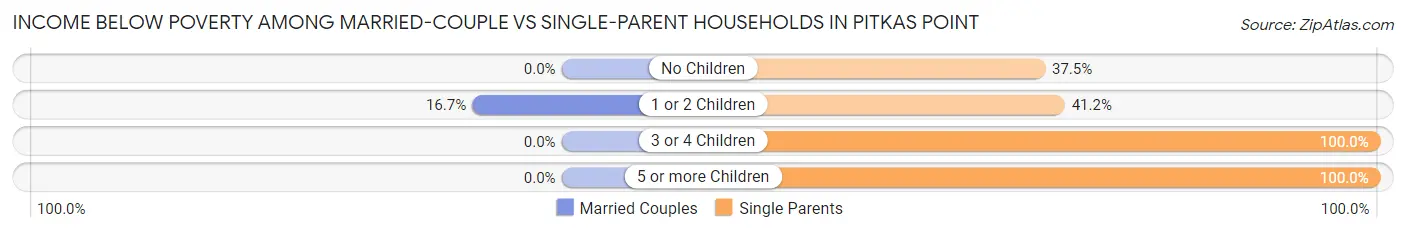
| Children | Married-Couple Families | Single-Parent Households |
| No Children | 0 (0.0%) | 3 (37.5%) |
| 1 or 2 Children | 2 (16.7%) | 7 (41.2%) |
| 3 or 4 Children | 0 (0.0%) | 2 (100.0%) |
| 5 or more Children | 0 (0.0%) | 4 (100.0%) |
| Total | 2 (9.5%) | 16 (51.6%) |
Race in Pitkas Point
The most populous races in Pitkas Point are , and Native / Alaskan (239 | 100.0%).
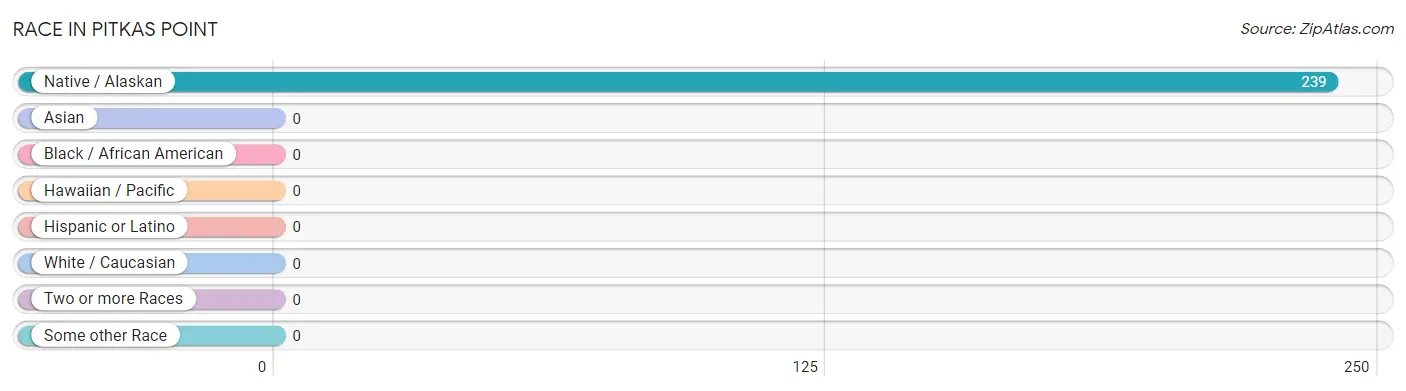
| Race | # Population | % Population |
| Asian | 0 | 0.0% |
| Black / African American | 0 | 0.0% |
| Hawaiian / Pacific | 0 | 0.0% |
| Hispanic or Latino | 0 | 0.0% |
| Native / Alaskan | 239 | 100.0% |
| White / Caucasian | 0 | 0.0% |
| Two or more Races | 0 | 0.0% |
| Some other Race | 0 | 0.0% |
| Total | 239 | 100.0% |
Ancestry in Pitkas Point
The most populous ancestries reported in Pitkas Point are Yup'ik (239 | 100.0%), and Russian (9 | 3.8%), together accounting for 103.8% of all Pitkas Point residents.
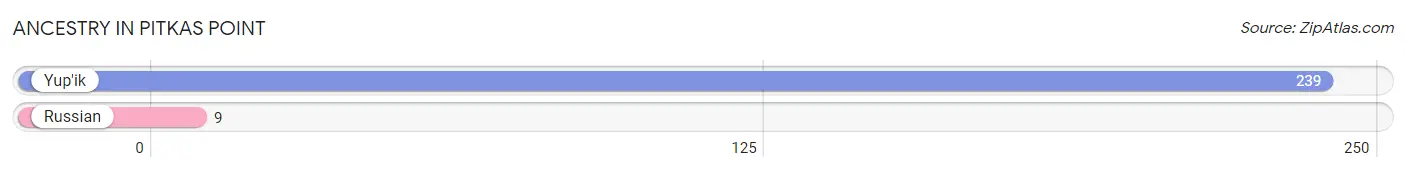
| Ancestry | # Population | % Population |
| Russian | 9 | 3.8% |
| Yup'ik | 239 | 100.0% | View All 2 Rows |
Immigrants in Pitkas Point

| Immigration Origin | # Population | % Population | View All 0 Rows |
Sex and Age in Pitkas Point
Sex and Age in Pitkas Point
The most populous age groups in Pitkas Point are 10 to 14 Years (19 | 14.2%) for men and 5 to 9 Years (22 | 20.9%) for women.
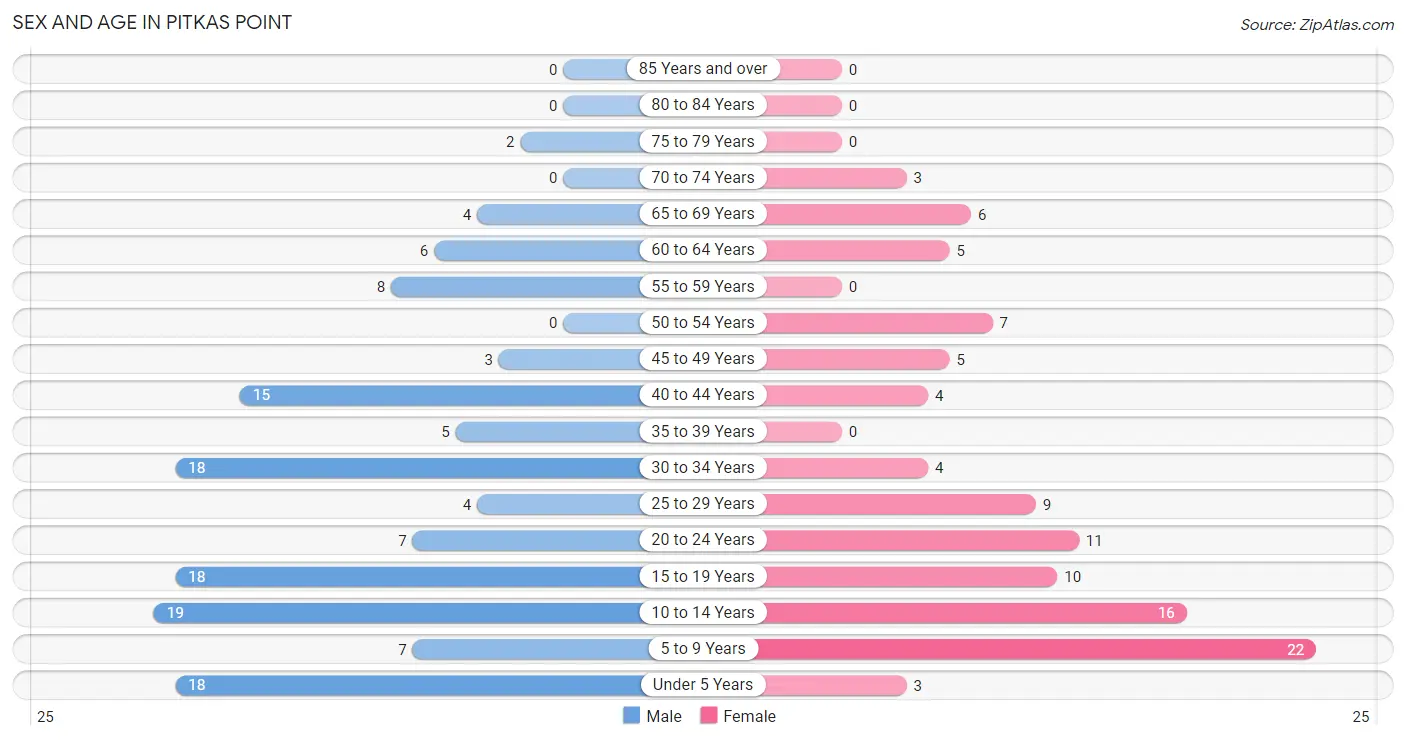
| Age Bracket | Male | Female |
| Under 5 Years | 18 (13.4%) | 3 (2.9%) |
| 5 to 9 Years | 7 (5.2%) | 22 (20.9%) |
| 10 to 14 Years | 19 (14.2%) | 16 (15.2%) |
| 15 to 19 Years | 18 (13.4%) | 10 (9.5%) |
| 20 to 24 Years | 7 (5.2%) | 11 (10.5%) |
| 25 to 29 Years | 4 (3.0%) | 9 (8.6%) |
| 30 to 34 Years | 18 (13.4%) | 4 (3.8%) |
| 35 to 39 Years | 5 (3.7%) | 0 (0.0%) |
| 40 to 44 Years | 15 (11.2%) | 4 (3.8%) |
| 45 to 49 Years | 3 (2.2%) | 5 (4.8%) |
| 50 to 54 Years | 0 (0.0%) | 7 (6.7%) |
| 55 to 59 Years | 8 (6.0%) | 0 (0.0%) |
| 60 to 64 Years | 6 (4.5%) | 5 (4.8%) |
| 65 to 69 Years | 4 (3.0%) | 6 (5.7%) |
| 70 to 74 Years | 0 (0.0%) | 3 (2.9%) |
| 75 to 79 Years | 2 (1.5%) | 0 (0.0%) |
| 80 to 84 Years | 0 (0.0%) | 0 (0.0%) |
| 85 Years and over | 0 (0.0%) | 0 (0.0%) |
| Total | 134 (100.0%) | 105 (100.0%) |
Families and Households in Pitkas Point
Median Family Size in Pitkas Point
The median family size in Pitkas Point is 4.31 persons per family, with married-couple families (21 | 40.4%) accounting for the largest median family size of 5.38 persons per family. On the other hand, single male/father families (10 | 19.2%) represent the smallest median family size with 2.50 persons per family.
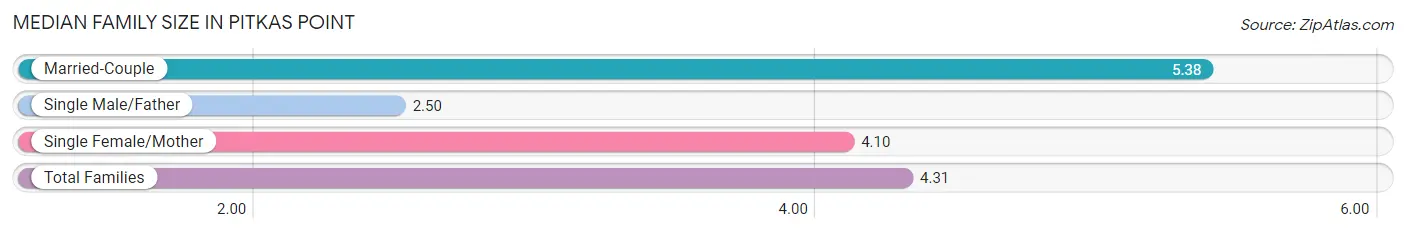
| Family Type | # Families | Family Size |
| Married-Couple | 21 (40.4%) | 5.38 |
| Single Male/Father | 10 (19.2%) | 2.50 |
| Single Female/Mother | 21 (40.4%) | 4.10 |
| Total Families | 52 (100.0%) | 4.31 |
Median Household Size in Pitkas Point
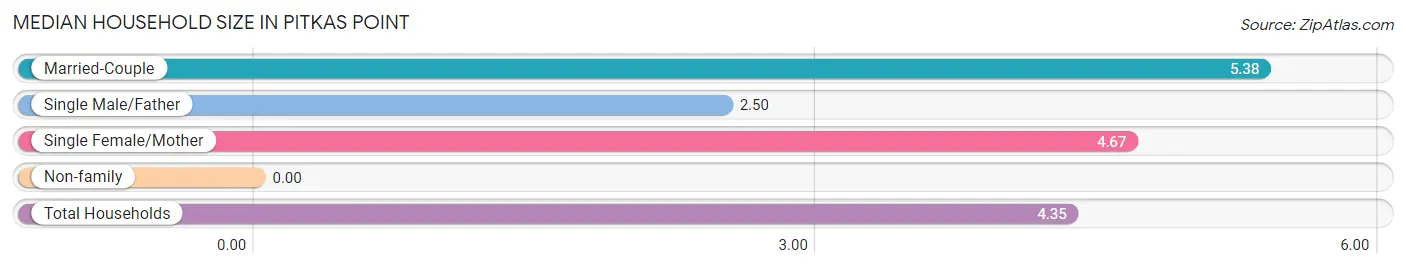
| Household Type | # Households | Household Size |
| Married-Couple | 21 (38.2%) | 5.38 |
| Single Male/Father | 10 (18.2%) | 2.50 |
| Single Female/Mother | 21 (38.2%) | 4.67 |
| Non-family | 3 (5.4%) | - |
| Total Households | 55 (100.0%) | 4.35 |
Household Size by Marriage Status in Pitkas Point
Out of a total of 55 households in Pitkas Point, 52 (94.6%) are family households, while 3 (5.4%) are nonfamily households. The most numerous type of family households are 3-person households, comprising 17, and the most common type of nonfamily households are 1-person households, comprising 3.
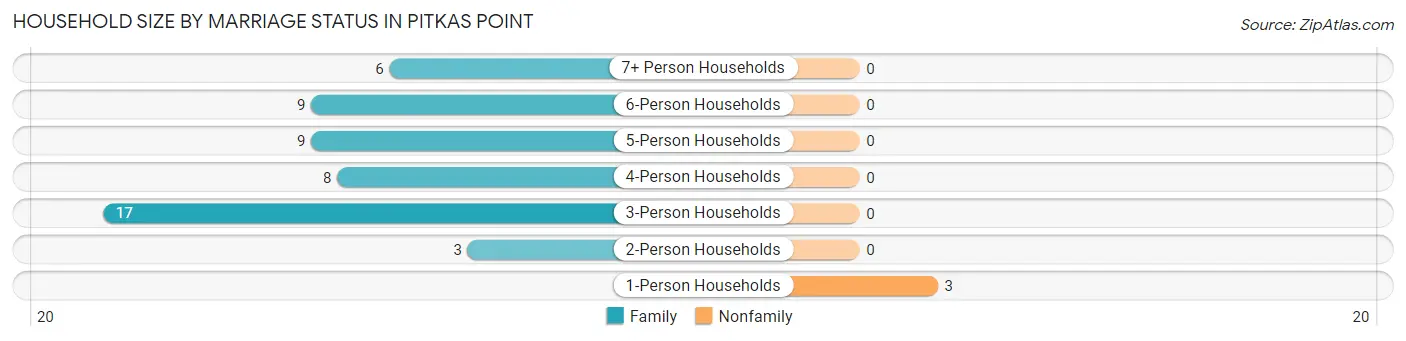
| Household Size | Family Households | Nonfamily Households |
| 1-Person Households | - | 3 (5.4%) |
| 2-Person Households | 3 (5.4%) | 0 (0.0%) |
| 3-Person Households | 17 (30.9%) | 0 (0.0%) |
| 4-Person Households | 8 (14.5%) | 0 (0.0%) |
| 5-Person Households | 9 (16.4%) | 0 (0.0%) |
| 6-Person Households | 9 (16.4%) | 0 (0.0%) |
| 7+ Person Households | 6 (10.9%) | 0 (0.0%) |
| Total | 52 (94.6%) | 3 (5.4%) |
Female Fertility in Pitkas Point
Fertility by Age in Pitkas Point
Average fertility rate in Pitkas Point is 156.0 births per 1,000 women. Women in the age bracket of 20 to 34 years have the highest fertility rate with 292.0 births per 1,000 women. Women in the age bracket of 20 to 34 years acount for 100.0% of all women with births.
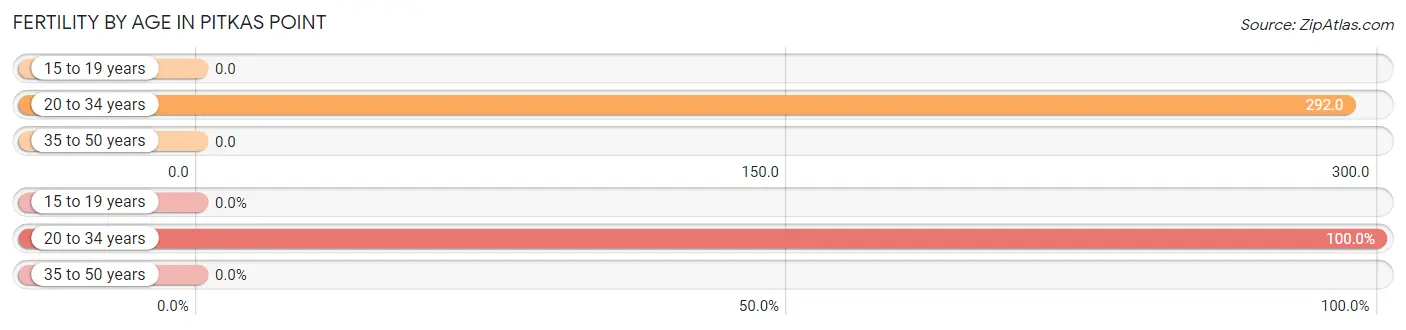
| Age Bracket | Women with Births | Births / 1,000 Women |
| 15 to 19 years | 0 (0.0%) | 0.0 |
| 20 to 34 years | 7 (100.0%) | 292.0 |
| 35 to 50 years | 0 (0.0%) | 0.0 |
| Total | 7 (100.0%) | 156.0 |
Fertility by Age by Marriage Status in Pitkas Point
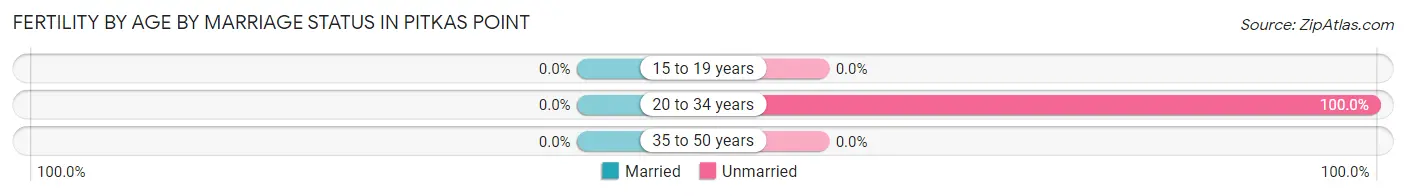
| Age Bracket | Married | Unmarried |
| 15 to 19 years | 0 (0.0%) | 0 (0.0%) |
| 20 to 34 years | 0 (0.0%) | 7 (100.0%) |
| 35 to 50 years | 0 (0.0%) | 0 (0.0%) |
| Total | 0 (0.0%) | 7 (100.0%) |
Fertility by Education in Pitkas Point
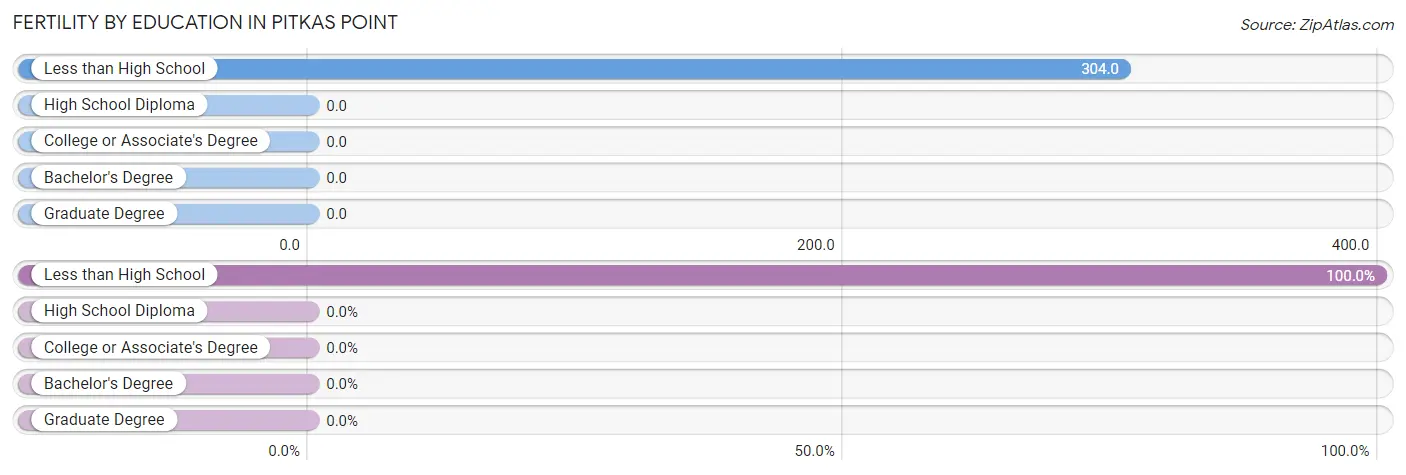
| Educational Attainment | Women with Births | Births / 1,000 Women |
| Less than High School | 7 (100.0%) | 304.0 |
| High School Diploma | 0 (0.0%) | 0.0 |
| College or Associate's Degree | 0 (0.0%) | 0.0 |
| Bachelor's Degree | 0 (0.0%) | 0.0 |
| Graduate Degree | 0 (0.0%) | 0.0 |
| Total | 7 (100.0%) | 156.0 |
Fertility by Education by Marriage Status in Pitkas Point
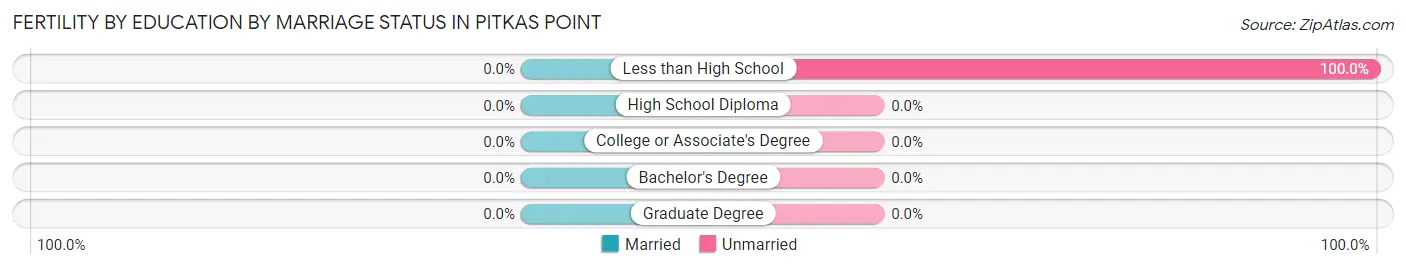
| Educational Attainment | Married | Unmarried |
| Less than High School | 0 (0.0%) | 7 (100.0%) |
| High School Diploma | 0 (0.0%) | 0 (0.0%) |
| College or Associate's Degree | 0 (0.0%) | 0 (0.0%) |
| Bachelor's Degree | 0 (0.0%) | 0 (0.0%) |
| Graduate Degree | 0 (0.0%) | 0 (0.0%) |
| Total | 0 (0.0%) | 7 (100.0%) |
Employment Characteristics in Pitkas Point
Employment by Class of Employer in Pitkas Point
Among the 57 employed individuals in Pitkas Point, private company employees (41 | 71.9%), local government employees (10 | 17.5%), and state government employees (6 | 10.5%) make up the most common classes of employment.
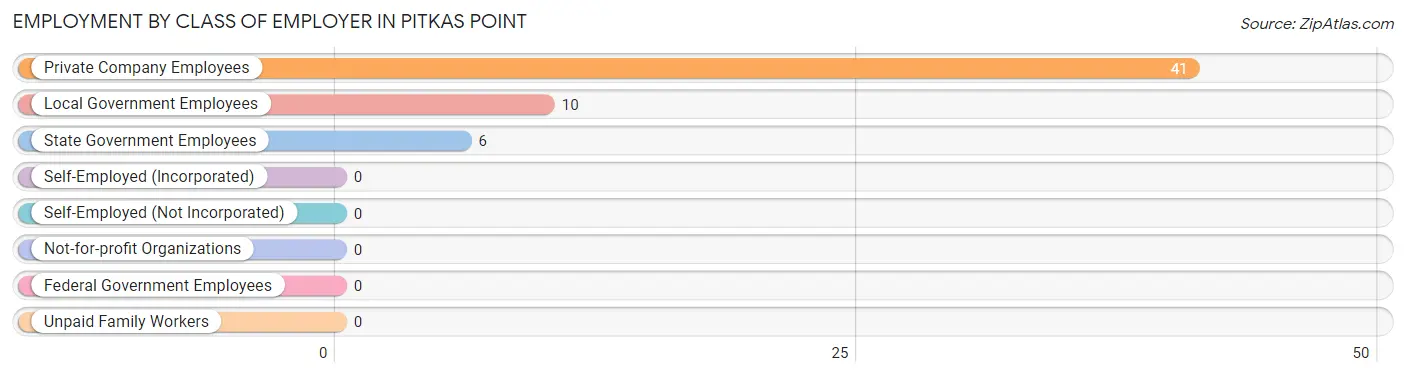
| Employer Class | # Employees | % Employees |
| Private Company Employees | 41 | 71.9% |
| Self-Employed (Incorporated) | 0 | 0.0% |
| Self-Employed (Not Incorporated) | 0 | 0.0% |
| Not-for-profit Organizations | 0 | 0.0% |
| Local Government Employees | 10 | 17.5% |
| State Government Employees | 6 | 10.5% |
| Federal Government Employees | 0 | 0.0% |
| Unpaid Family Workers | 0 | 0.0% |
| Total | 57 | 100.0% |
Employment Status by Age in Pitkas Point
According to the labor force statistics for Pitkas Point, out of the total population over 16 years of age (144), 51.4% or 74 individuals are in the labor force, with 23.0% or 17 of them unemployed. The age group with the highest labor force participation rate is 75 years and over, with 100.0% or 2 individuals in the labor force. Within the labor force, the 16 to 19 years age range has the highest percentage of unemployed individuals, with 100.0% or 3 of them being unemployed.
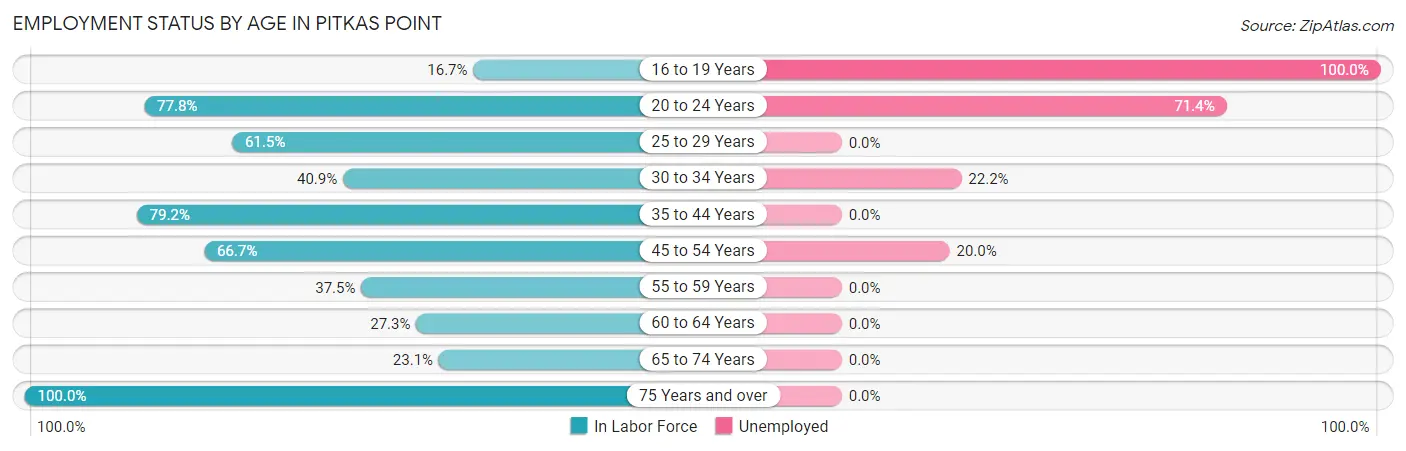
| Age Bracket | In Labor Force | Unemployed |
| 16 to 19 Years | 3 (16.7%) | 3 (100.0%) |
| 20 to 24 Years | 14 (77.8%) | 10 (71.4%) |
| 25 to 29 Years | 8 (61.5%) | 0 (0.0%) |
| 30 to 34 Years | 9 (40.9%) | 2 (22.2%) |
| 35 to 44 Years | 19 (79.2%) | 0 (0.0%) |
| 45 to 54 Years | 10 (66.7%) | 2 (20.0%) |
| 55 to 59 Years | 3 (37.5%) | 0 (0.0%) |
| 60 to 64 Years | 3 (27.3%) | 0 (0.0%) |
| 65 to 74 Years | 3 (23.1%) | 0 (0.0%) |
| 75 Years and over | 2 (100.0%) | 0 (0.0%) |
| Total | 74 (51.4%) | 17 (23.0%) |
Employment Status by Educational Attainment in Pitkas Point
According to labor force statistics for Pitkas Point, 55.9% of individuals (52) out of the total population between 25 and 64 years of age (93) are in the labor force, with 7.7% or 4 of them being unemployed. The group with the highest labor force participation rate are those with the educational attainment of high school diploma, with 62.5% or 45 individuals in the labor force. Within the labor force, individuals with college / associate degree education have the highest percentage of unemployment, with 100.0% or 4 of them being unemployed.
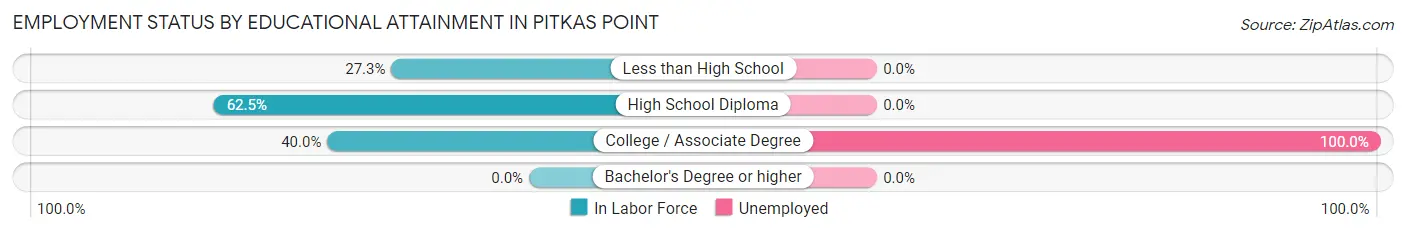
| Educational Attainment | In Labor Force | Unemployed |
| Less than High School | 3 (27.3%) | 0 (0.0%) |
| High School Diploma | 45 (62.5%) | 0 (0.0%) |
| College / Associate Degree | 4 (40.0%) | 10 (100.0%) |
| Bachelor's Degree or higher | 0 (0.0%) | 0 (0.0%) |
| Total | 52 (55.9%) | 7 (7.7%) |
Employment Occupations by Sex in Pitkas Point
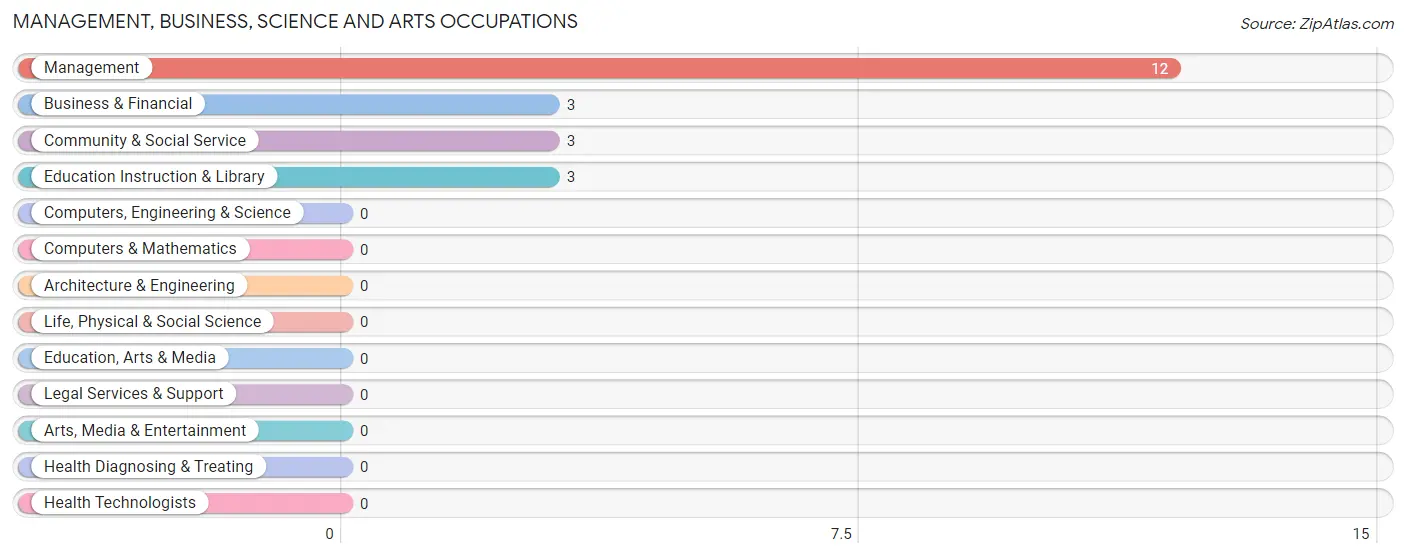
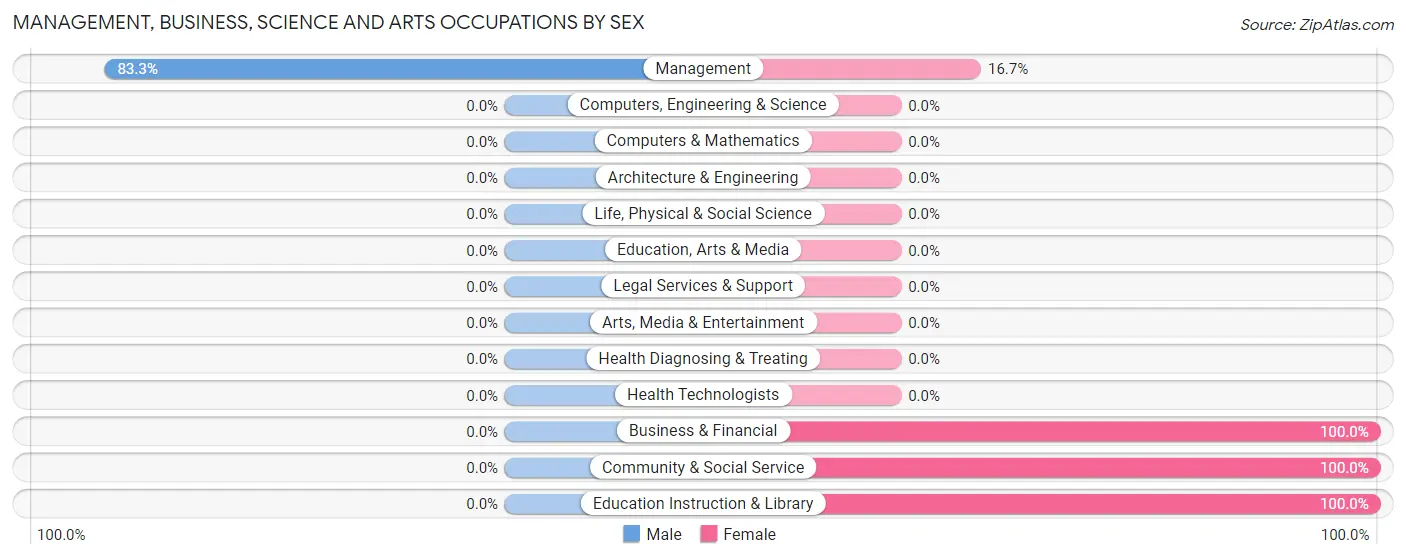
Management, Business, Science and Arts Occupations
The most common Management, Business, Science and Arts occupations in Pitkas Point are Management (12 | 21.0%), Business & Financial (3 | 5.3%), Community & Social Service (3 | 5.3%), and Education Instruction & Library (3 | 5.3%).
Management, Business, Science and Arts Occupations by Sex
| Occupation | Male | Female |
| Management | 10 (83.3%) | 2 (16.7%) |
| Business & Financial | 0 (0.0%) | 3 (100.0%) |
| Computers, Engineering & Science | 0 (0.0%) | 0 (0.0%) |
| Computers & Mathematics | 0 (0.0%) | 0 (0.0%) |
| Architecture & Engineering | 0 (0.0%) | 0 (0.0%) |
| Life, Physical & Social Science | 0 (0.0%) | 0 (0.0%) |
| Community & Social Service | 0 (0.0%) | 3 (100.0%) |
| Education, Arts & Media | 0 (0.0%) | 0 (0.0%) |
| Legal Services & Support | 0 (0.0%) | 0 (0.0%) |
| Education Instruction & Library | 0 (0.0%) | 3 (100.0%) |
| Arts, Media & Entertainment | 0 (0.0%) | 0 (0.0%) |
| Health Diagnosing & Treating | 0 (0.0%) | 0 (0.0%) |
| Health Technologists | 0 (0.0%) | 0 (0.0%) |
| Total (Category) | 10 (55.6%) | 8 (44.4%) |
| Total (Overall) | 36 (63.2%) | 21 (36.8%) |
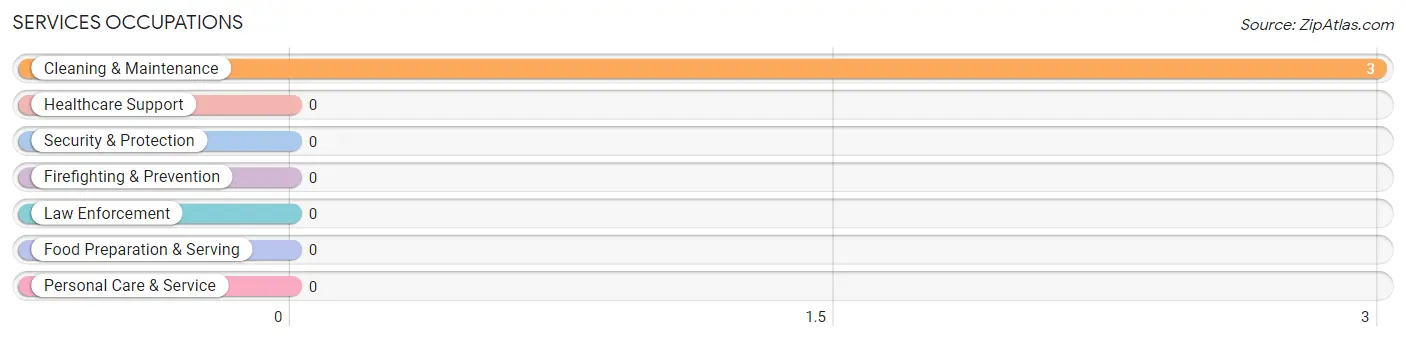
Services Occupations
The most common Services occupations in Pitkas Point are , and Cleaning & Maintenance (3 | 5.3%).
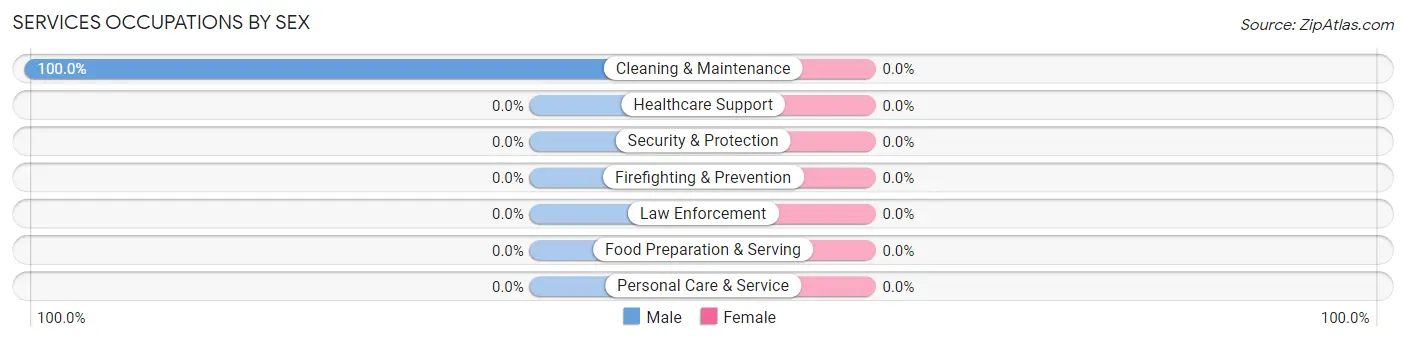
Services Occupations by Sex
| Occupation | Male | Female |
| Healthcare Support | 0 (0.0%) | 0 (0.0%) |
| Security & Protection | 0 (0.0%) | 0 (0.0%) |
| Firefighting & Prevention | 0 (0.0%) | 0 (0.0%) |
| Law Enforcement | 0 (0.0%) | 0 (0.0%) |
| Food Preparation & Serving | 0 (0.0%) | 0 (0.0%) |
| Cleaning & Maintenance | 3 (100.0%) | 0 (0.0%) |
| Personal Care & Service | 0 (0.0%) | 0 (0.0%) |
| Total (Category) | 3 (100.0%) | 0 (0.0%) |
| Total (Overall) | 36 (63.2%) | 21 (36.8%) |
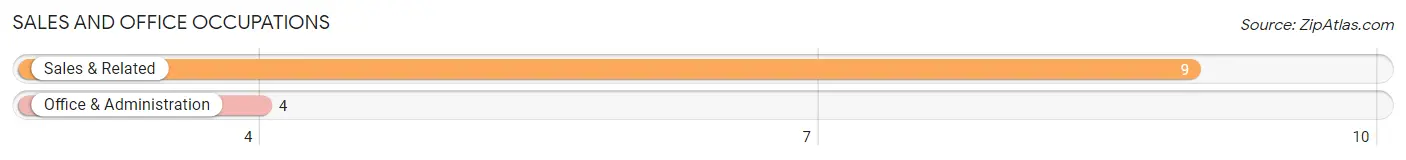
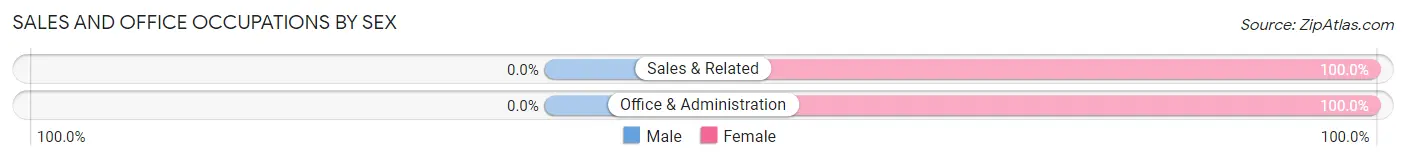
Sales and Office Occupations
The most common Sales and Office occupations in Pitkas Point are Sales & Related (9 | 15.8%), and Office & Administration (4 | 7.0%).
Sales and Office Occupations by Sex
| Occupation | Male | Female |
| Sales & Related | 0 (0.0%) | 9 (100.0%) |
| Office & Administration | 0 (0.0%) | 4 (100.0%) |
| Total (Category) | 0 (0.0%) | 13 (100.0%) |
| Total (Overall) | 36 (63.2%) | 21 (36.8%) |
Natural Resources, Construction and Maintenance Occupations
The most common Natural Resources, Construction and Maintenance occupations in Pitkas Point are , and Construction & Extraction (8 | 14.0%).
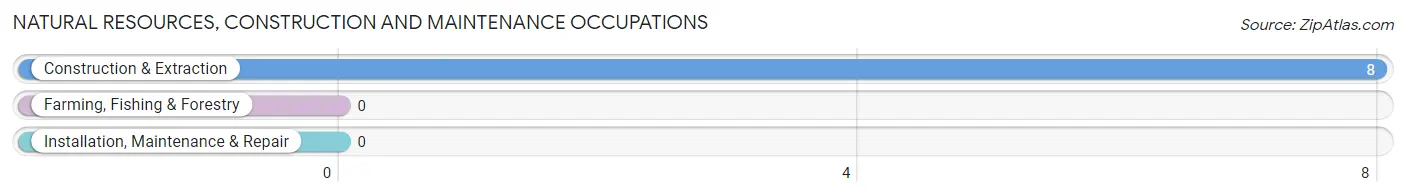
Natural Resources, Construction and Maintenance Occupations by Sex
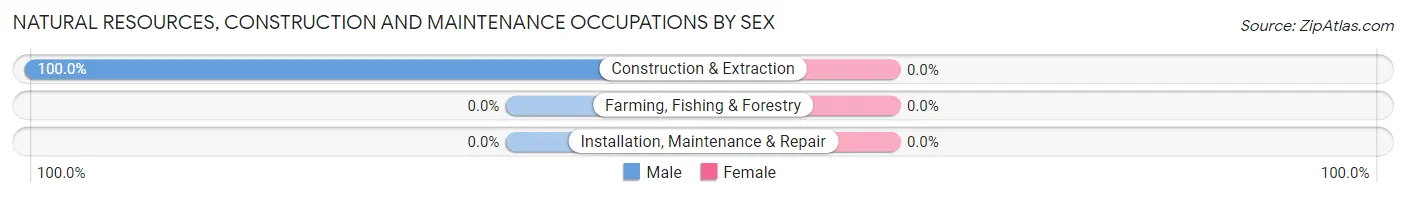
| Occupation | Male | Female |
| Farming, Fishing & Forestry | 0 (0.0%) | 0 (0.0%) |
| Construction & Extraction | 8 (100.0%) | 0 (0.0%) |
| Installation, Maintenance & Repair | 0 (0.0%) | 0 (0.0%) |
| Total (Category) | 8 (100.0%) | 0 (0.0%) |
| Total (Overall) | 36 (63.2%) | 21 (36.8%) |
Production, Transportation and Moving Occupations
The most common Production, Transportation and Moving occupations in Pitkas Point are Transportation (8 | 14.0%), and Material Moving (7 | 12.3%).
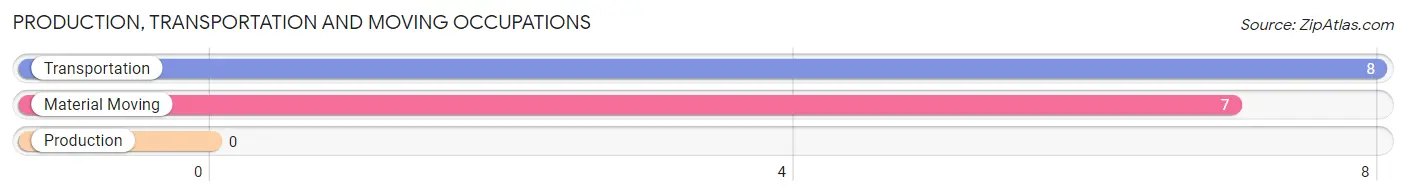
Production, Transportation and Moving Occupations by Sex
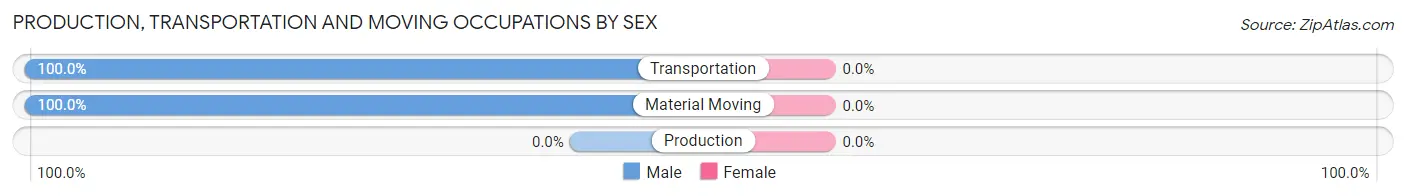
| Occupation | Male | Female |
| Production | 0 (0.0%) | 0 (0.0%) |
| Transportation | 8 (100.0%) | 0 (0.0%) |
| Material Moving | 7 (100.0%) | 0 (0.0%) |
| Total (Category) | 15 (100.0%) | 0 (0.0%) |
| Total (Overall) | 36 (63.2%) | 21 (36.8%) |
Employment Industries by Sex in Pitkas Point
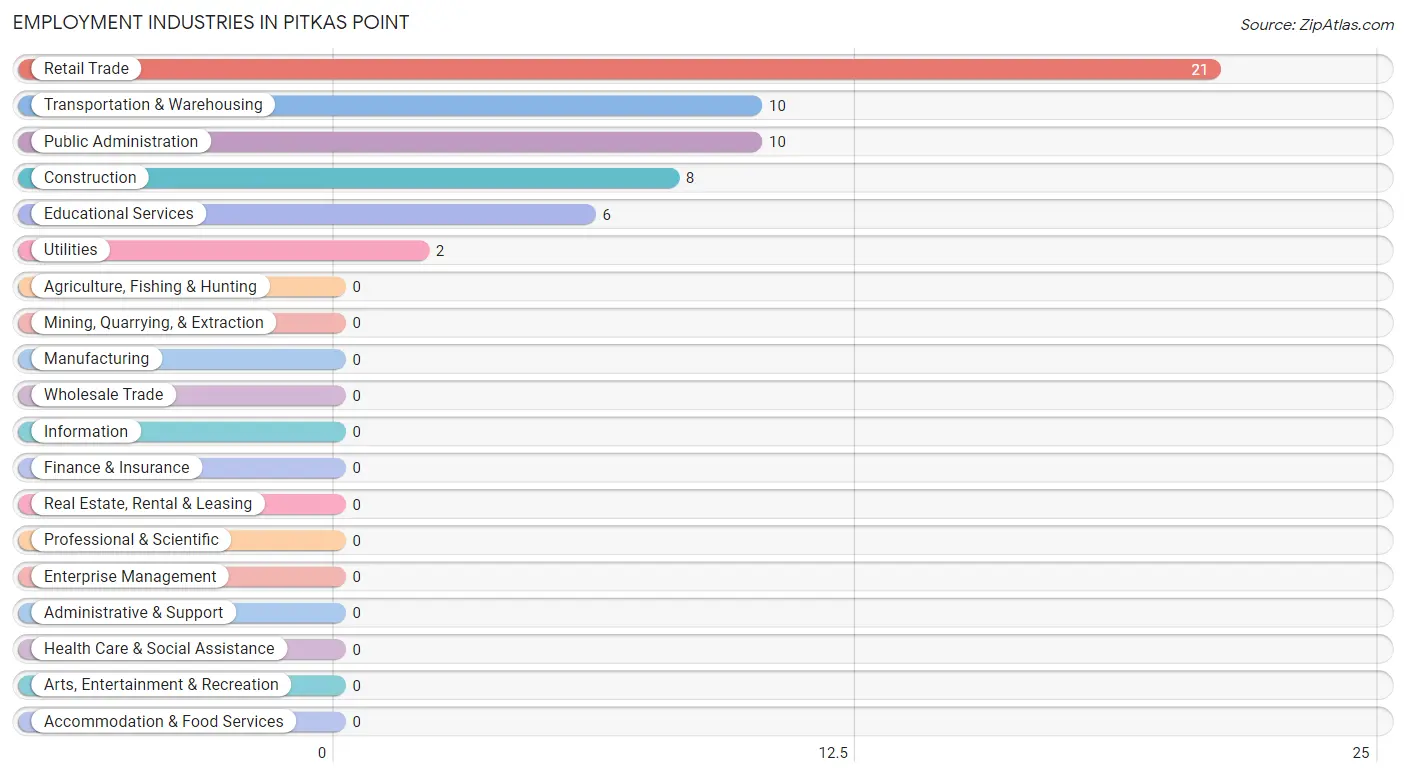
Employment Industries in Pitkas Point
The major employment industries in Pitkas Point include Retail Trade (21 | 36.8%), Transportation & Warehousing (10 | 17.5%), Public Administration (10 | 17.5%), Construction (8 | 14.0%), and Educational Services (6 | 10.5%).
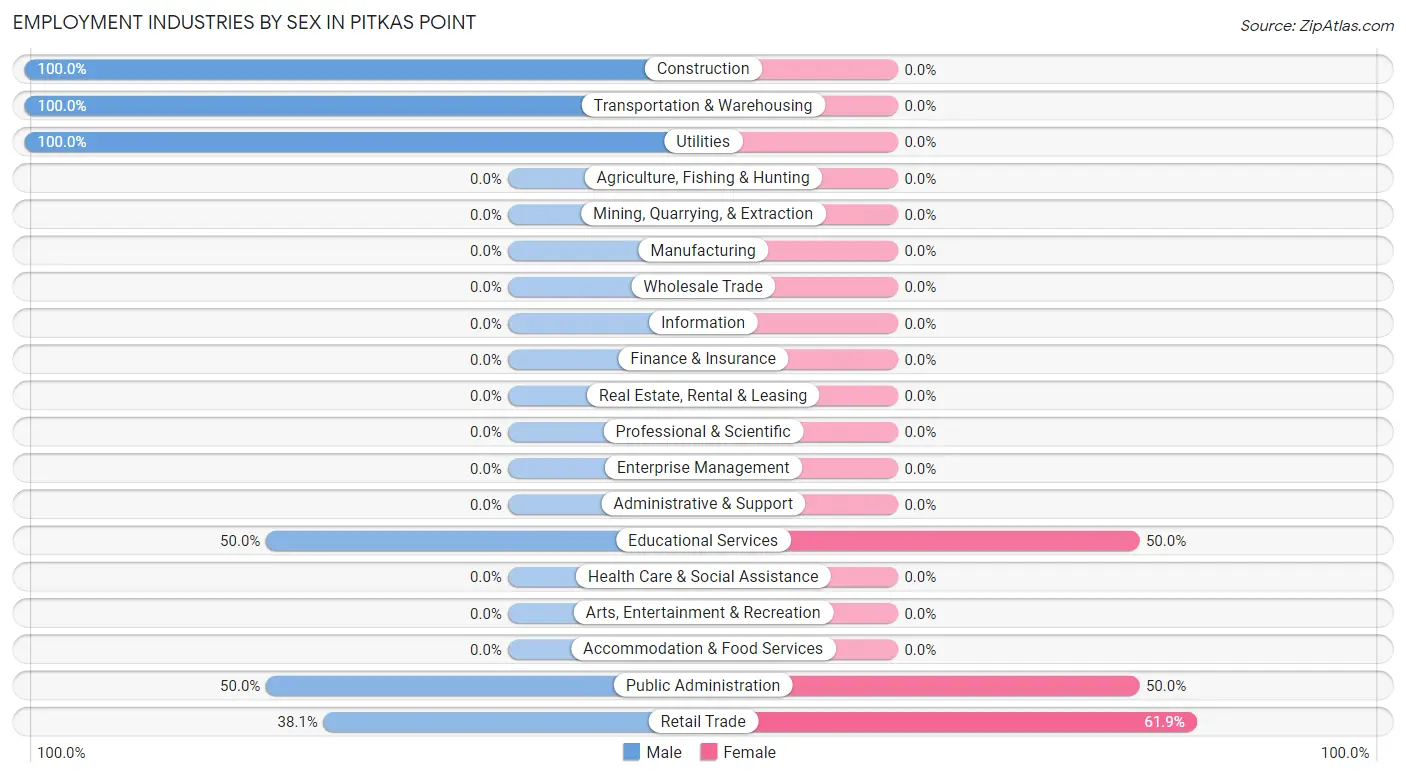
Employment Industries by Sex in Pitkas Point
The Pitkas Point industries that see more men than women are Construction (100.0%), Transportation & Warehousing (100.0%), and Utilities (100.0%), whereas the industries that tend to have a higher number of women are Retail Trade (61.9%), Educational Services (50.0%), and Public Administration (50.0%).
| Industry | Male | Female |
| Agriculture, Fishing & Hunting | 0 (0.0%) | 0 (0.0%) |
| Mining, Quarrying, & Extraction | 0 (0.0%) | 0 (0.0%) |
| Construction | 8 (100.0%) | 0 (0.0%) |
| Manufacturing | 0 (0.0%) | 0 (0.0%) |
| Wholesale Trade | 0 (0.0%) | 0 (0.0%) |
| Retail Trade | 8 (38.1%) | 13 (61.9%) |
| Transportation & Warehousing | 10 (100.0%) | 0 (0.0%) |
| Utilities | 2 (100.0%) | 0 (0.0%) |
| Information | 0 (0.0%) | 0 (0.0%) |
| Finance & Insurance | 0 (0.0%) | 0 (0.0%) |
| Real Estate, Rental & Leasing | 0 (0.0%) | 0 (0.0%) |
| Professional & Scientific | 0 (0.0%) | 0 (0.0%) |
| Enterprise Management | 0 (0.0%) | 0 (0.0%) |
| Administrative & Support | 0 (0.0%) | 0 (0.0%) |
| Educational Services | 3 (50.0%) | 3 (50.0%) |
| Health Care & Social Assistance | 0 (0.0%) | 0 (0.0%) |
| Arts, Entertainment & Recreation | 0 (0.0%) | 0 (0.0%) |
| Accommodation & Food Services | 0 (0.0%) | 0 (0.0%) |
| Public Administration | 5 (50.0%) | 5 (50.0%) |
| Total | 36 (63.2%) | 21 (36.8%) |
Education in Pitkas Point
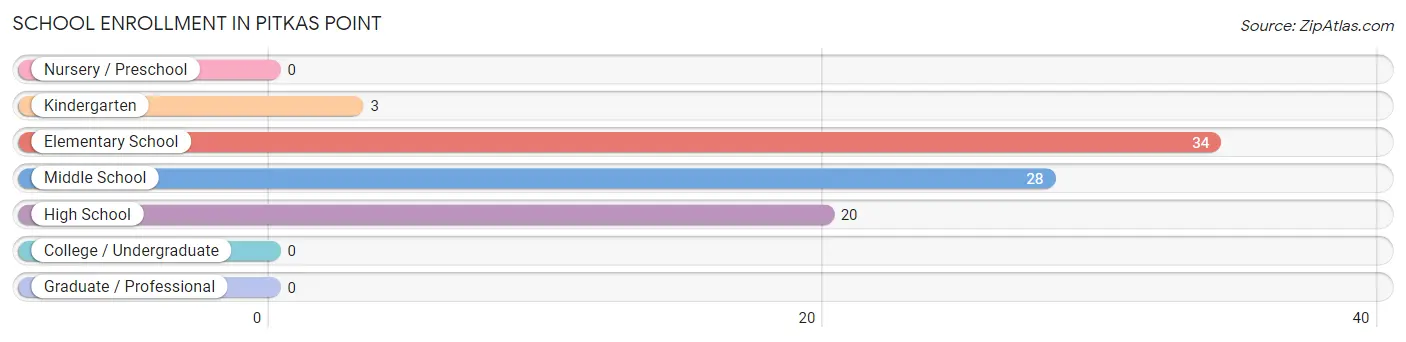
School Enrollment in Pitkas Point
The most common levels of schooling among the 85 students in Pitkas Point are elementary school (34 | 40.0%), middle school (28 | 32.9%), and high school (20 | 23.5%).
| School Level | # Students | % Students |
| Nursery / Preschool | 0 | 0.0% |
| Kindergarten | 3 | 3.5% |
| Elementary School | 34 | 40.0% |
| Middle School | 28 | 32.9% |
| High School | 20 | 23.5% |
| College / Undergraduate | 0 | 0.0% |
| Graduate / Professional | 0 | 0.0% |
| Total | 85 | 100.0% |
School Enrollment by Age by Funding Source in Pitkas Point
Out of a total of 85 students who are enrolled in schools in Pitkas Point, 4 (4.7%) attend a private institution, while the remaining 81 (95.3%) are enrolled in public schools. The age group of 10 to 14 year olds has the highest likelihood of being enrolled in private schools, with 4 (12.5% in the age bracket) enrolled. Conversely, the age group of 5 to 9 year old has the lowest likelihood of being enrolled in a private school, with 29 (100.0% in the age bracket) attending a public institution.
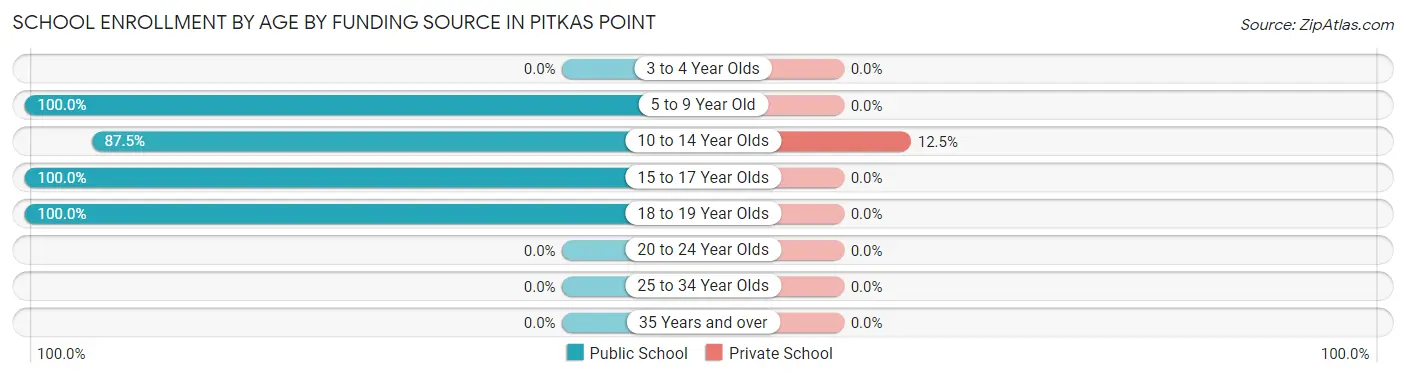
| Age Bracket | Public School | Private School |
| 3 to 4 Year Olds | 0 (0.0%) | 0 (0.0%) |
| 5 to 9 Year Old | 29 (100.0%) | 0 (0.0%) |
| 10 to 14 Year Olds | 28 (87.5%) | 4 (12.5%) |
| 15 to 17 Year Olds | 20 (100.0%) | 0 (0.0%) |
| 18 to 19 Year Olds | 4 (100.0%) | 0 (0.0%) |
| 20 to 24 Year Olds | 0 (0.0%) | 0 (0.0%) |
| 25 to 34 Year Olds | 0 (0.0%) | 0 (0.0%) |
| 35 Years and over | 0 (0.0%) | 0 (0.0%) |
| Total | 81 (95.3%) | 4 (4.7%) |
Educational Attainment by Field of Study in Pitkas Point
| Field of Study | # Graduates | % Graduates |
| Computers & Mathematics | 0 | 0.0% |
| Bio, Nature & Agricultural | 0 | 0.0% |
| Physical & Health Sciences | 0 | 0.0% |
| Psychology | 0 | 0.0% |
| Social Sciences | 0 | 0.0% |
| Engineering | 0 | 0.0% |
| Multidisciplinary Studies | 0 | 0.0% |
| Science & Technology | 0 | 0.0% |
| Business | 0 | 0.0% |
| Education | 0 | 0.0% |
| Literature & Languages | 0 | 0.0% |
| Liberal Arts & History | 0 | 0.0% |
| Visual & Performing Arts | 0 | 0.0% |
| Communications | 0 | 0.0% |
| Arts & Humanities | 0 | 0.0% |
| Total | 0 | 0.0% |
Transportation & Commute in Pitkas Point
Vehicle Availability by Sex in Pitkas Point
The most prevalent vehicle ownership categories in Pitkas Point are males with no vehicle (23, accounting for 63.9%) and females with no vehicle (12, making up 109.5%).
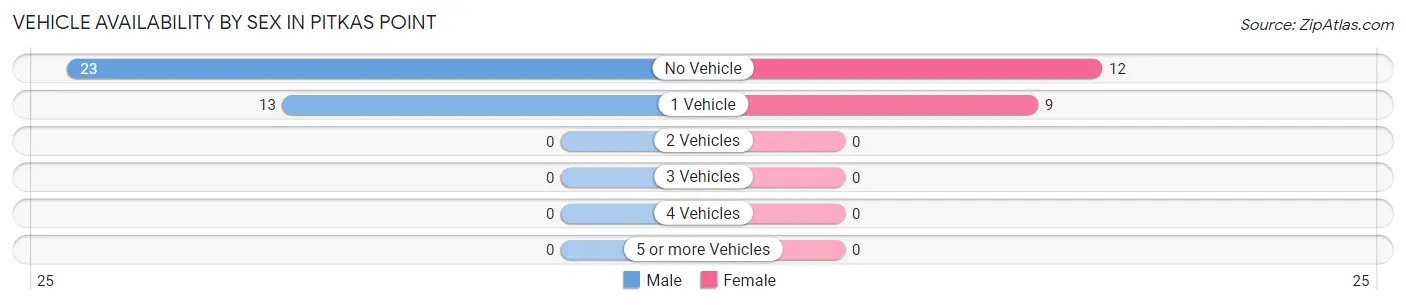
| Vehicles Available | Male | Female |
| No Vehicle | 23 (63.9%) | 12 (57.1%) |
| 1 Vehicle | 13 (36.1%) | 9 (42.9%) |
| 2 Vehicles | 0 (0.0%) | 0 (0.0%) |
| 3 Vehicles | 0 (0.0%) | 0 (0.0%) |
| 4 Vehicles | 0 (0.0%) | 0 (0.0%) |
| 5 or more Vehicles | 0 (0.0%) | 0 (0.0%) |
| Total | 36 (100.0%) | 21 (100.0%) |
Commute Time in Pitkas Point
The most frequently occuring commute durations in Pitkas Point are 5 to 9 minutes (23 commuters, 40.4%), less than 5 minutes (20 commuters, 35.1%), and 15 to 19 minutes (6 commuters, 10.5%).
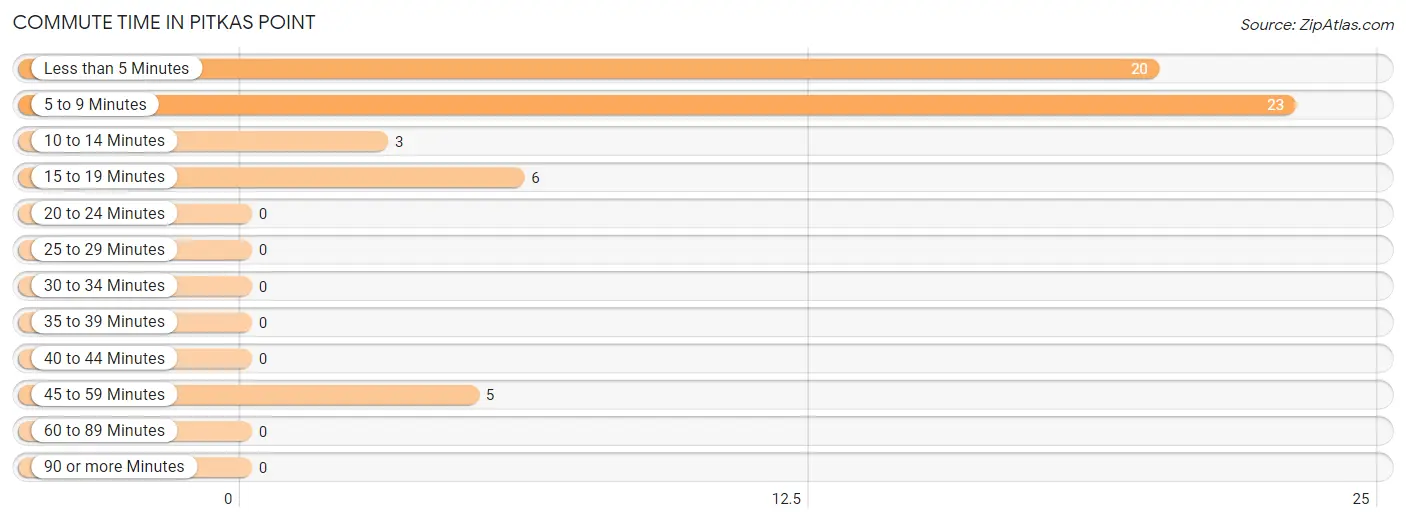
| Commute Time | # Commuters | % Commuters |
| Less than 5 Minutes | 20 | 35.1% |
| 5 to 9 Minutes | 23 | 40.4% |
| 10 to 14 Minutes | 3 | 5.3% |
| 15 to 19 Minutes | 6 | 10.5% |
| 20 to 24 Minutes | 0 | 0.0% |
| 25 to 29 Minutes | 0 | 0.0% |
| 30 to 34 Minutes | 0 | 0.0% |
| 35 to 39 Minutes | 0 | 0.0% |
| 40 to 44 Minutes | 0 | 0.0% |
| 45 to 59 Minutes | 5 | 8.8% |
| 60 to 89 Minutes | 0 | 0.0% |
| 90 or more Minutes | 0 | 0.0% |
Commute Time by Sex in Pitkas Point
The most common commute times in Pitkas Point are 5 to 9 minutes (23 commuters, 63.9%) for males and less than 5 minutes (15 commuters, 71.4%) for females.
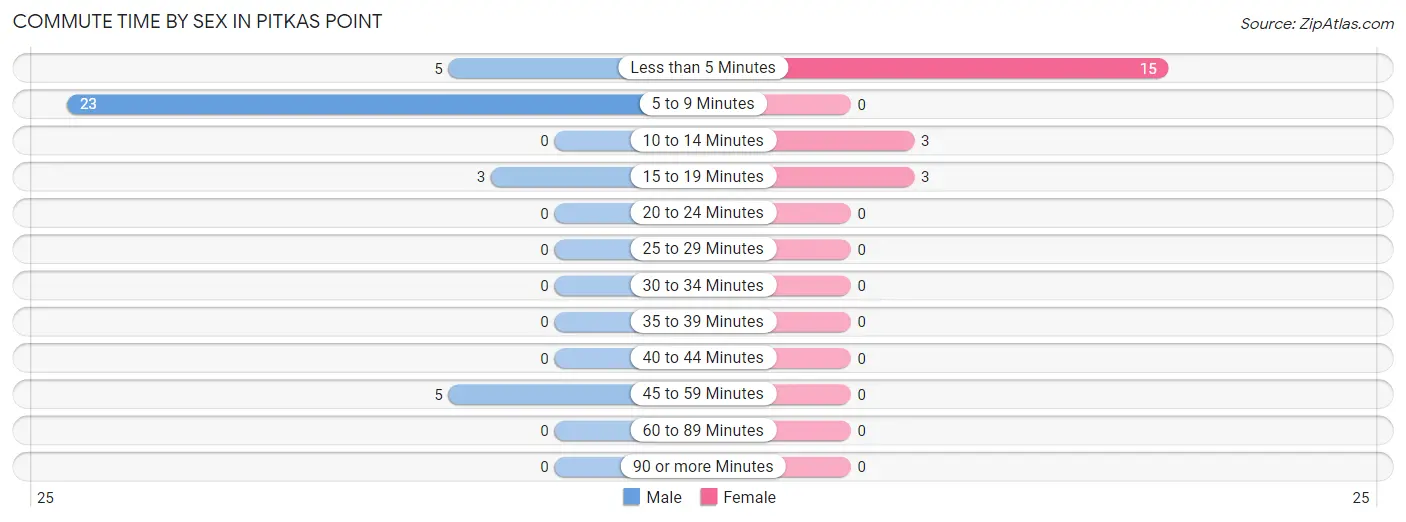
| Commute Time | Male | Female |
| Less than 5 Minutes | 5 (13.9%) | 15 (71.4%) |
| 5 to 9 Minutes | 23 (63.9%) | 0 (0.0%) |
| 10 to 14 Minutes | 0 (0.0%) | 3 (14.3%) |
| 15 to 19 Minutes | 3 (8.3%) | 3 (14.3%) |
| 20 to 24 Minutes | 0 (0.0%) | 0 (0.0%) |
| 25 to 29 Minutes | 0 (0.0%) | 0 (0.0%) |
| 30 to 34 Minutes | 0 (0.0%) | 0 (0.0%) |
| 35 to 39 Minutes | 0 (0.0%) | 0 (0.0%) |
| 40 to 44 Minutes | 0 (0.0%) | 0 (0.0%) |
| 45 to 59 Minutes | 5 (13.9%) | 0 (0.0%) |
| 60 to 89 Minutes | 0 (0.0%) | 0 (0.0%) |
| 90 or more Minutes | 0 (0.0%) | 0 (0.0%) |
Time of Departure to Work by Sex in Pitkas Point
The most frequent times of departure to work in Pitkas Point are 7:30 AM to 7:59 AM (10, 27.8%) for males and 8:00 AM to 8:29 AM (6, 28.6%) for females.
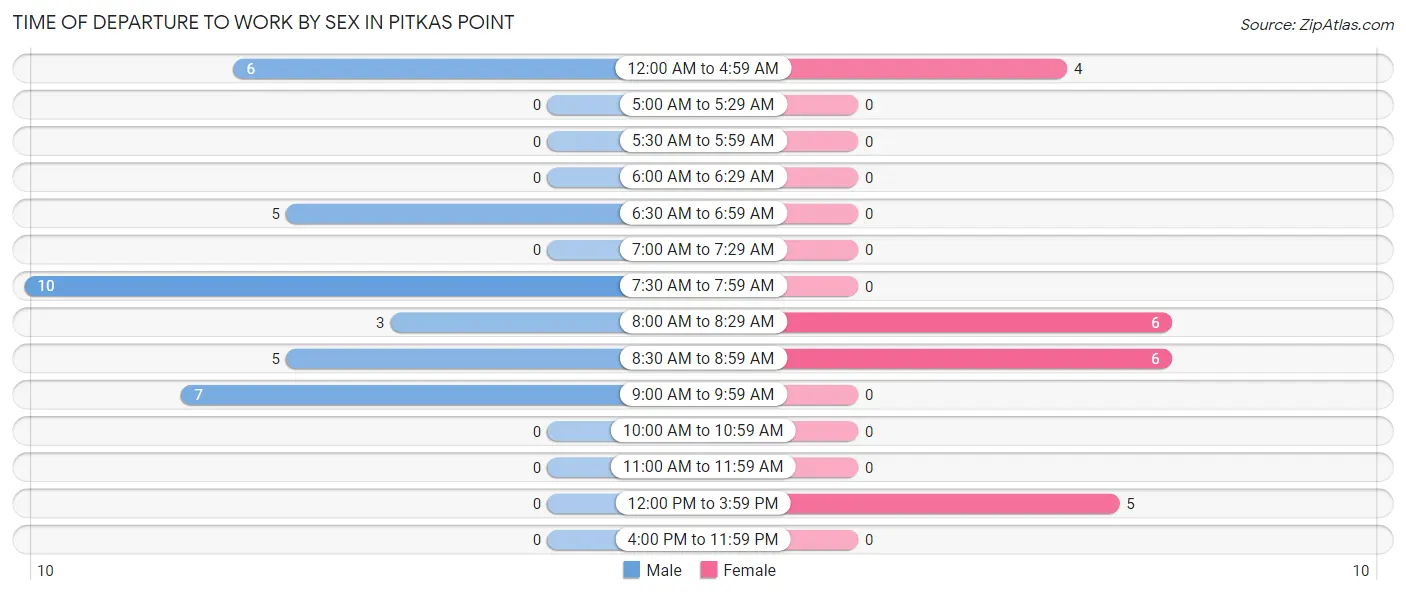
| Time of Departure | Male | Female |
| 12:00 AM to 4:59 AM | 6 (16.7%) | 4 (19.1%) |
| 5:00 AM to 5:29 AM | 0 (0.0%) | 0 (0.0%) |
| 5:30 AM to 5:59 AM | 0 (0.0%) | 0 (0.0%) |
| 6:00 AM to 6:29 AM | 0 (0.0%) | 0 (0.0%) |
| 6:30 AM to 6:59 AM | 5 (13.9%) | 0 (0.0%) |
| 7:00 AM to 7:29 AM | 0 (0.0%) | 0 (0.0%) |
| 7:30 AM to 7:59 AM | 10 (27.8%) | 0 (0.0%) |
| 8:00 AM to 8:29 AM | 3 (8.3%) | 6 (28.6%) |
| 8:30 AM to 8:59 AM | 5 (13.9%) | 6 (28.6%) |
| 9:00 AM to 9:59 AM | 7 (19.4%) | 0 (0.0%) |
| 10:00 AM to 10:59 AM | 0 (0.0%) | 0 (0.0%) |
| 11:00 AM to 11:59 AM | 0 (0.0%) | 0 (0.0%) |
| 12:00 PM to 3:59 PM | 0 (0.0%) | 5 (23.8%) |
| 4:00 PM to 11:59 PM | 0 (0.0%) | 0 (0.0%) |
| Total | 36 (100.0%) | 21 (100.0%) |
Housing Occupancy in Pitkas Point
Occupancy by Ownership in Pitkas Point
Of the total 55 dwellings in Pitkas Point, owner-occupied units account for 34 (61.8%), while renter-occupied units make up 21 (38.2%).
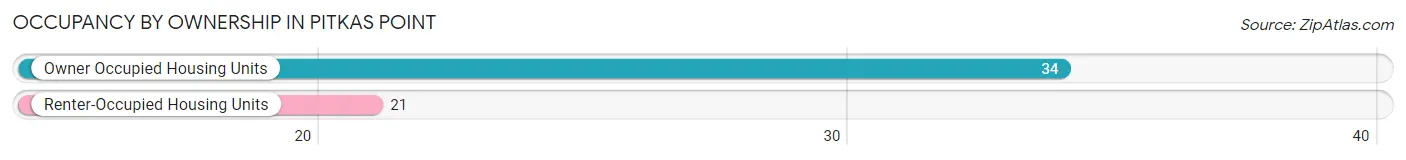
| Occupancy | # Housing Units | % Housing Units |
| Owner Occupied Housing Units | 34 | 61.8% |
| Renter-Occupied Housing Units | 21 | 38.2% |
| Total Occupied Housing Units | 55 | 100.0% |
Occupancy by Household Size in Pitkas Point
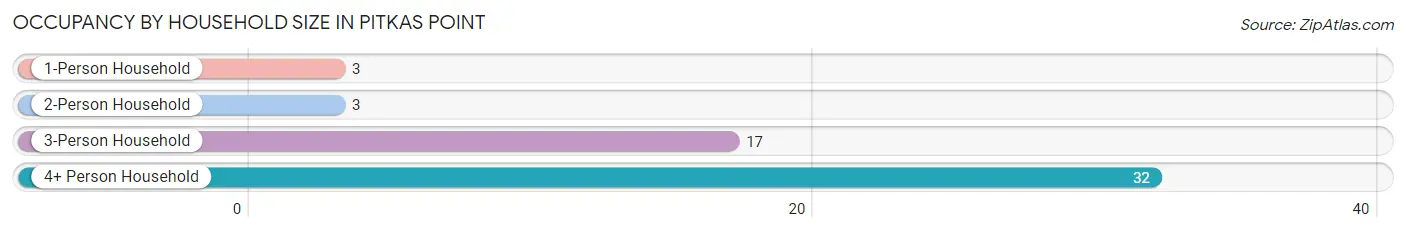
| Household Size | # Housing Units | % Housing Units |
| 1-Person Household | 3 | 5.4% |
| 2-Person Household | 3 | 5.4% |
| 3-Person Household | 17 | 30.9% |
| 4+ Person Household | 32 | 58.2% |
| Total Housing Units | 55 | 100.0% |
Occupancy by Ownership by Household Size in Pitkas Point
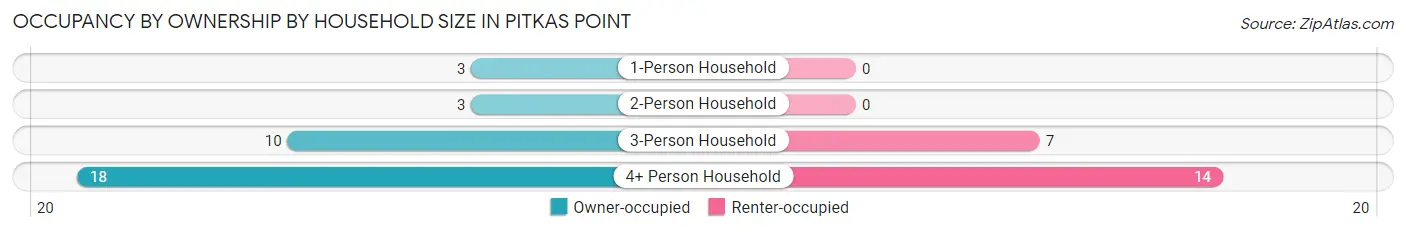
| Household Size | Owner-occupied | Renter-occupied |
| 1-Person Household | 3 (100.0%) | 0 (0.0%) |
| 2-Person Household | 3 (100.0%) | 0 (0.0%) |
| 3-Person Household | 10 (58.8%) | 7 (41.2%) |
| 4+ Person Household | 18 (56.2%) | 14 (43.8%) |
| Total Housing Units | 34 (61.8%) | 21 (38.2%) |
Occupancy by Educational Attainment in Pitkas Point
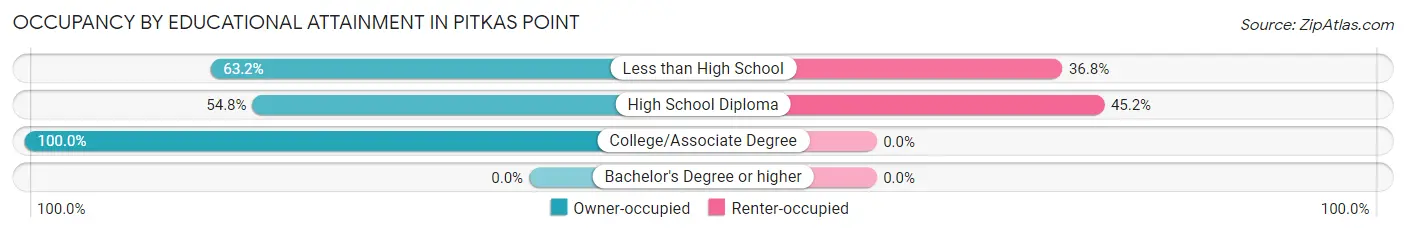
| Household Size | Owner-occupied | Renter-occupied |
| Less than High School | 12 (63.2%) | 7 (36.8%) |
| High School Diploma | 17 (54.8%) | 14 (45.2%) |
| College/Associate Degree | 5 (100.0%) | 0 (0.0%) |
| Bachelor's Degree or higher | 0 (0.0%) | 0 (0.0%) |
Occupancy by Age of Householder in Pitkas Point
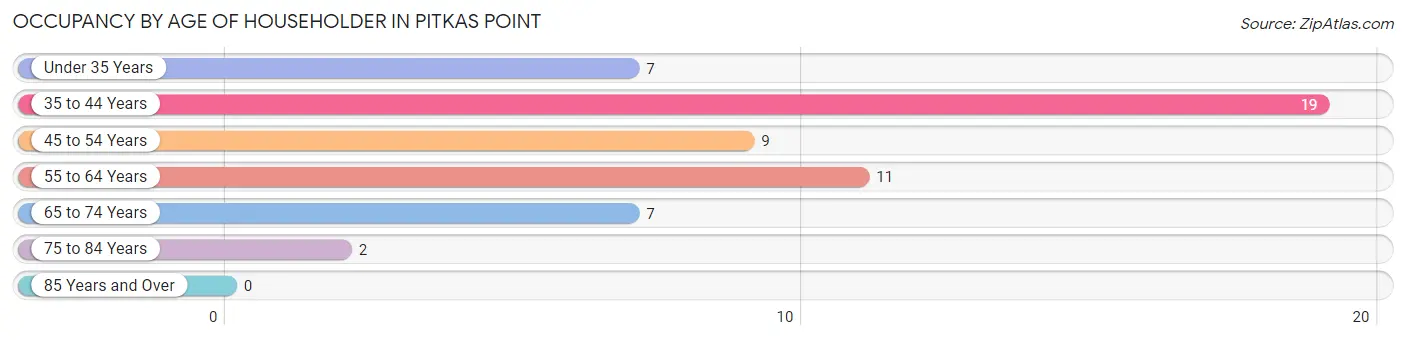
| Age Bracket | # Households | % Households |
| Under 35 Years | 7 | 12.7% |
| 35 to 44 Years | 19 | 34.5% |
| 45 to 54 Years | 9 | 16.4% |
| 55 to 64 Years | 11 | 20.0% |
| 65 to 74 Years | 7 | 12.7% |
| 75 to 84 Years | 2 | 3.6% |
| 85 Years and Over | 0 | 0.0% |
| Total | 55 | 100.0% |
Housing Finances in Pitkas Point
Median Income by Occupancy in Pitkas Point
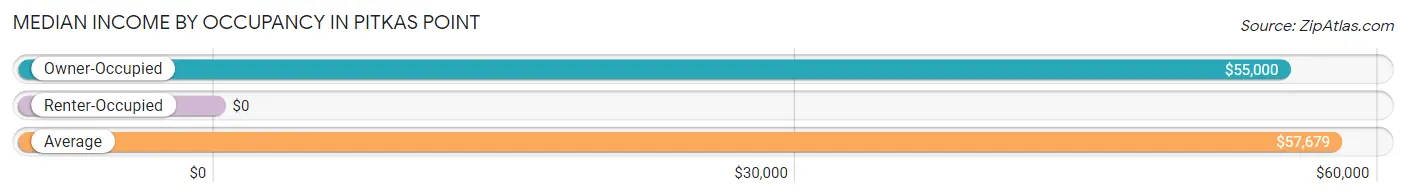
| Occupancy Type | # Households | Median Income |
| Owner-Occupied | 34 (61.8%) | $55,000 |
| Renter-Occupied | 21 (38.2%) | $0 |
| Average | 55 (100.0%) | $57,679 |
Occupancy by Householder Income Bracket in Pitkas Point
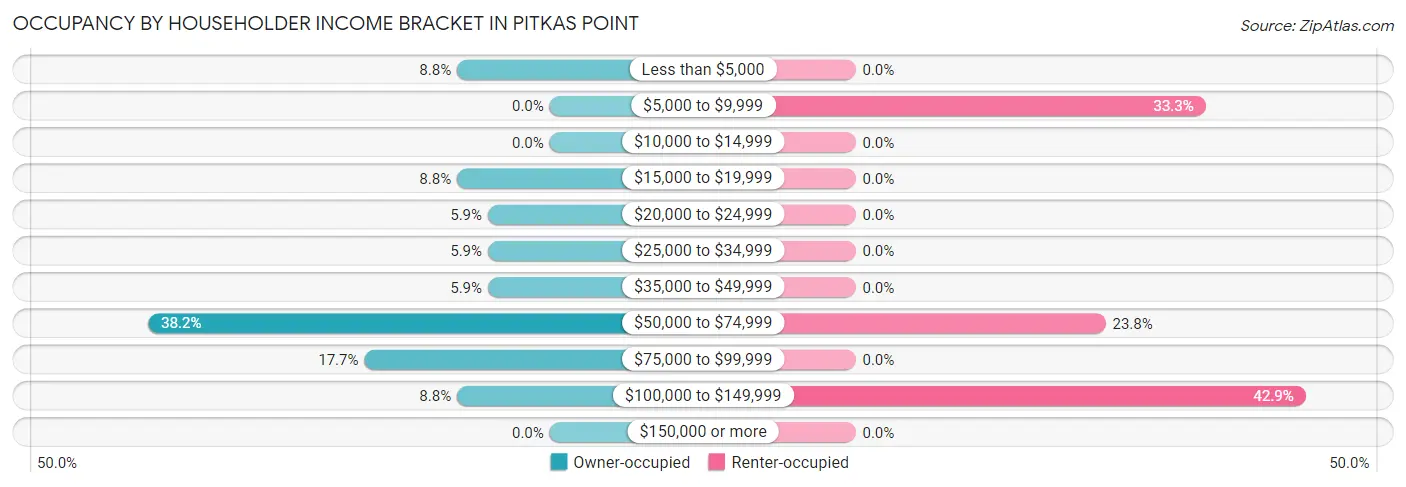
| Income Bracket | Owner-occupied | Renter-occupied |
| Less than $5,000 | 3 (8.8%) | 0 (0.0%) |
| $5,000 to $9,999 | 0 (0.0%) | 7 (33.3%) |
| $10,000 to $14,999 | 0 (0.0%) | 0 (0.0%) |
| $15,000 to $19,999 | 3 (8.8%) | 0 (0.0%) |
| $20,000 to $24,999 | 2 (5.9%) | 0 (0.0%) |
| $25,000 to $34,999 | 2 (5.9%) | 0 (0.0%) |
| $35,000 to $49,999 | 2 (5.9%) | 0 (0.0%) |
| $50,000 to $74,999 | 13 (38.2%) | 5 (23.8%) |
| $75,000 to $99,999 | 6 (17.6%) | 0 (0.0%) |
| $100,000 to $149,999 | 3 (8.8%) | 9 (42.9%) |
| $150,000 or more | 0 (0.0%) | 0 (0.0%) |
| Total | 34 (100.0%) | 21 (100.0%) |
Monthly Housing Cost Tiers in Pitkas Point
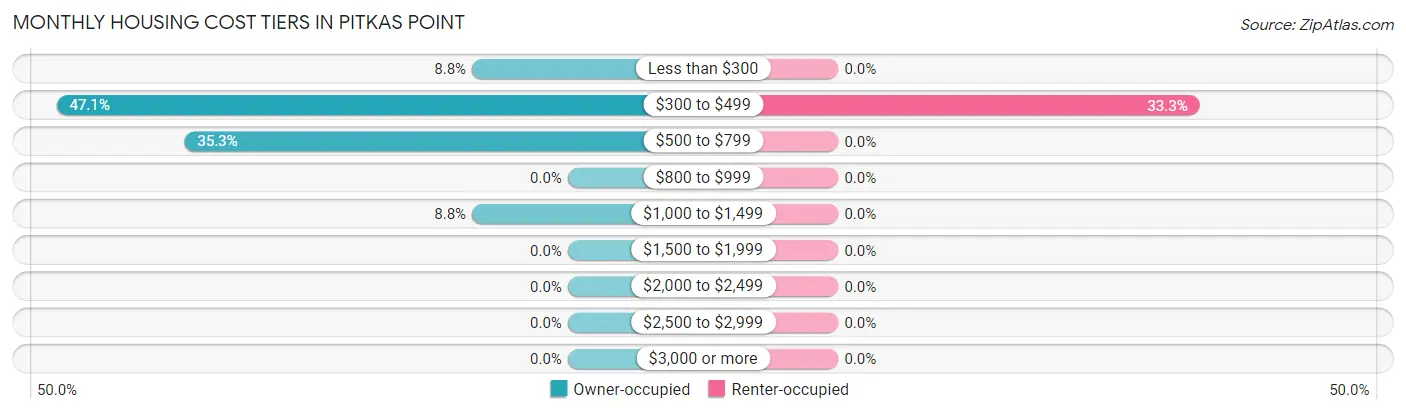
| Monthly Cost | Owner-occupied | Renter-occupied |
| Less than $300 | 3 (8.8%) | 0 (0.0%) |
| $300 to $499 | 16 (47.1%) | 7 (33.3%) |
| $500 to $799 | 12 (35.3%) | 0 (0.0%) |
| $800 to $999 | 0 (0.0%) | 0 (0.0%) |
| $1,000 to $1,499 | 3 (8.8%) | 0 (0.0%) |
| $1,500 to $1,999 | 0 (0.0%) | 0 (0.0%) |
| $2,000 to $2,499 | 0 (0.0%) | 0 (0.0%) |
| $2,500 to $2,999 | 0 (0.0%) | 0 (0.0%) |
| $3,000 or more | 0 (0.0%) | 0 (0.0%) |
| Total | 34 (100.0%) | 21 (100.0%) |
Physical Housing Characteristics in Pitkas Point
Housing Structures in Pitkas Point
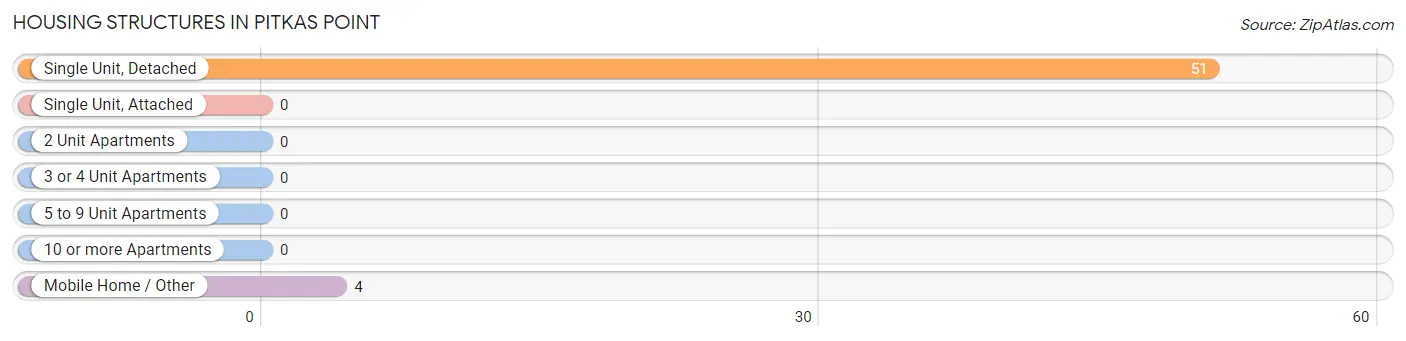
| Structure Type | # Housing Units | % Housing Units |
| Single Unit, Detached | 51 | 92.7% |
| Single Unit, Attached | 0 | 0.0% |
| 2 Unit Apartments | 0 | 0.0% |
| 3 or 4 Unit Apartments | 0 | 0.0% |
| 5 to 9 Unit Apartments | 0 | 0.0% |
| 10 or more Apartments | 0 | 0.0% |
| Mobile Home / Other | 4 | 7.3% |
| Total | 55 | 100.0% |
Housing Structures by Occupancy in Pitkas Point
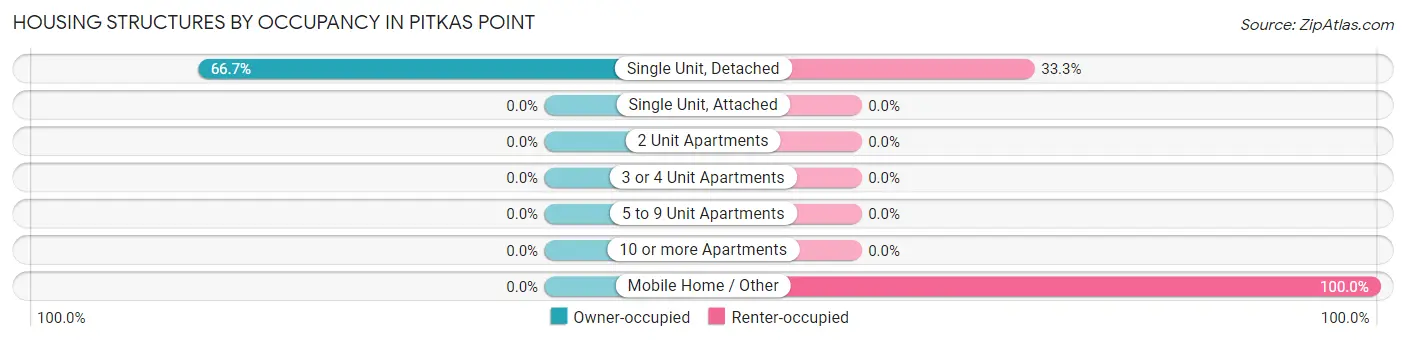
| Structure Type | Owner-occupied | Renter-occupied |
| Single Unit, Detached | 34 (66.7%) | 17 (33.3%) |
| Single Unit, Attached | 0 (0.0%) | 0 (0.0%) |
| 2 Unit Apartments | 0 (0.0%) | 0 (0.0%) |
| 3 or 4 Unit Apartments | 0 (0.0%) | 0 (0.0%) |
| 5 to 9 Unit Apartments | 0 (0.0%) | 0 (0.0%) |
| 10 or more Apartments | 0 (0.0%) | 0 (0.0%) |
| Mobile Home / Other | 0 (0.0%) | 4 (100.0%) |
| Total | 34 (61.8%) | 21 (38.2%) |
Housing Structures by Number of Rooms in Pitkas Point
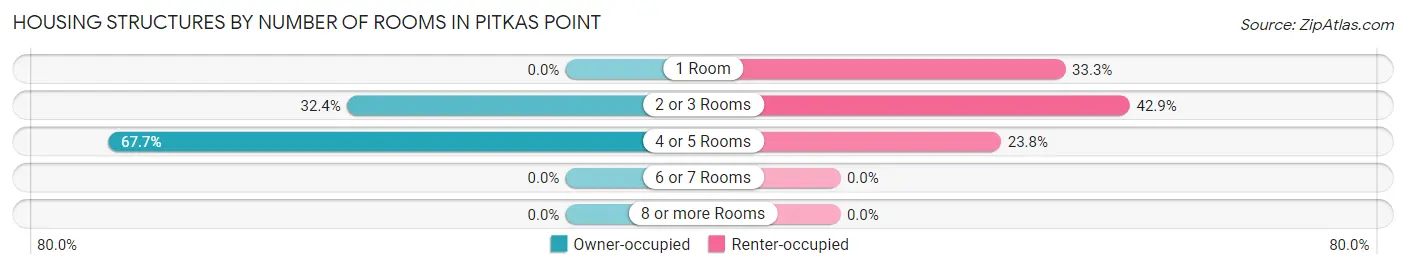
| Number of Rooms | Owner-occupied | Renter-occupied |
| 1 Room | 0 (0.0%) | 7 (33.3%) |
| 2 or 3 Rooms | 11 (32.4%) | 9 (42.9%) |
| 4 or 5 Rooms | 23 (67.6%) | 5 (23.8%) |
| 6 or 7 Rooms | 0 (0.0%) | 0 (0.0%) |
| 8 or more Rooms | 0 (0.0%) | 0 (0.0%) |
| Total | 34 (100.0%) | 21 (100.0%) |
Housing Structure by Heating Type in Pitkas Point
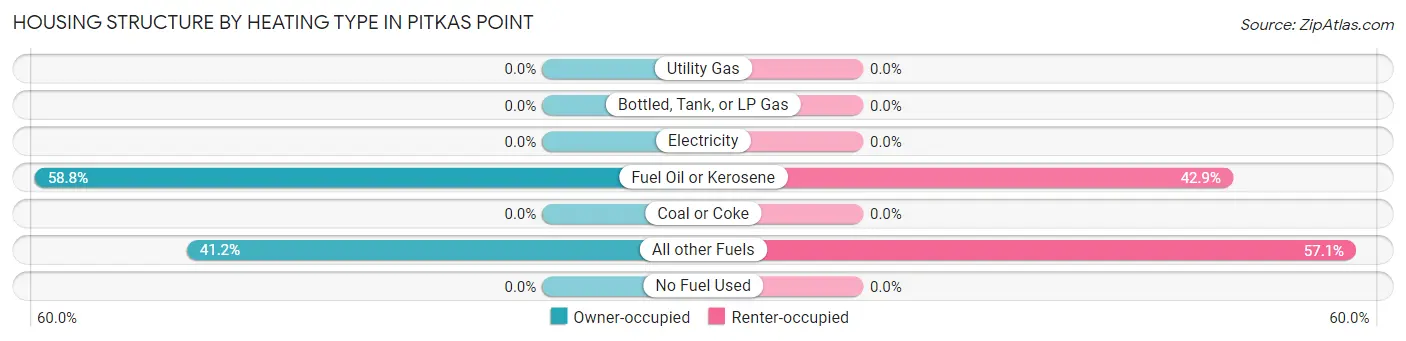
| Heating Type | Owner-occupied | Renter-occupied |
| Utility Gas | 0 (0.0%) | 0 (0.0%) |
| Bottled, Tank, or LP Gas | 0 (0.0%) | 0 (0.0%) |
| Electricity | 0 (0.0%) | 0 (0.0%) |
| Fuel Oil or Kerosene | 20 (58.8%) | 9 (42.9%) |
| Coal or Coke | 0 (0.0%) | 0 (0.0%) |
| All other Fuels | 14 (41.2%) | 12 (57.1%) |
| No Fuel Used | 0 (0.0%) | 0 (0.0%) |
| Total | 34 (100.0%) | 21 (100.0%) |
Household Vehicle Usage in Pitkas Point
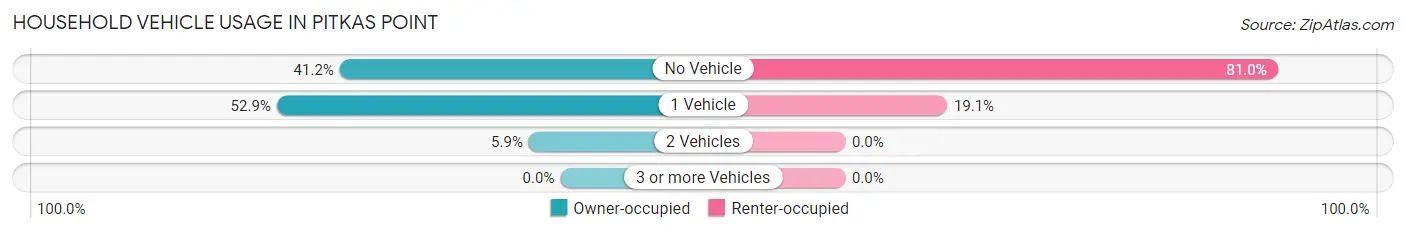
| Vehicles per Household | Owner-occupied | Renter-occupied |
| No Vehicle | 14 (41.2%) | 17 (80.9%) |
| 1 Vehicle | 18 (52.9%) | 4 (19.1%) |
| 2 Vehicles | 2 (5.9%) | 0 (0.0%) |
| 3 or more Vehicles | 0 (0.0%) | 0 (0.0%) |
| Total | 34 (100.0%) | 21 (100.0%) |
Real Estate & Mortgages in Pitkas Point
Real Estate and Mortgage Overview in Pitkas Point
| Characteristic | Without Mortgage | With Mortgage |
| Housing Units | 31 | 3 |
| Median Property Value | $122,900 | $0 |
| Median Household Income | $56,250 | $0 |
| Monthly Housing Costs | $465 | $0 |
| Real Estate Taxes | - | - |
Property Value by Mortgage Status in Pitkas Point
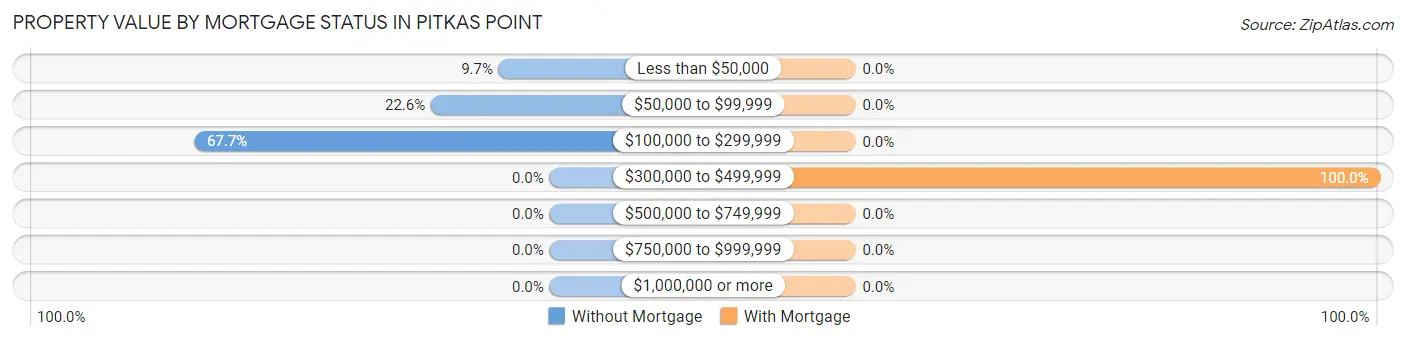
| Property Value | Without Mortgage | With Mortgage |
| Less than $50,000 | 3 (9.7%) | 0 (0.0%) |
| $50,000 to $99,999 | 7 (22.6%) | 0 (0.0%) |
| $100,000 to $299,999 | 21 (67.7%) | 0 (0.0%) |
| $300,000 to $499,999 | 0 (0.0%) | 3 (100.0%) |
| $500,000 to $749,999 | 0 (0.0%) | 0 (0.0%) |
| $750,000 to $999,999 | 0 (0.0%) | 0 (0.0%) |
| $1,000,000 or more | 0 (0.0%) | 0 (0.0%) |
| Total | 31 (100.0%) | 3 (100.0%) |
Household Income by Mortgage Status in Pitkas Point
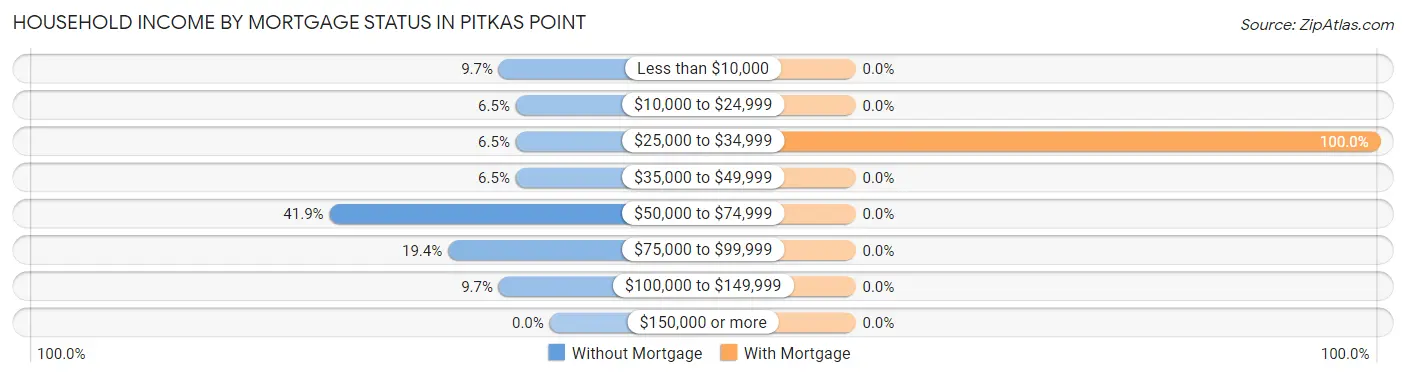
| Household Income | Without Mortgage | With Mortgage |
| Less than $10,000 | 3 (9.7%) | 0 (0.0%) |
| $10,000 to $24,999 | 2 (6.5%) | 0 (0.0%) |
| $25,000 to $34,999 | 2 (6.5%) | 3 (100.0%) |
| $35,000 to $49,999 | 2 (6.5%) | 0 (0.0%) |
| $50,000 to $74,999 | 13 (41.9%) | 0 (0.0%) |
| $75,000 to $99,999 | 6 (19.4%) | 0 (0.0%) |
| $100,000 to $149,999 | 3 (9.7%) | 0 (0.0%) |
| $150,000 or more | 0 (0.0%) | 0 (0.0%) |
| Total | 31 (100.0%) | 3 (100.0%) |
Property Value to Household Income Ratio in Pitkas Point
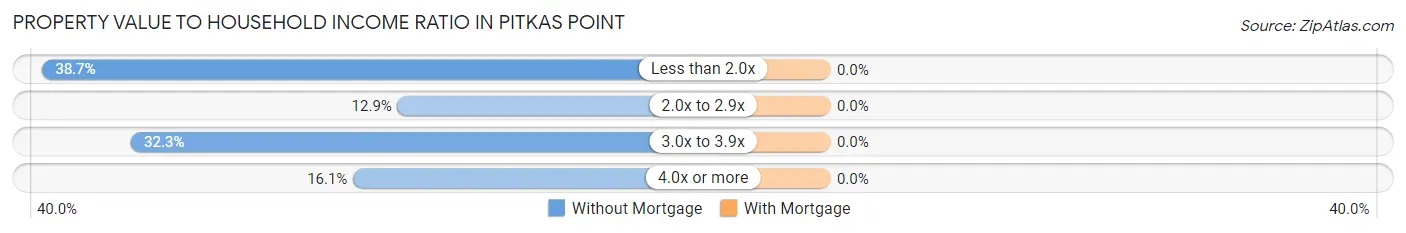
| Value-to-Income Ratio | Without Mortgage | With Mortgage |
| Less than 2.0x | 12 (38.7%) | 0 (0.0%) |
| 2.0x to 2.9x | 4 (12.9%) | 0 (0.0%) |
| 3.0x to 3.9x | 10 (32.3%) | 0 (0.0%) |
| 4.0x or more | 5 (16.1%) | 0 (0.0%) |
| Total | 31 (100.0%) | 3 (100.0%) |
Real Estate Taxes by Mortgage Status in Pitkas Point
| Property Taxes | Without Mortgage | With Mortgage |
| Less than $800 | 0 (0.0%) | 0 (0.0%) |
| $800 to $1,499 | 0 (0.0%) | 0 (0.0%) |
| $800 to $1,499 | 0 (0.0%) | 0 (0.0%) |
| Total | 31 (100.0%) | 3 (100.0%) |
Health & Disability in Pitkas Point
Health Insurance Coverage by Age in Pitkas Point
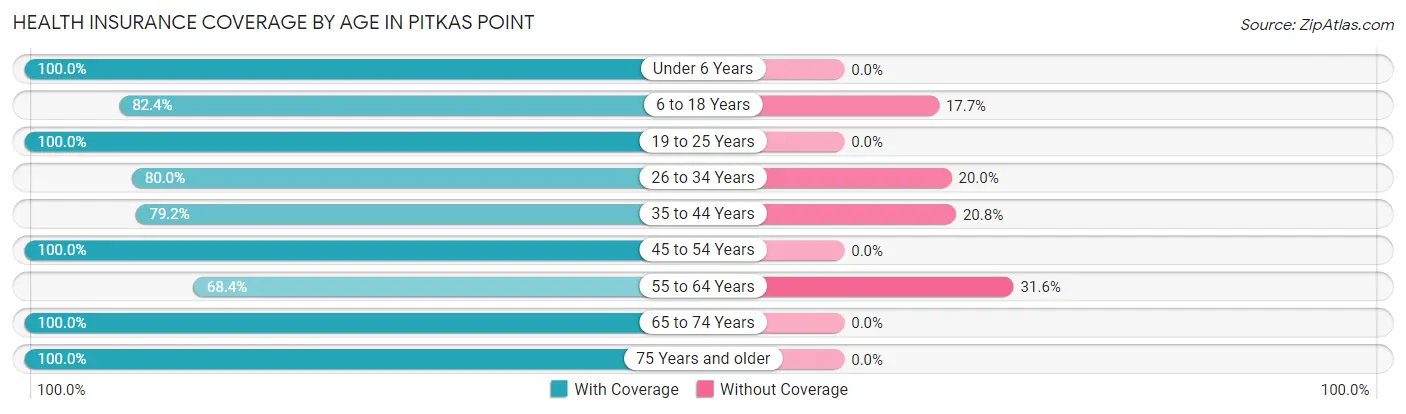
| Age Bracket | With Coverage | Without Coverage |
| Under 6 Years | 24 (100.0%) | 0 (0.0%) |
| 6 to 18 Years | 70 (82.4%) | 15 (17.6%) |
| 19 to 25 Years | 22 (100.0%) | 0 (0.0%) |
| 26 to 34 Years | 28 (80.0%) | 7 (20.0%) |
| 35 to 44 Years | 19 (79.2%) | 5 (20.8%) |
| 45 to 54 Years | 15 (100.0%) | 0 (0.0%) |
| 55 to 64 Years | 13 (68.4%) | 6 (31.6%) |
| 65 to 74 Years | 13 (100.0%) | 0 (0.0%) |
| 75 Years and older | 2 (100.0%) | 0 (0.0%) |
| Total | 206 (86.2%) | 33 (13.8%) |
Health Insurance Coverage by Citizenship Status in Pitkas Point
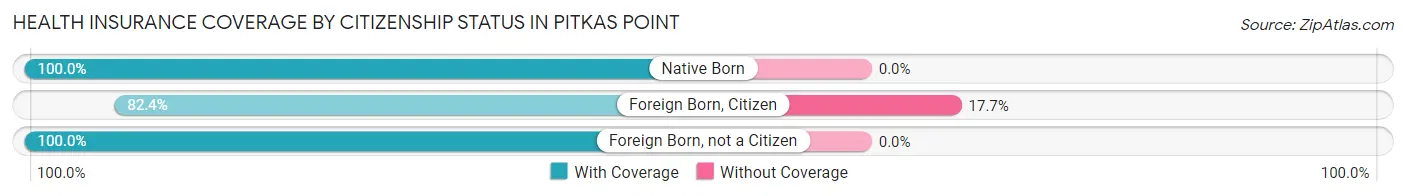
| Citizenship Status | With Coverage | Without Coverage |
| Native Born | 24 (100.0%) | 0 (0.0%) |
| Foreign Born, Citizen | 70 (82.4%) | 15 (17.6%) |
| Foreign Born, not a Citizen | 22 (100.0%) | 0 (0.0%) |
Health Insurance Coverage by Household Income in Pitkas Point
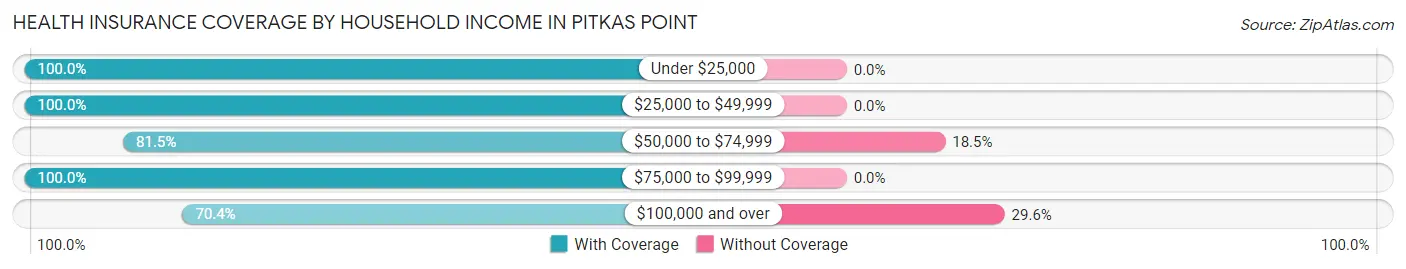
| Household Income | With Coverage | Without Coverage |
| Under $25,000 | 32 (100.0%) | 0 (0.0%) |
| $25,000 to $49,999 | 36 (100.0%) | 0 (0.0%) |
| $50,000 to $74,999 | 53 (81.5%) | 12 (18.5%) |
| $75,000 to $99,999 | 35 (100.0%) | 0 (0.0%) |
| $100,000 and over | 50 (70.4%) | 21 (29.6%) |
Public vs Private Health Insurance Coverage by Age in Pitkas Point
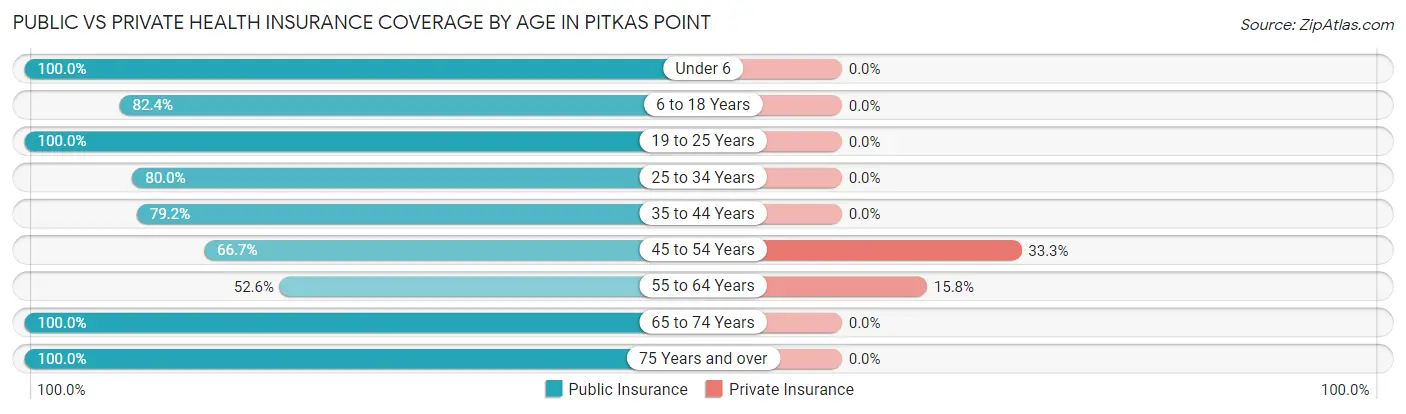
| Age Bracket | Public Insurance | Private Insurance |
| Under 6 | 24 (100.0%) | 0 (0.0%) |
| 6 to 18 Years | 70 (82.4%) | 0 (0.0%) |
| 19 to 25 Years | 22 (100.0%) | 0 (0.0%) |
| 25 to 34 Years | 28 (80.0%) | 0 (0.0%) |
| 35 to 44 Years | 19 (79.2%) | 0 (0.0%) |
| 45 to 54 Years | 10 (66.7%) | 5 (33.3%) |
| 55 to 64 Years | 10 (52.6%) | 3 (15.8%) |
| 65 to 74 Years | 13 (100.0%) | 0 (0.0%) |
| 75 Years and over | 2 (100.0%) | 0 (0.0%) |
| Total | 198 (82.9%) | 8 (3.4%) |
Disability Status by Sex by Age in Pitkas Point
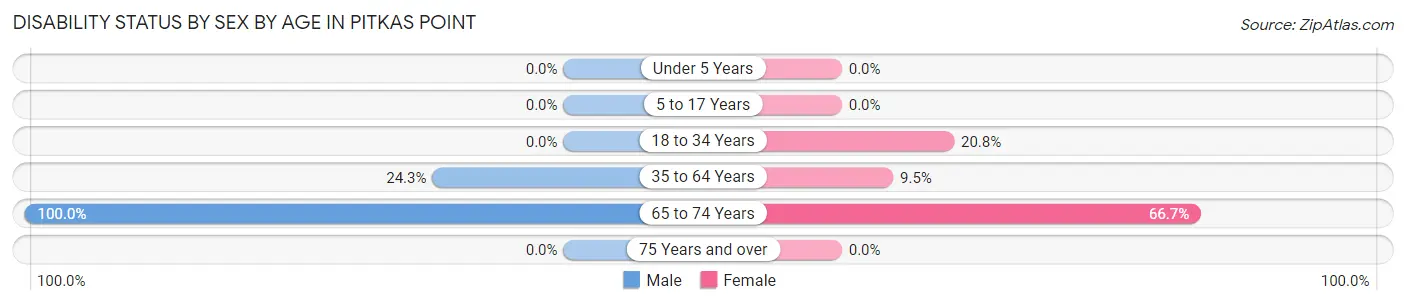
| Age Bracket | Male | Female |
| Under 5 Years | 0 (0.0%) | 0 (0.0%) |
| 5 to 17 Years | 0 (0.0%) | 0 (0.0%) |
| 18 to 34 Years | 0 (0.0%) | 5 (20.8%) |
| 35 to 64 Years | 9 (24.3%) | 2 (9.5%) |
| 65 to 74 Years | 4 (100.0%) | 6 (66.7%) |
| 75 Years and over | 0 (0.0%) | 0 (0.0%) |
Disability Class by Sex by Age in Pitkas Point
Disability Class: Hearing Difficulty
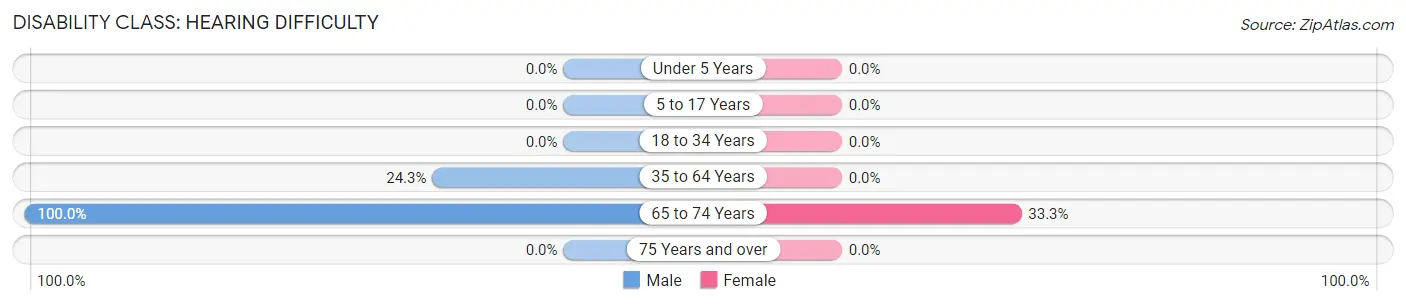
| Age Bracket | Male | Female |
| Under 5 Years | 0 (0.0%) | 0 (0.0%) |
| 5 to 17 Years | 0 (0.0%) | 0 (0.0%) |
| 18 to 34 Years | 0 (0.0%) | 0 (0.0%) |
| 35 to 64 Years | 9 (24.3%) | 0 (0.0%) |
| 65 to 74 Years | 4 (100.0%) | 3 (33.3%) |
| 75 Years and over | 0 (0.0%) | 0 (0.0%) |
Disability Class: Vision Difficulty
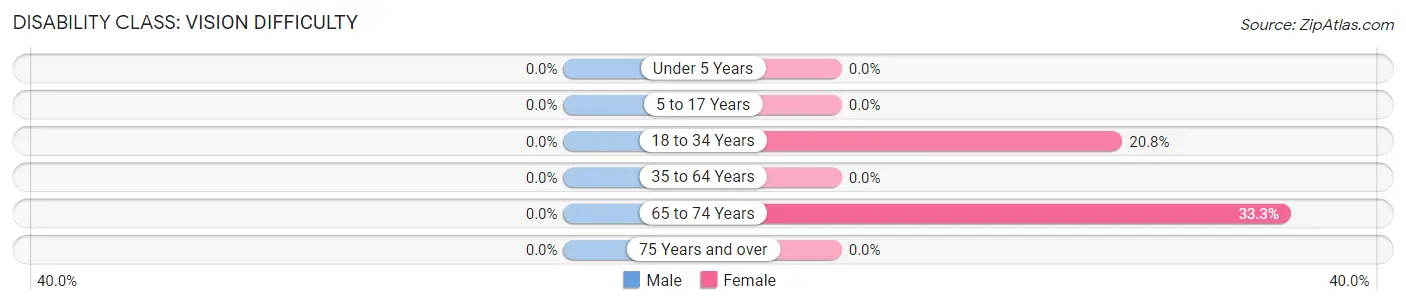
| Age Bracket | Male | Female |
| Under 5 Years | 0 (0.0%) | 0 (0.0%) |
| 5 to 17 Years | 0 (0.0%) | 0 (0.0%) |
| 18 to 34 Years | 0 (0.0%) | 5 (20.8%) |
| 35 to 64 Years | 0 (0.0%) | 0 (0.0%) |
| 65 to 74 Years | 0 (0.0%) | 3 (33.3%) |
| 75 Years and over | 0 (0.0%) | 0 (0.0%) |
Disability Class: Cognitive Difficulty
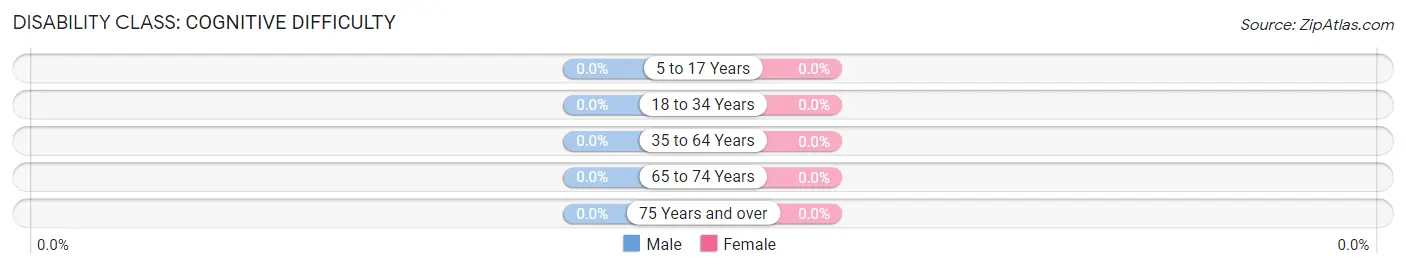
| Age Bracket | Male | Female |
| 5 to 17 Years | 0 (0.0%) | 0 (0.0%) |
| 18 to 34 Years | 0 (0.0%) | 0 (0.0%) |
| 35 to 64 Years | 0 (0.0%) | 0 (0.0%) |
| 65 to 74 Years | 0 (0.0%) | 0 (0.0%) |
| 75 Years and over | 0 (0.0%) | 0 (0.0%) |
Disability Class: Ambulatory Difficulty
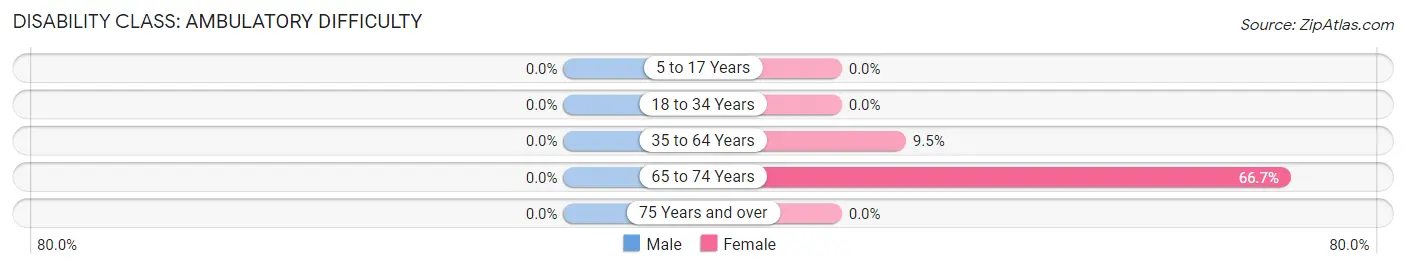
| Age Bracket | Male | Female |
| 5 to 17 Years | 0 (0.0%) | 0 (0.0%) |
| 18 to 34 Years | 0 (0.0%) | 0 (0.0%) |
| 35 to 64 Years | 0 (0.0%) | 2 (9.5%) |
| 65 to 74 Years | 0 (0.0%) | 6 (66.7%) |
| 75 Years and over | 0 (0.0%) | 0 (0.0%) |
Disability Class: Self-Care Difficulty
| Age Bracket | Male | Female |
| 5 to 17 Years | 0 (0.0%) | 0 (0.0%) |
| 18 to 34 Years | 0 (0.0%) | 0 (0.0%) |
| 35 to 64 Years | 0 (0.0%) | 0 (0.0%) |
| 65 to 74 Years | 0 (0.0%) | 0 (0.0%) |
| 75 Years and over | 0 (0.0%) | 0 (0.0%) |
Technology Access in Pitkas Point
Computing Device Access in Pitkas Point
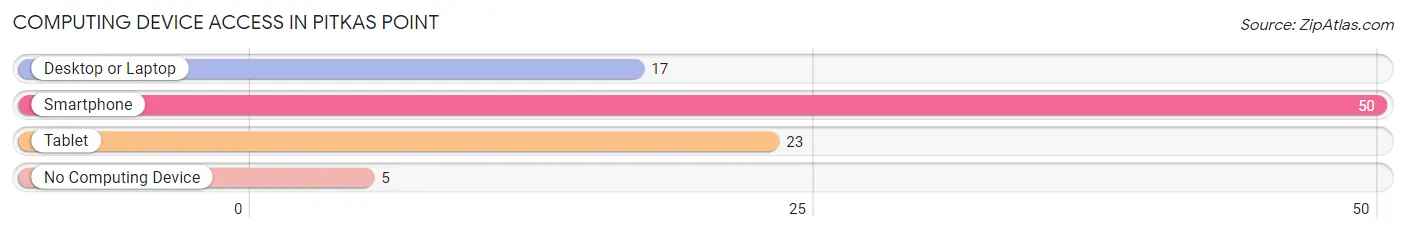
| Device Type | # Households | % Households |
| Desktop or Laptop | 17 | 30.9% |
| Smartphone | 50 | 90.9% |
| Tablet | 23 | 41.8% |
| No Computing Device | 5 | 9.1% |
| Total | 55 | 100.0% |
Internet Access in Pitkas Point
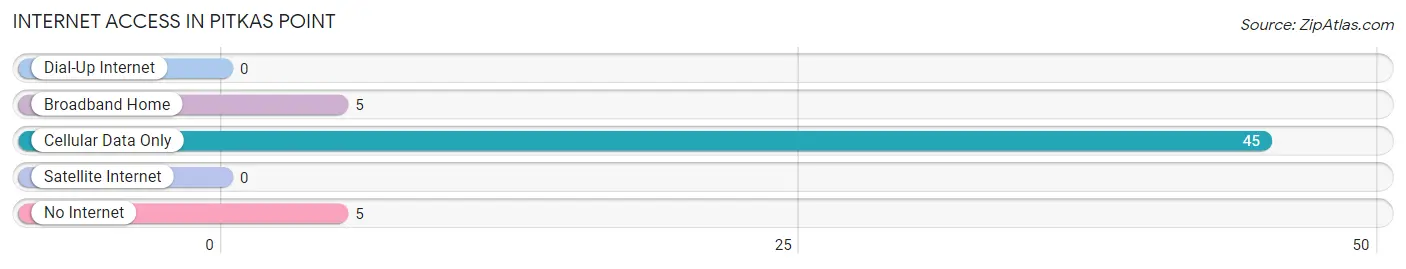
| Internet Type | # Households | % Households |
| Dial-Up Internet | 0 | 0.0% |
| Broadband Home | 5 | 9.1% |
| Cellular Data Only | 45 | 81.8% |
| Satellite Internet | 0 | 0.0% |
| No Internet | 5 | 9.1% |
| Total | 55 | 100.0% |
Pitkas Point Summary
Pitkas Point is a small unincorporated community located in the Yukon-Koyukuk Census Area of Alaska. It is situated on the south bank of the Yukon River, approximately 40 miles east of Galena. The population of Pitkas Point was estimated to be around 100 people in 2020.
History
Pitkas Point was first settled by the Inupiat people in the late 1800s. The name “Pitkas Point” is derived from the Inupiat word “pitka”, which means “place of plenty”. The Inupiat people used the area for hunting, fishing, and trapping.
In the early 1900s, the area was settled by non-Native Americans, primarily gold miners. The gold rush brought a large influx of people to the area, and the population of Pitkas Point grew rapidly.
In the 1950s, the U.S. Army Corps of Engineers built a dam on the Yukon River near Pitkas Point. This dam created a large lake, which is now known as the Pitkas Point Reservoir. The reservoir is used for recreational activities such as fishing and boating.
Geography
Pitkas Point is located in the Yukon-Koyukuk Census Area of Alaska. It is situated on the south bank of the Yukon River, approximately 40 miles east of Galena. The area is mostly flat, with rolling hills and low mountains in the distance. The climate is subarctic, with cold winters and mild summers.
The Pitkas Point Reservoir is located just north of the community. The reservoir is used for recreational activities such as fishing and boating. The area is also home to a variety of wildlife, including moose, caribou, and bears.
Economy
The economy of Pitkas Point is largely based on subsistence activities such as hunting, fishing, and trapping. The area is also home to a few small businesses, such as a general store and a gas station.
The Pitkas Point Reservoir is a popular destination for recreational activities such as fishing and boating. The reservoir is also used for hydroelectric power generation.
Demographics
The population of Pitkas Point was estimated to be around 100 people in 2020. The majority of the population is Native American, primarily Inupiat. The median age of the population is 33.5 years. The median household income is $31,250.
Conclusion
Pitkas Point is a small unincorporated community located in the Yukon-Koyukuk Census Area of Alaska. It was first settled by the Inupiat people in the late 1800s, and later by non-Native Americans during the gold rush. The economy of Pitkas Point is largely based on subsistence activities such as hunting, fishing, and trapping. The population of Pitkas Point was estimated to be around 100 people in 2020. The area is also home to a variety of wildlife, and the Pitkas Point Reservoir is a popular destination for recreational activities such as fishing and boating.
Common Questions
What is Per Capita Income in Pitkas Point?
Per Capita income in Pitkas Point is $14,731.
What is the Median Family Income in Pitkas Point?
Median Family Income in Pitkas Point is $55,833.
What is the Median Household income in Pitkas Point?
Median Household Income in Pitkas Point is $57,679.
What is Inequality or Gini Index in Pitkas Point?
Inequality or Gini Index in Pitkas Point is 0.40.
What is the Total Population of Pitkas Point?
Total Population of Pitkas Point is 239.
What is the Total Male Population of Pitkas Point?
Total Male Population of Pitkas Point is 134.
What is the Total Female Population of Pitkas Point?
Total Female Population of Pitkas Point is 105.
What is the Ratio of Males per 100 Females in Pitkas Point?
There are 127.62 Males per 100 Females in Pitkas Point.
What is the Ratio of Females per 100 Males in Pitkas Point?
There are 78.36 Females per 100 Males in Pitkas Point.
What is the Median Population Age in Pitkas Point?
Median Population Age in Pitkas Point is 22.4 Years.
What is the Average Family Size in Pitkas Point
Average Family Size in Pitkas Point is 4.3 People.
What is the Average Household Size in Pitkas Point
Average Household Size in Pitkas Point is 4.3 People.
How Large is the Labor Force in Pitkas Point?
There are 74 People in the Labor Forcein in Pitkas Point.
What is the Percentage of People in the Labor Force in Pitkas Point?
51.4% of People are in the Labor Force in Pitkas Point.
What is the Unemployment Rate in Pitkas Point?
Unemployment Rate in Pitkas Point is 23.0%.