Nunam Iqua, AK Map & Demographics
Nunam Iqua Map
Nunam Iqua Overview
$8,722
PER CAPITA INCOME
$37,679
AVG FAMILY INCOME
$38,214
AVG HOUSEHOLD INCOME
$5,450
FAMILY INCOME DEFICIT
0.21
INEQUALITY / GINI INDEX
59
TOTAL POPULATION
33
MALE POPULATION
26
FEMALE POPULATION
126.92
MALES / 100 FEMALES
78.79
FEMALES / 100 MALES
21.8
MEDIAN AGE
4.3
AVG FAMILY SIZE
3.7
AVG HOUSEHOLD SIZE
18
LABOR FORCE [ PEOPLE ]
48.6%
PERCENT IN LABOR FORCE
33.3%
UNEMPLOYMENT RATE
Nunam Iqua Zip Codes
Nunam Iqua Area Codes
Income in Nunam Iqua
Income Overview in Nunam Iqua
Per Capita Income in Nunam Iqua is $8,722, while median incomes of families and households are $37,679 and $38,214 respectively.
| Characteristic | Number | Measure |
| Per Capita Income | 59 | $8,722 |
| Median Family Income | 13 | $37,679 |
| Mean Family Income | 13 | $28,908 |
| Median Household Income | 16 | $38,214 |
| Mean Household Income | 16 | $32,625 |
| Income Deficit | 13 | $5,450 |
| Wage / Income Gap (%) | 59 | 0.00% |
| Wage / Income Gap ($) | 59 | 100.00¢ per $1 |
| Gini / Inequality Index | 59 | 0.21 |
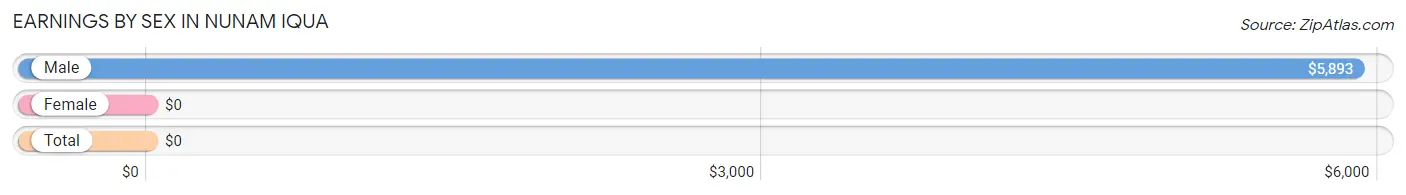
Earnings by Sex in Nunam Iqua
| Sex | Number | Average Earnings |
| Male | 15 (83.3%) | $5,893 |
| Female | 3 (16.7%) | $0 |
| Total | 18 (100.0%) | $0 |
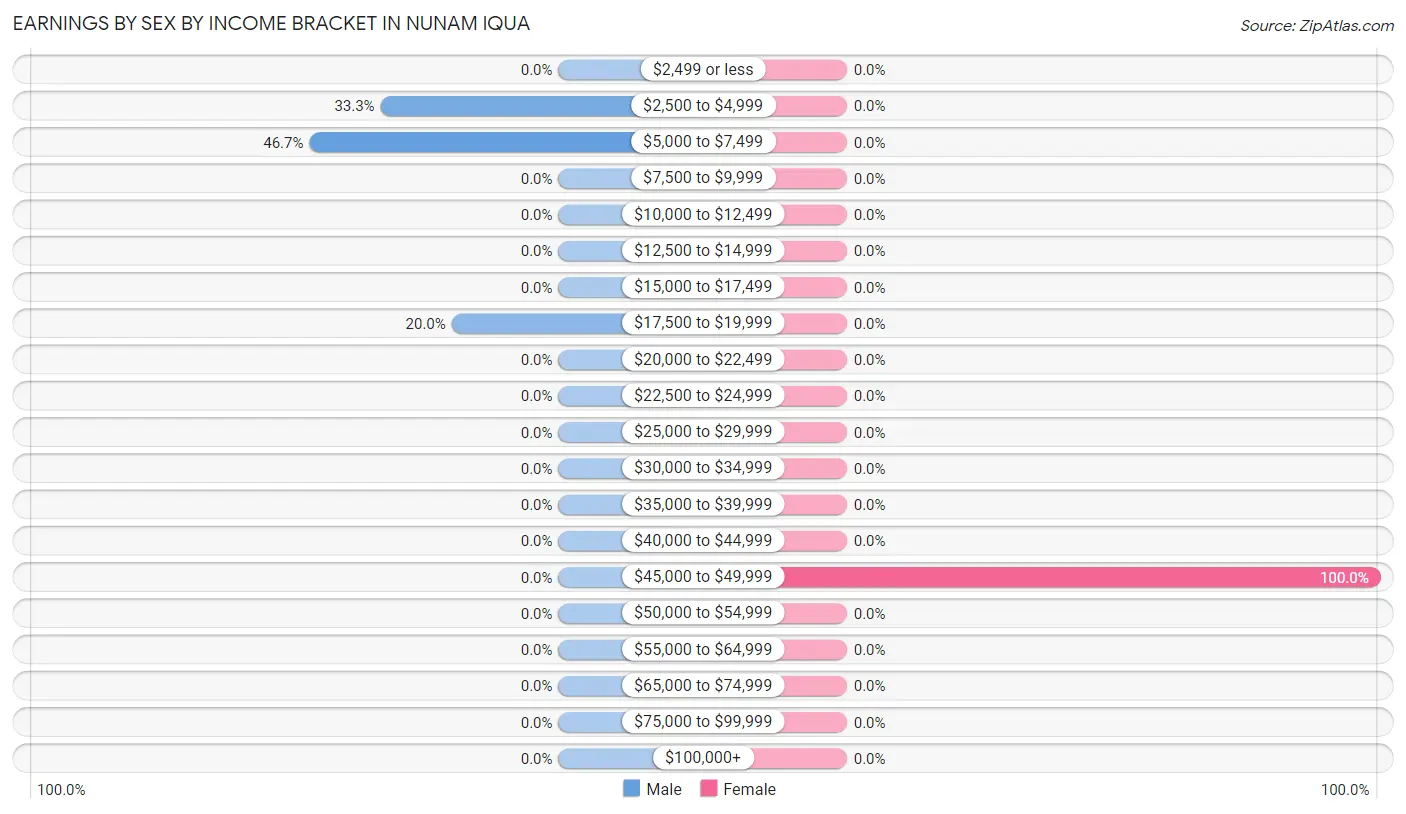
Earnings by Sex by Income Bracket in Nunam Iqua
The most common earnings brackets in Nunam Iqua are $5,000 to $7,499 for men (7 | 46.7%) and $45,000 to $49,999 for women (3 | 100.0%).
| Income | Male | Female |
| $2,499 or less | 0 (0.0%) | 0 (0.0%) |
| $2,500 to $4,999 | 5 (33.3%) | 0 (0.0%) |
| $5,000 to $7,499 | 7 (46.7%) | 0 (0.0%) |
| $7,500 to $9,999 | 0 (0.0%) | 0 (0.0%) |
| $10,000 to $12,499 | 0 (0.0%) | 0 (0.0%) |
| $12,500 to $14,999 | 0 (0.0%) | 0 (0.0%) |
| $15,000 to $17,499 | 0 (0.0%) | 0 (0.0%) |
| $17,500 to $19,999 | 3 (20.0%) | 0 (0.0%) |
| $20,000 to $22,499 | 0 (0.0%) | 0 (0.0%) |
| $22,500 to $24,999 | 0 (0.0%) | 0 (0.0%) |
| $25,000 to $29,999 | 0 (0.0%) | 0 (0.0%) |
| $30,000 to $34,999 | 0 (0.0%) | 0 (0.0%) |
| $35,000 to $39,999 | 0 (0.0%) | 0 (0.0%) |
| $40,000 to $44,999 | 0 (0.0%) | 0 (0.0%) |
| $45,000 to $49,999 | 0 (0.0%) | 3 (100.0%) |
| $50,000 to $54,999 | 0 (0.0%) | 0 (0.0%) |
| $55,000 to $64,999 | 0 (0.0%) | 0 (0.0%) |
| $65,000 to $74,999 | 0 (0.0%) | 0 (0.0%) |
| $75,000 to $99,999 | 0 (0.0%) | 0 (0.0%) |
| $100,000+ | 0 (0.0%) | 0 (0.0%) |
| Total | 15 (100.0%) | 3 (100.0%) |
Earnings by Sex by Educational Attainment in Nunam Iqua
| Educational Attainment | Male Income | Female Income |
| Less than High School | - | - |
| High School Diploma | - | - |
| College or Associate's Degree | - | - |
| Bachelor's Degree | - | - |
| Graduate Degree | - | - |
| Total | - | - |
Family Income in Nunam Iqua
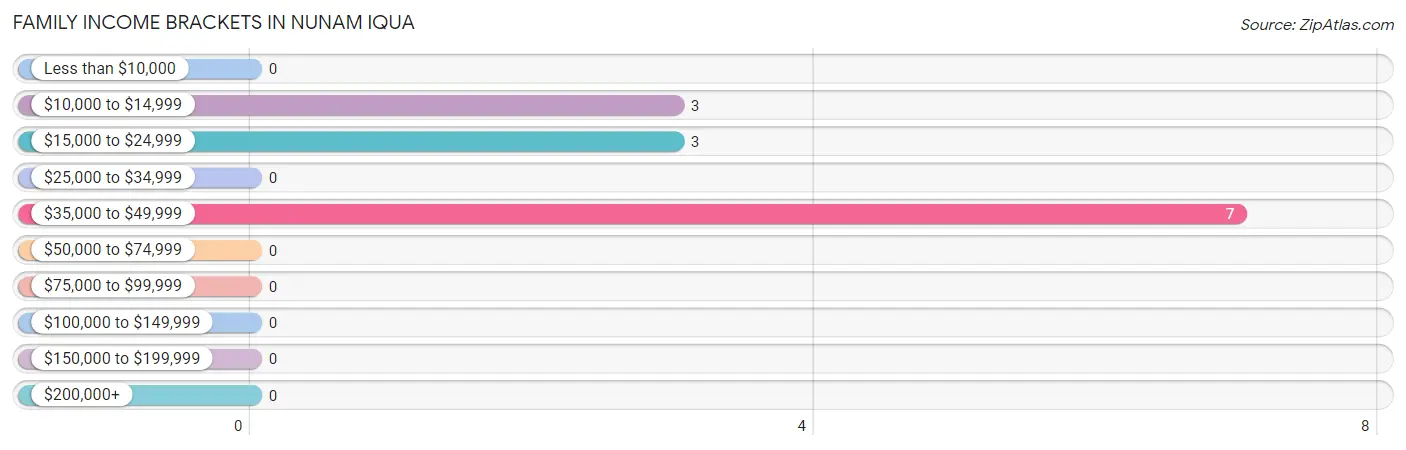
Family Income Brackets in Nunam Iqua
According to the Nunam Iqua family income data, there are 7 families falling into the $35,000 to $49,999 income range, which is the most common income bracket and makes up 53.8% of all families.
| Income Bracket | # Families | % Families |
| Less than $10,000 | 0 | 0.0% |
| $10,000 to $14,999 | 3 | 23.1% |
| $15,000 to $24,999 | 3 | 23.1% |
| $25,000 to $34,999 | 0 | 0.0% |
| $35,000 to $49,999 | 7 | 53.8% |
| $50,000 to $74,999 | 0 | 0.0% |
| $75,000 to $99,999 | 0 | 0.0% |
| $100,000 to $149,999 | 0 | 0.0% |
| $150,000 to $199,999 | 0 | 0.0% |
| $200,000+ | 0 | 0.0% |
Family Income by Famaliy Size in Nunam Iqua
| Income Bracket | # Families | Median Income |
| 2-Person Families | 0 (0.0%) | $0 |
| 3-Person Families | 6 (46.2%) | $0 |
| 4-Person Families | 3 (23.1%) | $0 |
| 5-Person Families | 0 (0.0%) | $0 |
| 6-Person Families | 0 (0.0%) | $0 |
| 7+ Person Families | 4 (30.8%) | $0 |
| Total | 13 (100.0%) | $37,679 |
Family Income by Number of Earners in Nunam Iqua
| Number of Earners | # Families | Median Income |
| No Earners | 3 (23.1%) | $0 |
| 1 Earner | 6 (46.2%) | $0 |
| 2 Earners | 4 (30.8%) | $0 |
| 3+ Earners | 0 (0.0%) | $0 |
| Total | 13 (100.0%) | $37,679 |
Household Income in Nunam Iqua
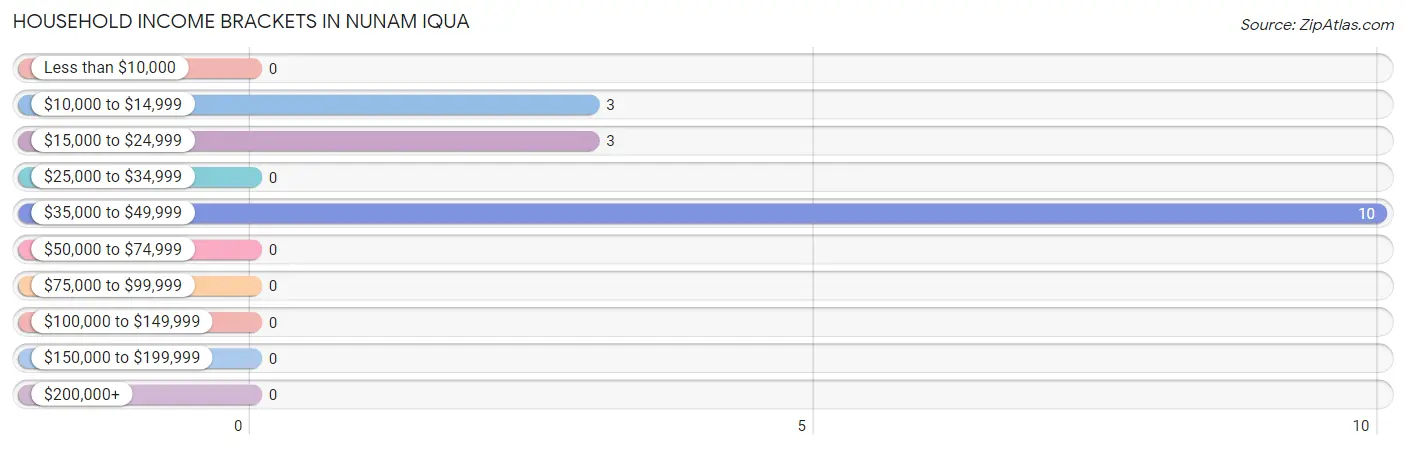
Household Income Brackets in Nunam Iqua
With 10 households falling in the category, the $35,000 to $49,999 income range is the most frequent in Nunam Iqua, accounting for 62.5% of all households.
| Income Bracket | # Households | % Households |
| Less than $10,000 | 0 | 0.0% |
| $10,000 to $14,999 | 3 | 18.8% |
| $15,000 to $24,999 | 3 | 18.8% |
| $25,000 to $34,999 | 0 | 0.0% |
| $35,000 to $49,999 | 10 | 62.5% |
| $50,000 to $74,999 | 0 | 0.0% |
| $75,000 to $99,999 | 0 | 0.0% |
| $100,000 to $149,999 | 0 | 0.0% |
| $150,000 to $199,999 | 0 | 0.0% |
| $200,000+ | 0 | 0.0% |
Household Income by Householder Age in Nunam Iqua
The median household income in Nunam Iqua is $38,214, with the highest median household income of $38,214 found in the 65+ years age bracket for the primary householder. A total of 10 households (62.5%) fall into this category.
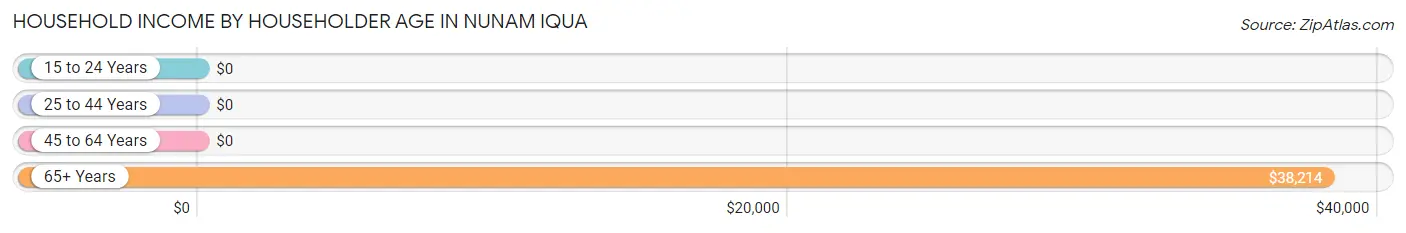
| Income Bracket | # Households | Median Income |
| 15 to 24 Years | 0 (0.0%) | $0 |
| 25 to 44 Years | 0 (0.0%) | $0 |
| 45 to 64 Years | 6 (37.5%) | $0 |
| 65+ Years | 10 (62.5%) | $38,214 |
| Total | 16 (100.0%) | $38,214 |
Poverty in Nunam Iqua
Income Below Poverty by Sex and Age in Nunam Iqua
With 81.8% poverty level for males and 65.4% for females among the residents of Nunam Iqua, under 5 year old males and 6 to 11 year old females are the most vulnerable to poverty, with 9 males (100.0%) and 4 females (100.0%) in their respective age groups living below the poverty level.
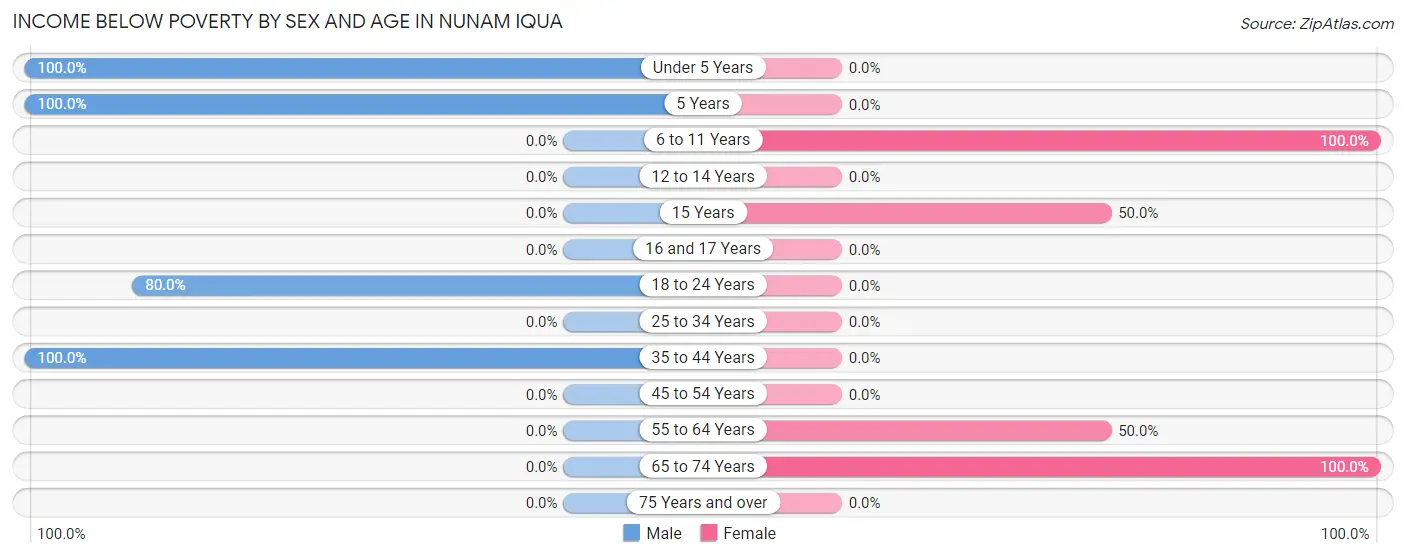
| Age Bracket | Male | Female |
| Under 5 Years | 9 (100.0%) | 0 (0.0%) |
| 5 Years | 3 (100.0%) | 0 (0.0%) |
| 6 to 11 Years | 0 (0.0%) | 4 (100.0%) |
| 12 to 14 Years | 0 (0.0%) | 0 (0.0%) |
| 15 Years | 0 (0.0%) | 3 (50.0%) |
| 16 and 17 Years | 0 (0.0%) | 0 (0.0%) |
| 18 to 24 Years | 12 (80.0%) | 0 (0.0%) |
| 25 to 34 Years | 0 (0.0%) | 0 (0.0%) |
| 35 to 44 Years | 3 (100.0%) | 0 (0.0%) |
| 45 to 54 Years | 0 (0.0%) | 0 (0.0%) |
| 55 to 64 Years | 0 (0.0%) | 3 (50.0%) |
| 65 to 74 Years | 0 (0.0%) | 7 (100.0%) |
| 75 Years and over | 0 (0.0%) | 0 (0.0%) |
| Total | 27 (81.8%) | 17 (65.4%) |
Income Above Poverty by Sex and Age in Nunam Iqua
According to the poverty statistics in Nunam Iqua, males aged 65 to 74 years and females aged 45 to 54 years are the age groups that are most secure financially, with 100.0% of males and 100.0% of females in these age groups living above the poverty line.
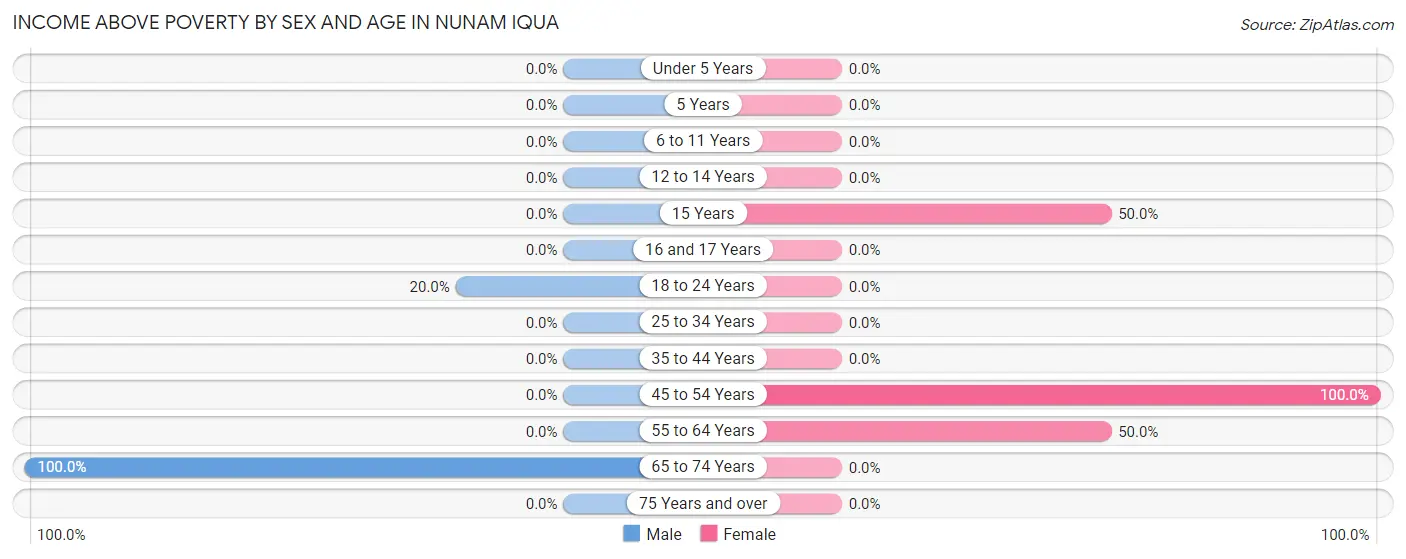
| Age Bracket | Male | Female |
| Under 5 Years | 0 (0.0%) | 0 (0.0%) |
| 5 Years | 0 (0.0%) | 0 (0.0%) |
| 6 to 11 Years | 0 (0.0%) | 0 (0.0%) |
| 12 to 14 Years | 0 (0.0%) | 0 (0.0%) |
| 15 Years | 0 (0.0%) | 3 (50.0%) |
| 16 and 17 Years | 0 (0.0%) | 0 (0.0%) |
| 18 to 24 Years | 3 (20.0%) | 0 (0.0%) |
| 25 to 34 Years | 0 (0.0%) | 0 (0.0%) |
| 35 to 44 Years | 0 (0.0%) | 0 (0.0%) |
| 45 to 54 Years | 0 (0.0%) | 3 (100.0%) |
| 55 to 64 Years | 0 (0.0%) | 3 (50.0%) |
| 65 to 74 Years | 3 (100.0%) | 0 (0.0%) |
| 75 Years and over | 0 (0.0%) | 0 (0.0%) |
| Total | 6 (18.2%) | 9 (34.6%) |
Income Below Poverty Among Married-Couple Families in Nunam Iqua
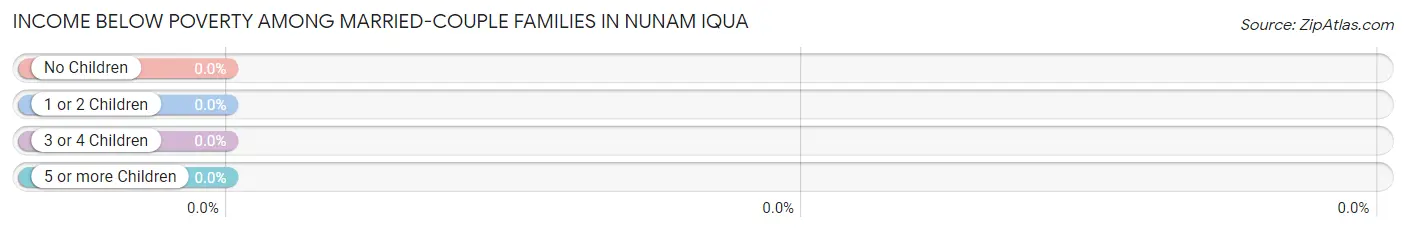
| Children | Above Poverty | Below Poverty |
| No Children | 0 (0.0%) | 0 (0.0%) |
| 1 or 2 Children | 3 (100.0%) | 0 (0.0%) |
| 3 or 4 Children | 0 (0.0%) | 0 (0.0%) |
| 5 or more Children | 0 (0.0%) | 0 (0.0%) |
| Total | 3 (100.0%) | 0 (0.0%) |
Income Below Poverty Among Single-Parent Households in Nunam Iqua
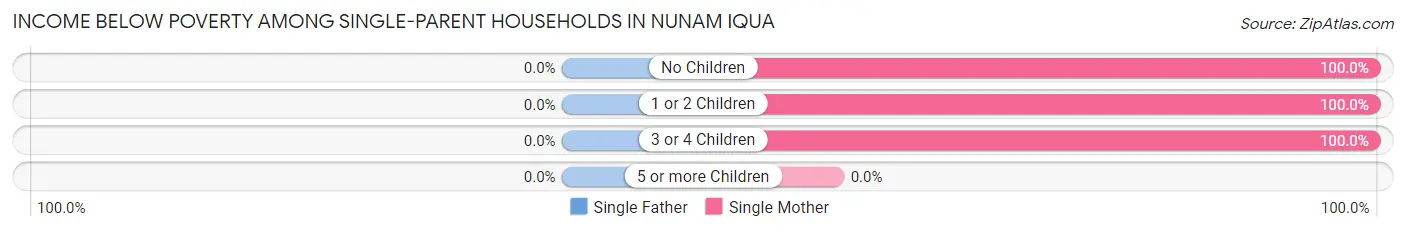
| Children | Single Father | Single Mother |
| No Children | 0 (0.0%) | 3 (100.0%) |
| 1 or 2 Children | 0 (0.0%) | 3 (100.0%) |
| 3 or 4 Children | 0 (0.0%) | 4 (100.0%) |
| 5 or more Children | 0 (0.0%) | 0 (0.0%) |
| Total | 0 (0.0%) | 10 (100.0%) |
Income Below Poverty Among Married-Couple vs Single-Parent Households in Nunam Iqua
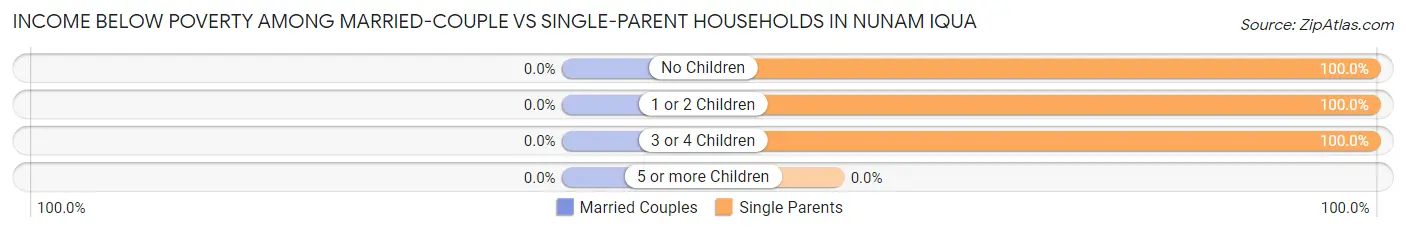
| Children | Married-Couple Families | Single-Parent Households |
| No Children | 0 (0.0%) | 3 (100.0%) |
| 1 or 2 Children | 0 (0.0%) | 3 (100.0%) |
| 3 or 4 Children | 0 (0.0%) | 4 (100.0%) |
| 5 or more Children | 0 (0.0%) | 0 (0.0%) |
| Total | 0 (0.0%) | 10 (100.0%) |
Race in Nunam Iqua
The most populous races in Nunam Iqua are , and Native / Alaskan (59 | 100.0%).
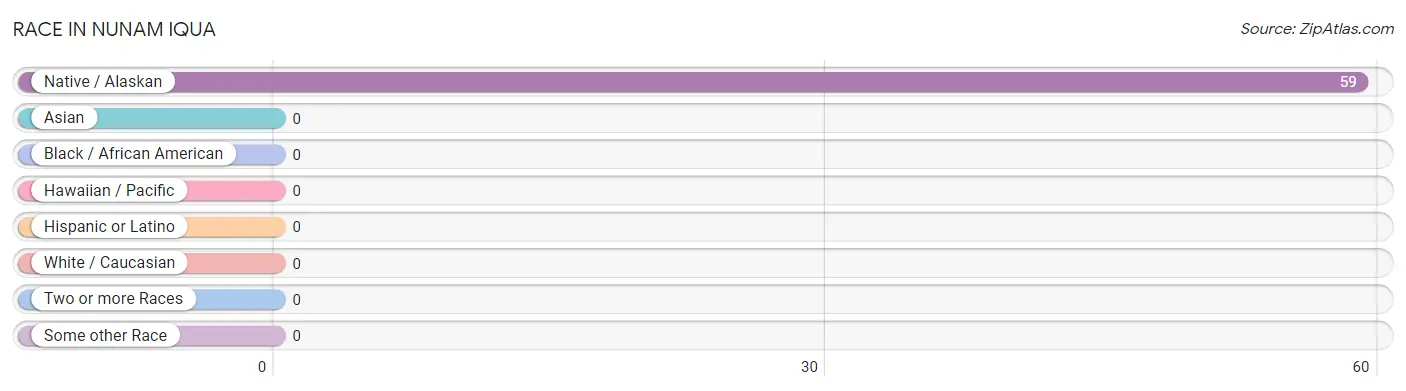
| Race | # Population | % Population |
| Asian | 0 | 0.0% |
| Black / African American | 0 | 0.0% |
| Hawaiian / Pacific | 0 | 0.0% |
| Hispanic or Latino | 0 | 0.0% |
| Native / Alaskan | 59 | 100.0% |
| White / Caucasian | 0 | 0.0% |
| Two or more Races | 0 | 0.0% |
| Some other Race | 0 | 0.0% |
| Total | 59 | 100.0% |
Ancestry in Nunam Iqua
The most populous ancestries reported in Nunam Iqua are , and Yup'ik (59 | 100.0%), together accounting for 100.0% of all Nunam Iqua residents.

| Ancestry | # Population | % Population |
| Yup'ik | 59 | 100.0% | View All 1 Rows |
Immigrants in Nunam Iqua

| Immigration Origin | # Population | % Population | View All 0 Rows |
Sex and Age in Nunam Iqua
Sex and Age in Nunam Iqua
The most populous age groups in Nunam Iqua are 20 to 24 Years (10 | 30.3%) for men and 70 to 74 Years (7 | 26.9%) for women.
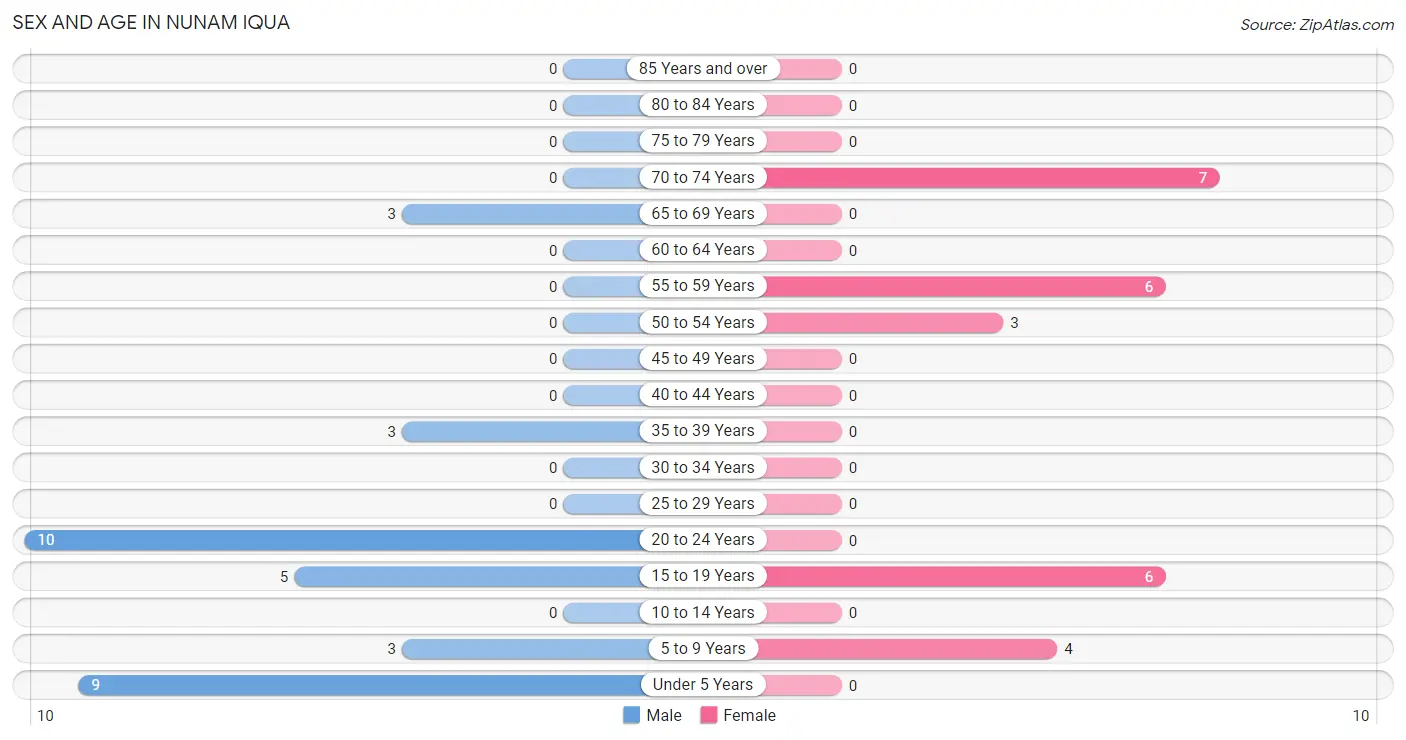
| Age Bracket | Male | Female |
| Under 5 Years | 9 (27.3%) | 0 (0.0%) |
| 5 to 9 Years | 3 (9.1%) | 4 (15.4%) |
| 10 to 14 Years | 0 (0.0%) | 0 (0.0%) |
| 15 to 19 Years | 5 (15.1%) | 6 (23.1%) |
| 20 to 24 Years | 10 (30.3%) | 0 (0.0%) |
| 25 to 29 Years | 0 (0.0%) | 0 (0.0%) |
| 30 to 34 Years | 0 (0.0%) | 0 (0.0%) |
| 35 to 39 Years | 3 (9.1%) | 0 (0.0%) |
| 40 to 44 Years | 0 (0.0%) | 0 (0.0%) |
| 45 to 49 Years | 0 (0.0%) | 0 (0.0%) |
| 50 to 54 Years | 0 (0.0%) | 3 (11.5%) |
| 55 to 59 Years | 0 (0.0%) | 6 (23.1%) |
| 60 to 64 Years | 0 (0.0%) | 0 (0.0%) |
| 65 to 69 Years | 3 (9.1%) | 0 (0.0%) |
| 70 to 74 Years | 0 (0.0%) | 7 (26.9%) |
| 75 to 79 Years | 0 (0.0%) | 0 (0.0%) |
| 80 to 84 Years | 0 (0.0%) | 0 (0.0%) |
| 85 Years and over | 0 (0.0%) | 0 (0.0%) |
| Total | 33 (100.0%) | 26 (100.0%) |
Families and Households in Nunam Iqua
Median Family Size in Nunam Iqua
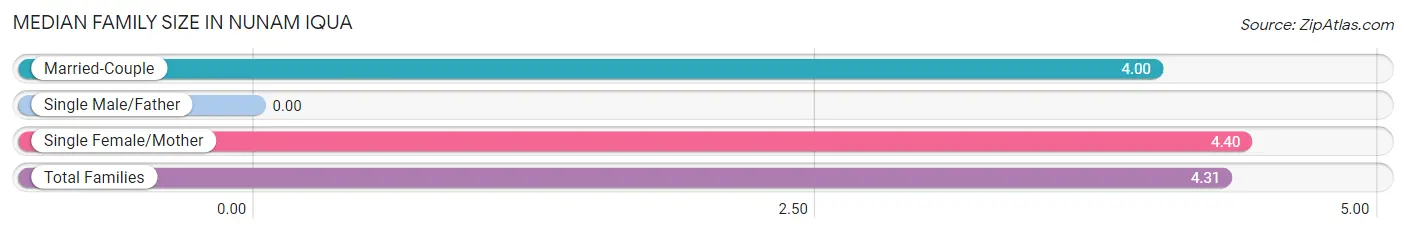
| Family Type | # Families | Family Size |
| Married-Couple | 3 (23.1%) | 4.00 |
| Single Male/Father | 0 (0.0%) | - |
| Single Female/Mother | 10 (76.9%) | 4.40 |
| Total Families | 13 (100.0%) | 4.31 |
Median Household Size in Nunam Iqua
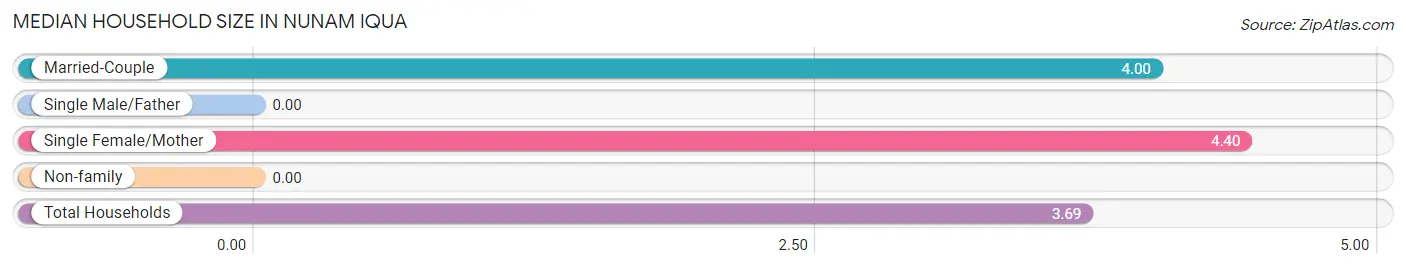
| Household Type | # Households | Household Size |
| Married-Couple | 3 (18.8%) | 4.00 |
| Single Male/Father | 0 (0.0%) | - |
| Single Female/Mother | 10 (62.5%) | 4.40 |
| Non-family | 3 (18.8%) | - |
| Total Households | 16 (100.0%) | 3.69 |
Household Size by Marriage Status in Nunam Iqua
Out of a total of 16 households in Nunam Iqua, 13 (81.2%) are family households, while 3 (18.8%) are nonfamily households. The most numerous type of family households are 3-person households, comprising 6, and the most common type of nonfamily households are 1-person households, comprising 3.
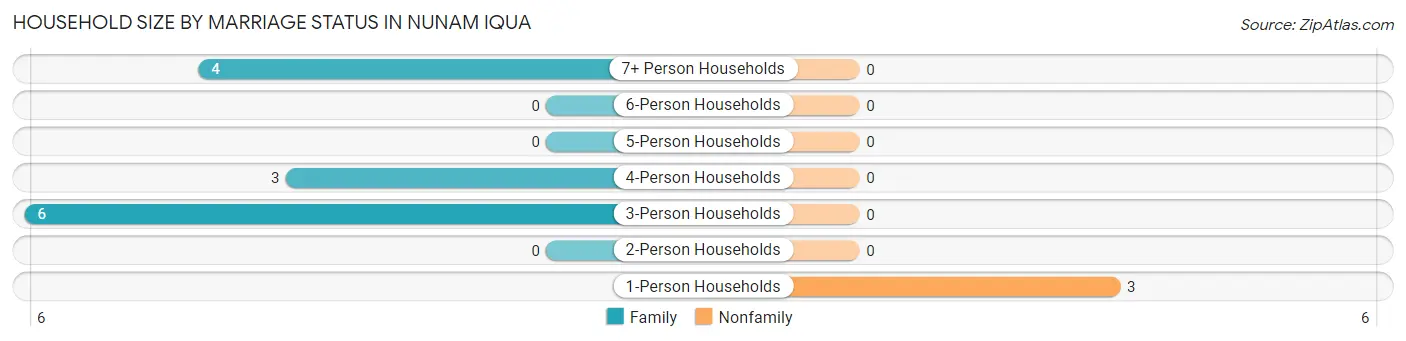
| Household Size | Family Households | Nonfamily Households |
| 1-Person Households | - | 3 (18.8%) |
| 2-Person Households | 0 (0.0%) | 0 (0.0%) |
| 3-Person Households | 6 (37.5%) | 0 (0.0%) |
| 4-Person Households | 3 (18.8%) | 0 (0.0%) |
| 5-Person Households | 0 (0.0%) | 0 (0.0%) |
| 6-Person Households | 0 (0.0%) | 0 (0.0%) |
| 7+ Person Households | 4 (25.0%) | 0 (0.0%) |
| Total | 13 (81.2%) | 3 (18.8%) |
Female Fertility in Nunam Iqua
Fertility by Age in Nunam Iqua
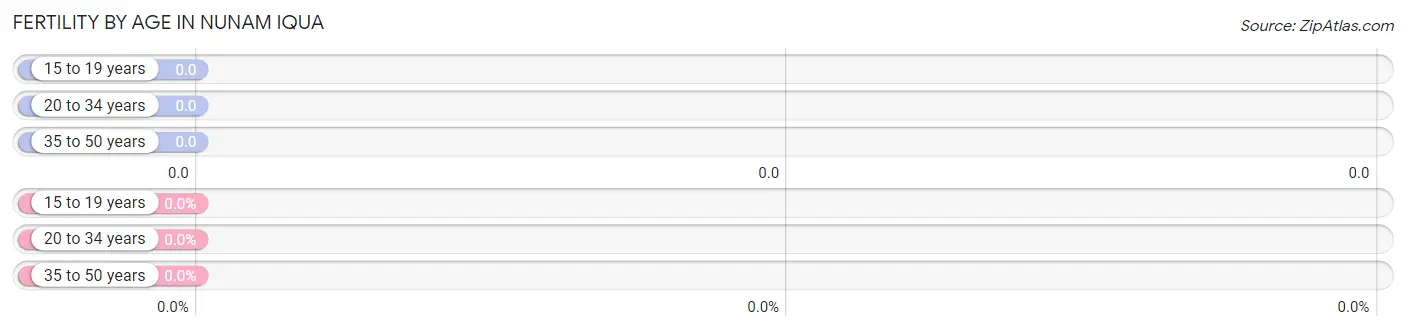
| Age Bracket | Women with Births | Births / 1,000 Women |
| 15 to 19 years | 0 (0.0%) | 0.0 |
| 20 to 34 years | 0 (0.0%) | 0.0 |
| 35 to 50 years | 0 (0.0%) | 0.0 |
| Total | 0 (0.0%) | 0.0 |
Fertility by Age by Marriage Status in Nunam Iqua
| Age Bracket | Married | Unmarried |
| 15 to 19 years | 0 (0.0%) | 0 (0.0%) |
| 20 to 34 years | 0 (0.0%) | 0 (0.0%) |
| 35 to 50 years | 0 (0.0%) | 0 (0.0%) |
| Total | 0 (0.0%) | 0 (0.0%) |
Fertility by Education in Nunam Iqua
| Educational Attainment | Women with Births | Births / 1,000 Women |
| Less than High School | 0 (0.0%) | 0.0 |
| High School Diploma | 0 (0.0%) | 0.0 |
| College or Associate's Degree | 0 (0.0%) | 0.0 |
| Bachelor's Degree | 0 (0.0%) | 0.0 |
| Graduate Degree | 0 (0.0%) | 0.0 |
| Total | 0 (0.0%) | 0.0 |
Fertility by Education by Marriage Status in Nunam Iqua
| Educational Attainment | Married | Unmarried |
| Less than High School | 0 (0.0%) | 0 (0.0%) |
| High School Diploma | 0 (0.0%) | 0 (0.0%) |
| College or Associate's Degree | 0 (0.0%) | 0 (0.0%) |
| Bachelor's Degree | 0 (0.0%) | 0 (0.0%) |
| Graduate Degree | 0 (0.0%) | 0 (0.0%) |
| Total | 0 (0.0%) | 0 (0.0%) |
Employment Characteristics in Nunam Iqua
Employment by Class of Employer in Nunam Iqua
Among the 12 employed individuals in Nunam Iqua, local government employees (5 | 41.7%), private company employees (4 | 33.3%), and not-for-profit organizations (3 | 25.0%) make up the most common classes of employment.
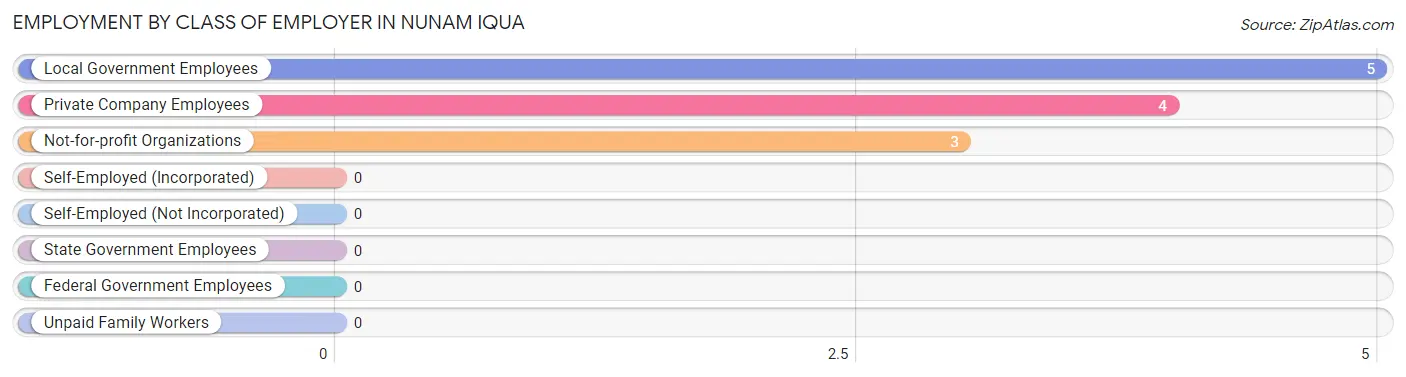
| Employer Class | # Employees | % Employees |
| Private Company Employees | 4 | 33.3% |
| Self-Employed (Incorporated) | 0 | 0.0% |
| Self-Employed (Not Incorporated) | 0 | 0.0% |
| Not-for-profit Organizations | 3 | 25.0% |
| Local Government Employees | 5 | 41.7% |
| State Government Employees | 0 | 0.0% |
| Federal Government Employees | 0 | 0.0% |
| Unpaid Family Workers | 0 | 0.0% |
| Total | 12 | 100.0% |
Employment Status by Age in Nunam Iqua
According to the labor force statistics for Nunam Iqua, out of the total population over 16 years of age (37), 48.6% or 18 individuals are in the labor force, with 33.3% or 6 of them unemployed. The age group with the highest labor force participation rate is 16 to 19 years, with 100.0% or 5 individuals in the labor force. Within the labor force, the 35 to 44 years age range has the highest percentage of unemployed individuals, with 100.0% or 3 of them being unemployed.
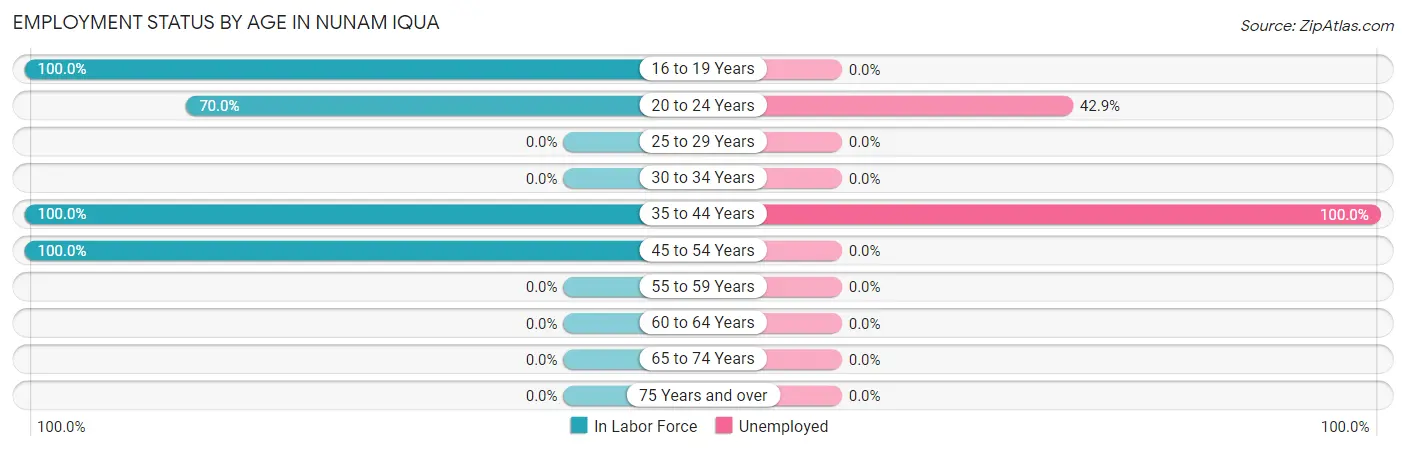
| Age Bracket | In Labor Force | Unemployed |
| 16 to 19 Years | 5 (100.0%) | 0 (0.0%) |
| 20 to 24 Years | 7 (70.0%) | 3 (42.9%) |
| 25 to 29 Years | 0 (0.0%) | 0 (0.0%) |
| 30 to 34 Years | 0 (0.0%) | 0 (0.0%) |
| 35 to 44 Years | 3 (100.0%) | 3 (100.0%) |
| 45 to 54 Years | 3 (100.0%) | 0 (0.0%) |
| 55 to 59 Years | 0 (0.0%) | 0 (0.0%) |
| 60 to 64 Years | 0 (0.0%) | 0 (0.0%) |
| 65 to 74 Years | 0 (0.0%) | 0 (0.0%) |
| 75 Years and over | 0 (0.0%) | 0 (0.0%) |
| Total | 18 (48.6%) | 6 (33.3%) |
Employment Status by Educational Attainment in Nunam Iqua
According to labor force statistics for Nunam Iqua, 50.0% of individuals (6) out of the total population between 25 and 64 years of age (12) are in the labor force, with 50.0% or 3 of them being unemployed. The group with the highest labor force participation rate are those with the educational attainment of less than high school, with 66.7% or 6 individuals in the labor force. Within the labor force, individuals with less than high school education have the highest percentage of unemployment, with 50.0% or 3 of them being unemployed.
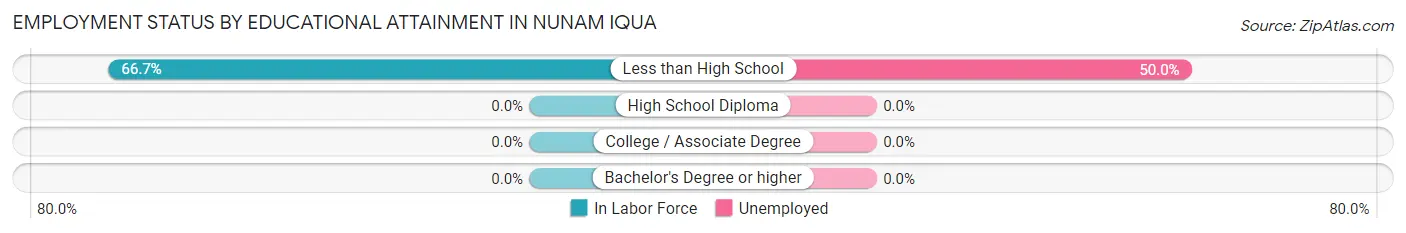
| Educational Attainment | In Labor Force | Unemployed |
| Less than High School | 6 (66.7%) | 4 (50.0%) |
| High School Diploma | 0 (0.0%) | 0 (0.0%) |
| College / Associate Degree | 0 (0.0%) | 0 (0.0%) |
| Bachelor's Degree or higher | 0 (0.0%) | 0 (0.0%) |
| Total | 6 (50.0%) | 6 (50.0%) |
Employment Occupations by Sex in Nunam Iqua
Management, Business, Science and Arts Occupations
Management, Business, Science and Arts Occupations by Sex
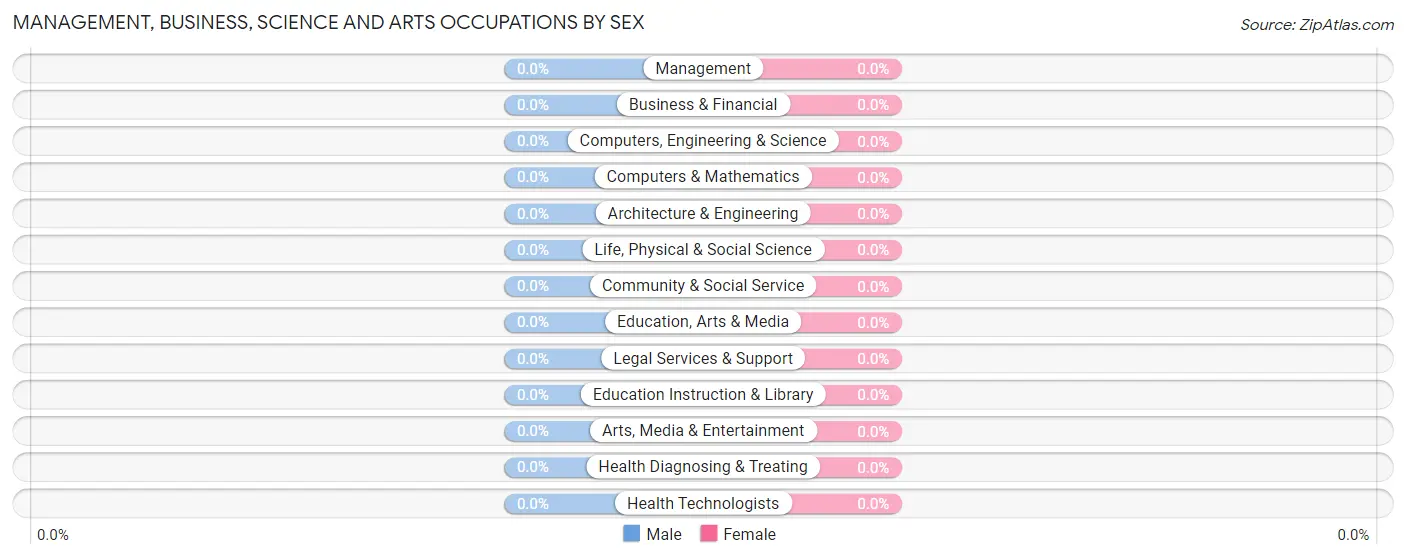
| Occupation | Male | Female |
| Management | 0 (0.0%) | 0 (0.0%) |
| Business & Financial | 0 (0.0%) | 0 (0.0%) |
| Computers, Engineering & Science | 0 (0.0%) | 0 (0.0%) |
| Computers & Mathematics | 0 (0.0%) | 0 (0.0%) |
| Architecture & Engineering | 0 (0.0%) | 0 (0.0%) |
| Life, Physical & Social Science | 0 (0.0%) | 0 (0.0%) |
| Community & Social Service | 0 (0.0%) | 0 (0.0%) |
| Education, Arts & Media | 0 (0.0%) | 0 (0.0%) |
| Legal Services & Support | 0 (0.0%) | 0 (0.0%) |
| Education Instruction & Library | 0 (0.0%) | 0 (0.0%) |
| Arts, Media & Entertainment | 0 (0.0%) | 0 (0.0%) |
| Health Diagnosing & Treating | 0 (0.0%) | 0 (0.0%) |
| Health Technologists | 0 (0.0%) | 0 (0.0%) |
| Total (Category) | 0 (0.0%) | 0 (0.0%) |
| Total (Overall) | 9 (75.0%) | 3 (25.0%) |
Services Occupations
The most common Services occupations in Nunam Iqua are Cleaning & Maintenance (4 | 33.3%), and Healthcare Support (3 | 25.0%).
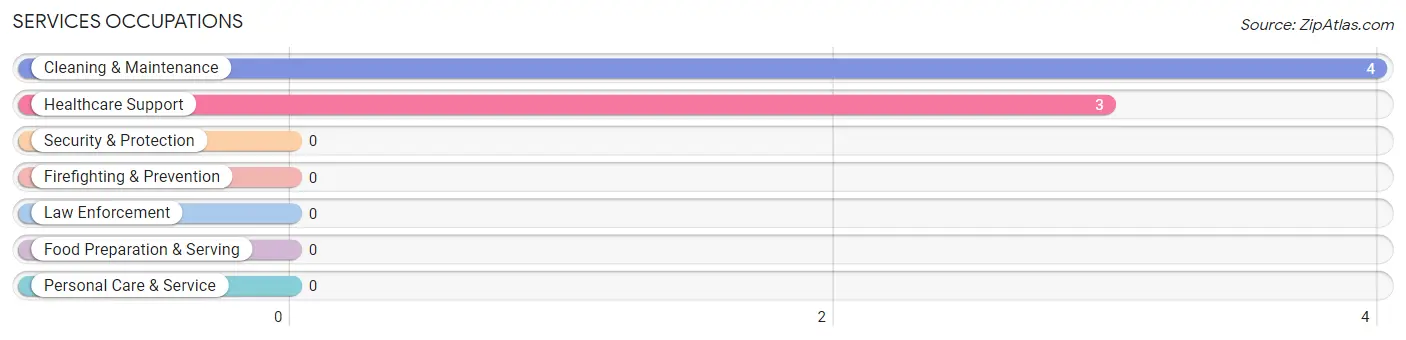
Services Occupations by Sex
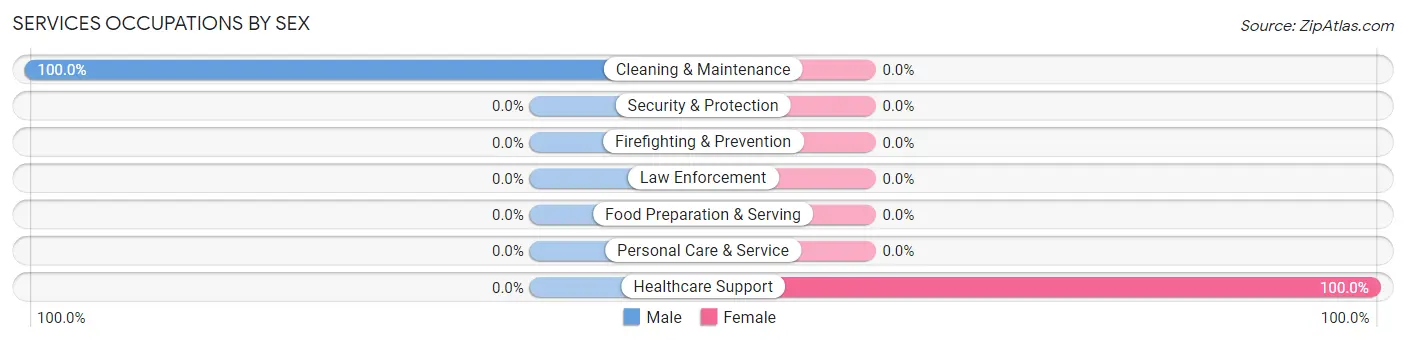
| Occupation | Male | Female |
| Healthcare Support | 0 (0.0%) | 3 (100.0%) |
| Security & Protection | 0 (0.0%) | 0 (0.0%) |
| Firefighting & Prevention | 0 (0.0%) | 0 (0.0%) |
| Law Enforcement | 0 (0.0%) | 0 (0.0%) |
| Food Preparation & Serving | 0 (0.0%) | 0 (0.0%) |
| Cleaning & Maintenance | 4 (100.0%) | 0 (0.0%) |
| Personal Care & Service | 0 (0.0%) | 0 (0.0%) |
| Total (Category) | 4 (57.1%) | 3 (42.9%) |
| Total (Overall) | 9 (75.0%) | 3 (25.0%) |
Sales and Office Occupations
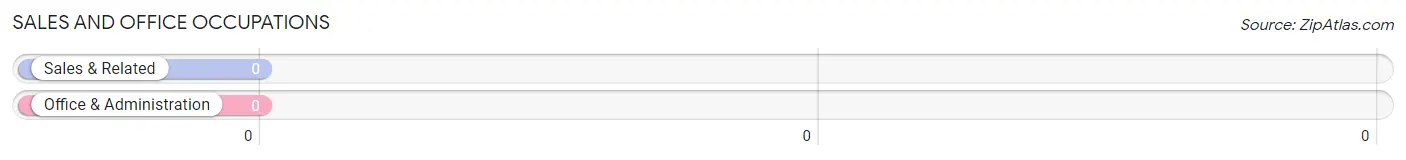
Sales and Office Occupations by Sex
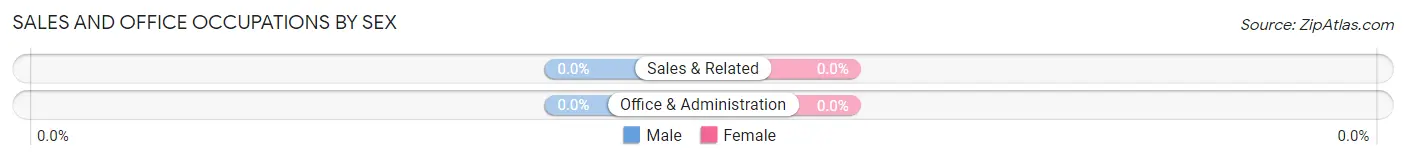
| Occupation | Male | Female |
| Sales & Related | 0 (0.0%) | 0 (0.0%) |
| Office & Administration | 0 (0.0%) | 0 (0.0%) |
| Total (Category) | 0 (0.0%) | 0 (0.0%) |
| Total (Overall) | 9 (75.0%) | 3 (25.0%) |
Natural Resources, Construction and Maintenance Occupations
Natural Resources, Construction and Maintenance Occupations by Sex
| Occupation | Male | Female |
| Farming, Fishing & Forestry | 0 (0.0%) | 0 (0.0%) |
| Construction & Extraction | 0 (0.0%) | 0 (0.0%) |
| Installation, Maintenance & Repair | 0 (0.0%) | 0 (0.0%) |
| Total (Category) | 0 (0.0%) | 0 (0.0%) |
| Total (Overall) | 9 (75.0%) | 3 (25.0%) |
Production, Transportation and Moving Occupations
The most common Production, Transportation and Moving occupations in Nunam Iqua are , and Transportation (5 | 41.7%).
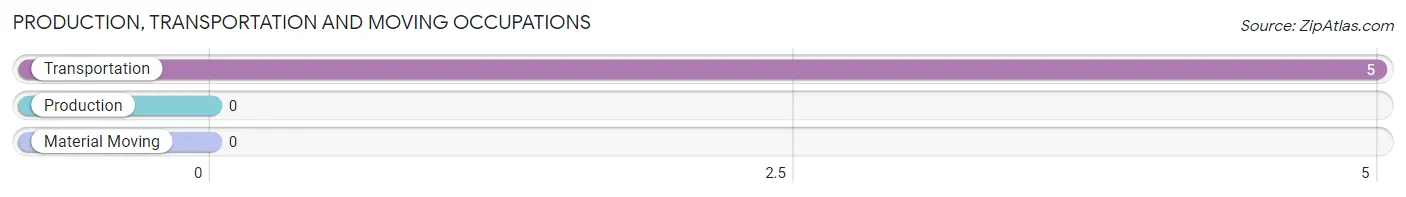
Production, Transportation and Moving Occupations by Sex
| Occupation | Male | Female |
| Production | 0 (0.0%) | 0 (0.0%) |
| Transportation | 5 (100.0%) | 0 (0.0%) |
| Material Moving | 0 (0.0%) | 0 (0.0%) |
| Total (Category) | 5 (100.0%) | 0 (0.0%) |
| Total (Overall) | 9 (75.0%) | 3 (25.0%) |
Employment Industries by Sex in Nunam Iqua
Employment Industries in Nunam Iqua
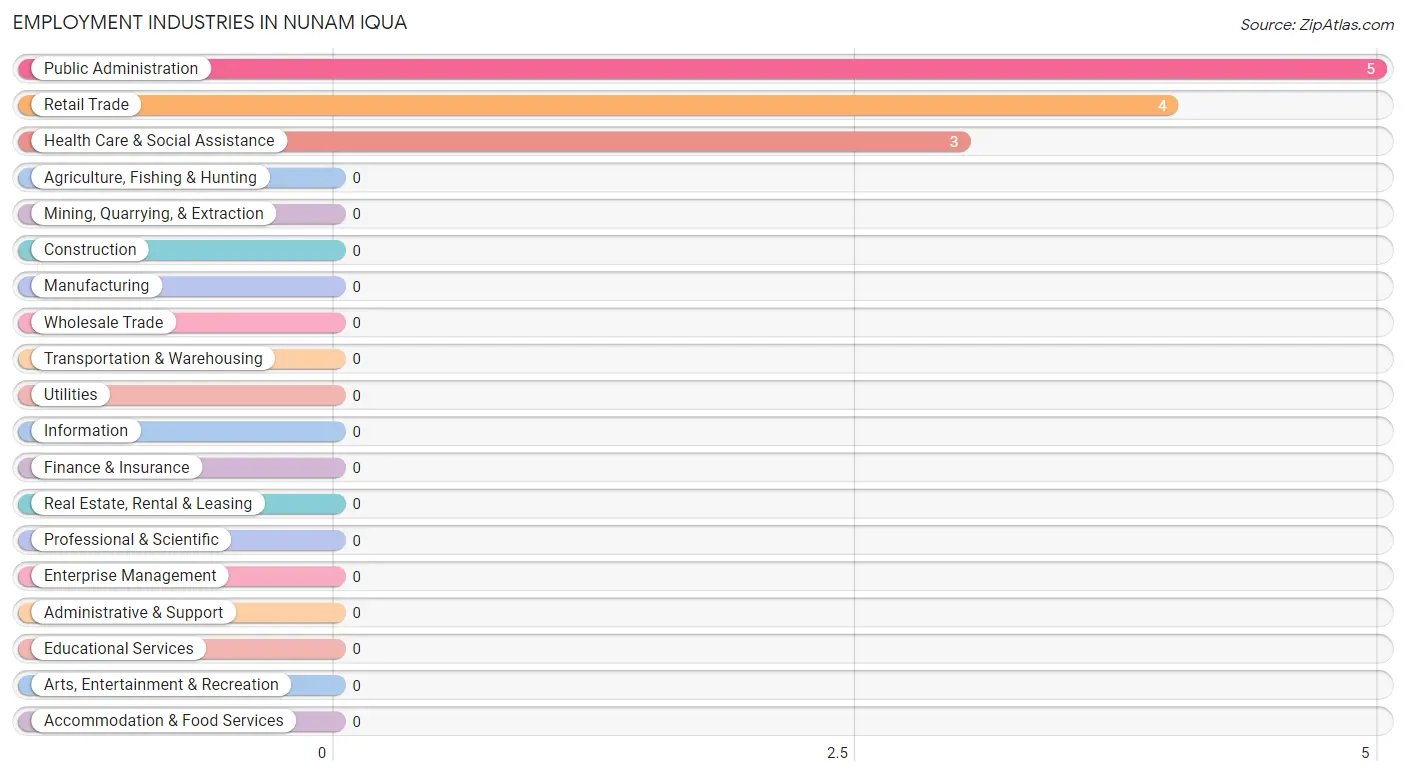
The major employment industries in Nunam Iqua include Public Administration (5 | 41.7%), Retail Trade (4 | 33.3%), and Health Care & Social Assistance (3 | 25.0%).
Employment Industries by Sex in Nunam Iqua
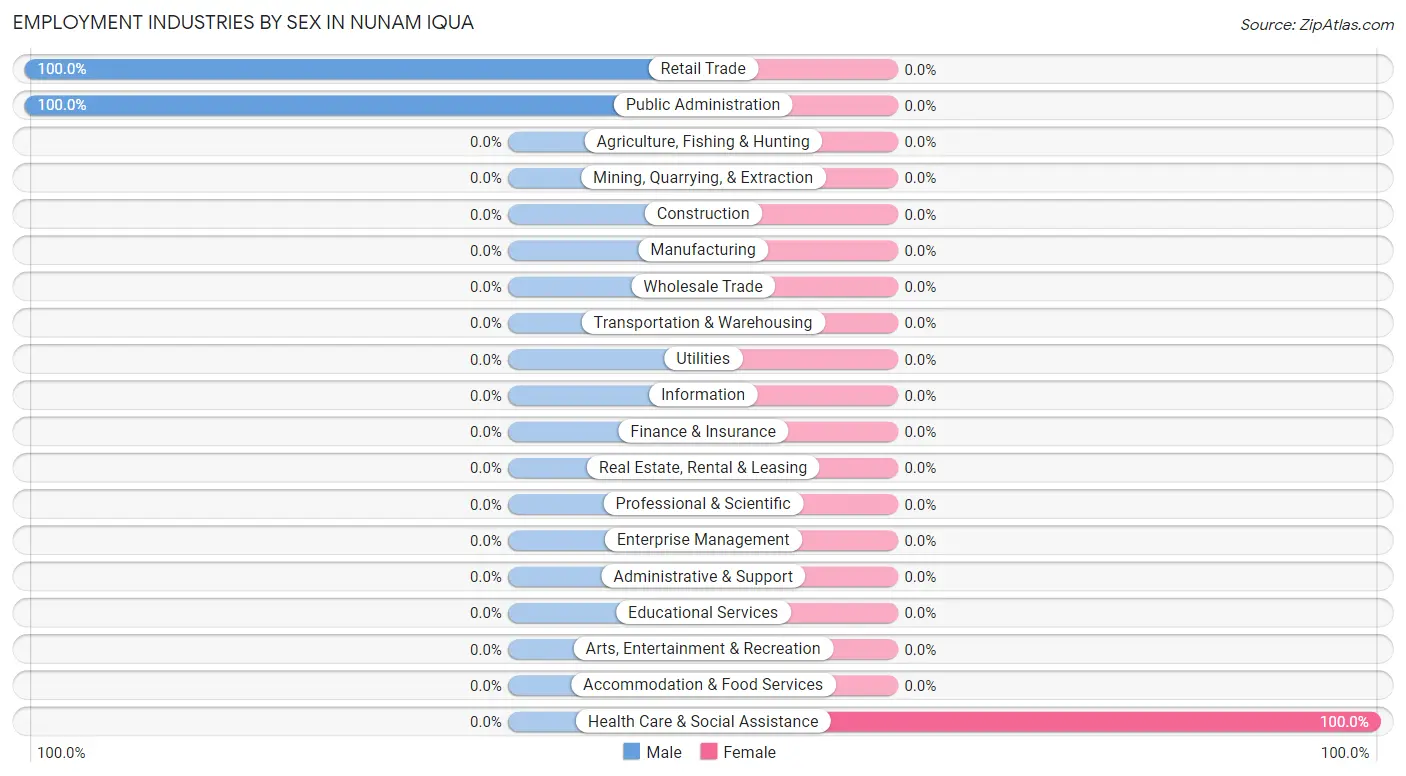
| Industry | Male | Female |
| Agriculture, Fishing & Hunting | 0 (0.0%) | 0 (0.0%) |
| Mining, Quarrying, & Extraction | 0 (0.0%) | 0 (0.0%) |
| Construction | 0 (0.0%) | 0 (0.0%) |
| Manufacturing | 0 (0.0%) | 0 (0.0%) |
| Wholesale Trade | 0 (0.0%) | 0 (0.0%) |
| Retail Trade | 4 (100.0%) | 0 (0.0%) |
| Transportation & Warehousing | 0 (0.0%) | 0 (0.0%) |
| Utilities | 0 (0.0%) | 0 (0.0%) |
| Information | 0 (0.0%) | 0 (0.0%) |
| Finance & Insurance | 0 (0.0%) | 0 (0.0%) |
| Real Estate, Rental & Leasing | 0 (0.0%) | 0 (0.0%) |
| Professional & Scientific | 0 (0.0%) | 0 (0.0%) |
| Enterprise Management | 0 (0.0%) | 0 (0.0%) |
| Administrative & Support | 0 (0.0%) | 0 (0.0%) |
| Educational Services | 0 (0.0%) | 0 (0.0%) |
| Health Care & Social Assistance | 0 (0.0%) | 3 (100.0%) |
| Arts, Entertainment & Recreation | 0 (0.0%) | 0 (0.0%) |
| Accommodation & Food Services | 0 (0.0%) | 0 (0.0%) |
| Public Administration | 5 (100.0%) | 0 (0.0%) |
| Total | 9 (75.0%) | 3 (25.0%) |
Education in Nunam Iqua
School Enrollment in Nunam Iqua
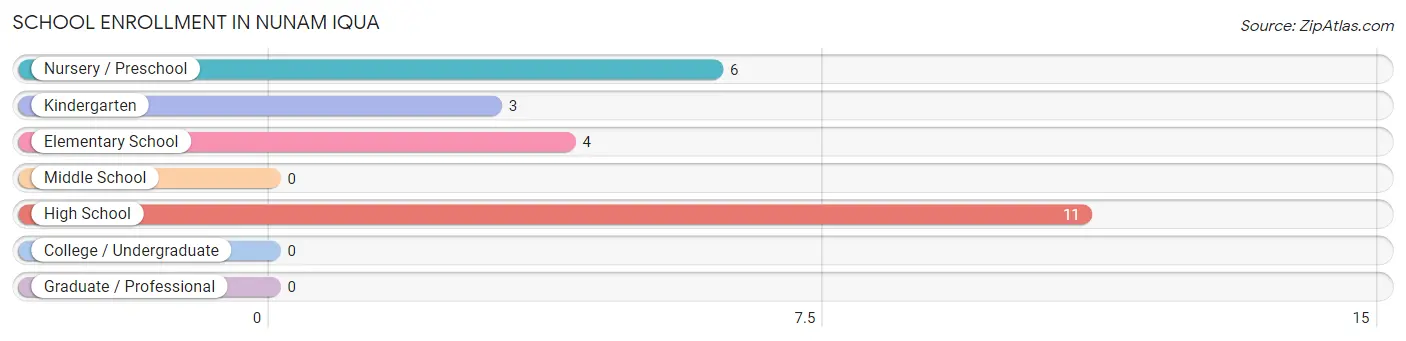
The most common levels of schooling among the 24 students in Nunam Iqua are high school (11 | 45.8%), nursery / preschool (6 | 25.0%), and elementary school (4 | 16.7%).
| School Level | # Students | % Students |
| Nursery / Preschool | 6 | 25.0% |
| Kindergarten | 3 | 12.5% |
| Elementary School | 4 | 16.7% |
| Middle School | 0 | 0.0% |
| High School | 11 | 45.8% |
| College / Undergraduate | 0 | 0.0% |
| Graduate / Professional | 0 | 0.0% |
| Total | 24 | 100.0% |
School Enrollment by Age by Funding Source in Nunam Iqua
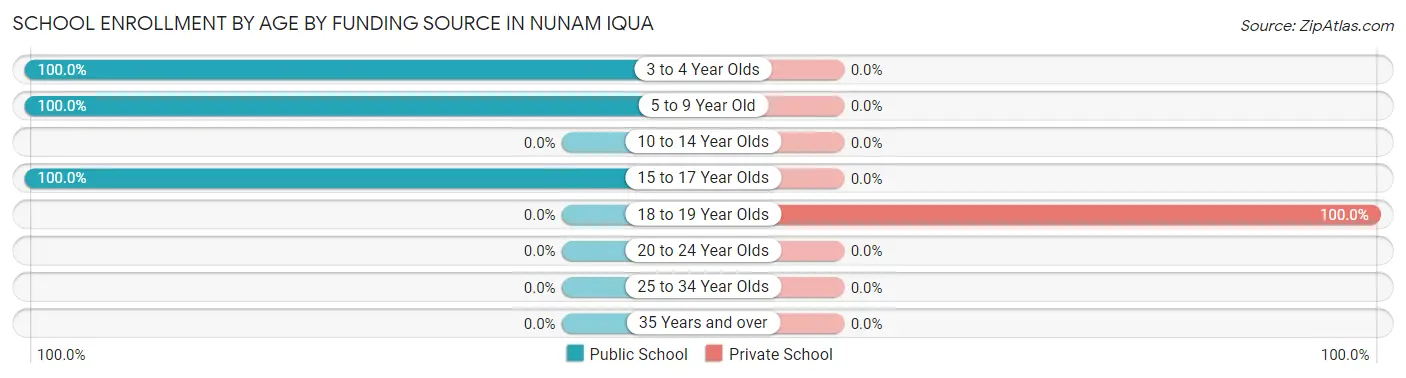
Out of a total of 24 students who are enrolled in schools in Nunam Iqua, 5 (20.8%) attend a private institution, while the remaining 19 (79.2%) are enrolled in public schools. The age group of 18 to 19 year olds has the highest likelihood of being enrolled in private schools, with 5 (100.0% in the age bracket) enrolled. Conversely, the age group of 3 to 4 year olds has the lowest likelihood of being enrolled in a private school, with 6 (100.0% in the age bracket) attending a public institution.
| Age Bracket | Public School | Private School |
| 3 to 4 Year Olds | 6 (100.0%) | 0 (0.0%) |
| 5 to 9 Year Old | 7 (100.0%) | 0 (0.0%) |
| 10 to 14 Year Olds | 0 (0.0%) | 0 (0.0%) |
| 15 to 17 Year Olds | 6 (100.0%) | 0 (0.0%) |
| 18 to 19 Year Olds | 0 (0.0%) | 5 (100.0%) |
| 20 to 24 Year Olds | 0 (0.0%) | 0 (0.0%) |
| 25 to 34 Year Olds | 0 (0.0%) | 0 (0.0%) |
| 35 Years and over | 0 (0.0%) | 0 (0.0%) |
| Total | 19 (79.2%) | 5 (20.8%) |
Educational Attainment by Field of Study in Nunam Iqua
| Field of Study | # Graduates | % Graduates |
| Computers & Mathematics | 0 | 0.0% |
| Bio, Nature & Agricultural | 0 | 0.0% |
| Physical & Health Sciences | 0 | 0.0% |
| Psychology | 0 | 0.0% |
| Social Sciences | 0 | 0.0% |
| Engineering | 0 | 0.0% |
| Multidisciplinary Studies | 0 | 0.0% |
| Science & Technology | 0 | 0.0% |
| Business | 0 | 0.0% |
| Education | 0 | 0.0% |
| Literature & Languages | 0 | 0.0% |
| Liberal Arts & History | 0 | 0.0% |
| Visual & Performing Arts | 0 | 0.0% |
| Communications | 0 | 0.0% |
| Arts & Humanities | 0 | 0.0% |
| Total | 0 | 0.0% |
Transportation & Commute in Nunam Iqua
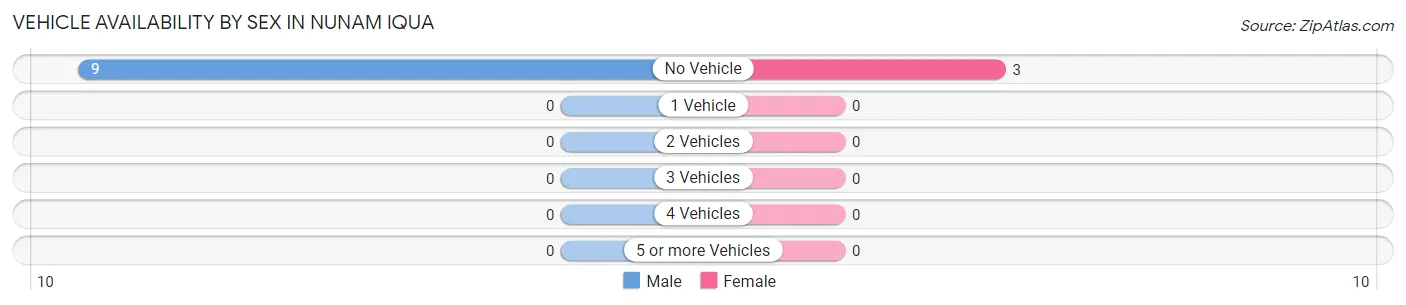
Vehicle Availability by Sex in Nunam Iqua
The most prevalent vehicle ownership categories in Nunam Iqua are males with no vehicle (9, accounting for 100.0%) and females with no vehicle (3, making up 300.0%).
| Vehicles Available | Male | Female |
| No Vehicle | 9 (100.0%) | 3 (100.0%) |
| 1 Vehicle | 0 (0.0%) | 0 (0.0%) |
| 2 Vehicles | 0 (0.0%) | 0 (0.0%) |
| 3 Vehicles | 0 (0.0%) | 0 (0.0%) |
| 4 Vehicles | 0 (0.0%) | 0 (0.0%) |
| 5 or more Vehicles | 0 (0.0%) | 0 (0.0%) |
| Total | 9 (100.0%) | 3 (100.0%) |
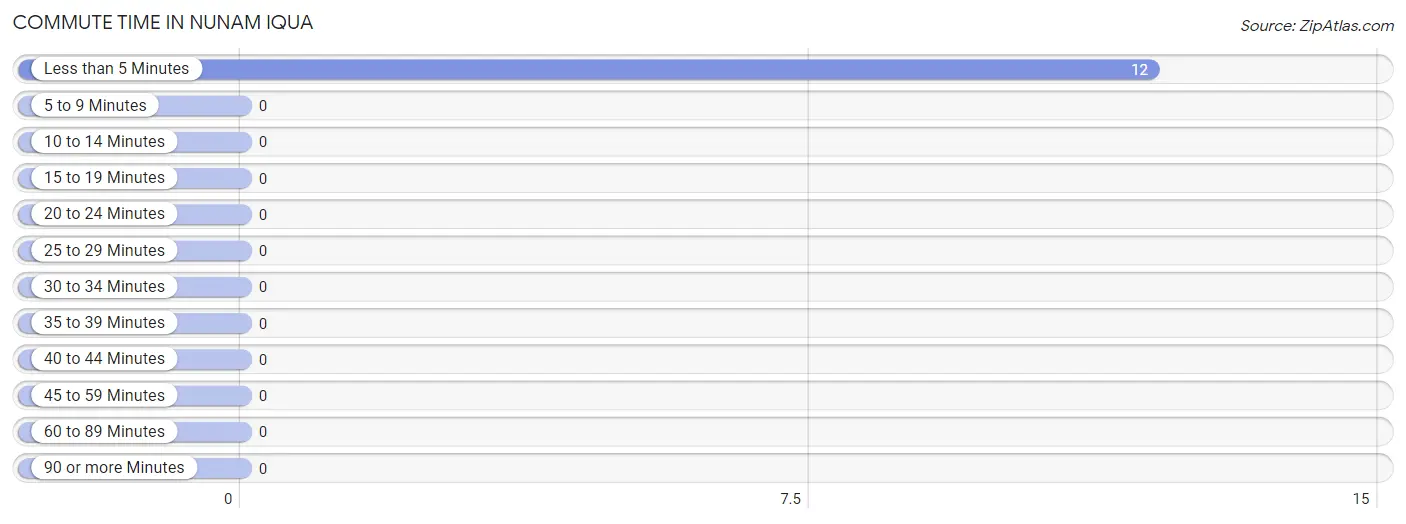
Commute Time in Nunam Iqua
The most frequently occuring commute durations in Nunam Iqua are less than 5 minutes (12 commuters, 100.0%), 5 to 9 minutes (0 commuters, 0.0%), and 10 to 14 minutes (0 commuters, 0.0%).
| Commute Time | # Commuters | % Commuters |
| Less than 5 Minutes | 12 | 100.0% |
| 5 to 9 Minutes | 0 | 0.0% |
| 10 to 14 Minutes | 0 | 0.0% |
| 15 to 19 Minutes | 0 | 0.0% |
| 20 to 24 Minutes | 0 | 0.0% |
| 25 to 29 Minutes | 0 | 0.0% |
| 30 to 34 Minutes | 0 | 0.0% |
| 35 to 39 Minutes | 0 | 0.0% |
| 40 to 44 Minutes | 0 | 0.0% |
| 45 to 59 Minutes | 0 | 0.0% |
| 60 to 89 Minutes | 0 | 0.0% |
| 90 or more Minutes | 0 | 0.0% |
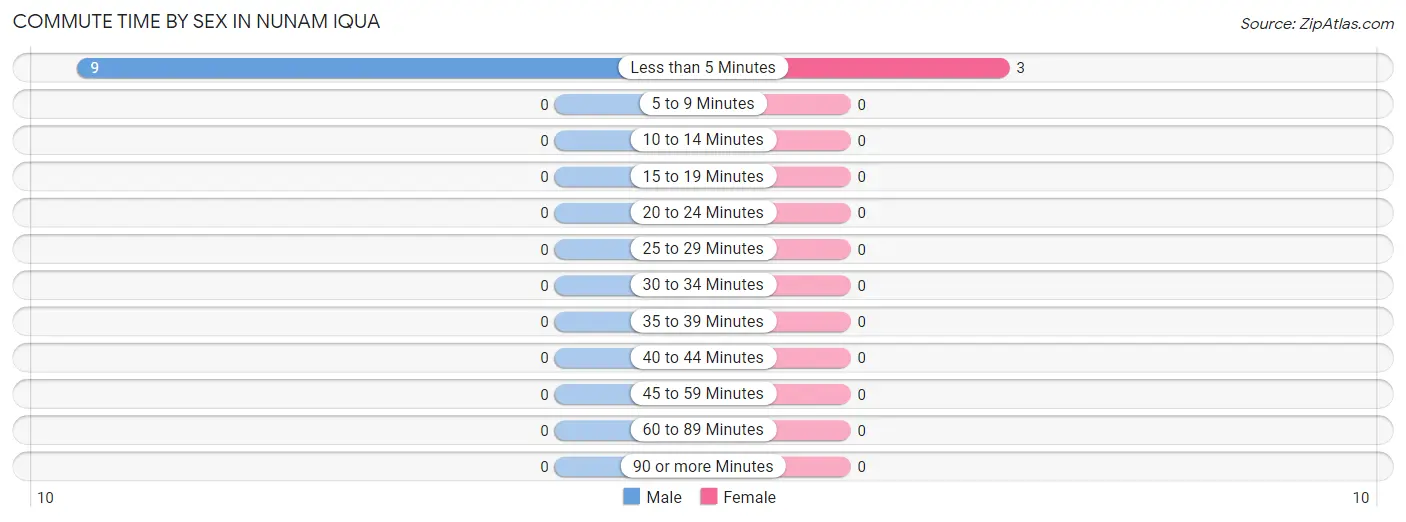
Commute Time by Sex in Nunam Iqua
The most common commute times in Nunam Iqua are less than 5 minutes (9 commuters, 100.0%) for males and less than 5 minutes (3 commuters, 100.0%) for females.
| Commute Time | Male | Female |
| Less than 5 Minutes | 9 (100.0%) | 3 (100.0%) |
| 5 to 9 Minutes | 0 (0.0%) | 0 (0.0%) |
| 10 to 14 Minutes | 0 (0.0%) | 0 (0.0%) |
| 15 to 19 Minutes | 0 (0.0%) | 0 (0.0%) |
| 20 to 24 Minutes | 0 (0.0%) | 0 (0.0%) |
| 25 to 29 Minutes | 0 (0.0%) | 0 (0.0%) |
| 30 to 34 Minutes | 0 (0.0%) | 0 (0.0%) |
| 35 to 39 Minutes | 0 (0.0%) | 0 (0.0%) |
| 40 to 44 Minutes | 0 (0.0%) | 0 (0.0%) |
| 45 to 59 Minutes | 0 (0.0%) | 0 (0.0%) |
| 60 to 89 Minutes | 0 (0.0%) | 0 (0.0%) |
| 90 or more Minutes | 0 (0.0%) | 0 (0.0%) |
Time of Departure to Work by Sex in Nunam Iqua
The most frequent times of departure to work in Nunam Iqua are 10:00 AM to 10:59 AM (5, 55.6%) for males and 8:30 AM to 8:59 AM (3, 100.0%) for females.
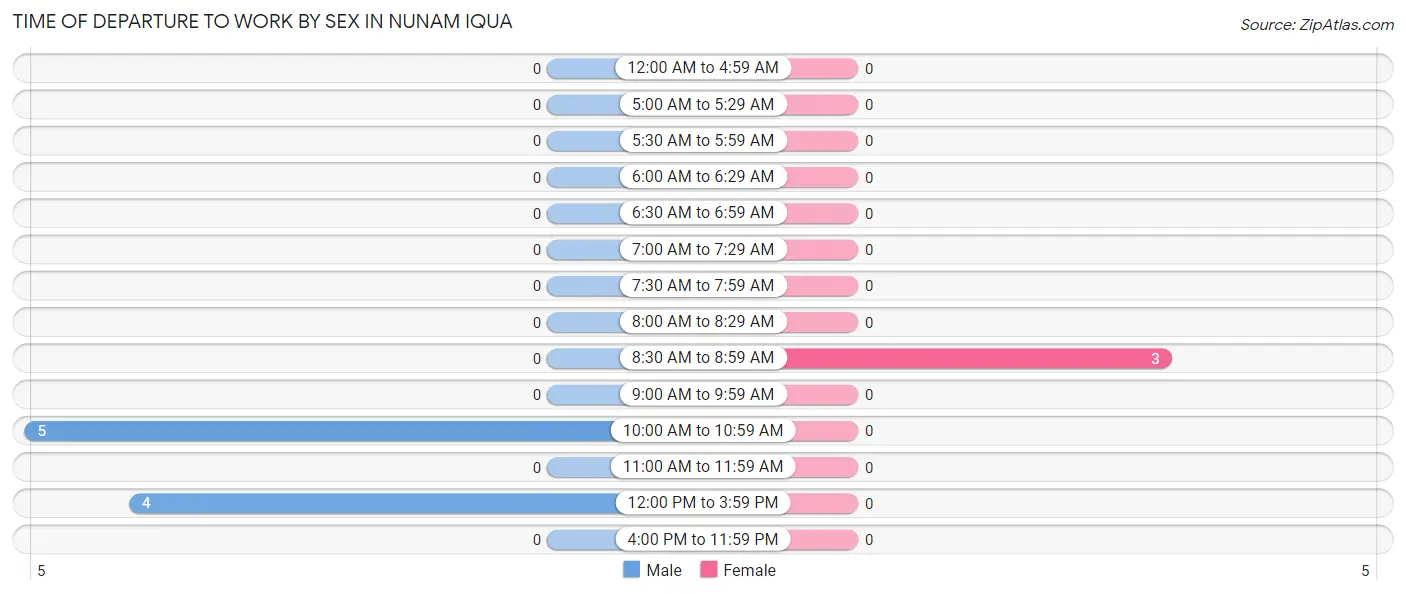
| Time of Departure | Male | Female |
| 12:00 AM to 4:59 AM | 0 (0.0%) | 0 (0.0%) |
| 5:00 AM to 5:29 AM | 0 (0.0%) | 0 (0.0%) |
| 5:30 AM to 5:59 AM | 0 (0.0%) | 0 (0.0%) |
| 6:00 AM to 6:29 AM | 0 (0.0%) | 0 (0.0%) |
| 6:30 AM to 6:59 AM | 0 (0.0%) | 0 (0.0%) |
| 7:00 AM to 7:29 AM | 0 (0.0%) | 0 (0.0%) |
| 7:30 AM to 7:59 AM | 0 (0.0%) | 0 (0.0%) |
| 8:00 AM to 8:29 AM | 0 (0.0%) | 0 (0.0%) |
| 8:30 AM to 8:59 AM | 0 (0.0%) | 3 (100.0%) |
| 9:00 AM to 9:59 AM | 0 (0.0%) | 0 (0.0%) |
| 10:00 AM to 10:59 AM | 5 (55.6%) | 0 (0.0%) |
| 11:00 AM to 11:59 AM | 0 (0.0%) | 0 (0.0%) |
| 12:00 PM to 3:59 PM | 4 (44.4%) | 0 (0.0%) |
| 4:00 PM to 11:59 PM | 0 (0.0%) | 0 (0.0%) |
| Total | 9 (100.0%) | 3 (100.0%) |
Housing Occupancy in Nunam Iqua
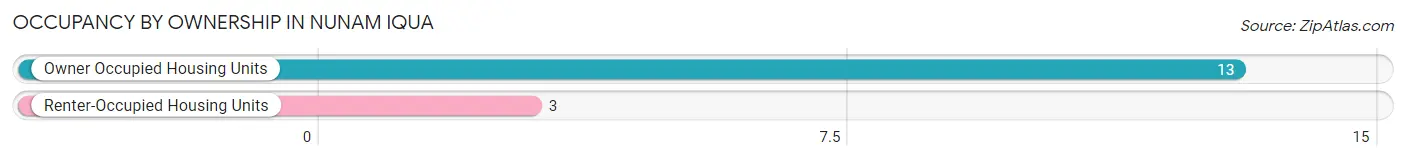
Occupancy by Ownership in Nunam Iqua
Of the total 16 dwellings in Nunam Iqua, owner-occupied units account for 13 (81.2%), while renter-occupied units make up 3 (18.8%).
| Occupancy | # Housing Units | % Housing Units |
| Owner Occupied Housing Units | 13 | 81.2% |
| Renter-Occupied Housing Units | 3 | 18.8% |
| Total Occupied Housing Units | 16 | 100.0% |
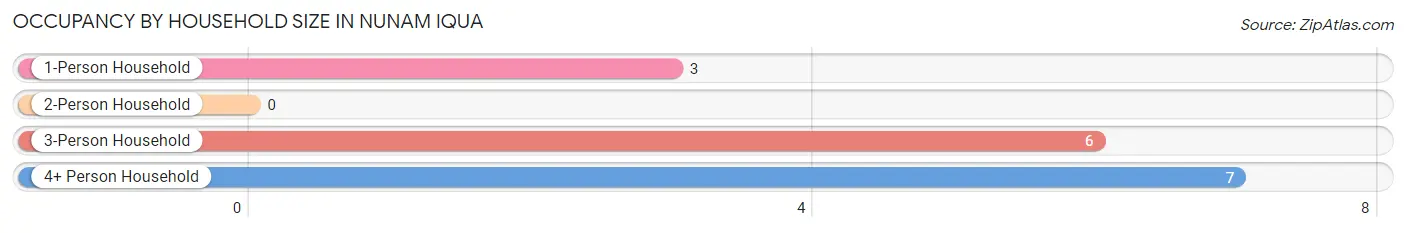
Occupancy by Household Size in Nunam Iqua
| Household Size | # Housing Units | % Housing Units |
| 1-Person Household | 3 | 18.8% |
| 2-Person Household | 0 | 0.0% |
| 3-Person Household | 6 | 37.5% |
| 4+ Person Household | 7 | 43.8% |
| Total Housing Units | 16 | 100.0% |
Occupancy by Ownership by Household Size in Nunam Iqua
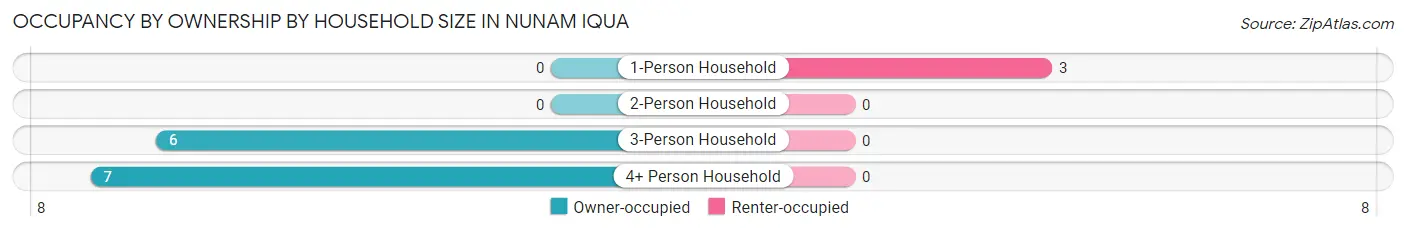
| Household Size | Owner-occupied | Renter-occupied |
| 1-Person Household | 0 (0.0%) | 3 (100.0%) |
| 2-Person Household | 0 (0.0%) | 0 (0.0%) |
| 3-Person Household | 6 (100.0%) | 0 (0.0%) |
| 4+ Person Household | 7 (100.0%) | 0 (0.0%) |
| Total Housing Units | 13 (81.2%) | 3 (18.8%) |
Occupancy by Educational Attainment in Nunam Iqua
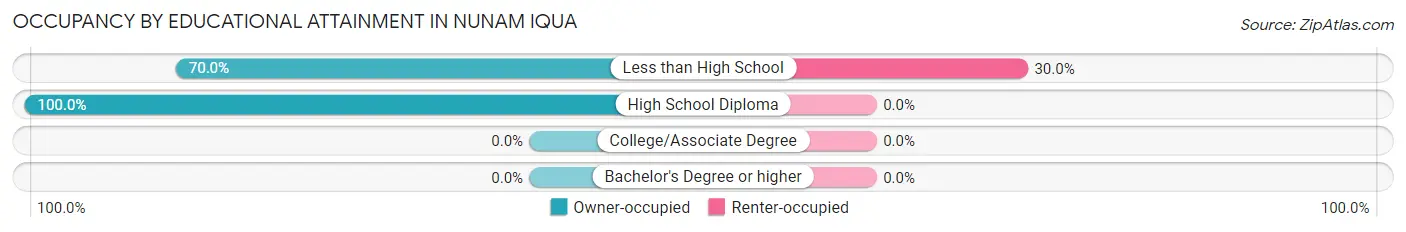
| Household Size | Owner-occupied | Renter-occupied |
| Less than High School | 7 (70.0%) | 3 (30.0%) |
| High School Diploma | 6 (100.0%) | 0 (0.0%) |
| College/Associate Degree | 0 (0.0%) | 0 (0.0%) |
| Bachelor's Degree or higher | 0 (0.0%) | 0 (0.0%) |
Occupancy by Age of Householder in Nunam Iqua
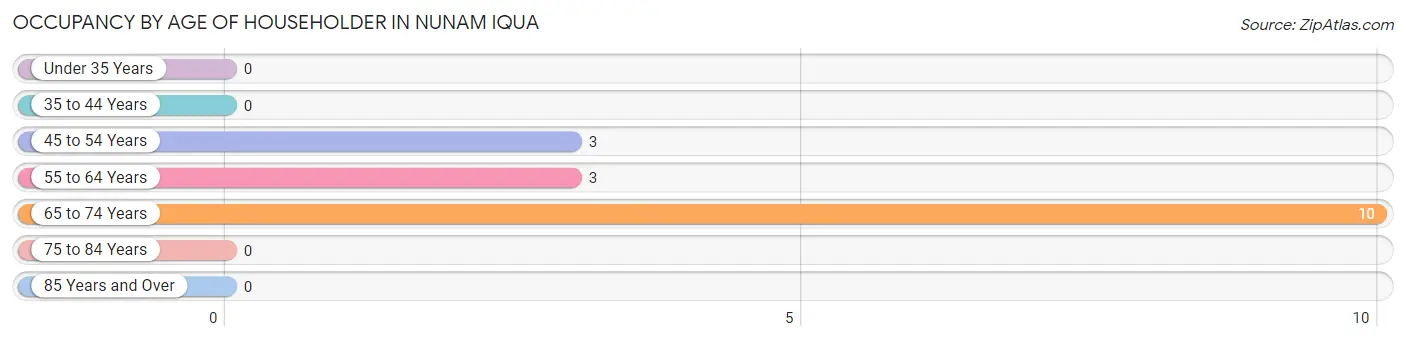
| Age Bracket | # Households | % Households |
| Under 35 Years | 0 | 0.0% |
| 35 to 44 Years | 0 | 0.0% |
| 45 to 54 Years | 3 | 18.8% |
| 55 to 64 Years | 3 | 18.8% |
| 65 to 74 Years | 10 | 62.5% |
| 75 to 84 Years | 0 | 0.0% |
| 85 Years and Over | 0 | 0.0% |
| Total | 16 | 100.0% |
Housing Finances in Nunam Iqua
Median Income by Occupancy in Nunam Iqua
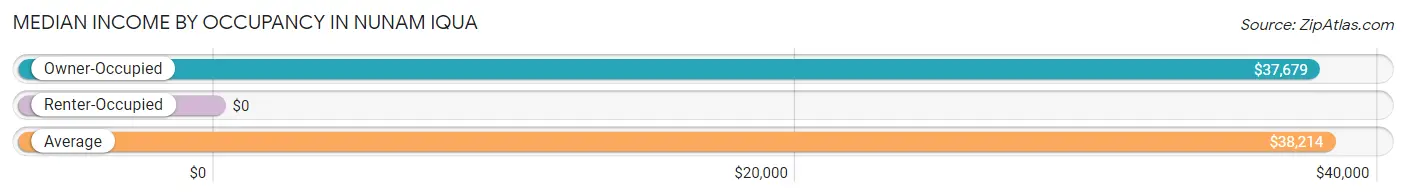
| Occupancy Type | # Households | Median Income |
| Owner-Occupied | 13 (81.2%) | $37,679 |
| Renter-Occupied | 3 (18.8%) | $0 |
| Average | 16 (100.0%) | $38,214 |
Occupancy by Householder Income Bracket in Nunam Iqua
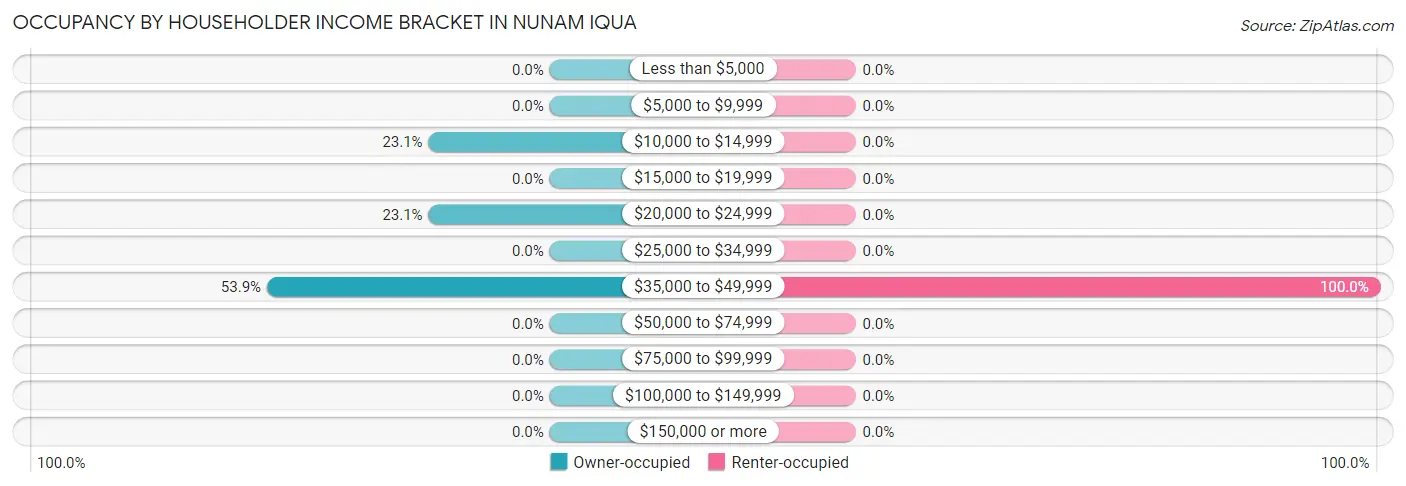
| Income Bracket | Owner-occupied | Renter-occupied |
| Less than $5,000 | 0 (0.0%) | 0 (0.0%) |
| $5,000 to $9,999 | 0 (0.0%) | 0 (0.0%) |
| $10,000 to $14,999 | 3 (23.1%) | 0 (0.0%) |
| $15,000 to $19,999 | 0 (0.0%) | 0 (0.0%) |
| $20,000 to $24,999 | 3 (23.1%) | 0 (0.0%) |
| $25,000 to $34,999 | 0 (0.0%) | 0 (0.0%) |
| $35,000 to $49,999 | 7 (53.8%) | 3 (100.0%) |
| $50,000 to $74,999 | 0 (0.0%) | 0 (0.0%) |
| $75,000 to $99,999 | 0 (0.0%) | 0 (0.0%) |
| $100,000 to $149,999 | 0 (0.0%) | 0 (0.0%) |
| $150,000 or more | 0 (0.0%) | 0 (0.0%) |
| Total | 13 (100.0%) | 3 (100.0%) |
Monthly Housing Cost Tiers in Nunam Iqua
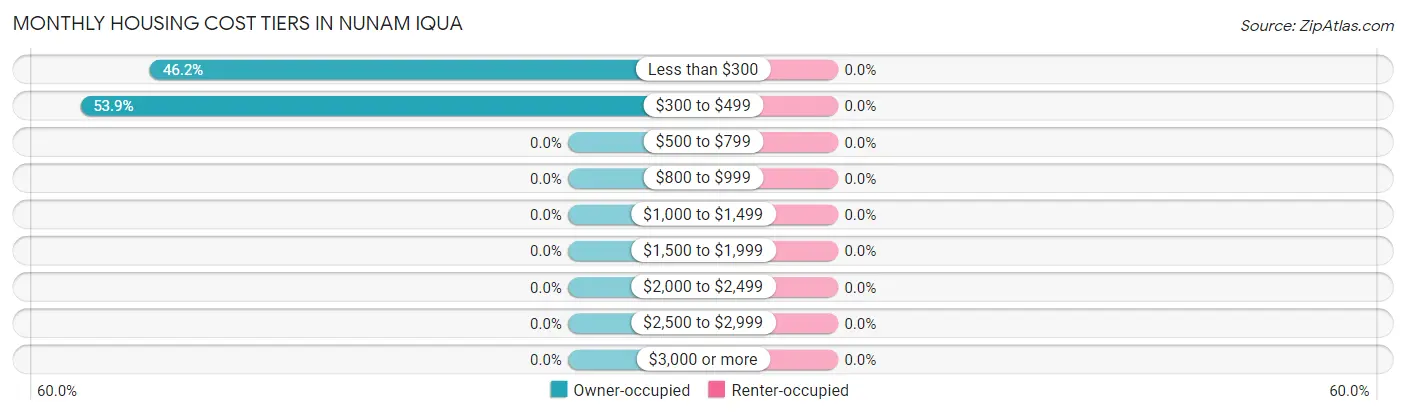
| Monthly Cost | Owner-occupied | Renter-occupied |
| Less than $300 | 6 (46.2%) | 0 (0.0%) |
| $300 to $499 | 7 (53.8%) | 0 (0.0%) |
| $500 to $799 | 0 (0.0%) | 0 (0.0%) |
| $800 to $999 | 0 (0.0%) | 0 (0.0%) |
| $1,000 to $1,499 | 0 (0.0%) | 0 (0.0%) |
| $1,500 to $1,999 | 0 (0.0%) | 0 (0.0%) |
| $2,000 to $2,499 | 0 (0.0%) | 0 (0.0%) |
| $2,500 to $2,999 | 0 (0.0%) | 0 (0.0%) |
| $3,000 or more | 0 (0.0%) | 0 (0.0%) |
| Total | 13 (100.0%) | 3 (100.0%) |
Physical Housing Characteristics in Nunam Iqua
Housing Structures in Nunam Iqua
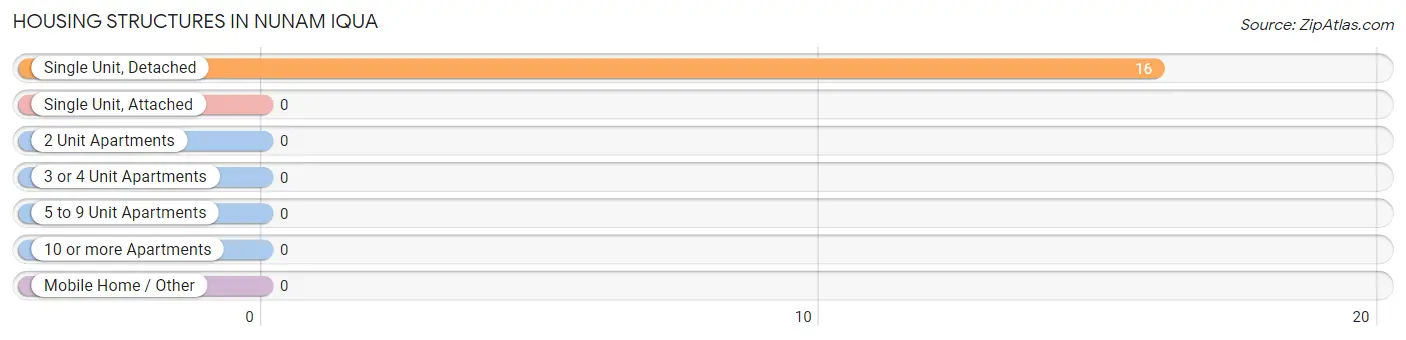
| Structure Type | # Housing Units | % Housing Units |
| Single Unit, Detached | 16 | 100.0% |
| Single Unit, Attached | 0 | 0.0% |
| 2 Unit Apartments | 0 | 0.0% |
| 3 or 4 Unit Apartments | 0 | 0.0% |
| 5 to 9 Unit Apartments | 0 | 0.0% |
| 10 or more Apartments | 0 | 0.0% |
| Mobile Home / Other | 0 | 0.0% |
| Total | 16 | 100.0% |
Housing Structures by Occupancy in Nunam Iqua
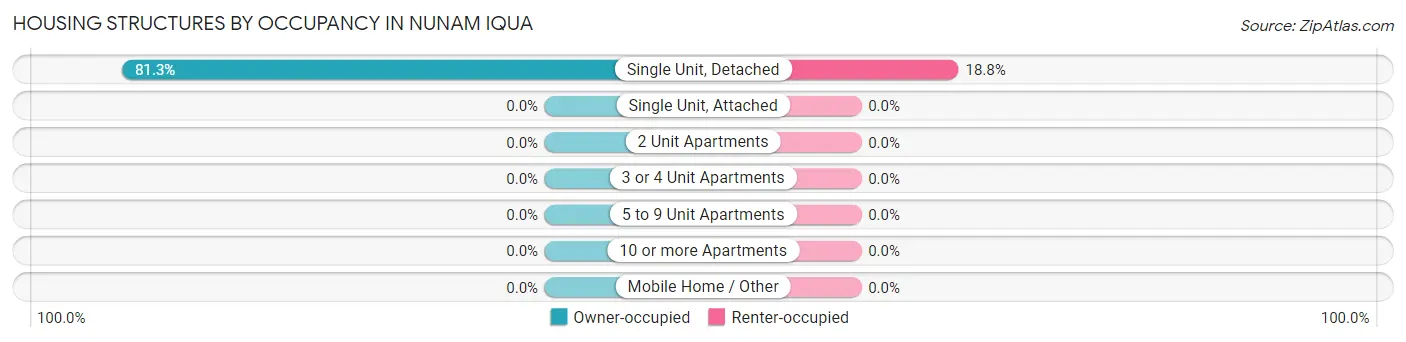
| Structure Type | Owner-occupied | Renter-occupied |
| Single Unit, Detached | 13 (81.2%) | 3 (18.8%) |
| Single Unit, Attached | 0 (0.0%) | 0 (0.0%) |
| 2 Unit Apartments | 0 (0.0%) | 0 (0.0%) |
| 3 or 4 Unit Apartments | 0 (0.0%) | 0 (0.0%) |
| 5 to 9 Unit Apartments | 0 (0.0%) | 0 (0.0%) |
| 10 or more Apartments | 0 (0.0%) | 0 (0.0%) |
| Mobile Home / Other | 0 (0.0%) | 0 (0.0%) |
| Total | 13 (81.2%) | 3 (18.8%) |
Housing Structures by Number of Rooms in Nunam Iqua
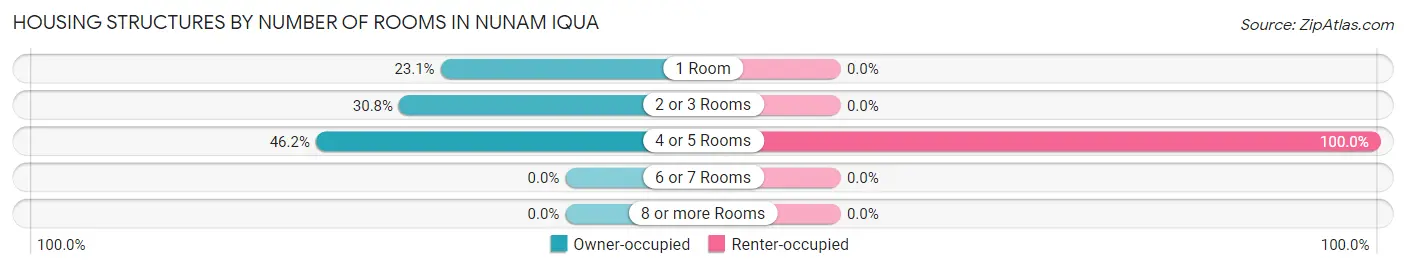
| Number of Rooms | Owner-occupied | Renter-occupied |
| 1 Room | 3 (23.1%) | 0 (0.0%) |
| 2 or 3 Rooms | 4 (30.8%) | 0 (0.0%) |
| 4 or 5 Rooms | 6 (46.2%) | 3 (100.0%) |
| 6 or 7 Rooms | 0 (0.0%) | 0 (0.0%) |
| 8 or more Rooms | 0 (0.0%) | 0 (0.0%) |
| Total | 13 (100.0%) | 3 (100.0%) |
Housing Structure by Heating Type in Nunam Iqua
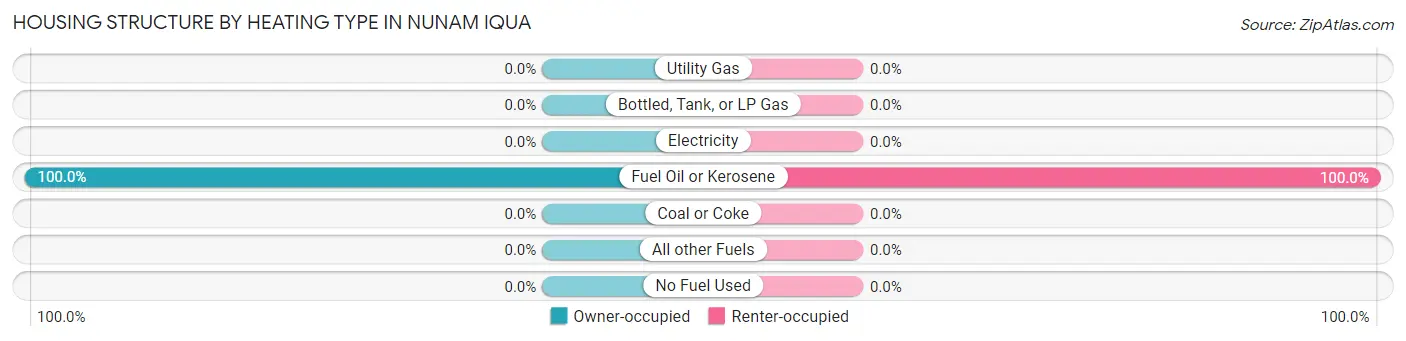
| Heating Type | Owner-occupied | Renter-occupied |
| Utility Gas | 0 (0.0%) | 0 (0.0%) |
| Bottled, Tank, or LP Gas | 0 (0.0%) | 0 (0.0%) |
| Electricity | 0 (0.0%) | 0 (0.0%) |
| Fuel Oil or Kerosene | 13 (100.0%) | 3 (100.0%) |
| Coal or Coke | 0 (0.0%) | 0 (0.0%) |
| All other Fuels | 0 (0.0%) | 0 (0.0%) |
| No Fuel Used | 0 (0.0%) | 0 (0.0%) |
| Total | 13 (100.0%) | 3 (100.0%) |
Household Vehicle Usage in Nunam Iqua
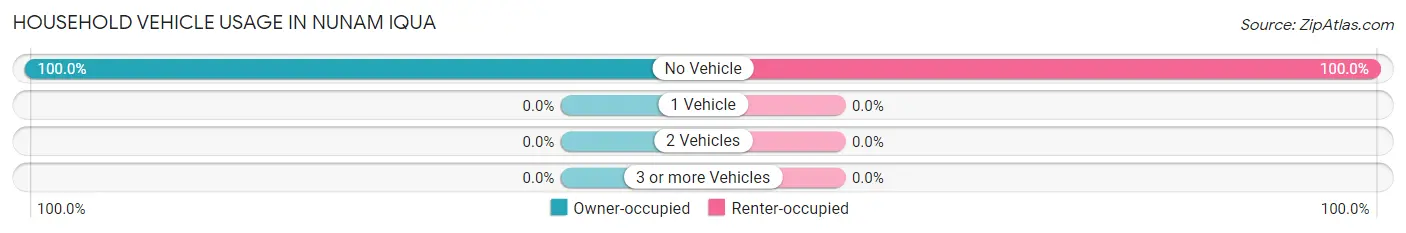
| Vehicles per Household | Owner-occupied | Renter-occupied |
| No Vehicle | 13 (100.0%) | 3 (100.0%) |
| 1 Vehicle | 0 (0.0%) | 0 (0.0%) |
| 2 Vehicles | 0 (0.0%) | 0 (0.0%) |
| 3 or more Vehicles | 0 (0.0%) | 0 (0.0%) |
| Total | 13 (100.0%) | 3 (100.0%) |
Real Estate & Mortgages in Nunam Iqua
Real Estate and Mortgage Overview in Nunam Iqua
| Characteristic | Without Mortgage | With Mortgage |
| Housing Units | 10 | 3 |
| Median Property Value | $42,900 | $0 |
| Median Household Income | $38,214 | $0 |
| Monthly Housing Costs | $242 | $0 |
| Real Estate Taxes | - | - |
Property Value by Mortgage Status in Nunam Iqua
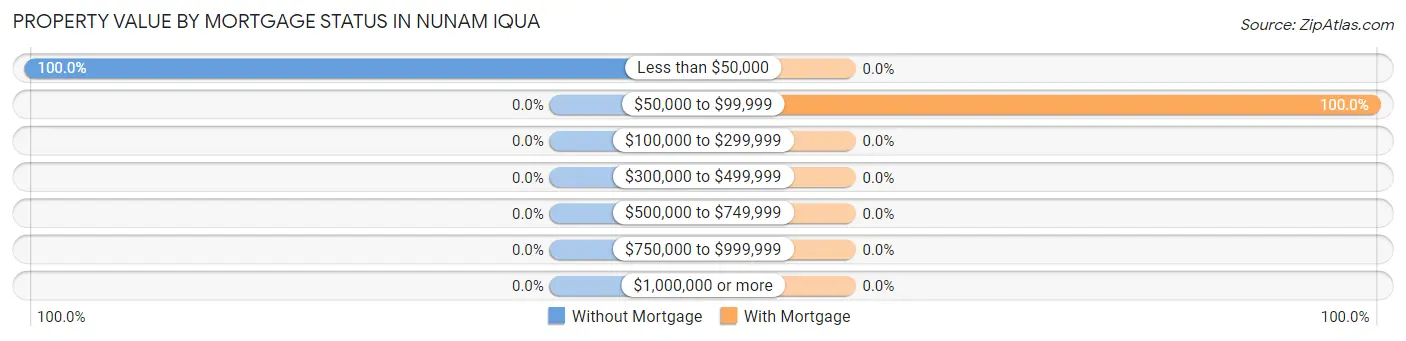
| Property Value | Without Mortgage | With Mortgage |
| Less than $50,000 | 10 (100.0%) | 0 (0.0%) |
| $50,000 to $99,999 | 0 (0.0%) | 3 (100.0%) |
| $100,000 to $299,999 | 0 (0.0%) | 0 (0.0%) |
| $300,000 to $499,999 | 0 (0.0%) | 0 (0.0%) |
| $500,000 to $749,999 | 0 (0.0%) | 0 (0.0%) |
| $750,000 to $999,999 | 0 (0.0%) | 0 (0.0%) |
| $1,000,000 or more | 0 (0.0%) | 0 (0.0%) |
| Total | 10 (100.0%) | 3 (100.0%) |
Household Income by Mortgage Status in Nunam Iqua
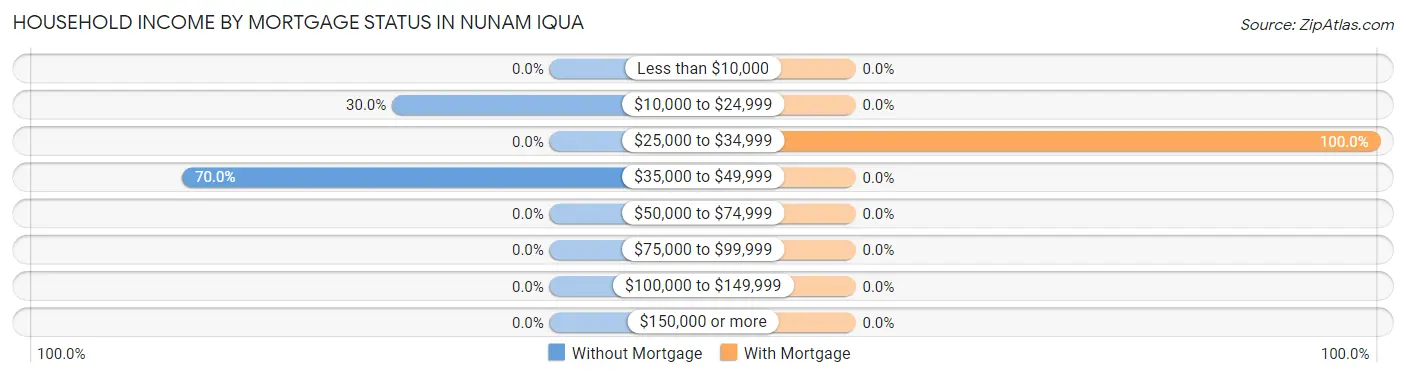
| Household Income | Without Mortgage | With Mortgage |
| Less than $10,000 | 0 (0.0%) | 0 (0.0%) |
| $10,000 to $24,999 | 3 (30.0%) | 0 (0.0%) |
| $25,000 to $34,999 | 0 (0.0%) | 3 (100.0%) |
| $35,000 to $49,999 | 7 (70.0%) | 0 (0.0%) |
| $50,000 to $74,999 | 0 (0.0%) | 0 (0.0%) |
| $75,000 to $99,999 | 0 (0.0%) | 0 (0.0%) |
| $100,000 to $149,999 | 0 (0.0%) | 0 (0.0%) |
| $150,000 or more | 0 (0.0%) | 0 (0.0%) |
| Total | 10 (100.0%) | 3 (100.0%) |
Property Value to Household Income Ratio in Nunam Iqua
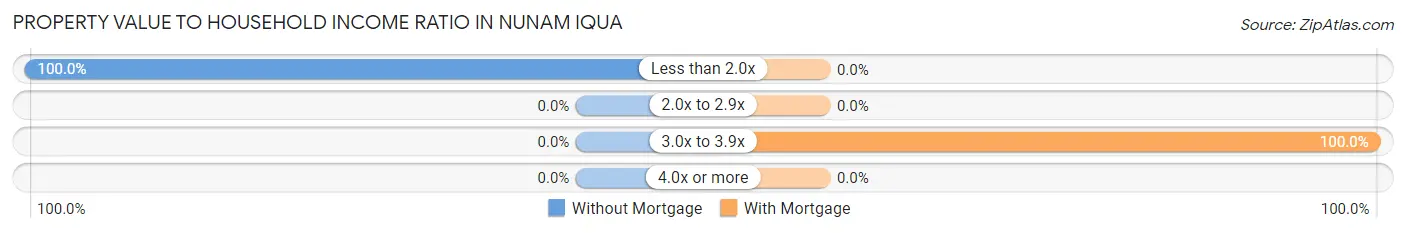
| Value-to-Income Ratio | Without Mortgage | With Mortgage |
| Less than 2.0x | 10 (100.0%) | 0 (0.0%) |
| 2.0x to 2.9x | 0 (0.0%) | 0 (0.0%) |
| 3.0x to 3.9x | 0 (0.0%) | 3 (100.0%) |
| 4.0x or more | 0 (0.0%) | 0 (0.0%) |
| Total | 10 (100.0%) | 3 (100.0%) |
Real Estate Taxes by Mortgage Status in Nunam Iqua
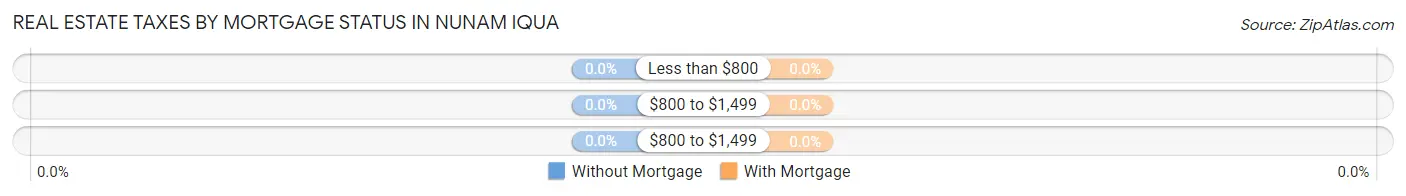
| Property Taxes | Without Mortgage | With Mortgage |
| Less than $800 | 0 (0.0%) | 0 (0.0%) |
| $800 to $1,499 | 0 (0.0%) | 0 (0.0%) |
| $800 to $1,499 | 0 (0.0%) | 0 (0.0%) |
| Total | 10 (100.0%) | 3 (100.0%) |
Health & Disability in Nunam Iqua
Health Insurance Coverage by Age in Nunam Iqua
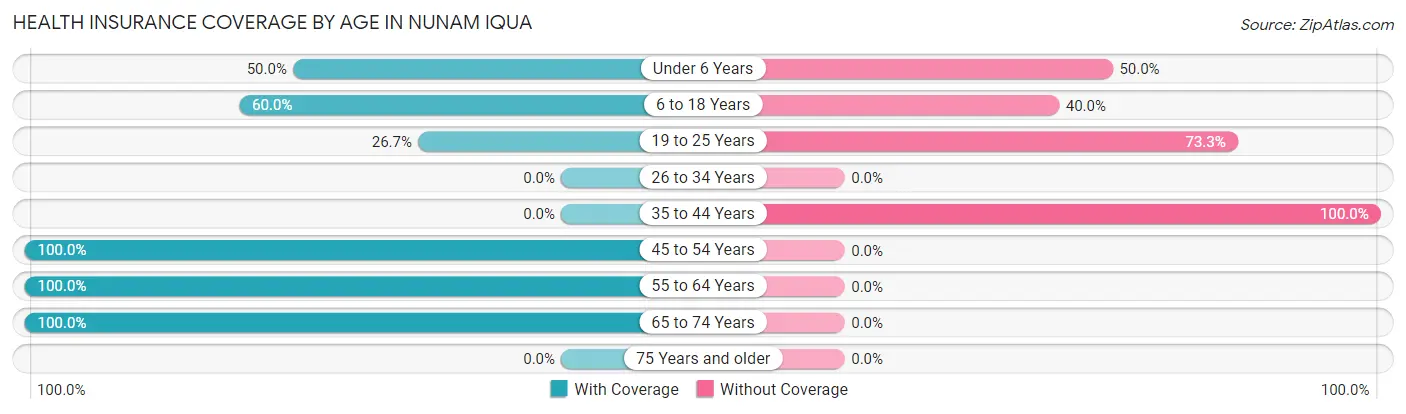
| Age Bracket | With Coverage | Without Coverage |
| Under 6 Years | 6 (50.0%) | 6 (50.0%) |
| 6 to 18 Years | 6 (60.0%) | 4 (40.0%) |
| 19 to 25 Years | 4 (26.7%) | 11 (73.3%) |
| 26 to 34 Years | 0 (0.0%) | 0 (0.0%) |
| 35 to 44 Years | 0 (0.0%) | 3 (100.0%) |
| 45 to 54 Years | 3 (100.0%) | 0 (0.0%) |
| 55 to 64 Years | 6 (100.0%) | 0 (0.0%) |
| 65 to 74 Years | 10 (100.0%) | 0 (0.0%) |
| 75 Years and older | 0 (0.0%) | 0 (0.0%) |
| Total | 35 (59.3%) | 24 (40.7%) |
Health Insurance Coverage by Citizenship Status in Nunam Iqua
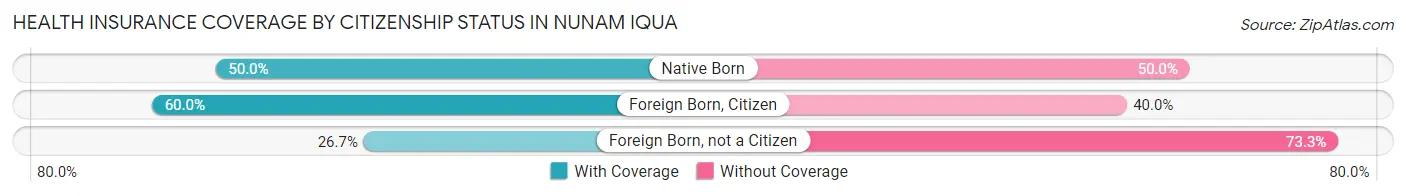
| Citizenship Status | With Coverage | Without Coverage |
| Native Born | 6 (50.0%) | 6 (50.0%) |
| Foreign Born, Citizen | 6 (60.0%) | 4 (40.0%) |
| Foreign Born, not a Citizen | 4 (26.7%) | 11 (73.3%) |
Health Insurance Coverage by Household Income in Nunam Iqua
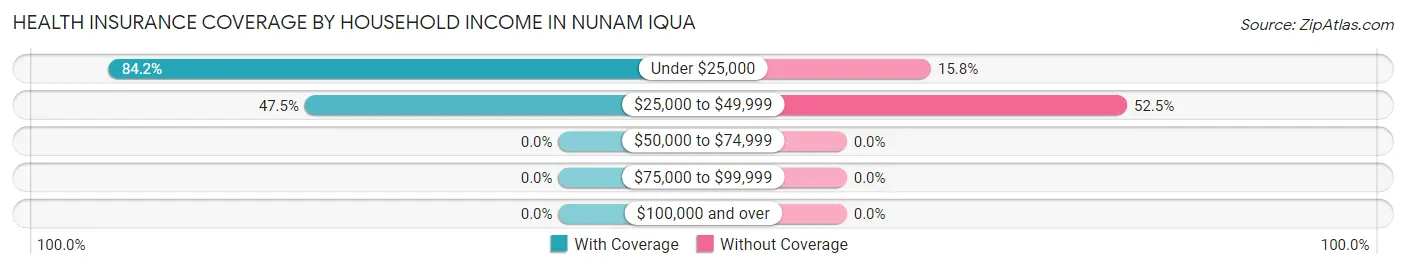
| Household Income | With Coverage | Without Coverage |
| Under $25,000 | 16 (84.2%) | 3 (15.8%) |
| $25,000 to $49,999 | 19 (47.5%) | 21 (52.5%) |
| $50,000 to $74,999 | 0 (0.0%) | 0 (0.0%) |
| $75,000 to $99,999 | 0 (0.0%) | 0 (0.0%) |
| $100,000 and over | 0 (0.0%) | 0 (0.0%) |
Public vs Private Health Insurance Coverage by Age in Nunam Iqua
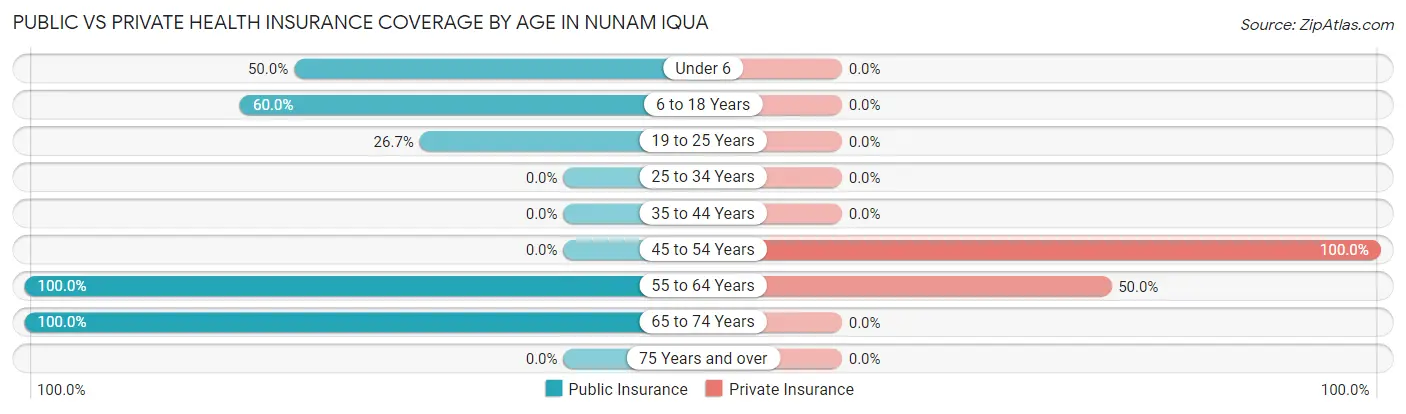
| Age Bracket | Public Insurance | Private Insurance |
| Under 6 | 6 (50.0%) | 0 (0.0%) |
| 6 to 18 Years | 6 (60.0%) | 0 (0.0%) |
| 19 to 25 Years | 4 (26.7%) | 0 (0.0%) |
| 25 to 34 Years | 0 (0.0%) | 0 (0.0%) |
| 35 to 44 Years | 0 (0.0%) | 0 (0.0%) |
| 45 to 54 Years | 0 (0.0%) | 3 (100.0%) |
| 55 to 64 Years | 6 (100.0%) | 3 (50.0%) |
| 65 to 74 Years | 10 (100.0%) | 0 (0.0%) |
| 75 Years and over | 0 (0.0%) | 0 (0.0%) |
| Total | 32 (54.2%) | 6 (10.2%) |
Disability Status by Sex by Age in Nunam Iqua
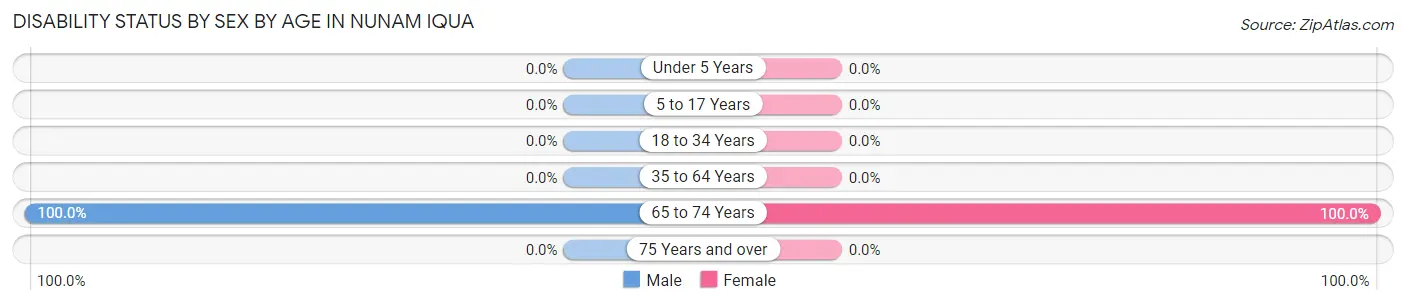
| Age Bracket | Male | Female |
| Under 5 Years | 0 (0.0%) | 0 (0.0%) |
| 5 to 17 Years | 0 (0.0%) | 0 (0.0%) |
| 18 to 34 Years | 0 (0.0%) | 0 (0.0%) |
| 35 to 64 Years | 0 (0.0%) | 0 (0.0%) |
| 65 to 74 Years | 3 (100.0%) | 7 (100.0%) |
| 75 Years and over | 0 (0.0%) | 0 (0.0%) |
Disability Class by Sex by Age in Nunam Iqua
Disability Class: Hearing Difficulty
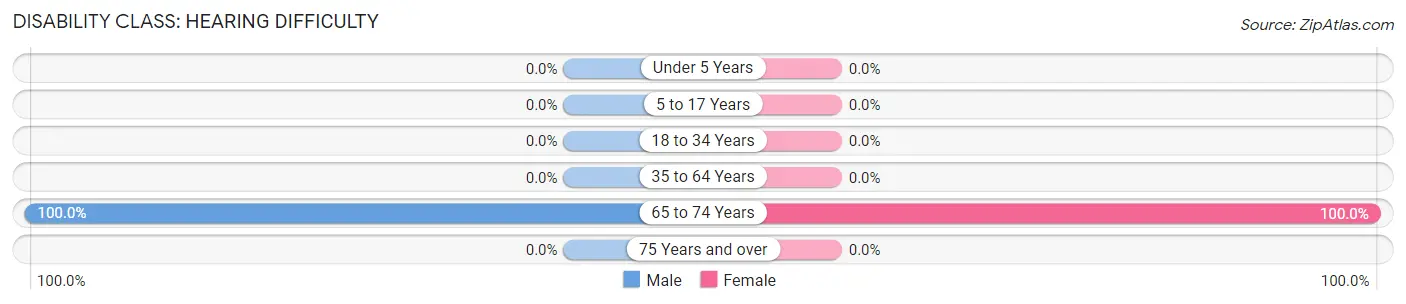
| Age Bracket | Male | Female |
| Under 5 Years | 0 (0.0%) | 0 (0.0%) |
| 5 to 17 Years | 0 (0.0%) | 0 (0.0%) |
| 18 to 34 Years | 0 (0.0%) | 0 (0.0%) |
| 35 to 64 Years | 0 (0.0%) | 0 (0.0%) |
| 65 to 74 Years | 3 (100.0%) | 7 (100.0%) |
| 75 Years and over | 0 (0.0%) | 0 (0.0%) |
Disability Class: Vision Difficulty
| Age Bracket | Male | Female |
| Under 5 Years | 0 (0.0%) | 0 (0.0%) |
| 5 to 17 Years | 0 (0.0%) | 0 (0.0%) |
| 18 to 34 Years | 0 (0.0%) | 0 (0.0%) |
| 35 to 64 Years | 0 (0.0%) | 0 (0.0%) |
| 65 to 74 Years | 0 (0.0%) | 0 (0.0%) |
| 75 Years and over | 0 (0.0%) | 0 (0.0%) |
Disability Class: Cognitive Difficulty
| Age Bracket | Male | Female |
| 5 to 17 Years | 0 (0.0%) | 0 (0.0%) |
| 18 to 34 Years | 0 (0.0%) | 0 (0.0%) |
| 35 to 64 Years | 0 (0.0%) | 0 (0.0%) |
| 65 to 74 Years | 3 (100.0%) | 3 (42.9%) |
| 75 Years and over | 0 (0.0%) | 0 (0.0%) |
Disability Class: Ambulatory Difficulty
| Age Bracket | Male | Female |
| 5 to 17 Years | 0 (0.0%) | 0 (0.0%) |
| 18 to 34 Years | 0 (0.0%) | 0 (0.0%) |
| 35 to 64 Years | 0 (0.0%) | 0 (0.0%) |
| 65 to 74 Years | 3 (100.0%) | 0 (0.0%) |
| 75 Years and over | 0 (0.0%) | 0 (0.0%) |
Disability Class: Self-Care Difficulty
| Age Bracket | Male | Female |
| 5 to 17 Years | 0 (0.0%) | 0 (0.0%) |
| 18 to 34 Years | 0 (0.0%) | 0 (0.0%) |
| 35 to 64 Years | 0 (0.0%) | 0 (0.0%) |
| 65 to 74 Years | 0 (0.0%) | 0 (0.0%) |
| 75 Years and over | 0 (0.0%) | 0 (0.0%) |
Technology Access in Nunam Iqua
Computing Device Access in Nunam Iqua
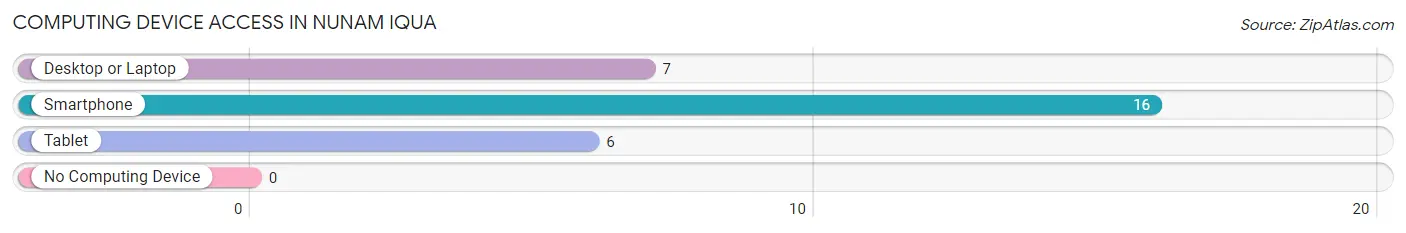
| Device Type | # Households | % Households |
| Desktop or Laptop | 7 | 43.8% |
| Smartphone | 16 | 100.0% |
| Tablet | 6 | 37.5% |
| No Computing Device | 0 | 0.0% |
| Total | 16 | 100.0% |
Internet Access in Nunam Iqua
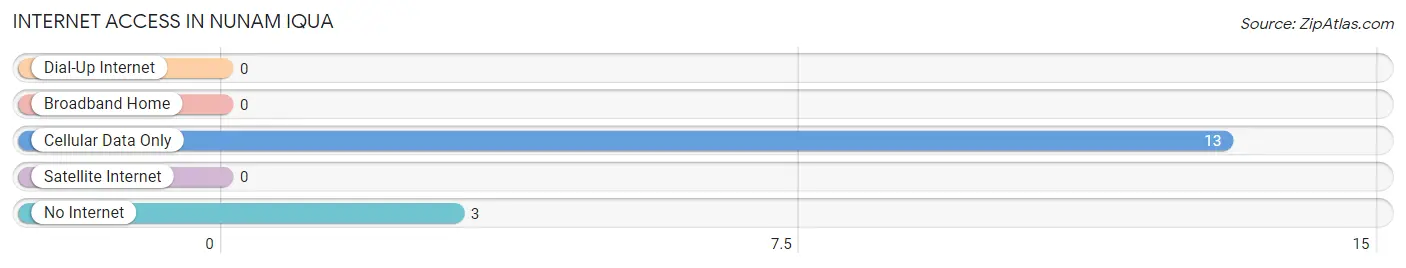
| Internet Type | # Households | % Households |
| Dial-Up Internet | 0 | 0.0% |
| Broadband Home | 0 | 0.0% |
| Cellular Data Only | 13 | 81.2% |
| Satellite Internet | 0 | 0.0% |
| No Internet | 3 | 18.8% |
| Total | 16 | 100.0% |
Nunam Iqua Summary
Nunam Iqua is a small city located in the western part of Alaska, in the Yukon-Kuskokwim Delta region. It is situated on the north bank of the Yukon River, about 25 miles east of the Bering Sea. The city is part of the Bethel Census Area and has a population of about 590 people, according to the 2010 census.
Geography
Nunam Iqua is located in the Yukon-Kuskokwim Delta region of western Alaska. The city is situated on the north bank of the Yukon River, about 25 miles east of the Bering Sea. The city is surrounded by tundra and wetlands, and is located in a region of low hills and rolling terrain. The climate in Nunam Iqua is subarctic, with long, cold winters and short, cool summers. The average annual temperature is about 33°F, and the average annual precipitation is about 10 inches.
Economy
Nunam Iqua’s economy is largely based on subsistence activities, such as fishing, hunting, and gathering. The city also has a small commercial fishing industry, and some of the residents are employed in the local government. The city is home to a small airport, and there is a small store and post office in the city.
Demographics
As of the 2010 census, the population of Nunam Iqua was 590 people. The racial makeup of the city was 95.3% Native American, 2.7% White, 0.2% Asian, and 1.8% from two or more races. The median age of the population was 28.7 years, and the median household income was $25,000.
History
Nunam Iqua was originally inhabited by the Yup’ik people, who have lived in the region for thousands of years. The city was established in the late 19th century as a trading post and fishing camp. In the early 20th century, the city was incorporated as a village, and in the 1950s, it was incorporated as a city.
In the late 20th century, Nunam Iqua experienced a period of economic growth, as the city began to attract more visitors and businesses. In the early 21st century, the city has continued to grow, and it is now home to a variety of businesses, including a hotel, a restaurant, and a grocery store. The city is also home to a small airport, and there is a small store and post office in the city.
Conclusion
Nunam Iqua is a small city located in the western part of Alaska, in the Yukon-Kuskokwim Delta region. It is situated on the north bank of the Yukon River, about 25 miles east of the Bering Sea. The city is part of the Bethel Census Area and has a population of about 590 people, according to the 2010 census. The economy of Nunam Iqua is largely based on subsistence activities, such as fishing, hunting, and gathering. The city also has a small commercial fishing industry, and some of the residents are employed in the local government. The city is home to a small airport, and there is a small store and post office in the city. Nunam Iqua has a long history, and it has experienced a period of economic growth in the late 20th century. The city is now home to a variety of businesses, and it continues to grow.
Common Questions
What is Per Capita Income in Nunam Iqua?
Per Capita income in Nunam Iqua is $8,722.
What is the Median Family Income in Nunam Iqua?
Median Family Income in Nunam Iqua is $37,679.
What is the Median Household income in Nunam Iqua?
Median Household Income in Nunam Iqua is $38,214.
What is Family Income Deficit in Nunam Iqua?
Family Income Deficit in Nunam Iqua is $5,450.
Families that are below poverty line in Nunam Iqua earn $5,450 less on average than the poverty threshold level.
What is Inequality or Gini Index in Nunam Iqua?
Inequality or Gini Index in Nunam Iqua is 0.21.
What is the Total Population of Nunam Iqua?
Total Population of Nunam Iqua is 59.
What is the Total Male Population of Nunam Iqua?
Total Male Population of Nunam Iqua is 33.
What is the Total Female Population of Nunam Iqua?
Total Female Population of Nunam Iqua is 26.
What is the Ratio of Males per 100 Females in Nunam Iqua?
There are 126.92 Males per 100 Females in Nunam Iqua.
What is the Ratio of Females per 100 Males in Nunam Iqua?
There are 78.79 Females per 100 Males in Nunam Iqua.
What is the Median Population Age in Nunam Iqua?
Median Population Age in Nunam Iqua is 21.8 Years.
What is the Average Family Size in Nunam Iqua
Average Family Size in Nunam Iqua is 4.3 People.
What is the Average Household Size in Nunam Iqua
Average Household Size in Nunam Iqua is 3.7 People.
How Large is the Labor Force in Nunam Iqua?
There are 18 People in the Labor Forcein in Nunam Iqua.
What is the Percentage of People in the Labor Force in Nunam Iqua?
48.6% of People are in the Labor Force in Nunam Iqua.
What is the Unemployment Rate in Nunam Iqua?
Unemployment Rate in Nunam Iqua is 33.3%.