Zip Codes with the Highest Percentage of Population with a Degree in Visual and Performing Arts in Watertown, WI
RELATED REPORTS & OPTIONS
Visual and Performing Arts
Watertown
Compare Zip Codes
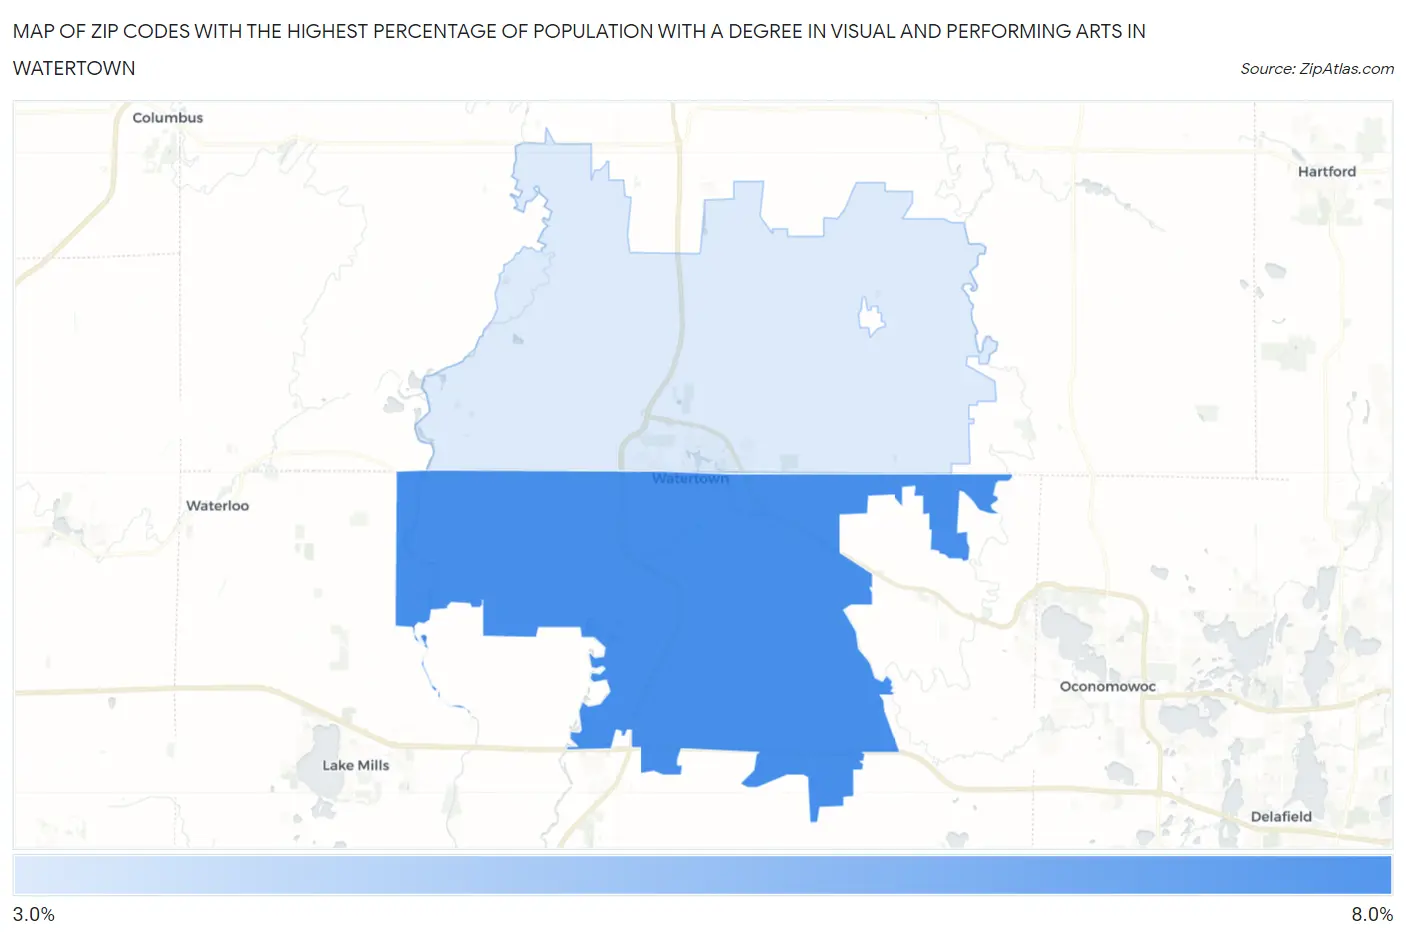
Map of Zip Codes with the Highest Percentage of Population with a Degree in Visual and Performing Arts in Watertown
3.3%
6.5%
Zip Codes with the Highest Percentage of Population with a Degree in Visual and Performing Arts in Watertown, WI
| Zip Code | % Graduates | vs State | vs National | |
| 1. | 53094 | 6.5% | 3.7%(+2.76)#67 | 4.3%(+2.26)#4,217 |
| 2. | 53098 | 3.3% | 3.7%(-0.490)#293 | 4.3%(-0.997)#11,790 |
1
Common Questions
What are the Top Zip Codes with the Highest Percentage of Population with a Degree in Visual and Performing Arts in Watertown, WI?
Top Zip Codes with the Highest Percentage of Population with a Degree in Visual and Performing Arts in Watertown, WI are:
What zip code has the Highest Percentage of Population with a Degree in Visual and Performing Arts in Watertown, WI?
53094 has the Highest Percentage of Population with a Degree in Visual and Performing Arts in Watertown, WI with 6.5%.
What is the Percentage of Population with a Degree in Visual and Performing Arts in Watertown, WI?
Percentage of Population with a Degree in Visual and Performing Arts in Watertown is 5.2%.
What is the Percentage of Population with a Degree in Visual and Performing Arts in Wisconsin?
Percentage of Population with a Degree in Visual and Performing Arts in Wisconsin is 3.7%.
What is the Percentage of Population with a Degree in Visual and Performing Arts in the United States?
Percentage of Population with a Degree in Visual and Performing Arts in the United States is 4.3%.