Genoa City, WI Map & Demographics
Genoa City Map
Genoa City Overview
$34,791
PER CAPITA INCOME
$88,095
AVG FAMILY INCOME
$82,063
AVG HOUSEHOLD INCOME
32.7%
WAGE / INCOME GAP [ % ]
67.3¢/ $1
WAGE / INCOME GAP [ $ ]
0.36
INEQUALITY / GINI INDEX
2,975
TOTAL POPULATION
1,570
MALE POPULATION
1,405
FEMALE POPULATION
111.74
MALES / 100 FEMALES
89.49
FEMALES / 100 MALES
33.7
MEDIAN AGE
3.1
AVG FAMILY SIZE
2.6
AVG HOUSEHOLD SIZE
1,663
LABOR FORCE [ PEOPLE ]
77.4%
PERCENT IN LABOR FORCE
4.9%
UNEMPLOYMENT RATE
Genoa City Zip Codes
Genoa City Area Codes
Income in Genoa City
Income Overview in Genoa City
Per Capita Income in Genoa City is $34,791, while median incomes of families and households are $88,095 and $82,063 respectively.
| Characteristic | Number | Measure |
| Per Capita Income | 2,975 | $34,791 |
| Median Family Income | 818 | $88,095 |
| Mean Family Income | 818 | $101,140 |
| Median Household Income | 1,109 | $82,063 |
| Mean Household Income | 1,109 | $90,740 |
| Income Deficit | 818 | $0 |
| Wage / Income Gap (%) | 2,975 | 32.73% |
| Wage / Income Gap ($) | 2,975 | 67.27¢ per $1 |
| Gini / Inequality Index | 2,975 | 0.36 |
Earnings by Sex in Genoa City
Average Earnings in Genoa City are $47,122, $58,941 for men and $39,648 for women, a difference of 32.7%.
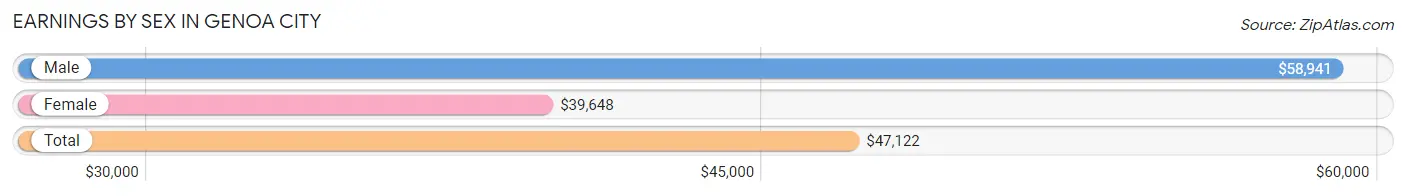
| Sex | Number | Average Earnings |
| Male | 914 (54.8%) | $58,941 |
| Female | 753 (45.2%) | $39,648 |
| Total | 1,667 (100.0%) | $47,122 |
Earnings by Sex by Income Bracket in Genoa City
The most common earnings brackets in Genoa City are $75,000 to $99,999 for men (165 | 18.0%) and $35,000 to $39,999 for women (98 | 13.0%).
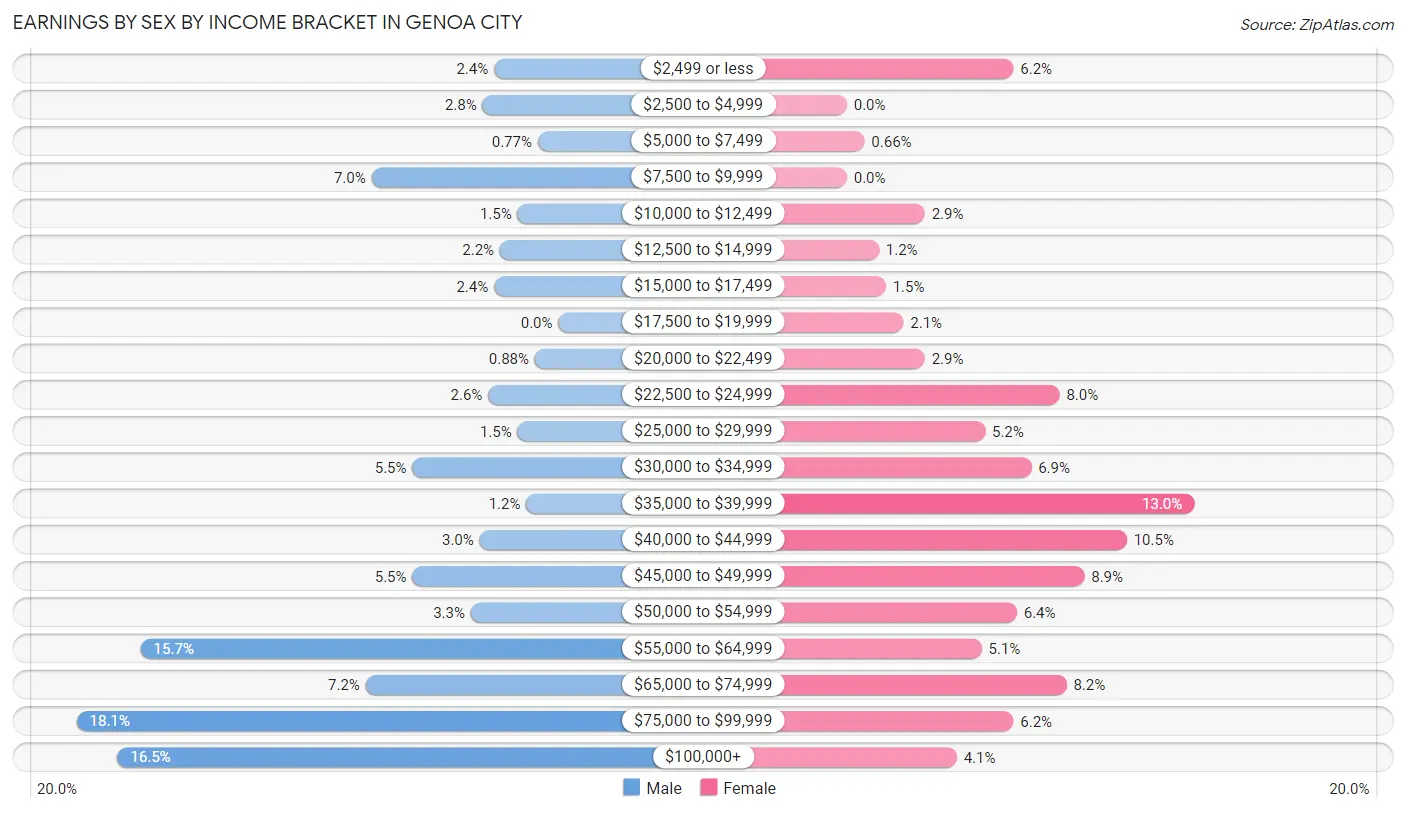
| Income | Male | Female |
| $2,499 or less | 22 (2.4%) | 47 (6.2%) |
| $2,500 to $4,999 | 26 (2.8%) | 0 (0.0%) |
| $5,000 to $7,499 | 7 (0.8%) | 5 (0.7%) |
| $7,500 to $9,999 | 64 (7.0%) | 0 (0.0%) |
| $10,000 to $12,499 | 14 (1.5%) | 22 (2.9%) |
| $12,500 to $14,999 | 20 (2.2%) | 9 (1.2%) |
| $15,000 to $17,499 | 22 (2.4%) | 11 (1.5%) |
| $17,500 to $19,999 | 0 (0.0%) | 16 (2.1%) |
| $20,000 to $22,499 | 8 (0.9%) | 22 (2.9%) |
| $22,500 to $24,999 | 24 (2.6%) | 60 (8.0%) |
| $25,000 to $29,999 | 14 (1.5%) | 39 (5.2%) |
| $30,000 to $34,999 | 50 (5.5%) | 52 (6.9%) |
| $35,000 to $39,999 | 11 (1.2%) | 98 (13.0%) |
| $40,000 to $44,999 | 27 (2.9%) | 79 (10.5%) |
| $45,000 to $49,999 | 50 (5.5%) | 67 (8.9%) |
| $50,000 to $54,999 | 30 (3.3%) | 48 (6.4%) |
| $55,000 to $64,999 | 143 (15.7%) | 38 (5.1%) |
| $65,000 to $74,999 | 66 (7.2%) | 62 (8.2%) |
| $75,000 to $99,999 | 165 (18.0%) | 47 (6.2%) |
| $100,000+ | 151 (16.5%) | 31 (4.1%) |
| Total | 914 (100.0%) | 753 (100.0%) |
Earnings by Sex by Educational Attainment in Genoa City
Average earnings in Genoa City are $62,228 for men and $40,735 for women, a difference of 34.5%. Men with an educational attainment of less than high school enjoy the highest average annual earnings of $115,399, while those with high school diploma education earn the least with $56,042. Women with an educational attainment of bachelor's degree earn the most with the average annual earnings of $61,071, while those with high school diploma education have the smallest earnings of $29,276.
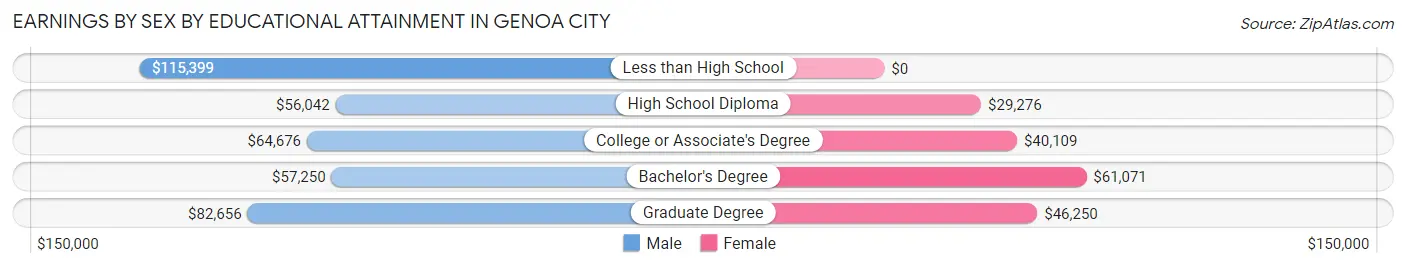
| Educational Attainment | Male Income | Female Income |
| Less than High School | $115,399 | $0 |
| High School Diploma | $56,042 | $29,276 |
| College or Associate's Degree | $64,676 | $40,109 |
| Bachelor's Degree | $57,250 | $61,071 |
| Graduate Degree | $82,656 | $46,250 |
| Total | $62,228 | $40,735 |
Family Income in Genoa City
Family Income Brackets in Genoa City
According to the Genoa City family income data, there are 206 families falling into the $100,000 to $149,999 income range, which is the most common income bracket and makes up 25.2% of all families. Conversely, the $10,000 to $14,999 income bracket is the least frequent group with only 8 families (1.0%) belonging to this category.
| Income Bracket | # Families | % Families |
| Less than $10,000 | 9 | 1.1% |
| $10,000 to $14,999 | 8 | 1.0% |
| $15,000 to $24,999 | 15 | 1.8% |
| $25,000 to $34,999 | 10 | 1.2% |
| $35,000 to $49,999 | 104 | 12.7% |
| $50,000 to $74,999 | 140 | 17.1% |
| $75,000 to $99,999 | 184 | 22.5% |
| $100,000 to $149,999 | 206 | 25.2% |
| $150,000 to $199,999 | 110 | 13.4% |
| $200,000+ | 32 | 3.9% |
Family Income by Famaliy Size in Genoa City
5-person families (38 | 4.6%) account for the highest median family income in Genoa City with $118,750 per family, while 2-person families (378 | 46.2%) have the highest median income of $41,597 per family member.
| Income Bracket | # Families | Median Income |
| 2-Person Families | 378 (46.2%) | $83,194 |
| 3-Person Families | 133 (16.3%) | $80,893 |
| 4-Person Families | 183 (22.4%) | $90,156 |
| 5-Person Families | 38 (4.6%) | $118,750 |
| 6-Person Families | 30 (3.7%) | $76,705 |
| 7+ Person Families | 56 (6.9%) | $0 |
| Total | 818 (100.0%) | $88,095 |
Family Income by Number of Earners in Genoa City
| Number of Earners | # Families | Median Income |
| No Earners | 58 (7.1%) | $42,143 |
| 1 Earner | 257 (31.4%) | $60,515 |
| 2 Earners | 457 (55.9%) | $110,329 |
| 3+ Earners | 46 (5.6%) | $0 |
| Total | 818 (100.0%) | $88,095 |
Household Income in Genoa City
Household Income Brackets in Genoa City
With 250 households falling in the category, the $100,000 to $149,999 income range is the most frequent in Genoa City, accounting for 22.5% of all households. In contrast, only 8 households (0.7%) fall into the $10,000 to $14,999 income bracket, making it the least populous group.
| Income Bracket | # Households | % Households |
| Less than $10,000 | 87 | 7.8% |
| $10,000 to $14,999 | 8 | 0.7% |
| $15,000 to $24,999 | 35 | 3.2% |
| $25,000 to $34,999 | 29 | 2.6% |
| $35,000 to $49,999 | 129 | 11.6% |
| $50,000 to $74,999 | 189 | 17.0% |
| $75,000 to $99,999 | 218 | 19.7% |
| $100,000 to $149,999 | 250 | 22.5% |
| $150,000 to $199,999 | 133 | 12.0% |
| $200,000+ | 32 | 2.9% |
Household Income by Householder Age in Genoa City
The median household income in Genoa City is $82,063, with the highest median household income of $87,969 found in the 25 to 44 years age bracket for the primary householder. A total of 525 households (47.3%) fall into this category. Meanwhile, the 15 to 24 years age bracket for the primary householder has the lowest median household income of $0, with 15 households (1.3%) in this group.
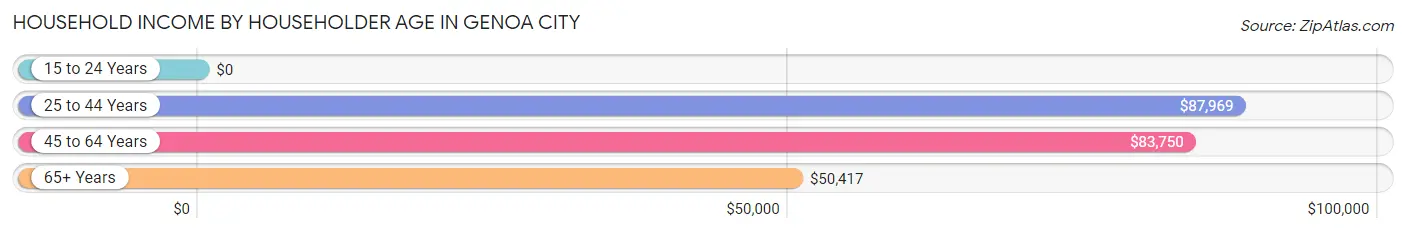
| Income Bracket | # Households | Median Income |
| 15 to 24 Years | 15 (1.3%) | $0 |
| 25 to 44 Years | 525 (47.3%) | $87,969 |
| 45 to 64 Years | 403 (36.3%) | $83,750 |
| 65+ Years | 166 (15.0%) | $50,417 |
| Total | 1,109 (100.0%) | $82,063 |
Poverty in Genoa City
Income Below Poverty by Sex and Age in Genoa City
With 7.3% poverty level for males and 5.3% for females among the residents of Genoa City, 15 year old males and under 5 year old females are the most vulnerable to poverty, with 9 males (69.2%) and 17 females (16.2%) in their respective age groups living below the poverty level.
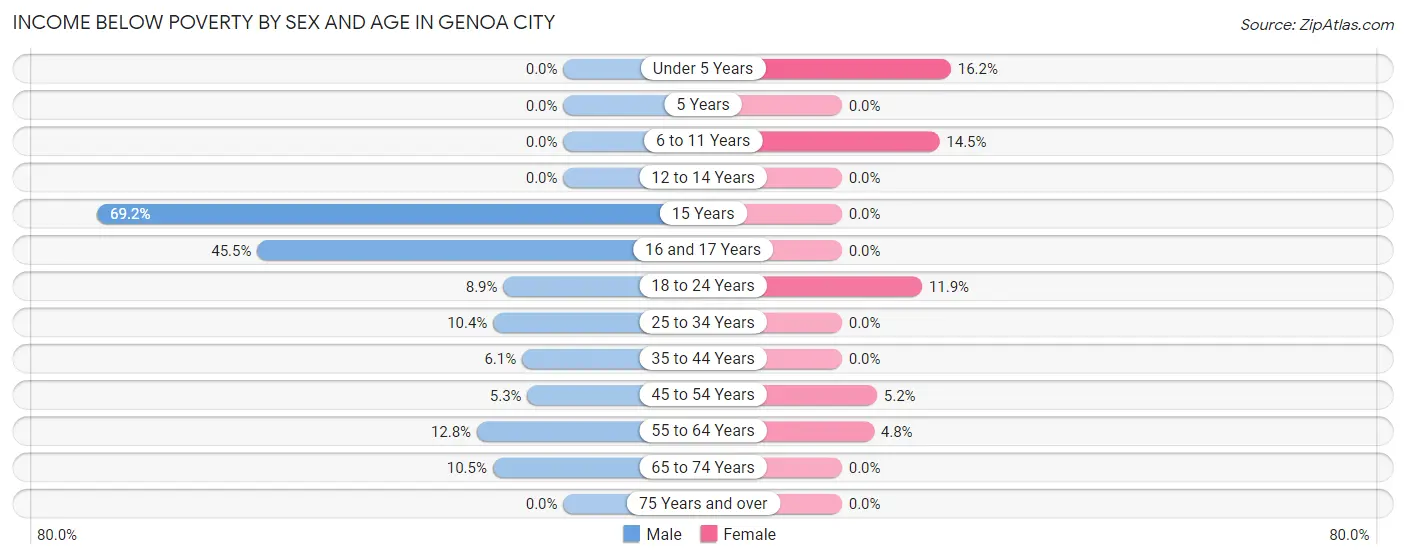
| Age Bracket | Male | Female |
| Under 5 Years | 0 (0.0%) | 17 (16.2%) |
| 5 Years | 0 (0.0%) | 0 (0.0%) |
| 6 to 11 Years | 0 (0.0%) | 30 (14.5%) |
| 12 to 14 Years | 0 (0.0%) | 0 (0.0%) |
| 15 Years | 9 (69.2%) | 0 (0.0%) |
| 16 and 17 Years | 10 (45.5%) | 0 (0.0%) |
| 18 to 24 Years | 9 (8.9%) | 10 (11.9%) |
| 25 to 34 Years | 27 (10.4%) | 0 (0.0%) |
| 35 to 44 Years | 16 (6.1%) | 0 (0.0%) |
| 45 to 54 Years | 8 (5.3%) | 10 (5.2%) |
| 55 to 64 Years | 24 (12.8%) | 7 (4.8%) |
| 65 to 74 Years | 11 (10.5%) | 0 (0.0%) |
| 75 Years and over | 0 (0.0%) | 0 (0.0%) |
| Total | 114 (7.3%) | 74 (5.3%) |
Income Above Poverty by Sex and Age in Genoa City
According to the poverty statistics in Genoa City, males aged under 5 years and females aged 12 to 14 years are the age groups that are most secure financially, with 100.0% of males and 100.0% of females in these age groups living above the poverty line.
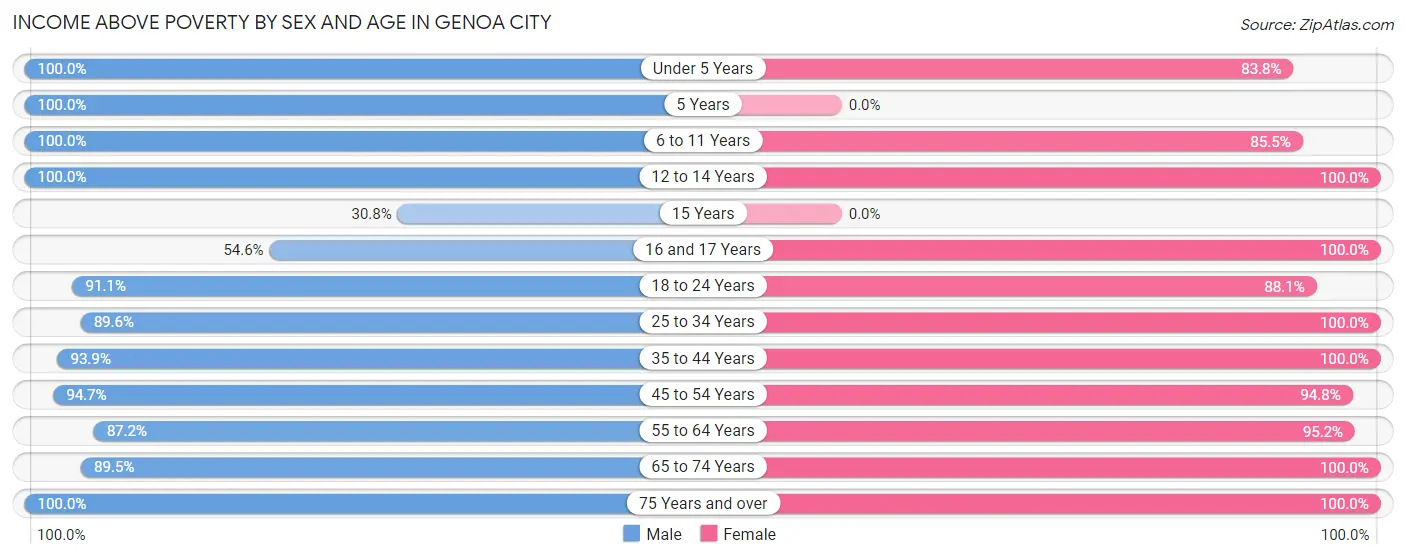
| Age Bracket | Male | Female |
| Under 5 Years | 100 (100.0%) | 88 (83.8%) |
| 5 Years | 12 (100.0%) | 0 (0.0%) |
| 6 to 11 Years | 204 (100.0%) | 177 (85.5%) |
| 12 to 14 Years | 139 (100.0%) | 42 (100.0%) |
| 15 Years | 4 (30.8%) | 0 (0.0%) |
| 16 and 17 Years | 12 (54.5%) | 22 (100.0%) |
| 18 to 24 Years | 92 (91.1%) | 74 (88.1%) |
| 25 to 34 Years | 232 (89.6%) | 228 (100.0%) |
| 35 to 44 Years | 245 (93.9%) | 189 (100.0%) |
| 45 to 54 Years | 142 (94.7%) | 182 (94.8%) |
| 55 to 64 Years | 163 (87.2%) | 140 (95.2%) |
| 65 to 74 Years | 94 (89.5%) | 104 (100.0%) |
| 75 Years and over | 12 (100.0%) | 66 (100.0%) |
| Total | 1,451 (92.7%) | 1,312 (94.7%) |
Income Below Poverty Among Married-Couple Families in Genoa City
The poverty statistics for married-couple families in Genoa City show that 3.0% or 19 of the total 635 families live below the poverty line. Families with 1 or 2 children have the highest poverty rate of 8.3%, comprising of 19 families. On the other hand, families with no children have the lowest poverty rate of 0.0%, which includes 0 families.
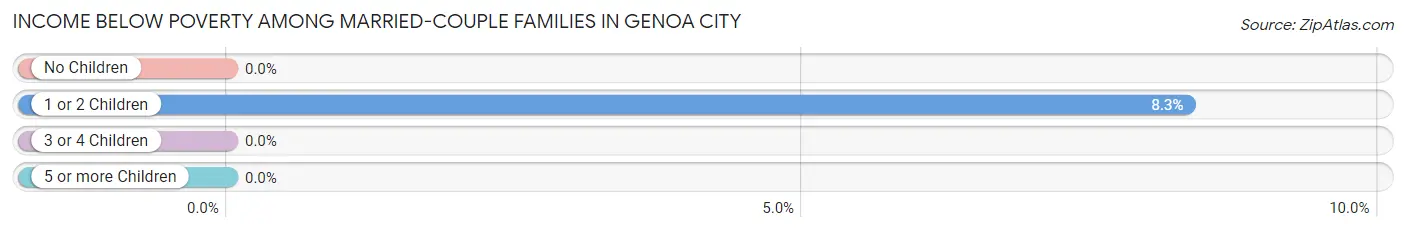
| Children | Above Poverty | Below Poverty |
| No Children | 298 (100.0%) | 0 (0.0%) |
| 1 or 2 Children | 209 (91.7%) | 19 (8.3%) |
| 3 or 4 Children | 109 (100.0%) | 0 (0.0%) |
| 5 or more Children | 0 (0.0%) | 0 (0.0%) |
| Total | 616 (97.0%) | 19 (3.0%) |
Income Below Poverty Among Single-Parent Households in Genoa City
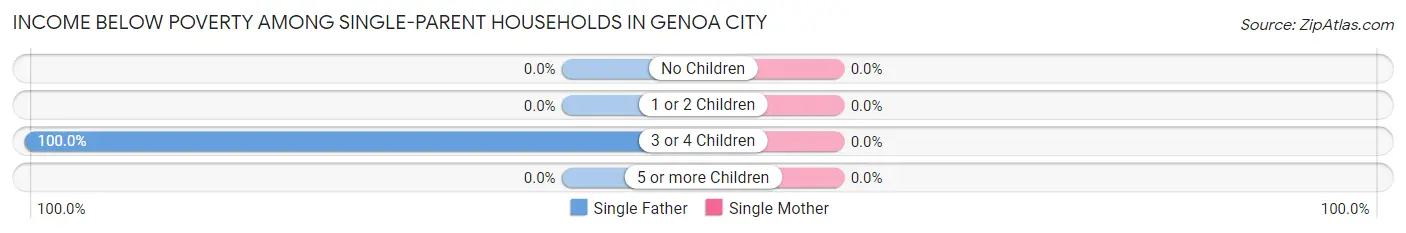
| Children | Single Father | Single Mother |
| No Children | 0 (0.0%) | 0 (0.0%) |
| 1 or 2 Children | 0 (0.0%) | 0 (0.0%) |
| 3 or 4 Children | 8 (100.0%) | 0 (0.0%) |
| 5 or more Children | 0 (0.0%) | 0 (0.0%) |
| Total | 8 (9.0%) | 0 (0.0%) |
Income Below Poverty Among Married-Couple vs Single-Parent Households in Genoa City
The poverty data for Genoa City shows that 19 of the married-couple family households (3.0%) and 8 of the single-parent households (4.4%) are living below the poverty level. Within the married-couple family households, those with 1 or 2 children have the highest poverty rate, with 19 households (8.3%) falling below the poverty line. Among the single-parent households, those with 3 or 4 children have the highest poverty rate, with 8 household (100.0%) living below poverty.
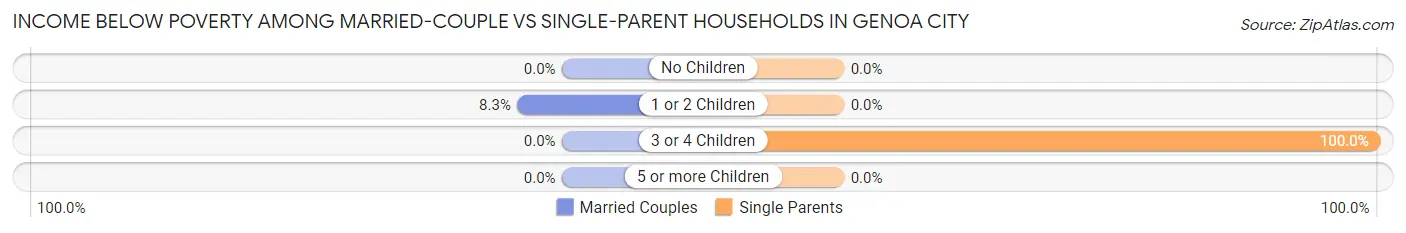
| Children | Married-Couple Families | Single-Parent Households |
| No Children | 0 (0.0%) | 0 (0.0%) |
| 1 or 2 Children | 19 (8.3%) | 0 (0.0%) |
| 3 or 4 Children | 0 (0.0%) | 8 (100.0%) |
| 5 or more Children | 0 (0.0%) | 0 (0.0%) |
| Total | 19 (3.0%) | 8 (4.4%) |
Race in Genoa City
The most populous races in Genoa City are White / Caucasian (2,565 | 86.2%), Two or more Races (360 | 12.1%), and Hispanic or Latino (338 | 11.4%).
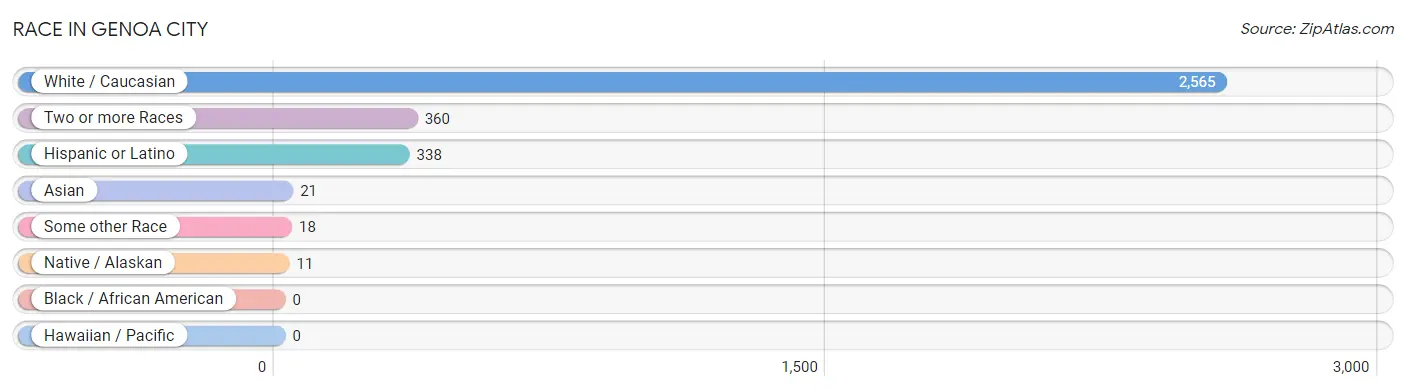
| Race | # Population | % Population |
| Asian | 21 | 0.7% |
| Black / African American | 0 | 0.0% |
| Hawaiian / Pacific | 0 | 0.0% |
| Hispanic or Latino | 338 | 11.4% |
| Native / Alaskan | 11 | 0.4% |
| White / Caucasian | 2,565 | 86.2% |
| Two or more Races | 360 | 12.1% |
| Some other Race | 18 | 0.6% |
| Total | 2,975 | 100.0% |
Ancestry in Genoa City
The most populous ancestries reported in Genoa City are German (1,048 | 35.2%), Irish (599 | 20.1%), Polish (338 | 11.4%), Mexican (311 | 10.4%), and English (179 | 6.0%), together accounting for 83.2% of all Genoa City residents.
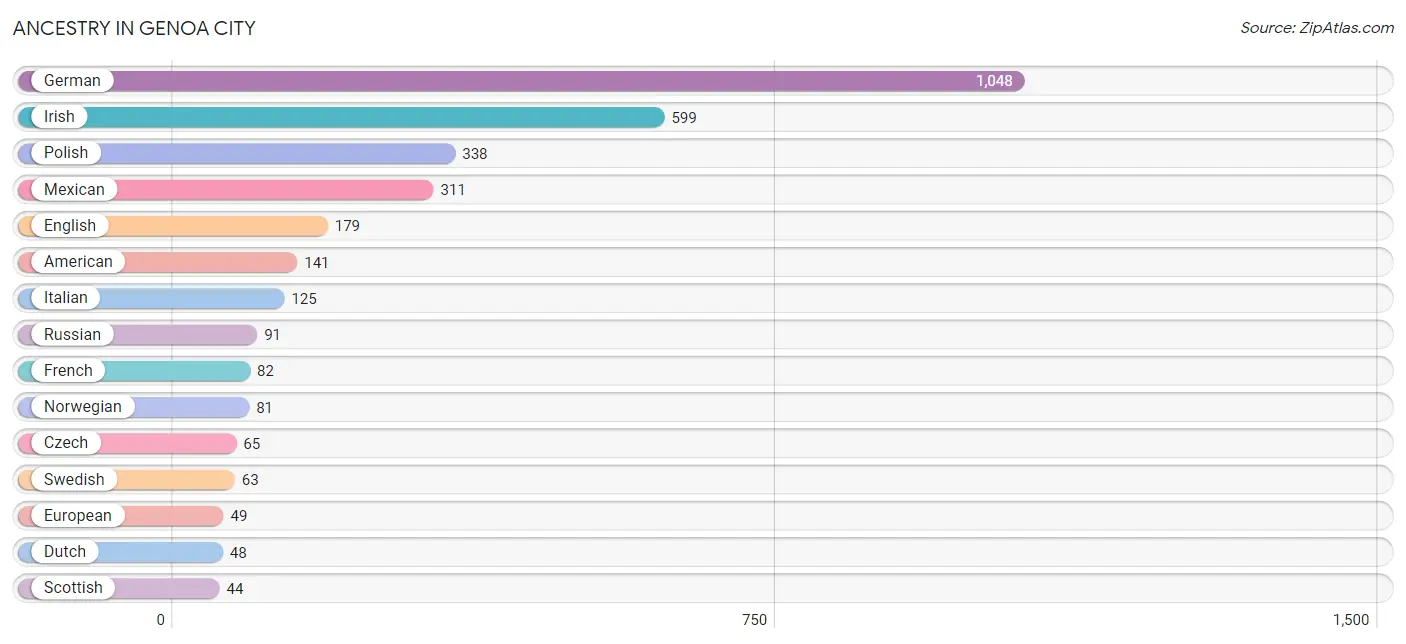
| Ancestry | # Population | % Population |
| American | 141 | 4.7% |
| Austrian | 5 | 0.2% |
| Burmese | 42 | 1.4% |
| Central American | 4 | 0.1% |
| Chickasaw | 41 | 1.4% |
| Czech | 65 | 2.2% |
| Czechoslovakian | 5 | 0.2% |
| Dutch | 48 | 1.6% |
| Eastern European | 19 | 0.6% |
| English | 179 | 6.0% |
| European | 49 | 1.7% |
| French | 82 | 2.8% |
| French Canadian | 6 | 0.2% |
| German | 1,048 | 35.2% |
| Greek | 19 | 0.6% |
| Hungarian | 26 | 0.9% |
| Irish | 599 | 20.1% |
| Italian | 125 | 4.2% |
| Korean | 20 | 0.7% |
| Lithuanian | 16 | 0.5% |
| Mexican | 311 | 10.4% |
| Navajo | 11 | 0.4% |
| Norwegian | 81 | 2.7% |
| Peruvian | 1 | 0.0% |
| Polish | 338 | 11.4% |
| Portuguese | 12 | 0.4% |
| Puerto Rican | 22 | 0.7% |
| Russian | 91 | 3.1% |
| Salvadoran | 4 | 0.1% |
| Scandinavian | 14 | 0.5% |
| Scotch-Irish | 16 | 0.5% |
| Scottish | 44 | 1.5% |
| Slovene | 8 | 0.3% |
| South American | 1 | 0.0% |
| Swedish | 63 | 2.1% |
| Ukrainian | 18 | 0.6% |
| Welsh | 7 | 0.2% | View All 37 Rows |
Immigrants in Genoa City
The most numerous immigrant groups reported in Genoa City came from Central America (139 | 4.7%), Latin America (139 | 4.7%), Mexico (139 | 4.7%), Europe (30 | 1.0%), and Asia (21 | 0.7%), together accounting for 15.7% of all Genoa City residents.
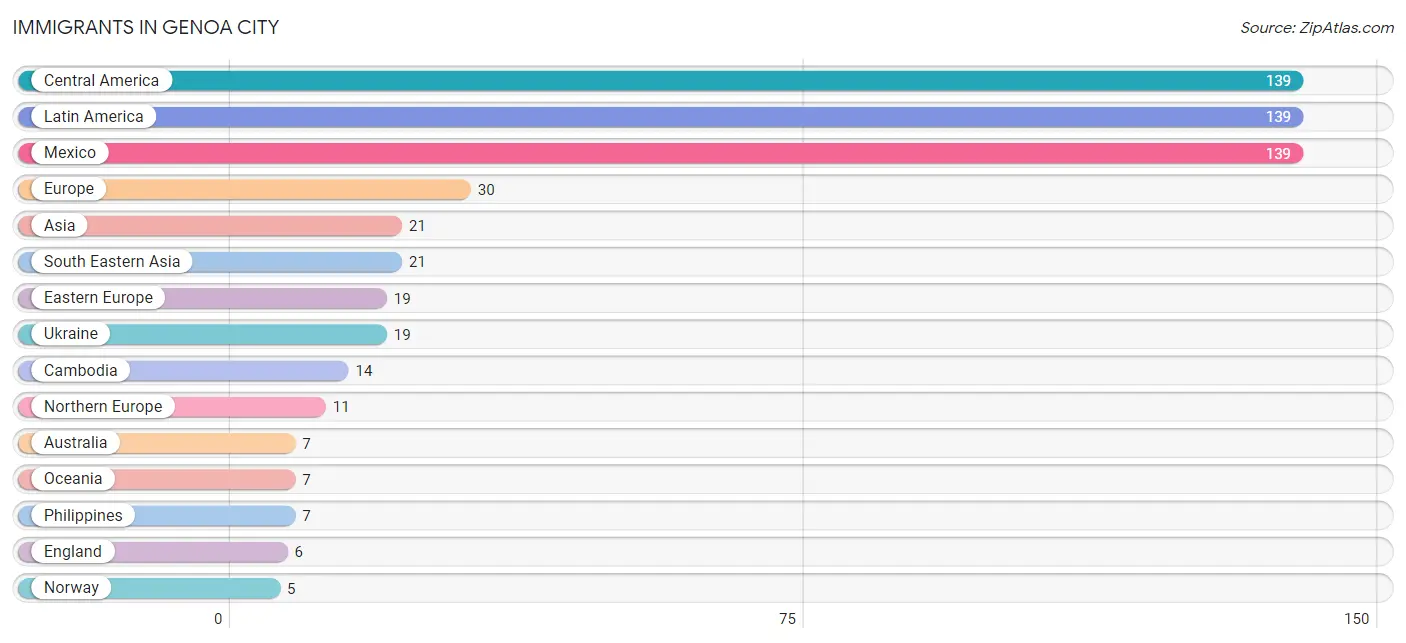
| Immigration Origin | # Population | % Population |
| Asia | 21 | 0.7% |
| Australia | 7 | 0.2% |
| Cambodia | 14 | 0.5% |
| Central America | 139 | 4.7% |
| Eastern Europe | 19 | 0.6% |
| England | 6 | 0.2% |
| Europe | 30 | 1.0% |
| Latin America | 139 | 4.7% |
| Mexico | 139 | 4.7% |
| Northern Europe | 11 | 0.4% |
| Norway | 5 | 0.2% |
| Oceania | 7 | 0.2% |
| Philippines | 7 | 0.2% |
| South Eastern Asia | 21 | 0.7% |
| Ukraine | 19 | 0.6% | View All 15 Rows |
Sex and Age in Genoa City
Sex and Age in Genoa City
The most populous age groups in Genoa City are 10 to 14 Years (210 | 13.4%) for men and 30 to 34 Years (164 | 11.7%) for women.
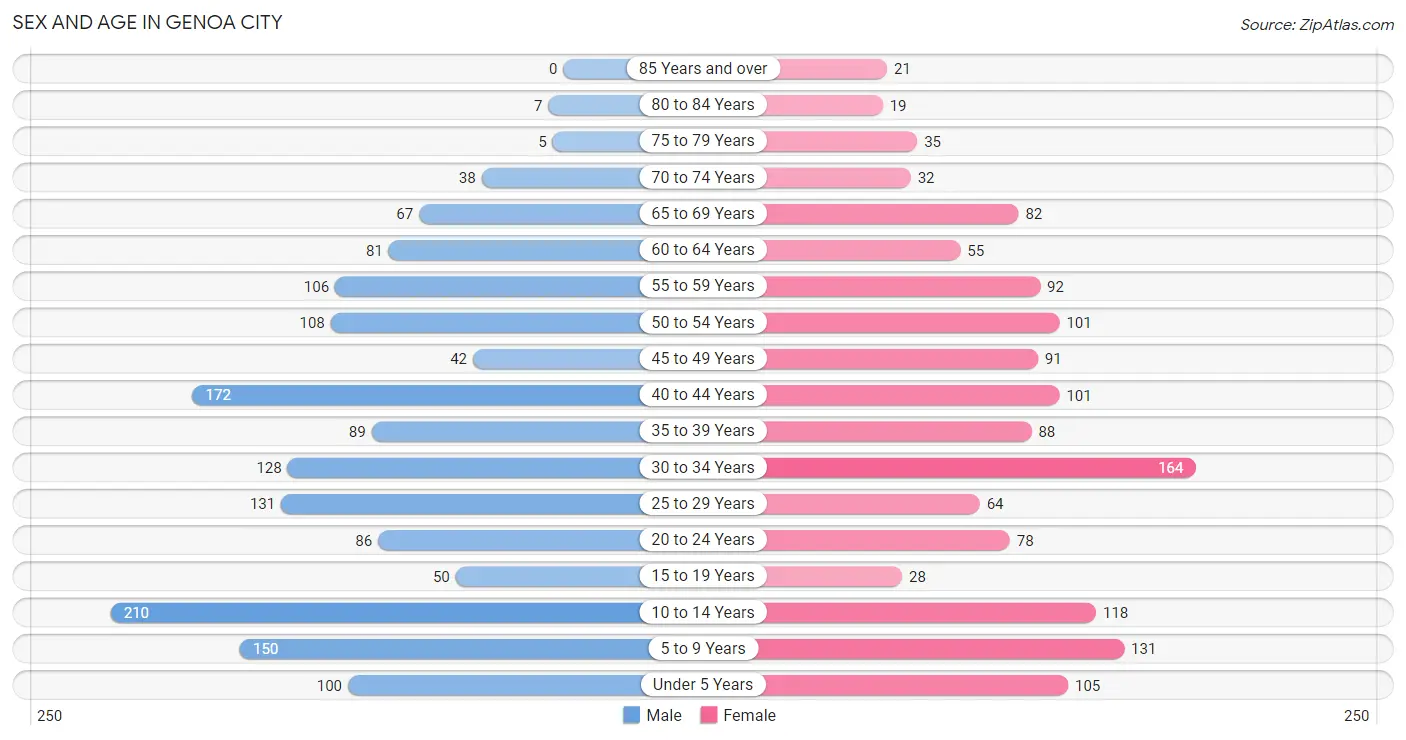
| Age Bracket | Male | Female |
| Under 5 Years | 100 (6.4%) | 105 (7.5%) |
| 5 to 9 Years | 150 (9.6%) | 131 (9.3%) |
| 10 to 14 Years | 210 (13.4%) | 118 (8.4%) |
| 15 to 19 Years | 50 (3.2%) | 28 (2.0%) |
| 20 to 24 Years | 86 (5.5%) | 78 (5.6%) |
| 25 to 29 Years | 131 (8.3%) | 64 (4.6%) |
| 30 to 34 Years | 128 (8.2%) | 164 (11.7%) |
| 35 to 39 Years | 89 (5.7%) | 88 (6.3%) |
| 40 to 44 Years | 172 (11.0%) | 101 (7.2%) |
| 45 to 49 Years | 42 (2.7%) | 91 (6.5%) |
| 50 to 54 Years | 108 (6.9%) | 101 (7.2%) |
| 55 to 59 Years | 106 (6.8%) | 92 (6.6%) |
| 60 to 64 Years | 81 (5.2%) | 55 (3.9%) |
| 65 to 69 Years | 67 (4.3%) | 82 (5.8%) |
| 70 to 74 Years | 38 (2.4%) | 32 (2.3%) |
| 75 to 79 Years | 5 (0.3%) | 35 (2.5%) |
| 80 to 84 Years | 7 (0.4%) | 19 (1.3%) |
| 85 Years and over | 0 (0.0%) | 21 (1.5%) |
| Total | 1,570 (100.0%) | 1,405 (100.0%) |
Families and Households in Genoa City
Median Family Size in Genoa City
The median family size in Genoa City is 3.14 persons per family, with married-couple families (635 | 77.6%) accounting for the largest median family size of 3.32 persons per family. On the other hand, single female/mother families (94 | 11.5%) represent the smallest median family size with 2.38 persons per family.
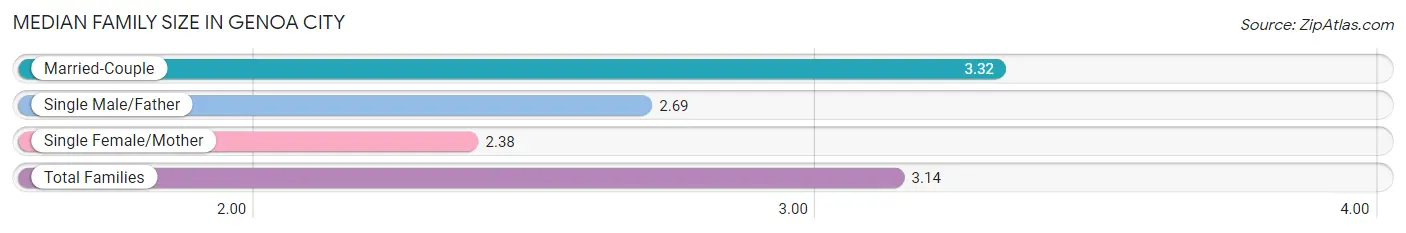
| Family Type | # Families | Family Size |
| Married-Couple | 635 (77.6%) | 3.32 |
| Single Male/Father | 89 (10.9%) | 2.69 |
| Single Female/Mother | 94 (11.5%) | 2.38 |
| Total Families | 818 (100.0%) | 3.14 |
Median Household Size in Genoa City
The median household size in Genoa City is 2.65 persons per household, with married-couple households (635 | 57.3%) accounting for the largest median household size of 3.34 persons per household. non-family households (291 | 26.2%) represent the smallest median household size with 1.13 persons per household.
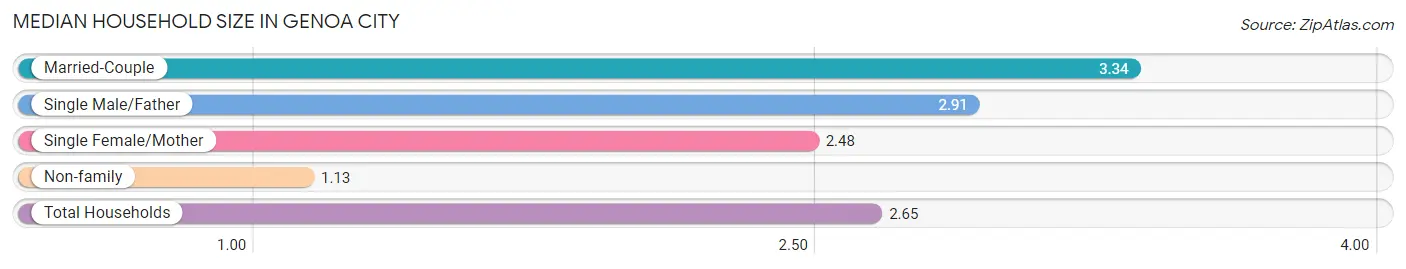
| Household Type | # Households | Household Size |
| Married-Couple | 635 (57.3%) | 3.34 |
| Single Male/Father | 89 (8.0%) | 2.91 |
| Single Female/Mother | 94 (8.5%) | 2.48 |
| Non-family | 291 (26.2%) | 1.13 |
| Total Households | 1,109 (100.0%) | 2.65 |
Household Size by Marriage Status in Genoa City
Out of a total of 1,109 households in Genoa City, 818 (73.8%) are family households, while 291 (26.2%) are nonfamily households. The most numerous type of family households are 2-person households, comprising 339, and the most common type of nonfamily households are 1-person households, comprising 251.
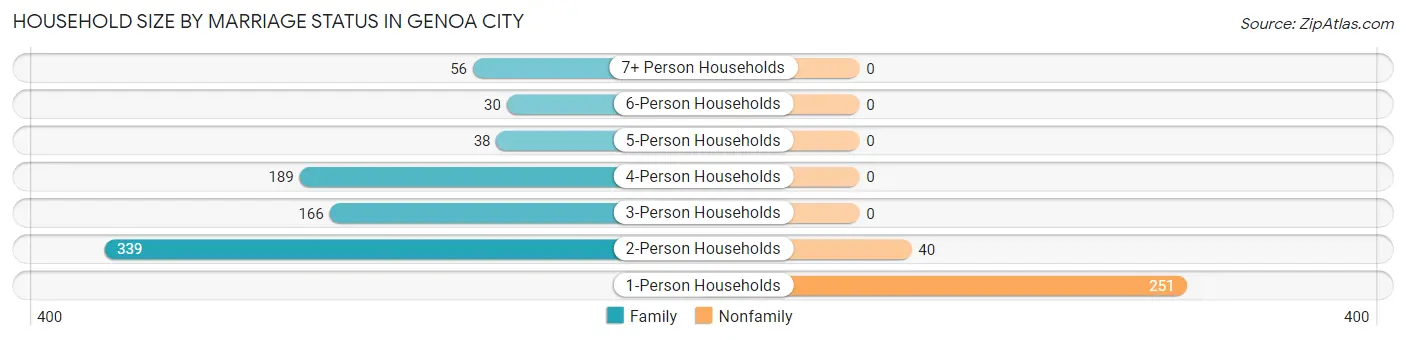
| Household Size | Family Households | Nonfamily Households |
| 1-Person Households | - | 251 (22.6%) |
| 2-Person Households | 339 (30.6%) | 40 (3.6%) |
| 3-Person Households | 166 (15.0%) | 0 (0.0%) |
| 4-Person Households | 189 (17.0%) | 0 (0.0%) |
| 5-Person Households | 38 (3.4%) | 0 (0.0%) |
| 6-Person Households | 30 (2.7%) | 0 (0.0%) |
| 7+ Person Households | 56 (5.1%) | 0 (0.0%) |
| Total | 818 (73.8%) | 291 (26.2%) |
Female Fertility in Genoa City
Fertility by Age in Genoa City
Average fertility rate in Genoa City is 96.0 births per 1,000 women. Women in the age bracket of 20 to 34 years have the highest fertility rate with 196.0 births per 1,000 women. Women in the age bracket of 20 to 34 years acount for 100.0% of all women with births.
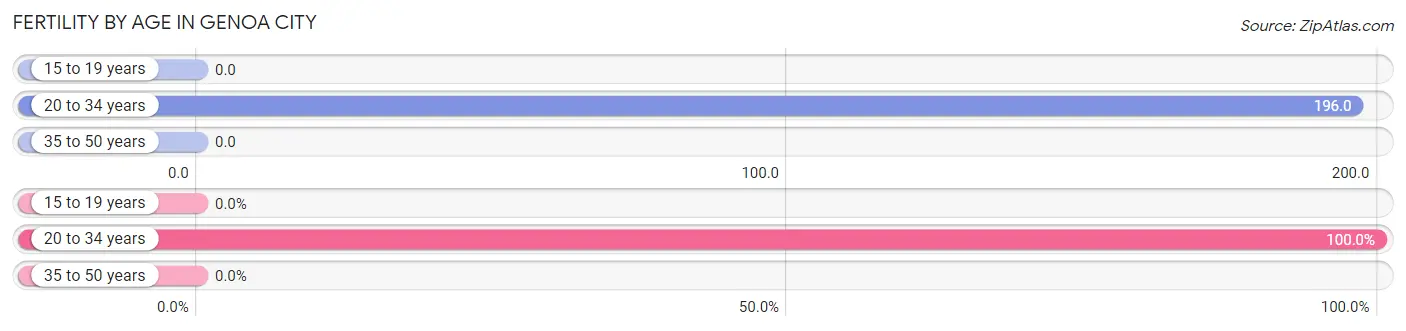
| Age Bracket | Women with Births | Births / 1,000 Women |
| 15 to 19 years | 0 (0.0%) | 0.0 |
| 20 to 34 years | 60 (100.0%) | 196.0 |
| 35 to 50 years | 0 (0.0%) | 0.0 |
| Total | 60 (100.0%) | 96.0 |
Fertility by Age by Marriage Status in Genoa City
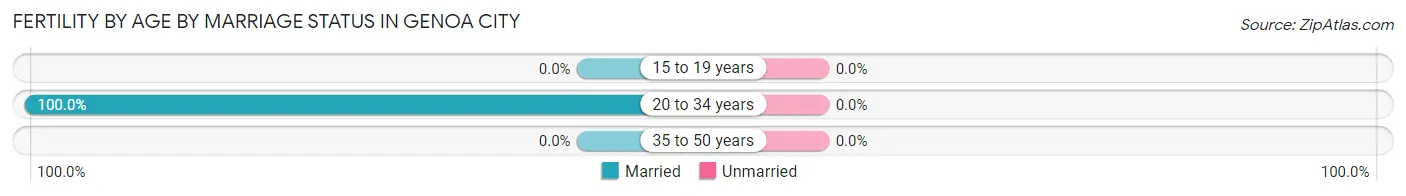
| Age Bracket | Married | Unmarried |
| 15 to 19 years | 0 (0.0%) | 0 (0.0%) |
| 20 to 34 years | 60 (100.0%) | 0 (0.0%) |
| 35 to 50 years | 0 (0.0%) | 0 (0.0%) |
| Total | 60 (100.0%) | 0 (0.0%) |
Fertility by Education in Genoa City
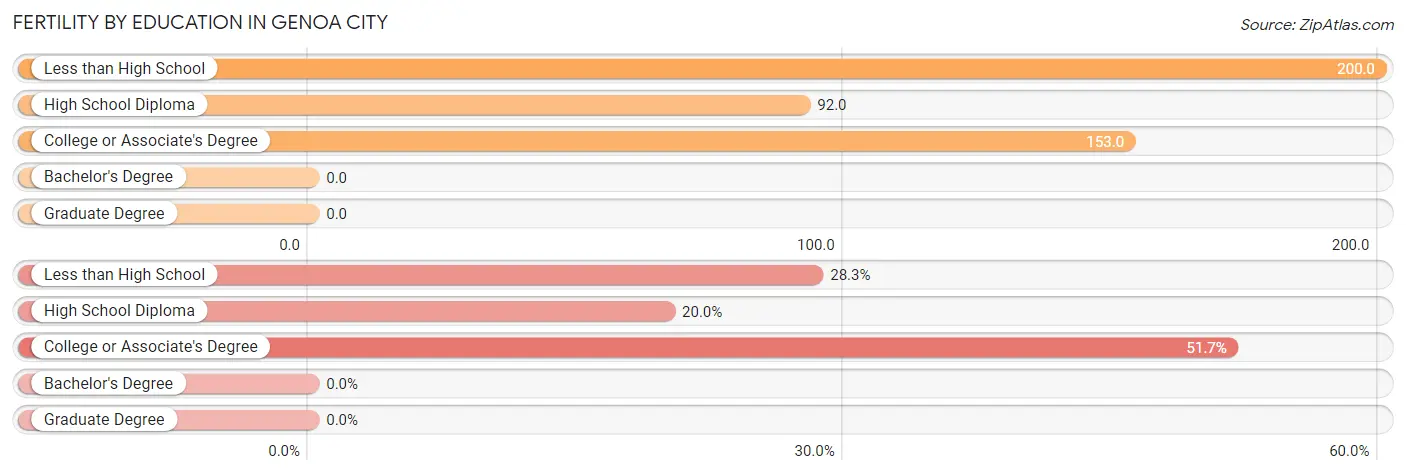
| Educational Attainment | Women with Births | Births / 1,000 Women |
| Less than High School | 17 (28.3%) | 200.0 |
| High School Diploma | 12 (20.0%) | 92.0 |
| College or Associate's Degree | 31 (51.7%) | 153.0 |
| Bachelor's Degree | 0 (0.0%) | 0.0 |
| Graduate Degree | 0 (0.0%) | 0.0 |
| Total | 60 (100.0%) | 96.0 |
Fertility by Education by Marriage Status in Genoa City
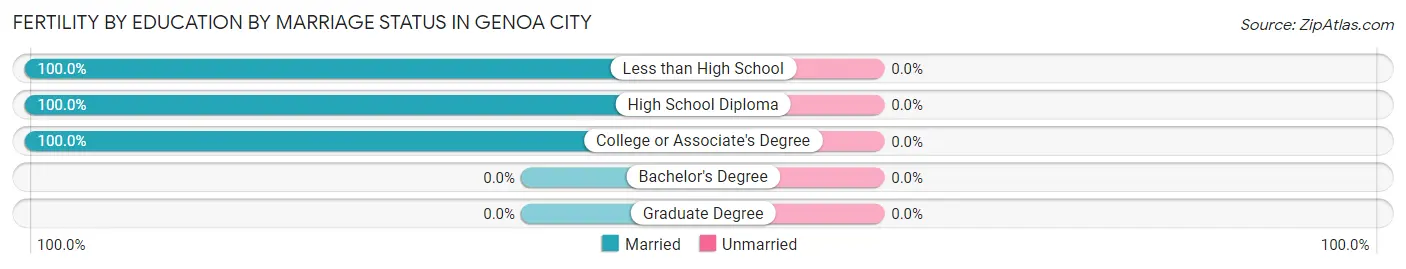
| Educational Attainment | Married | Unmarried |
| Less than High School | 17 (100.0%) | 0 (0.0%) |
| High School Diploma | 12 (100.0%) | 0 (0.0%) |
| College or Associate's Degree | 31 (100.0%) | 0 (0.0%) |
| Bachelor's Degree | 0 (0.0%) | 0 (0.0%) |
| Graduate Degree | 0 (0.0%) | 0 (0.0%) |
| Total | 60 (100.0%) | 0 (0.0%) |
Employment Characteristics in Genoa City
Employment by Class of Employer in Genoa City
Among the 1,546 employed individuals in Genoa City, private company employees (1,120 | 72.5%), local government employees (178 | 11.5%), and self-employed (not incorporated) (76 | 4.9%) make up the most common classes of employment.
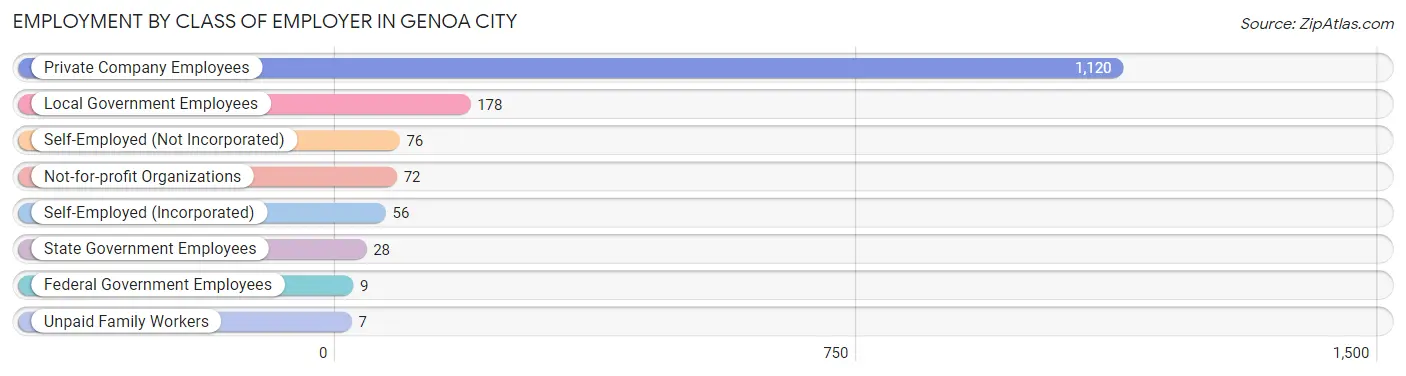
| Employer Class | # Employees | % Employees |
| Private Company Employees | 1,120 | 72.5% |
| Self-Employed (Incorporated) | 56 | 3.6% |
| Self-Employed (Not Incorporated) | 76 | 4.9% |
| Not-for-profit Organizations | 72 | 4.7% |
| Local Government Employees | 178 | 11.5% |
| State Government Employees | 28 | 1.8% |
| Federal Government Employees | 9 | 0.6% |
| Unpaid Family Workers | 7 | 0.4% |
| Total | 1,546 | 100.0% |
Employment Status by Age in Genoa City
According to the labor force statistics for Genoa City, out of the total population over 16 years of age (2,148), 77.4% or 1,663 individuals are in the labor force, with 4.9% or 81 of them unemployed. The age group with the highest labor force participation rate is 30 to 34 years, with 97.6% or 285 individuals in the labor force. Within the labor force, the 20 to 24 years age range has the highest percentage of unemployed individuals, with 17.7% or 20 of them being unemployed.
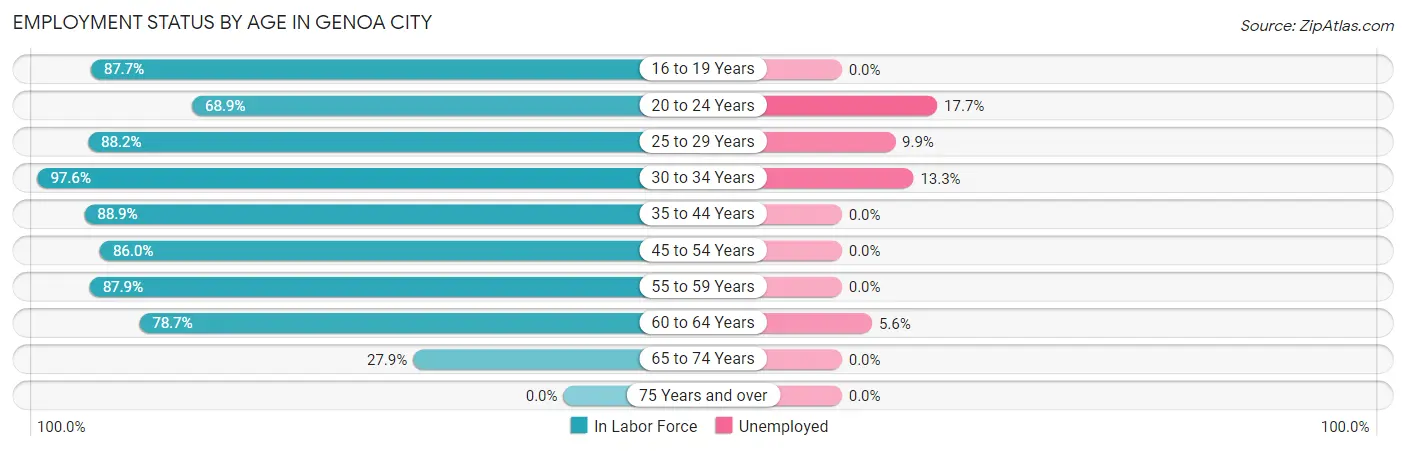
| Age Bracket | In Labor Force | Unemployed |
| 16 to 19 Years | 57 (87.7%) | 0 (0.0%) |
| 20 to 24 Years | 113 (68.9%) | 20 (17.7%) |
| 25 to 29 Years | 172 (88.2%) | 17 (9.9%) |
| 30 to 34 Years | 285 (97.6%) | 38 (13.3%) |
| 35 to 44 Years | 400 (88.9%) | 0 (0.0%) |
| 45 to 54 Years | 294 (86.0%) | 0 (0.0%) |
| 55 to 59 Years | 174 (87.9%) | 0 (0.0%) |
| 60 to 64 Years | 107 (78.7%) | 6 (5.6%) |
| 65 to 74 Years | 61 (27.9%) | 0 (0.0%) |
| 75 Years and over | 0 (0.0%) | 0 (0.0%) |
| Total | 1,663 (77.4%) | 81 (4.9%) |
Employment Status by Educational Attainment in Genoa City
According to labor force statistics for Genoa City, 88.8% of individuals (1,432) out of the total population between 25 and 64 years of age (1,613) are in the labor force, with 4.3% or 62 of them being unemployed. The group with the highest labor force participation rate are those with the educational attainment of college / associate degree, with 95.3% or 512 individuals in the labor force. Within the labor force, individuals with less than high school education have the highest percentage of unemployment, with 35.2% or 43 of them being unemployed.
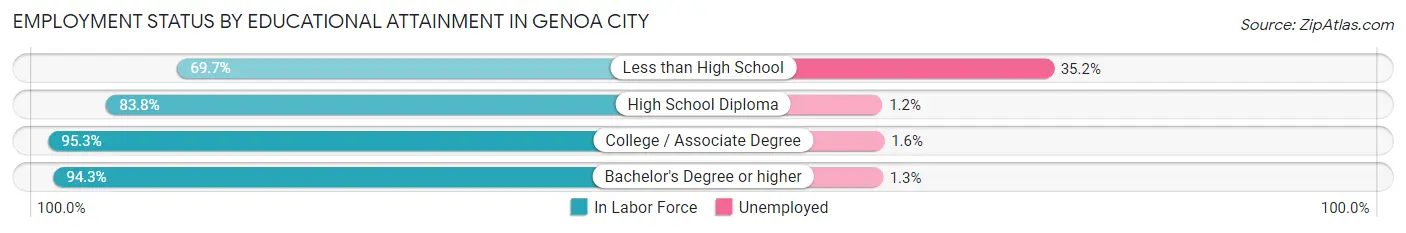
| Educational Attainment | In Labor Force | Unemployed |
| Less than High School | 122 (69.7%) | 62 (35.2%) |
| High School Diploma | 414 (83.8%) | 6 (1.2%) |
| College / Associate Degree | 512 (95.3%) | 9 (1.6%) |
| Bachelor's Degree or higher | 384 (94.3%) | 5 (1.3%) |
| Total | 1,432 (88.8%) | 69 (4.3%) |
Employment Occupations by Sex in Genoa City
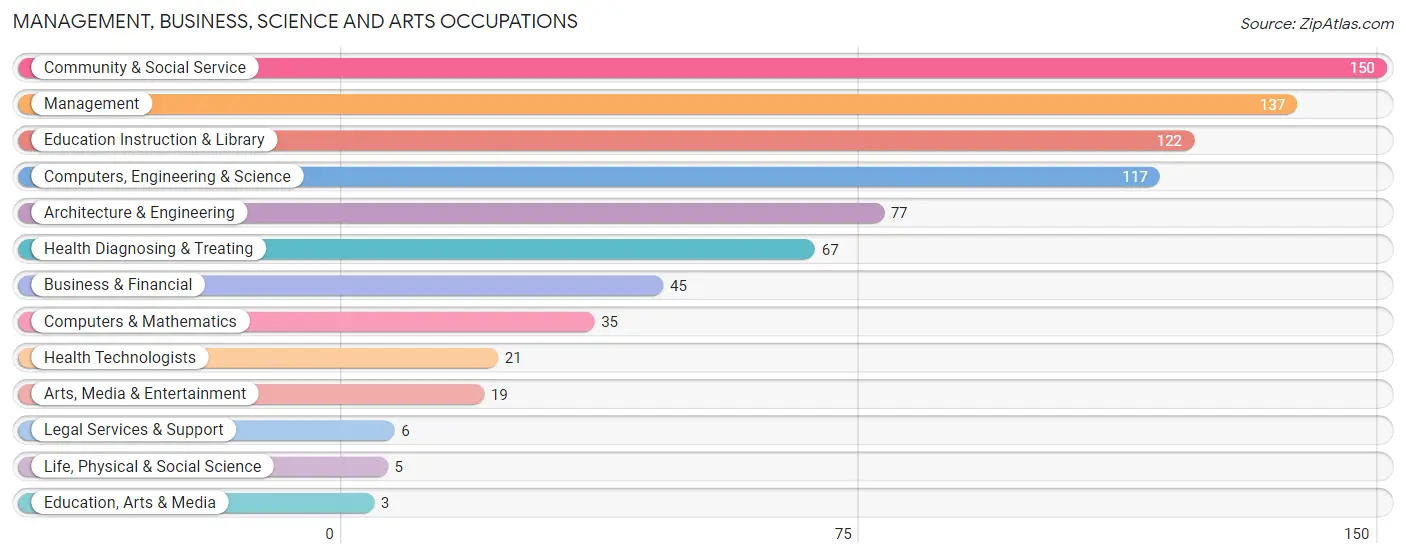
Management, Business, Science and Arts Occupations
The most common Management, Business, Science and Arts occupations in Genoa City are Community & Social Service (150 | 9.5%), Management (137 | 8.7%), Education Instruction & Library (122 | 7.7%), Computers, Engineering & Science (117 | 7.4%), and Architecture & Engineering (77 | 4.9%).
Management, Business, Science and Arts Occupations by Sex
Within the Management, Business, Science and Arts occupations in Genoa City, the most male-oriented occupations are Computers & Mathematics (80.0%), Architecture & Engineering (79.2%), and Computers, Engineering & Science (76.1%), while the most female-oriented occupations are Life, Physical & Social Science (100.0%), Education, Arts & Media (100.0%), and Legal Services & Support (100.0%).
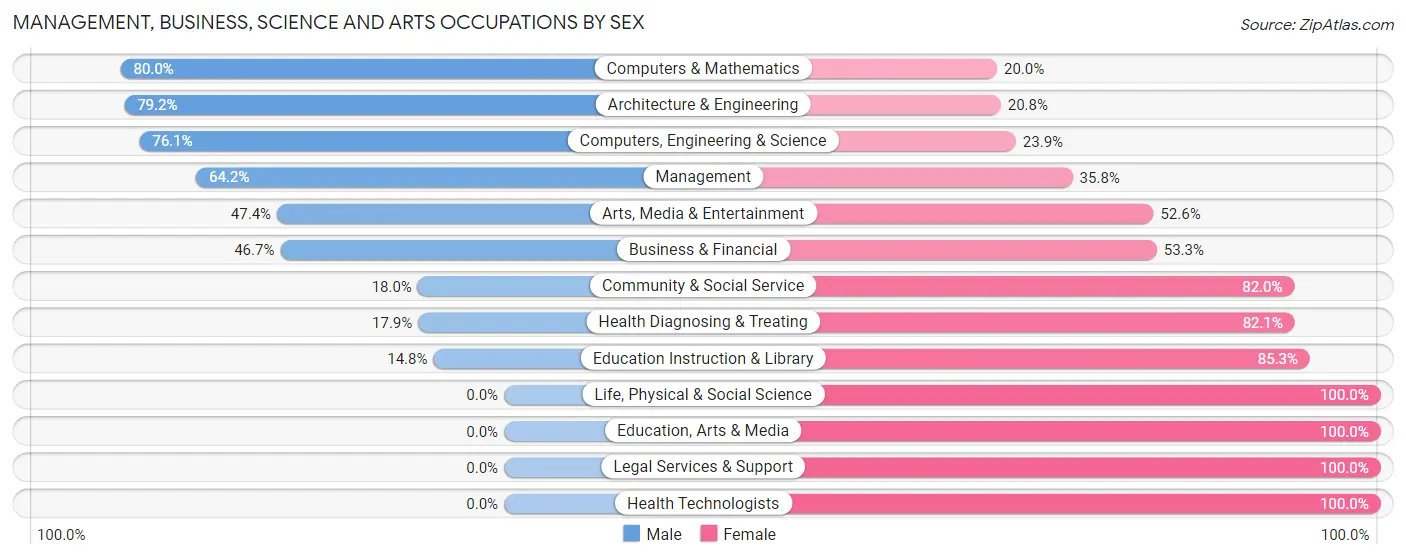
| Occupation | Male | Female |
| Management | 88 (64.2%) | 49 (35.8%) |
| Business & Financial | 21 (46.7%) | 24 (53.3%) |
| Computers, Engineering & Science | 89 (76.1%) | 28 (23.9%) |
| Computers & Mathematics | 28 (80.0%) | 7 (20.0%) |
| Architecture & Engineering | 61 (79.2%) | 16 (20.8%) |
| Life, Physical & Social Science | 0 (0.0%) | 5 (100.0%) |
| Community & Social Service | 27 (18.0%) | 123 (82.0%) |
| Education, Arts & Media | 0 (0.0%) | 3 (100.0%) |
| Legal Services & Support | 0 (0.0%) | 6 (100.0%) |
| Education Instruction & Library | 18 (14.7%) | 104 (85.3%) |
| Arts, Media & Entertainment | 9 (47.4%) | 10 (52.6%) |
| Health Diagnosing & Treating | 12 (17.9%) | 55 (82.1%) |
| Health Technologists | 0 (0.0%) | 21 (100.0%) |
| Total (Category) | 237 (45.9%) | 279 (54.1%) |
| Total (Overall) | 896 (56.6%) | 686 (43.4%) |
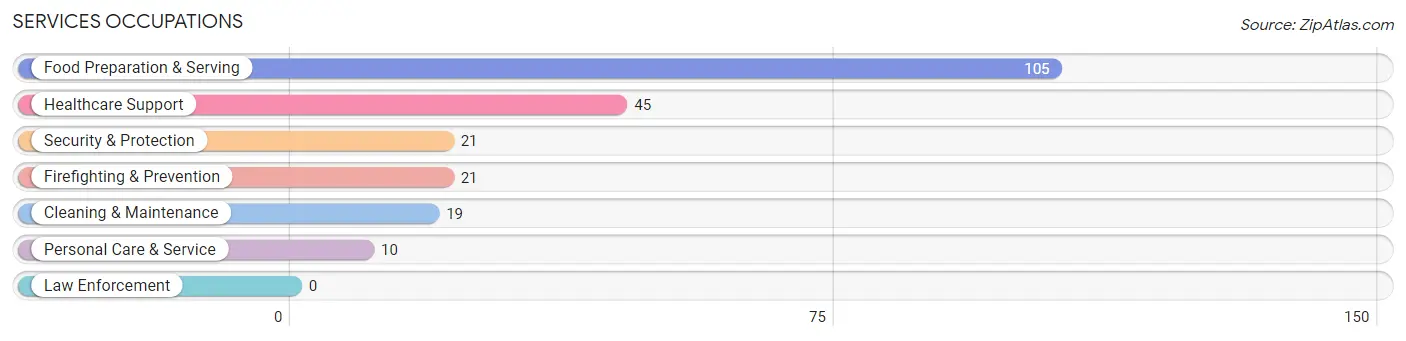
Services Occupations
The most common Services occupations in Genoa City are Food Preparation & Serving (105 | 6.6%), Healthcare Support (45 | 2.8%), Security & Protection (21 | 1.3%), Firefighting & Prevention (21 | 1.3%), and Cleaning & Maintenance (19 | 1.2%).
Services Occupations by Sex
Within the Services occupations in Genoa City, the most male-oriented occupations are Security & Protection (100.0%), Firefighting & Prevention (100.0%), and Cleaning & Maintenance (100.0%), while the most female-oriented occupations are Healthcare Support (100.0%), Personal Care & Service (100.0%), and Food Preparation & Serving (12.4%).
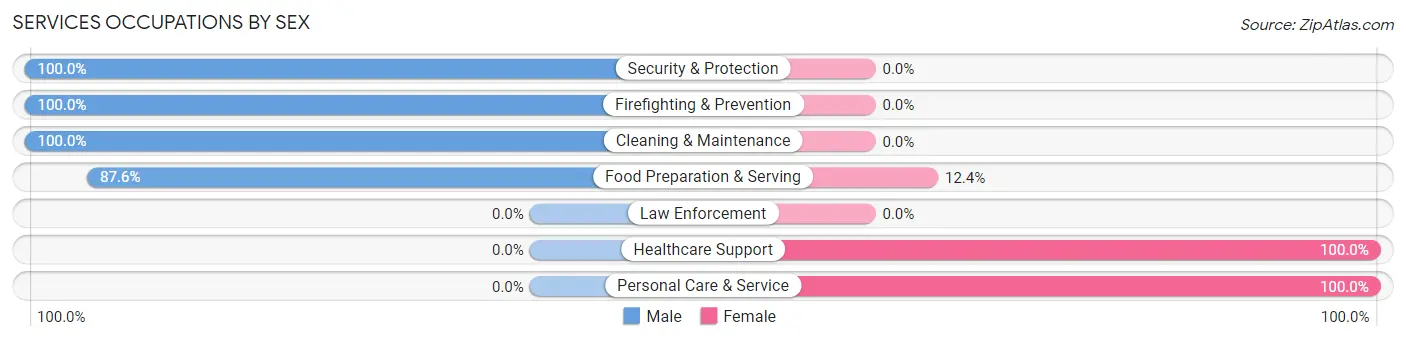
| Occupation | Male | Female |
| Healthcare Support | 0 (0.0%) | 45 (100.0%) |
| Security & Protection | 21 (100.0%) | 0 (0.0%) |
| Firefighting & Prevention | 21 (100.0%) | 0 (0.0%) |
| Law Enforcement | 0 (0.0%) | 0 (0.0%) |
| Food Preparation & Serving | 92 (87.6%) | 13 (12.4%) |
| Cleaning & Maintenance | 19 (100.0%) | 0 (0.0%) |
| Personal Care & Service | 0 (0.0%) | 10 (100.0%) |
| Total (Category) | 132 (66.0%) | 68 (34.0%) |
| Total (Overall) | 896 (56.6%) | 686 (43.4%) |
Sales and Office Occupations
The most common Sales and Office occupations in Genoa City are Office & Administration (225 | 14.2%), and Sales & Related (121 | 7.6%).

Sales and Office Occupations by Sex
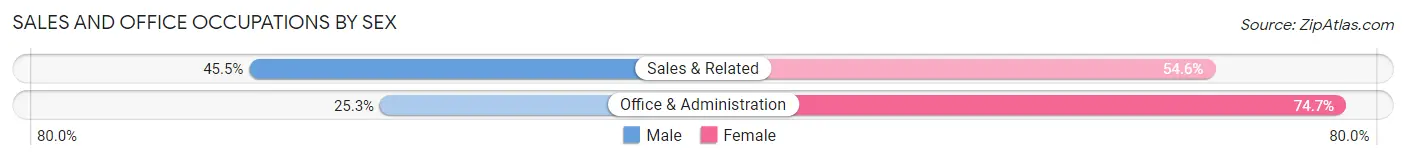
| Occupation | Male | Female |
| Sales & Related | 55 (45.5%) | 66 (54.5%) |
| Office & Administration | 57 (25.3%) | 168 (74.7%) |
| Total (Category) | 112 (32.4%) | 234 (67.6%) |
| Total (Overall) | 896 (56.6%) | 686 (43.4%) |
Natural Resources, Construction and Maintenance Occupations
The most common Natural Resources, Construction and Maintenance occupations in Genoa City are Construction & Extraction (121 | 7.6%), Installation, Maintenance & Repair (106 | 6.7%), and Farming, Fishing & Forestry (7 | 0.4%).

Natural Resources, Construction and Maintenance Occupations by Sex
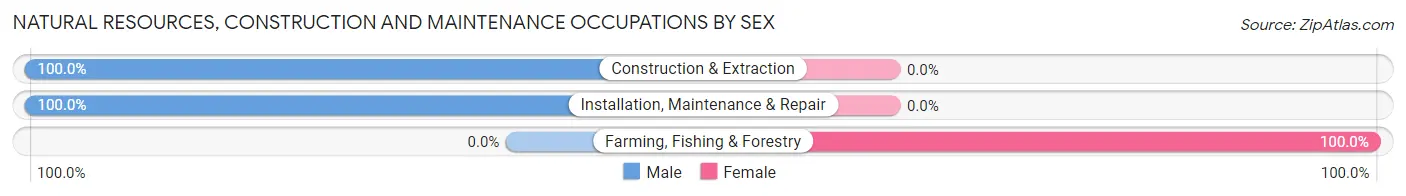
| Occupation | Male | Female |
| Farming, Fishing & Forestry | 0 (0.0%) | 7 (100.0%) |
| Construction & Extraction | 121 (100.0%) | 0 (0.0%) |
| Installation, Maintenance & Repair | 106 (100.0%) | 0 (0.0%) |
| Total (Category) | 227 (97.0%) | 7 (3.0%) |
| Total (Overall) | 896 (56.6%) | 686 (43.4%) |
Production, Transportation and Moving Occupations
The most common Production, Transportation and Moving occupations in Genoa City are Production (185 | 11.7%), Material Moving (65 | 4.1%), and Transportation (36 | 2.3%).
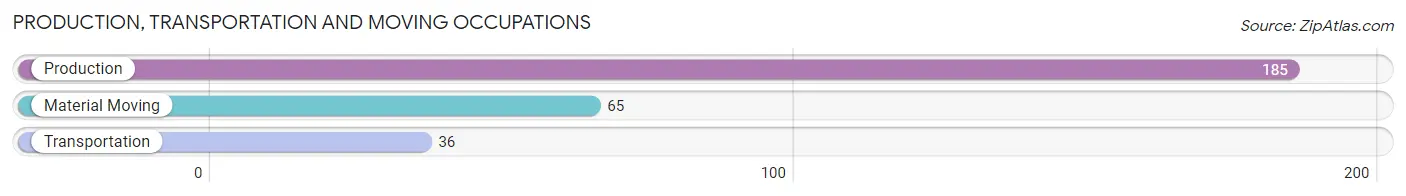
Production, Transportation and Moving Occupations by Sex
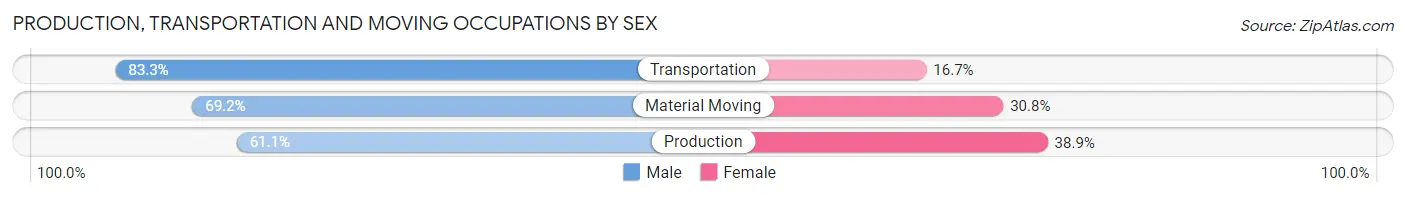
| Occupation | Male | Female |
| Production | 113 (61.1%) | 72 (38.9%) |
| Transportation | 30 (83.3%) | 6 (16.7%) |
| Material Moving | 45 (69.2%) | 20 (30.8%) |
| Total (Category) | 188 (65.7%) | 98 (34.3%) |
| Total (Overall) | 896 (56.6%) | 686 (43.4%) |
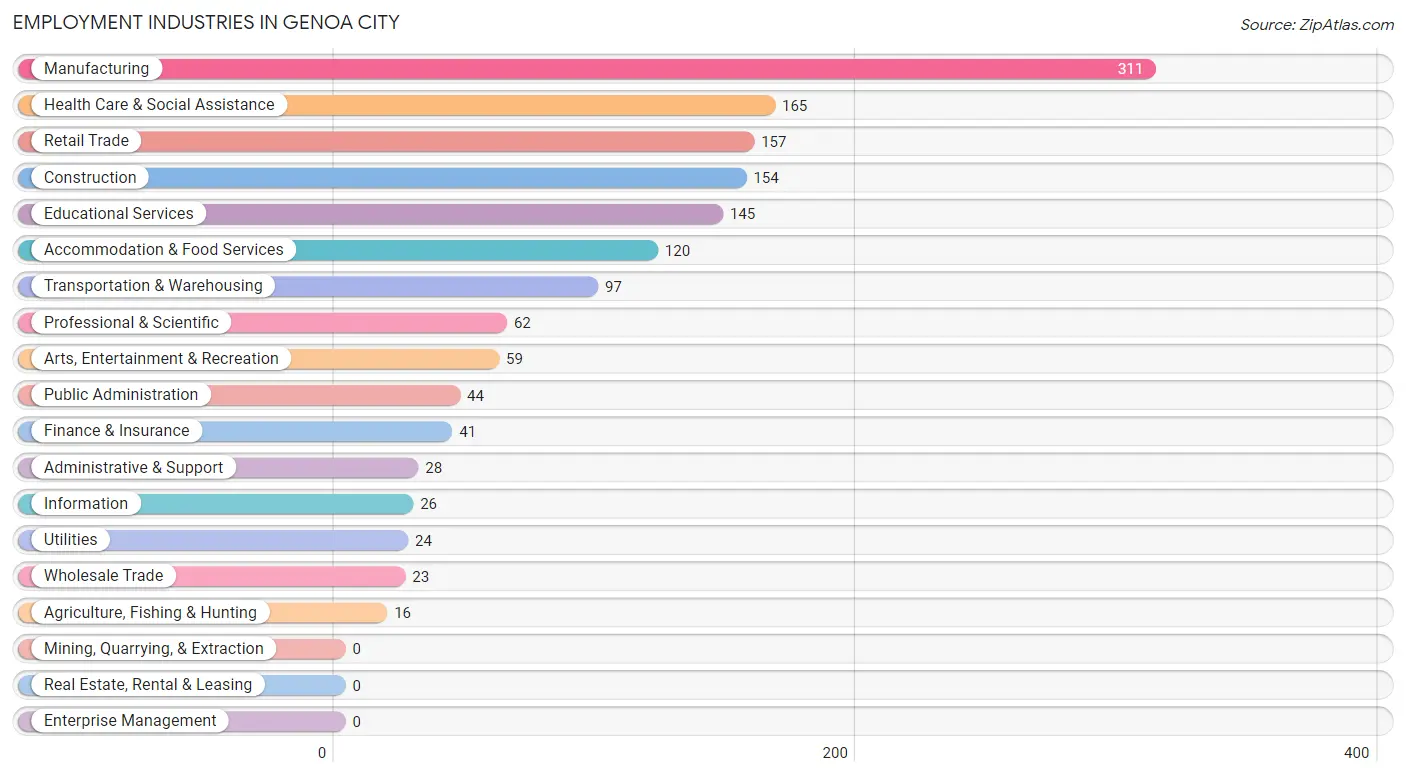
Employment Industries by Sex in Genoa City
Employment Industries in Genoa City
The major employment industries in Genoa City include Manufacturing (311 | 19.7%), Health Care & Social Assistance (165 | 10.4%), Retail Trade (157 | 9.9%), Construction (154 | 9.7%), and Educational Services (145 | 9.2%).
Employment Industries by Sex in Genoa City
The Genoa City industries that see more men than women are Information (100.0%), Arts, Entertainment & Recreation (100.0%), and Construction (84.4%), whereas the industries that tend to have a higher number of women are Health Care & Social Assistance (92.7%), Educational Services (78.6%), and Public Administration (75.0%).
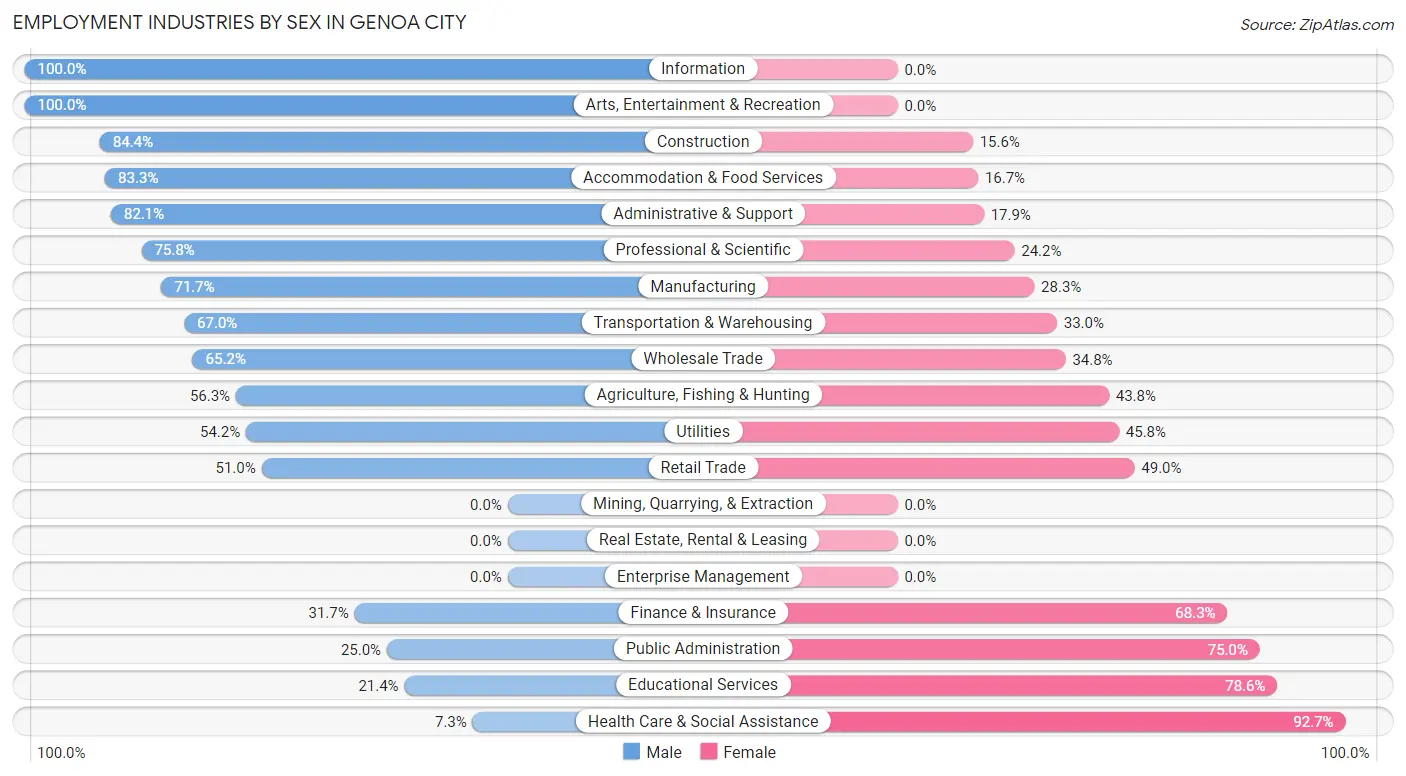
| Industry | Male | Female |
| Agriculture, Fishing & Hunting | 9 (56.2%) | 7 (43.8%) |
| Mining, Quarrying, & Extraction | 0 (0.0%) | 0 (0.0%) |
| Construction | 130 (84.4%) | 24 (15.6%) |
| Manufacturing | 223 (71.7%) | 88 (28.3%) |
| Wholesale Trade | 15 (65.2%) | 8 (34.8%) |
| Retail Trade | 80 (51.0%) | 77 (49.0%) |
| Transportation & Warehousing | 65 (67.0%) | 32 (33.0%) |
| Utilities | 13 (54.2%) | 11 (45.8%) |
| Information | 26 (100.0%) | 0 (0.0%) |
| Finance & Insurance | 13 (31.7%) | 28 (68.3%) |
| Real Estate, Rental & Leasing | 0 (0.0%) | 0 (0.0%) |
| Professional & Scientific | 47 (75.8%) | 15 (24.2%) |
| Enterprise Management | 0 (0.0%) | 0 (0.0%) |
| Administrative & Support | 23 (82.1%) | 5 (17.9%) |
| Educational Services | 31 (21.4%) | 114 (78.6%) |
| Health Care & Social Assistance | 12 (7.3%) | 153 (92.7%) |
| Arts, Entertainment & Recreation | 59 (100.0%) | 0 (0.0%) |
| Accommodation & Food Services | 100 (83.3%) | 20 (16.7%) |
| Public Administration | 11 (25.0%) | 33 (75.0%) |
| Total | 896 (56.6%) | 686 (43.4%) |
Education in Genoa City
School Enrollment in Genoa City
The most common levels of schooling among the 743 students in Genoa City are middle school (277 | 37.3%), elementary school (240 | 32.3%), and high school (78 | 10.5%).
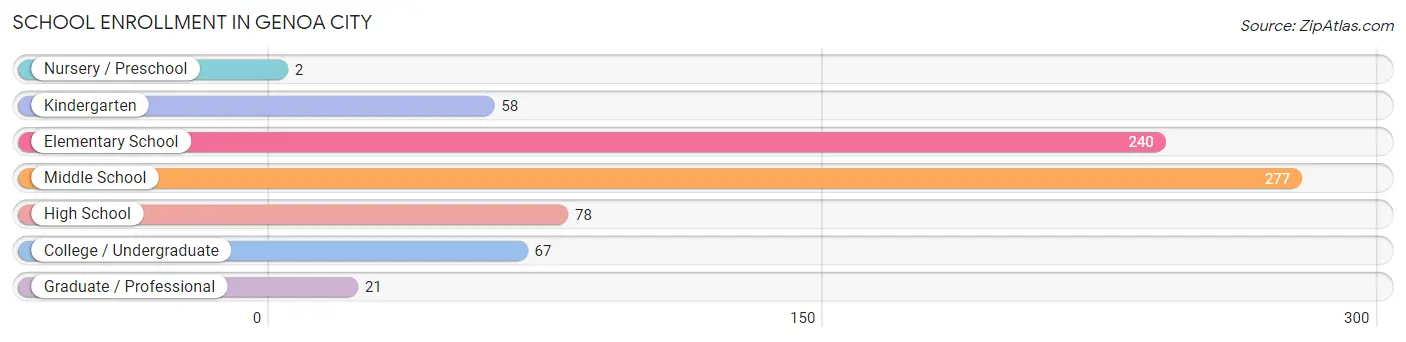
| School Level | # Students | % Students |
| Nursery / Preschool | 2 | 0.3% |
| Kindergarten | 58 | 7.8% |
| Elementary School | 240 | 32.3% |
| Middle School | 277 | 37.3% |
| High School | 78 | 10.5% |
| College / Undergraduate | 67 | 9.0% |
| Graduate / Professional | 21 | 2.8% |
| Total | 743 | 100.0% |
School Enrollment by Age by Funding Source in Genoa City
Out of a total of 743 students who are enrolled in schools in Genoa City, 55 (7.4%) attend a private institution, while the remaining 688 (92.6%) are enrolled in public schools. The age group of 35 years and over has the highest likelihood of being enrolled in private schools, with 14 (42.4% in the age bracket) enrolled. Conversely, the age group of 3 to 4 year olds has the lowest likelihood of being enrolled in a private school, with 2 (100.0% in the age bracket) attending a public institution.
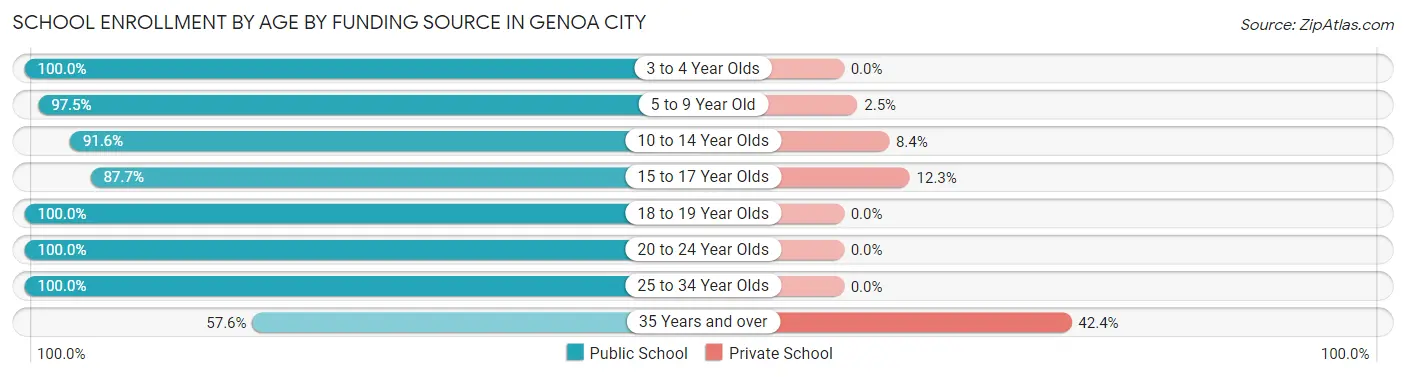
| Age Bracket | Public School | Private School |
| 3 to 4 Year Olds | 2 (100.0%) | 0 (0.0%) |
| 5 to 9 Year Old | 269 (97.5%) | 7 (2.5%) |
| 10 to 14 Year Olds | 293 (91.6%) | 27 (8.4%) |
| 15 to 17 Year Olds | 50 (87.7%) | 7 (12.3%) |
| 18 to 19 Year Olds | 15 (100.0%) | 0 (0.0%) |
| 20 to 24 Year Olds | 35 (100.0%) | 0 (0.0%) |
| 25 to 34 Year Olds | 5 (100.0%) | 0 (0.0%) |
| 35 Years and over | 19 (57.6%) | 14 (42.4%) |
| Total | 688 (92.6%) | 55 (7.4%) |
Educational Attainment by Field of Study in Genoa City
Science & technology (102 | 21.4%), education (102 | 21.4%), business (66 | 13.8%), bio, nature & agricultural (44 | 9.2%), and visual & performing arts (43 | 9.0%) are the most common fields of study among 477 individuals in Genoa City who have obtained a bachelor's degree or higher.
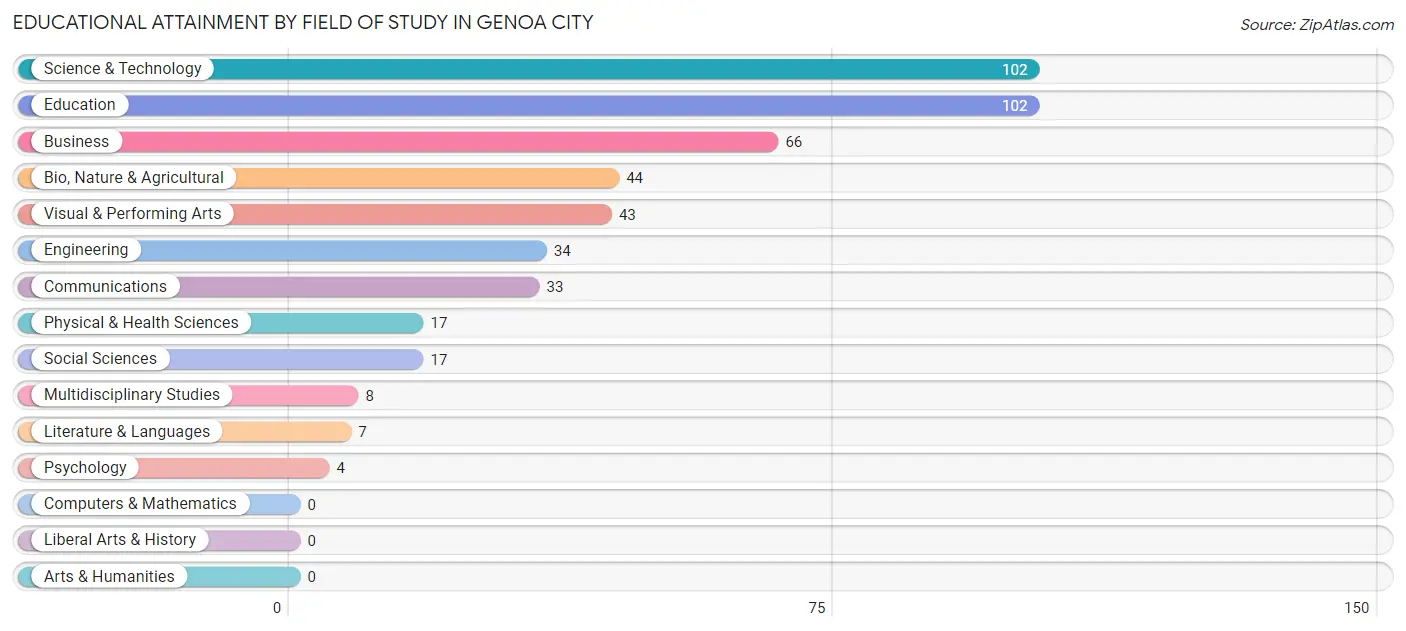
| Field of Study | # Graduates | % Graduates |
| Computers & Mathematics | 0 | 0.0% |
| Bio, Nature & Agricultural | 44 | 9.2% |
| Physical & Health Sciences | 17 | 3.6% |
| Psychology | 4 | 0.8% |
| Social Sciences | 17 | 3.6% |
| Engineering | 34 | 7.1% |
| Multidisciplinary Studies | 8 | 1.7% |
| Science & Technology | 102 | 21.4% |
| Business | 66 | 13.8% |
| Education | 102 | 21.4% |
| Literature & Languages | 7 | 1.5% |
| Liberal Arts & History | 0 | 0.0% |
| Visual & Performing Arts | 43 | 9.0% |
| Communications | 33 | 6.9% |
| Arts & Humanities | 0 | 0.0% |
| Total | 477 | 100.0% |
Transportation & Commute in Genoa City
Vehicle Availability by Sex in Genoa City
The most prevalent vehicle ownership categories in Genoa City are males with 2 vehicles (443, accounting for 51.0%) and females with 2 vehicles (325, making up 65.4%).
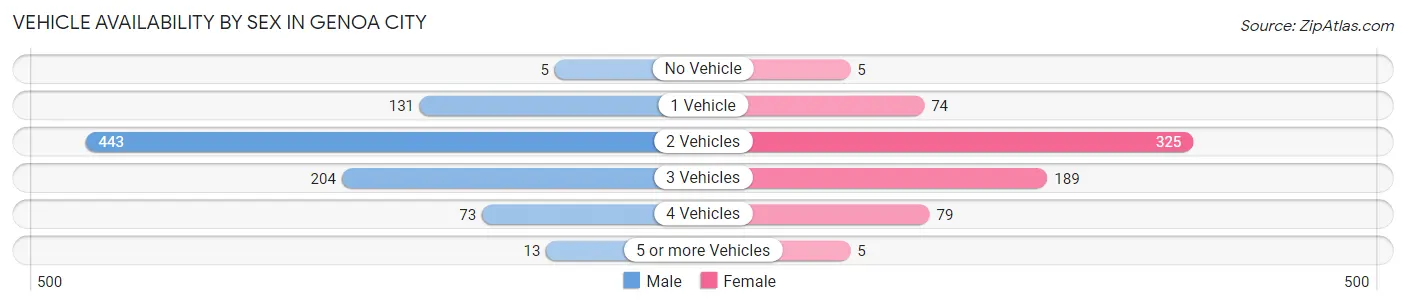
| Vehicles Available | Male | Female |
| No Vehicle | 5 (0.6%) | 5 (0.7%) |
| 1 Vehicle | 131 (15.1%) | 74 (10.9%) |
| 2 Vehicles | 443 (51.0%) | 325 (48.0%) |
| 3 Vehicles | 204 (23.5%) | 189 (27.9%) |
| 4 Vehicles | 73 (8.4%) | 79 (11.7%) |
| 5 or more Vehicles | 13 (1.5%) | 5 (0.7%) |
| Total | 869 (100.0%) | 677 (100.0%) |
Commute Time in Genoa City
The most frequently occuring commute durations in Genoa City are 45 to 59 minutes (233 commuters, 16.6%), 20 to 24 minutes (207 commuters, 14.7%), and 60 to 89 minutes (194 commuters, 13.8%).
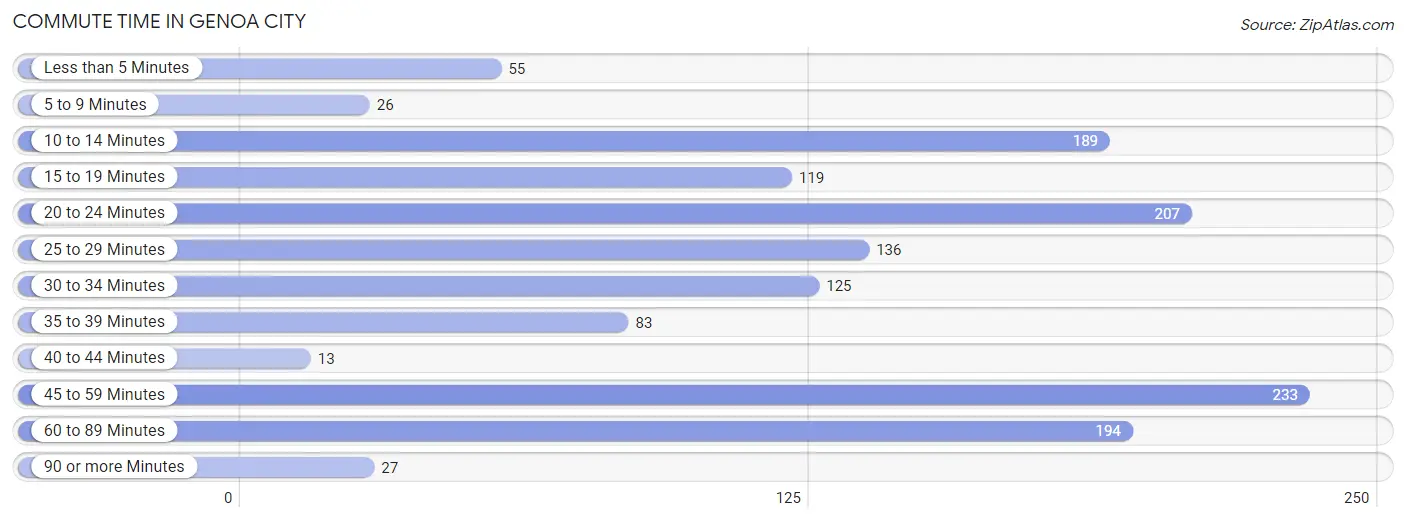
| Commute Time | # Commuters | % Commuters |
| Less than 5 Minutes | 55 | 3.9% |
| 5 to 9 Minutes | 26 | 1.8% |
| 10 to 14 Minutes | 189 | 13.4% |
| 15 to 19 Minutes | 119 | 8.5% |
| 20 to 24 Minutes | 207 | 14.7% |
| 25 to 29 Minutes | 136 | 9.7% |
| 30 to 34 Minutes | 125 | 8.9% |
| 35 to 39 Minutes | 83 | 5.9% |
| 40 to 44 Minutes | 13 | 0.9% |
| 45 to 59 Minutes | 233 | 16.6% |
| 60 to 89 Minutes | 194 | 13.8% |
| 90 or more Minutes | 27 | 1.9% |
Commute Time by Sex in Genoa City
The most common commute times in Genoa City are 45 to 59 minutes (179 commuters, 21.6%) for males and 10 to 14 minutes (95 commuters, 16.4%) for females.
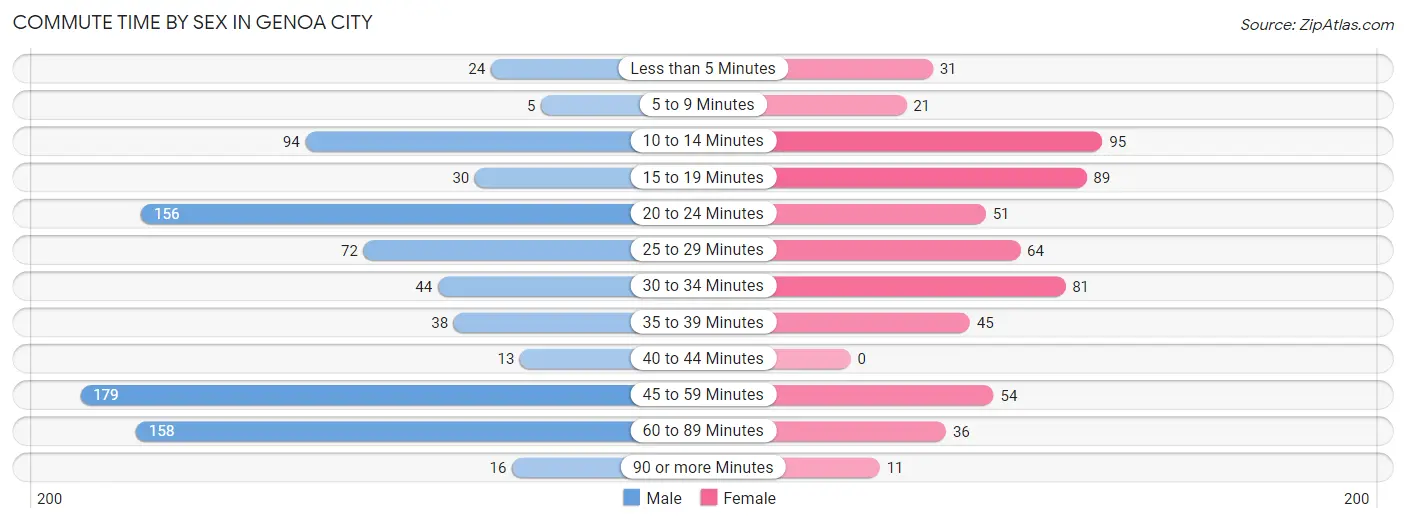
| Commute Time | Male | Female |
| Less than 5 Minutes | 24 (2.9%) | 31 (5.4%) |
| 5 to 9 Minutes | 5 (0.6%) | 21 (3.6%) |
| 10 to 14 Minutes | 94 (11.3%) | 95 (16.4%) |
| 15 to 19 Minutes | 30 (3.6%) | 89 (15.4%) |
| 20 to 24 Minutes | 156 (18.8%) | 51 (8.8%) |
| 25 to 29 Minutes | 72 (8.7%) | 64 (11.1%) |
| 30 to 34 Minutes | 44 (5.3%) | 81 (14.0%) |
| 35 to 39 Minutes | 38 (4.6%) | 45 (7.8%) |
| 40 to 44 Minutes | 13 (1.6%) | 0 (0.0%) |
| 45 to 59 Minutes | 179 (21.6%) | 54 (9.3%) |
| 60 to 89 Minutes | 158 (19.1%) | 36 (6.2%) |
| 90 or more Minutes | 16 (1.9%) | 11 (1.9%) |
Time of Departure to Work by Sex in Genoa City
The most frequent times of departure to work in Genoa City are 7:00 AM to 7:29 AM (151, 18.2%) for males and 7:00 AM to 7:29 AM (148, 25.6%) for females.
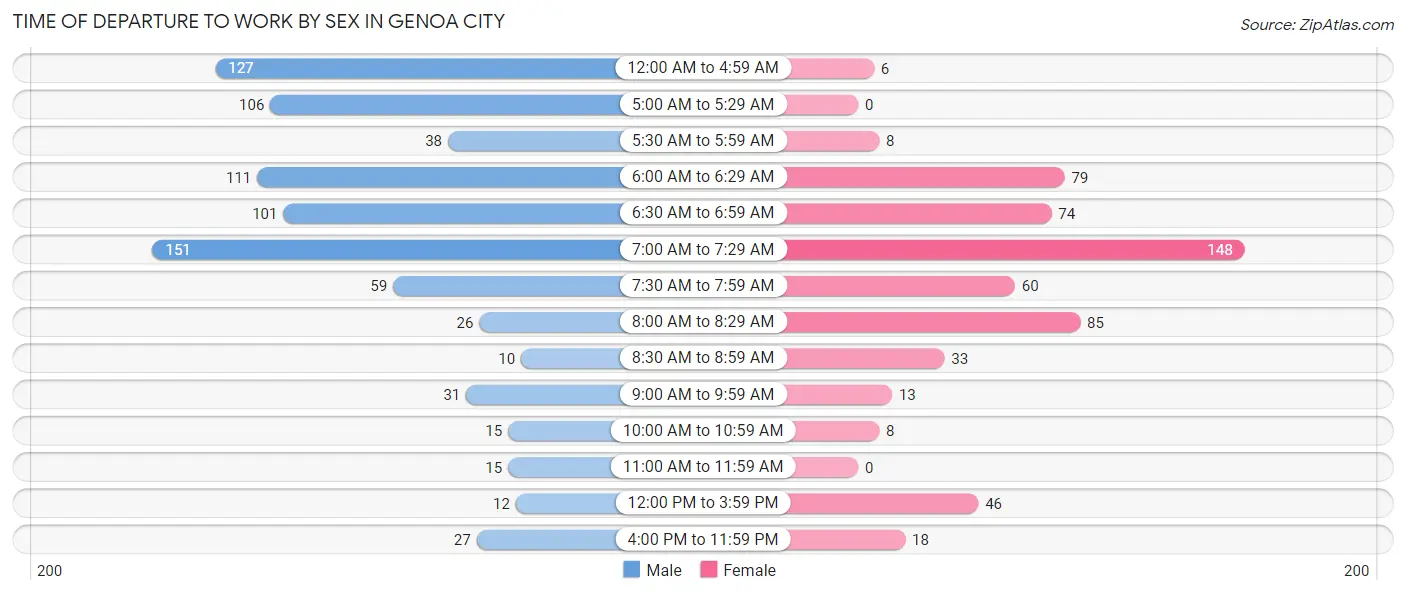
| Time of Departure | Male | Female |
| 12:00 AM to 4:59 AM | 127 (15.3%) | 6 (1.0%) |
| 5:00 AM to 5:29 AM | 106 (12.8%) | 0 (0.0%) |
| 5:30 AM to 5:59 AM | 38 (4.6%) | 8 (1.4%) |
| 6:00 AM to 6:29 AM | 111 (13.4%) | 79 (13.7%) |
| 6:30 AM to 6:59 AM | 101 (12.2%) | 74 (12.8%) |
| 7:00 AM to 7:29 AM | 151 (18.2%) | 148 (25.6%) |
| 7:30 AM to 7:59 AM | 59 (7.1%) | 60 (10.4%) |
| 8:00 AM to 8:29 AM | 26 (3.1%) | 85 (14.7%) |
| 8:30 AM to 8:59 AM | 10 (1.2%) | 33 (5.7%) |
| 9:00 AM to 9:59 AM | 31 (3.7%) | 13 (2.2%) |
| 10:00 AM to 10:59 AM | 15 (1.8%) | 8 (1.4%) |
| 11:00 AM to 11:59 AM | 15 (1.8%) | 0 (0.0%) |
| 12:00 PM to 3:59 PM | 12 (1.5%) | 46 (8.0%) |
| 4:00 PM to 11:59 PM | 27 (3.3%) | 18 (3.1%) |
| Total | 829 (100.0%) | 578 (100.0%) |
Housing Occupancy in Genoa City
Occupancy by Ownership in Genoa City
Of the total 1,109 dwellings in Genoa City, owner-occupied units account for 970 (87.5%), while renter-occupied units make up 139 (12.5%).
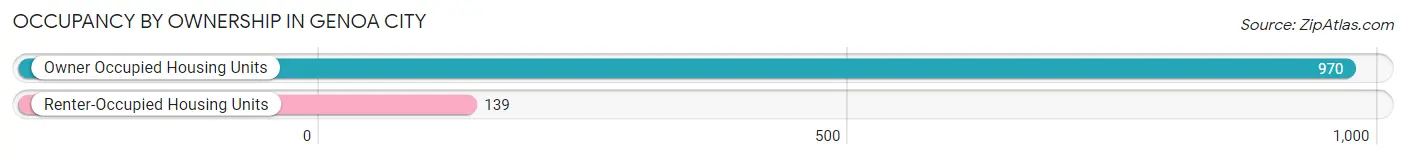
| Occupancy | # Housing Units | % Housing Units |
| Owner Occupied Housing Units | 970 | 87.5% |
| Renter-Occupied Housing Units | 139 | 12.5% |
| Total Occupied Housing Units | 1,109 | 100.0% |
Occupancy by Household Size in Genoa City
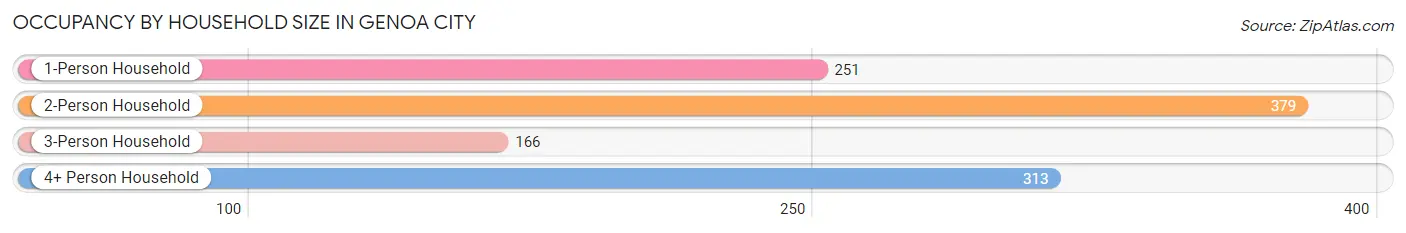
| Household Size | # Housing Units | % Housing Units |
| 1-Person Household | 251 | 22.6% |
| 2-Person Household | 379 | 34.2% |
| 3-Person Household | 166 | 15.0% |
| 4+ Person Household | 313 | 28.2% |
| Total Housing Units | 1,109 | 100.0% |
Occupancy by Ownership by Household Size in Genoa City
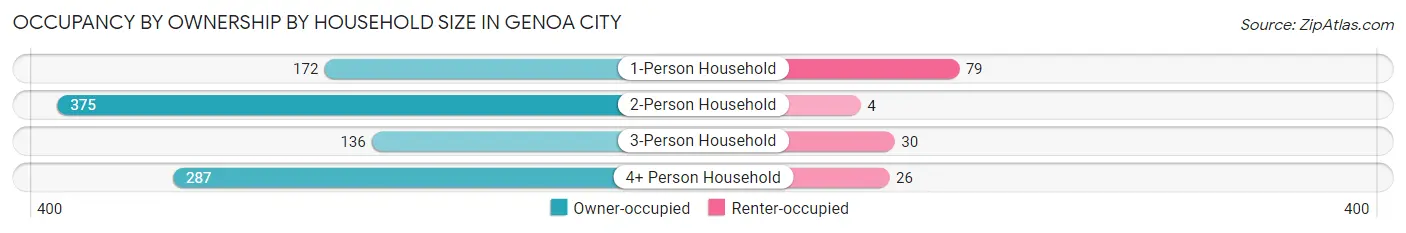
| Household Size | Owner-occupied | Renter-occupied |
| 1-Person Household | 172 (68.5%) | 79 (31.5%) |
| 2-Person Household | 375 (98.9%) | 4 (1.1%) |
| 3-Person Household | 136 (81.9%) | 30 (18.1%) |
| 4+ Person Household | 287 (91.7%) | 26 (8.3%) |
| Total Housing Units | 970 (87.5%) | 139 (12.5%) |
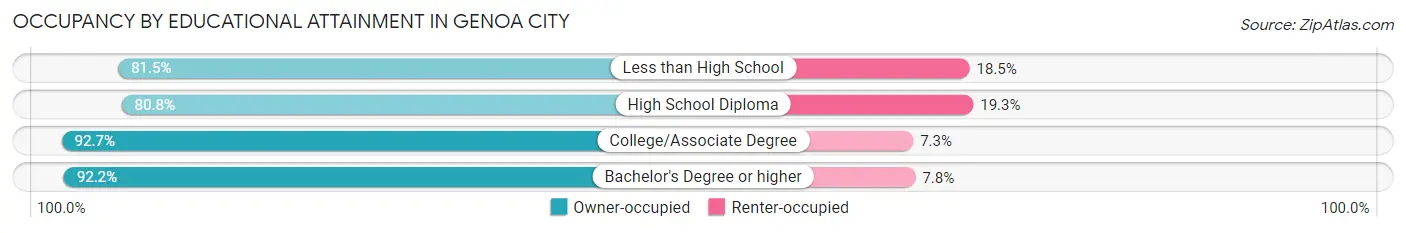
Occupancy by Educational Attainment in Genoa City
| Household Size | Owner-occupied | Renter-occupied |
| Less than High School | 110 (81.5%) | 25 (18.5%) |
| High School Diploma | 281 (80.7%) | 67 (19.3%) |
| College/Associate Degree | 366 (92.7%) | 29 (7.3%) |
| Bachelor's Degree or higher | 213 (92.2%) | 18 (7.8%) |
Occupancy by Age of Householder in Genoa City
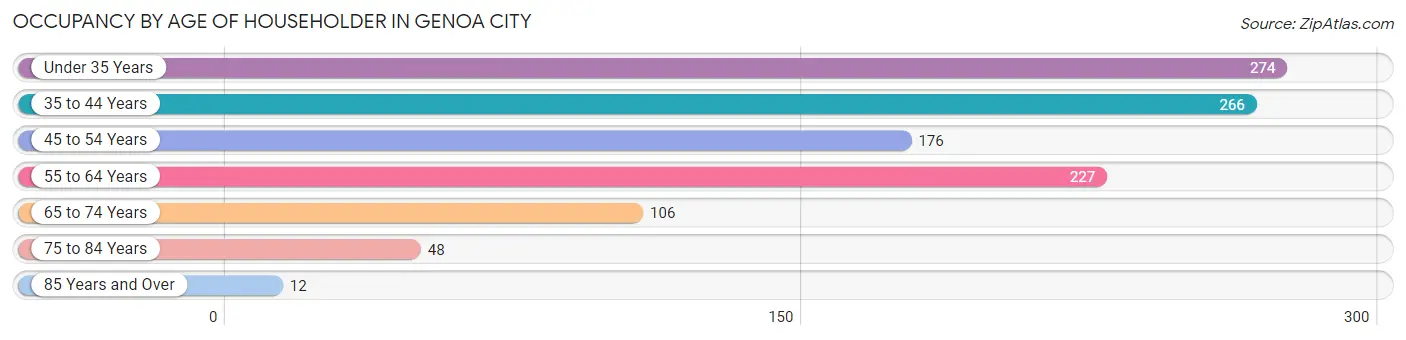
| Age Bracket | # Households | % Households |
| Under 35 Years | 274 | 24.7% |
| 35 to 44 Years | 266 | 24.0% |
| 45 to 54 Years | 176 | 15.9% |
| 55 to 64 Years | 227 | 20.5% |
| 65 to 74 Years | 106 | 9.6% |
| 75 to 84 Years | 48 | 4.3% |
| 85 Years and Over | 12 | 1.1% |
| Total | 1,109 | 100.0% |
Housing Finances in Genoa City
Median Income by Occupancy in Genoa City
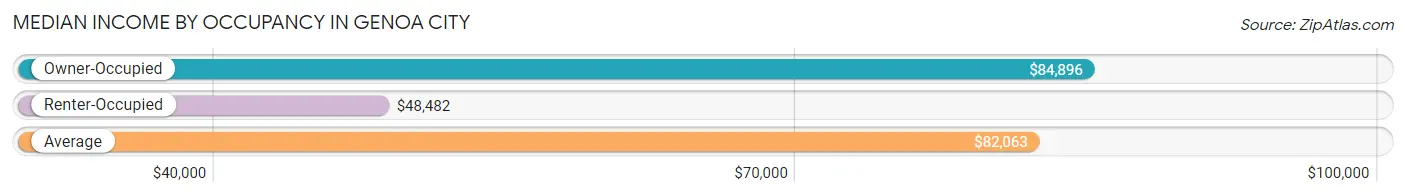
| Occupancy Type | # Households | Median Income |
| Owner-Occupied | 970 (87.5%) | $84,896 |
| Renter-Occupied | 139 (12.5%) | $48,482 |
| Average | 1,109 (100.0%) | $82,063 |
Occupancy by Householder Income Bracket in Genoa City
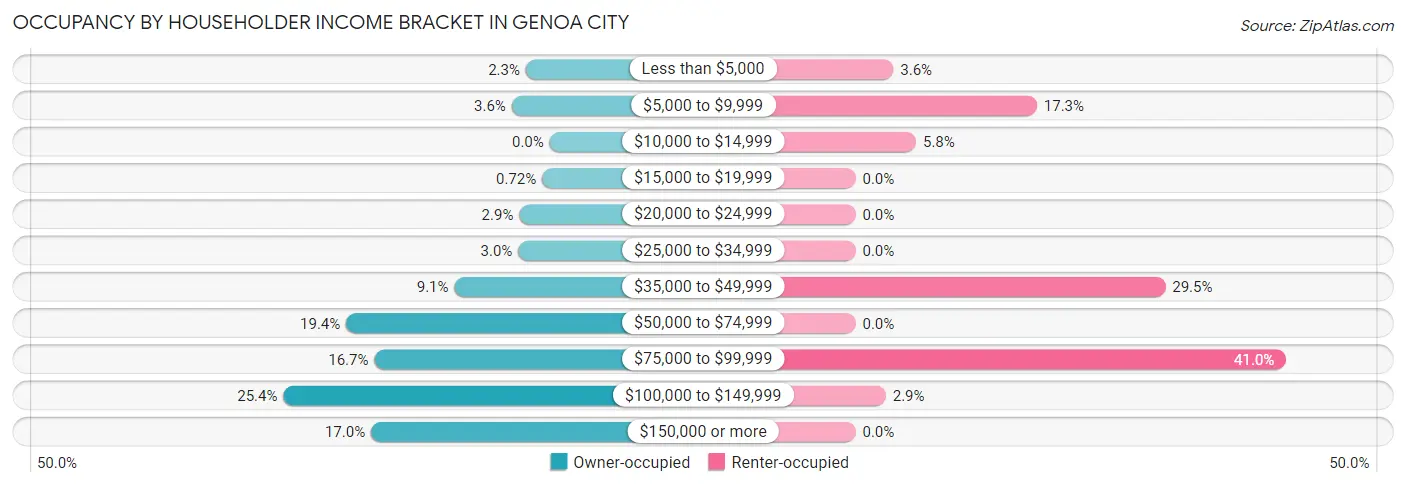
| Income Bracket | Owner-occupied | Renter-occupied |
| Less than $5,000 | 22 (2.3%) | 5 (3.6%) |
| $5,000 to $9,999 | 35 (3.6%) | 24 (17.3%) |
| $10,000 to $14,999 | 0 (0.0%) | 8 (5.8%) |
| $15,000 to $19,999 | 7 (0.7%) | 0 (0.0%) |
| $20,000 to $24,999 | 28 (2.9%) | 0 (0.0%) |
| $25,000 to $34,999 | 29 (3.0%) | 0 (0.0%) |
| $35,000 to $49,999 | 88 (9.1%) | 41 (29.5%) |
| $50,000 to $74,999 | 188 (19.4%) | 0 (0.0%) |
| $75,000 to $99,999 | 162 (16.7%) | 57 (41.0%) |
| $100,000 to $149,999 | 246 (25.4%) | 4 (2.9%) |
| $150,000 or more | 165 (17.0%) | 0 (0.0%) |
| Total | 970 (100.0%) | 139 (100.0%) |
Monthly Housing Cost Tiers in Genoa City
| Monthly Cost | Owner-occupied | Renter-occupied |
| Less than $300 | 6 (0.6%) | 0 (0.0%) |
| $300 to $499 | 16 (1.7%) | 0 (0.0%) |
| $500 to $799 | 164 (16.9%) | 32 (23.0%) |
| $800 to $999 | 99 (10.2%) | 19 (13.7%) |
| $1,000 to $1,499 | 228 (23.5%) | 64 (46.0%) |
| $1,500 to $1,999 | 412 (42.5%) | 6 (4.3%) |
| $2,000 to $2,499 | 24 (2.5%) | 0 (0.0%) |
| $2,500 to $2,999 | 21 (2.2%) | 0 (0.0%) |
| $3,000 or more | 0 (0.0%) | 0 (0.0%) |
| Total | 970 (100.0%) | 139 (100.0%) |
Physical Housing Characteristics in Genoa City
Housing Structures in Genoa City
| Structure Type | # Housing Units | % Housing Units |
| Single Unit, Detached | 858 | 77.4% |
| Single Unit, Attached | 188 | 17.0% |
| 2 Unit Apartments | 21 | 1.9% |
| 3 or 4 Unit Apartments | 37 | 3.3% |
| 5 to 9 Unit Apartments | 0 | 0.0% |
| 10 or more Apartments | 5 | 0.4% |
| Mobile Home / Other | 0 | 0.0% |
| Total | 1,109 | 100.0% |
Housing Structures by Occupancy in Genoa City
| Structure Type | Owner-occupied | Renter-occupied |
| Single Unit, Detached | 750 (87.4%) | 108 (12.6%) |
| Single Unit, Attached | 182 (96.8%) | 6 (3.2%) |
| 2 Unit Apartments | 7 (33.3%) | 14 (66.7%) |
| 3 or 4 Unit Apartments | 31 (83.8%) | 6 (16.2%) |
| 5 to 9 Unit Apartments | 0 (0.0%) | 0 (0.0%) |
| 10 or more Apartments | 0 (0.0%) | 5 (100.0%) |
| Mobile Home / Other | 0 (0.0%) | 0 (0.0%) |
| Total | 970 (87.5%) | 139 (12.5%) |
Housing Structures by Number of Rooms in Genoa City
| Number of Rooms | Owner-occupied | Renter-occupied |
| 1 Room | 0 (0.0%) | 5 (3.6%) |
| 2 or 3 Rooms | 23 (2.4%) | 24 (17.3%) |
| 4 or 5 Rooms | 335 (34.5%) | 78 (56.1%) |
| 6 or 7 Rooms | 398 (41.0%) | 6 (4.3%) |
| 8 or more Rooms | 214 (22.1%) | 26 (18.7%) |
| Total | 970 (100.0%) | 139 (100.0%) |
Housing Structure by Heating Type in Genoa City
| Heating Type | Owner-occupied | Renter-occupied |
| Utility Gas | 897 (92.5%) | 94 (67.6%) |
| Bottled, Tank, or LP Gas | 47 (4.9%) | 7 (5.0%) |
| Electricity | 26 (2.7%) | 38 (27.3%) |
| Fuel Oil or Kerosene | 0 (0.0%) | 0 (0.0%) |
| Coal or Coke | 0 (0.0%) | 0 (0.0%) |
| All other Fuels | 0 (0.0%) | 0 (0.0%) |
| No Fuel Used | 0 (0.0%) | 0 (0.0%) |
| Total | 970 (100.0%) | 139 (100.0%) |
Household Vehicle Usage in Genoa City
| Vehicles per Household | Owner-occupied | Renter-occupied |
| No Vehicle | 11 (1.1%) | 5 (3.6%) |
| 1 Vehicle | 195 (20.1%) | 74 (53.2%) |
| 2 Vehicles | 480 (49.5%) | 45 (32.4%) |
| 3 or more Vehicles | 284 (29.3%) | 15 (10.8%) |
| Total | 970 (100.0%) | 139 (100.0%) |
Real Estate & Mortgages in Genoa City
Real Estate and Mortgage Overview in Genoa City
| Characteristic | Without Mortgage | With Mortgage |
| Housing Units | 188 | 782 |
| Median Property Value | $202,000 | $205,500 |
| Median Household Income | $50,833 | $143 |
| Monthly Housing Costs | $667 | $0 |
| Real Estate Taxes | $3,853 | $7 |
Property Value by Mortgage Status in Genoa City
| Property Value | Without Mortgage | With Mortgage |
| Less than $50,000 | 6 (3.2%) | 0 (0.0%) |
| $50,000 to $99,999 | 4 (2.1%) | 0 (0.0%) |
| $100,000 to $299,999 | 154 (81.9%) | 702 (89.8%) |
| $300,000 to $499,999 | 24 (12.8%) | 58 (7.4%) |
| $500,000 to $749,999 | 0 (0.0%) | 22 (2.8%) |
| $750,000 to $999,999 | 0 (0.0%) | 0 (0.0%) |
| $1,000,000 or more | 0 (0.0%) | 0 (0.0%) |
| Total | 188 (100.0%) | 782 (100.0%) |
Household Income by Mortgage Status in Genoa City
| Household Income | Without Mortgage | With Mortgage |
| Less than $10,000 | 35 (18.6%) | 18 (2.3%) |
| $10,000 to $24,999 | 24 (12.8%) | 22 (2.8%) |
| $25,000 to $34,999 | 10 (5.3%) | 11 (1.4%) |
| $35,000 to $49,999 | 20 (10.6%) | 19 (2.4%) |
| $50,000 to $74,999 | 21 (11.2%) | 68 (8.7%) |
| $75,000 to $99,999 | 31 (16.5%) | 167 (21.4%) |
| $100,000 to $149,999 | 25 (13.3%) | 131 (16.8%) |
| $150,000 or more | 22 (11.7%) | 221 (28.3%) |
| Total | 188 (100.0%) | 782 (100.0%) |
Property Value to Household Income Ratio in Genoa City
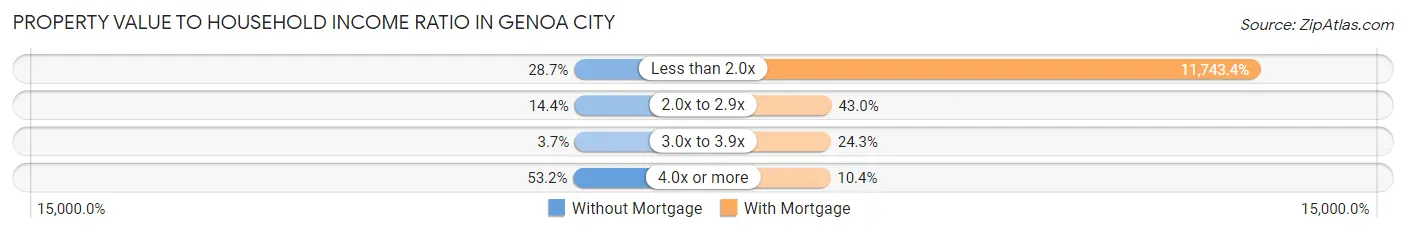
| Value-to-Income Ratio | Without Mortgage | With Mortgage |
| Less than 2.0x | 54 (28.7%) | 91,833 (11,743.3%) |
| 2.0x to 2.9x | 27 (14.4%) | 336 (43.0%) |
| 3.0x to 3.9x | 7 (3.7%) | 190 (24.3%) |
| 4.0x or more | 100 (53.2%) | 81 (10.4%) |
| Total | 188 (100.0%) | 782 (100.0%) |
Real Estate Taxes by Mortgage Status in Genoa City
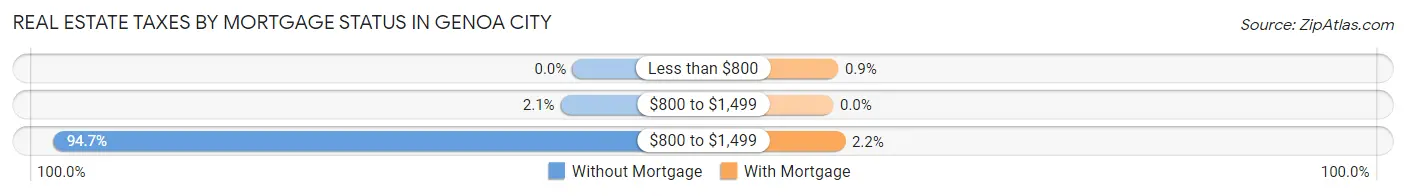
| Property Taxes | Without Mortgage | With Mortgage |
| Less than $800 | 0 (0.0%) | 7 (0.9%) |
| $800 to $1,499 | 4 (2.1%) | 0 (0.0%) |
| $800 to $1,499 | 178 (94.7%) | 17 (2.2%) |
| Total | 188 (100.0%) | 782 (100.0%) |
Health & Disability in Genoa City
Health Insurance Coverage by Age in Genoa City
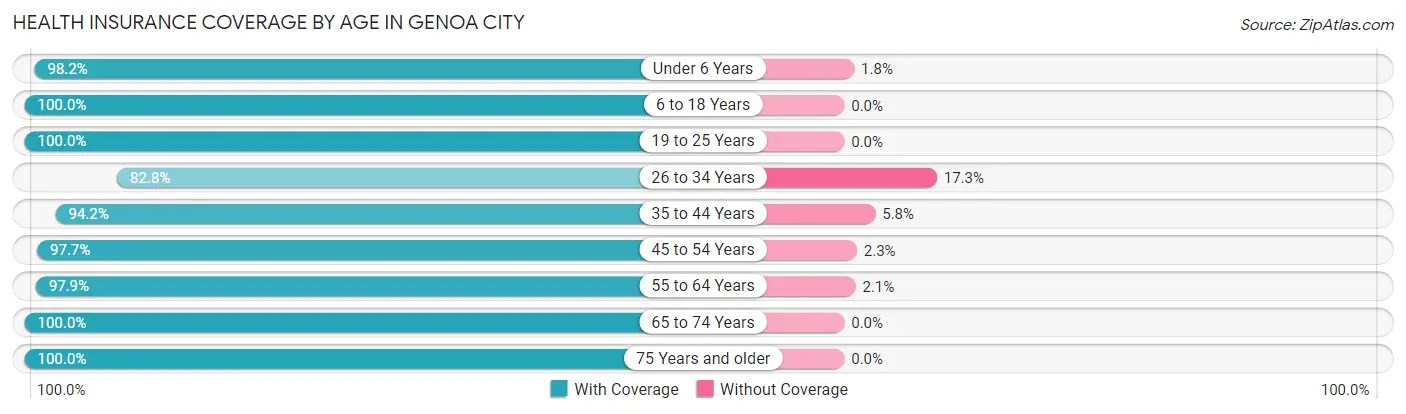
| Age Bracket | With Coverage | Without Coverage |
| Under 6 Years | 213 (98.2%) | 4 (1.8%) |
| 6 to 18 Years | 654 (100.0%) | 0 (0.0%) |
| 19 to 25 Years | 185 (100.0%) | 0 (0.0%) |
| 26 to 34 Years | 403 (82.8%) | 84 (17.2%) |
| 35 to 44 Years | 424 (94.2%) | 26 (5.8%) |
| 45 to 54 Years | 334 (97.7%) | 8 (2.3%) |
| 55 to 64 Years | 327 (97.9%) | 7 (2.1%) |
| 65 to 74 Years | 209 (100.0%) | 0 (0.0%) |
| 75 Years and older | 78 (100.0%) | 0 (0.0%) |
| Total | 2,827 (95.6%) | 129 (4.4%) |
Health Insurance Coverage by Citizenship Status in Genoa City
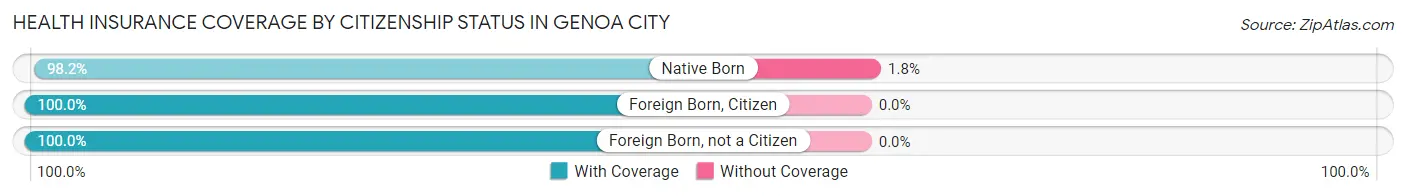
| Citizenship Status | With Coverage | Without Coverage |
| Native Born | 213 (98.2%) | 4 (1.8%) |
| Foreign Born, Citizen | 654 (100.0%) | 0 (0.0%) |
| Foreign Born, not a Citizen | 185 (100.0%) | 0 (0.0%) |
Health Insurance Coverage by Household Income in Genoa City
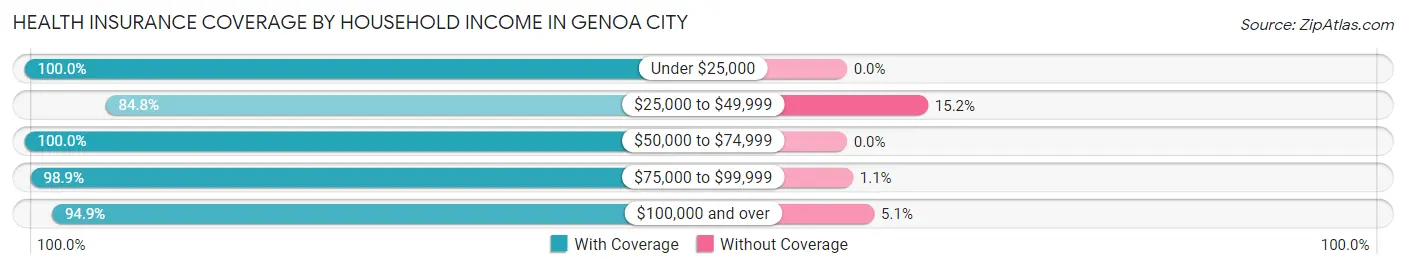
| Household Income | With Coverage | Without Coverage |
| Under $25,000 | 217 (100.0%) | 0 (0.0%) |
| $25,000 to $49,999 | 296 (84.8%) | 53 (15.2%) |
| $50,000 to $74,999 | 405 (100.0%) | 0 (0.0%) |
| $75,000 to $99,999 | 615 (98.9%) | 7 (1.1%) |
| $100,000 and over | 1,276 (94.9%) | 69 (5.1%) |
Public vs Private Health Insurance Coverage by Age in Genoa City
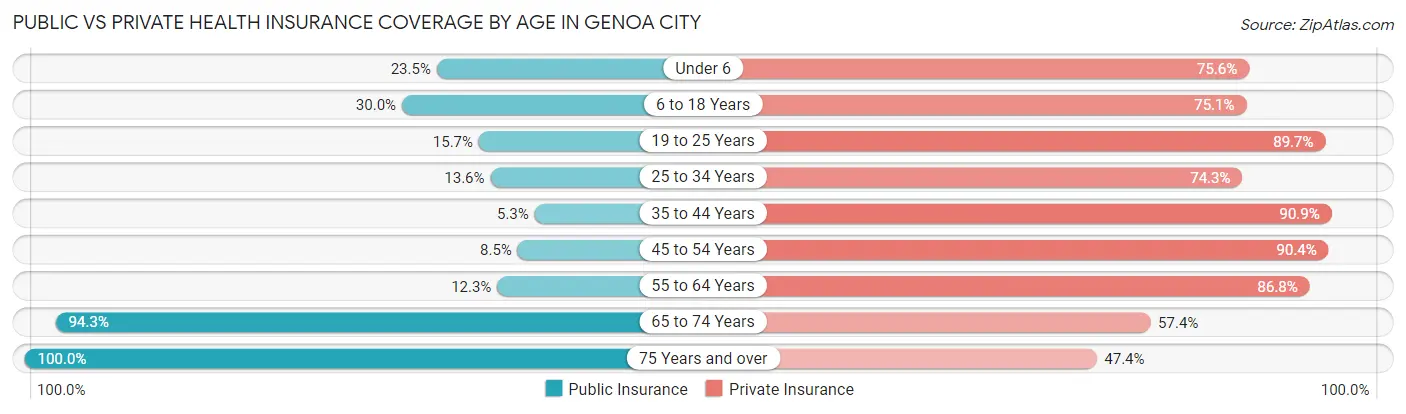
| Age Bracket | Public Insurance | Private Insurance |
| Under 6 | 51 (23.5%) | 164 (75.6%) |
| 6 to 18 Years | 196 (30.0%) | 491 (75.1%) |
| 19 to 25 Years | 29 (15.7%) | 166 (89.7%) |
| 25 to 34 Years | 66 (13.6%) | 362 (74.3%) |
| 35 to 44 Years | 24 (5.3%) | 409 (90.9%) |
| 45 to 54 Years | 29 (8.5%) | 309 (90.3%) |
| 55 to 64 Years | 41 (12.3%) | 290 (86.8%) |
| 65 to 74 Years | 197 (94.3%) | 120 (57.4%) |
| 75 Years and over | 78 (100.0%) | 37 (47.4%) |
| Total | 711 (24.0%) | 2,348 (79.4%) |
Disability Status by Sex by Age in Genoa City
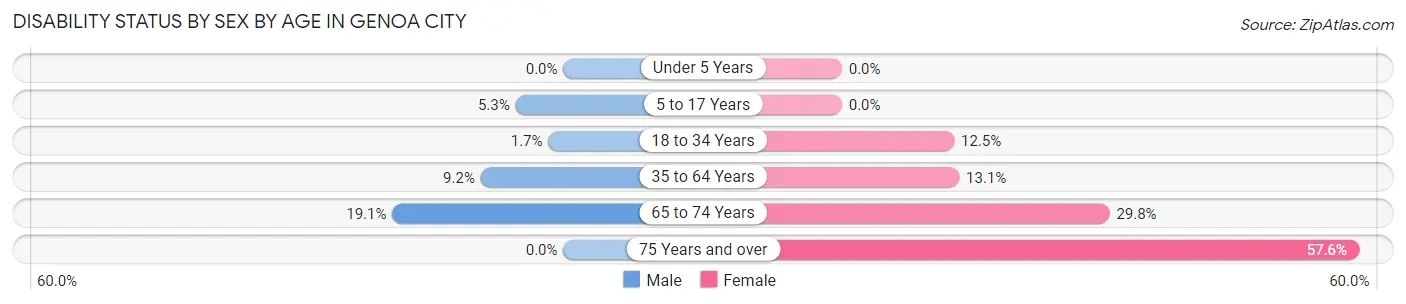
| Age Bracket | Male | Female |
| Under 5 Years | 0 (0.0%) | 0 (0.0%) |
| 5 to 17 Years | 21 (5.3%) | 0 (0.0%) |
| 18 to 34 Years | 6 (1.7%) | 39 (12.5%) |
| 35 to 64 Years | 55 (9.2%) | 69 (13.1%) |
| 65 to 74 Years | 20 (19.1%) | 31 (29.8%) |
| 75 Years and over | 0 (0.0%) | 38 (57.6%) |
Disability Class by Sex by Age in Genoa City
Disability Class: Hearing Difficulty
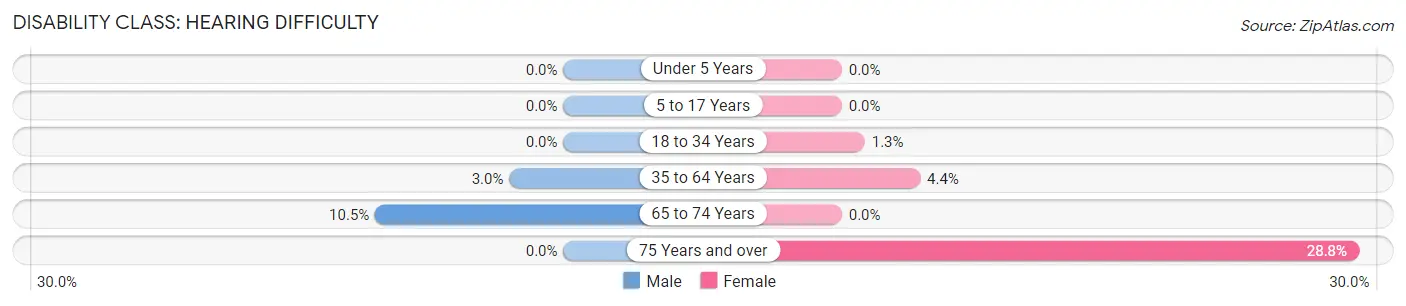
| Age Bracket | Male | Female |
| Under 5 Years | 0 (0.0%) | 0 (0.0%) |
| 5 to 17 Years | 0 (0.0%) | 0 (0.0%) |
| 18 to 34 Years | 0 (0.0%) | 4 (1.3%) |
| 35 to 64 Years | 18 (3.0%) | 23 (4.4%) |
| 65 to 74 Years | 11 (10.5%) | 0 (0.0%) |
| 75 Years and over | 0 (0.0%) | 19 (28.8%) |
Disability Class: Vision Difficulty
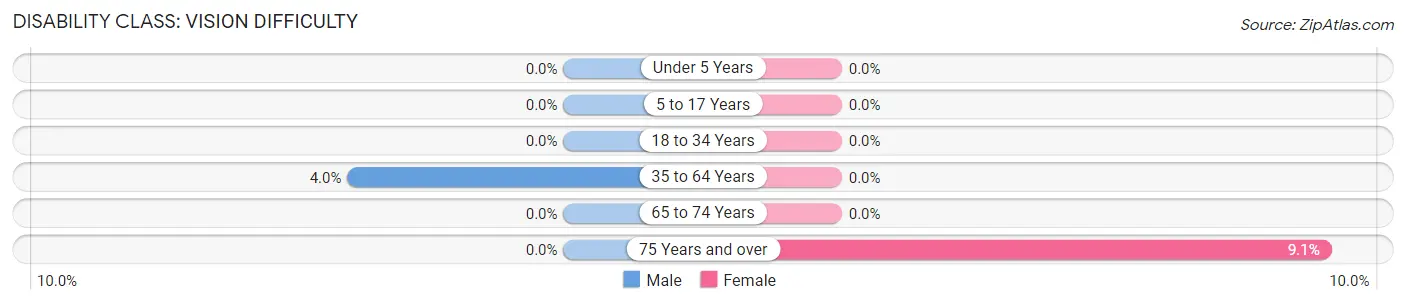
| Age Bracket | Male | Female |
| Under 5 Years | 0 (0.0%) | 0 (0.0%) |
| 5 to 17 Years | 0 (0.0%) | 0 (0.0%) |
| 18 to 34 Years | 0 (0.0%) | 0 (0.0%) |
| 35 to 64 Years | 24 (4.0%) | 0 (0.0%) |
| 65 to 74 Years | 0 (0.0%) | 0 (0.0%) |
| 75 Years and over | 0 (0.0%) | 6 (9.1%) |
Disability Class: Cognitive Difficulty
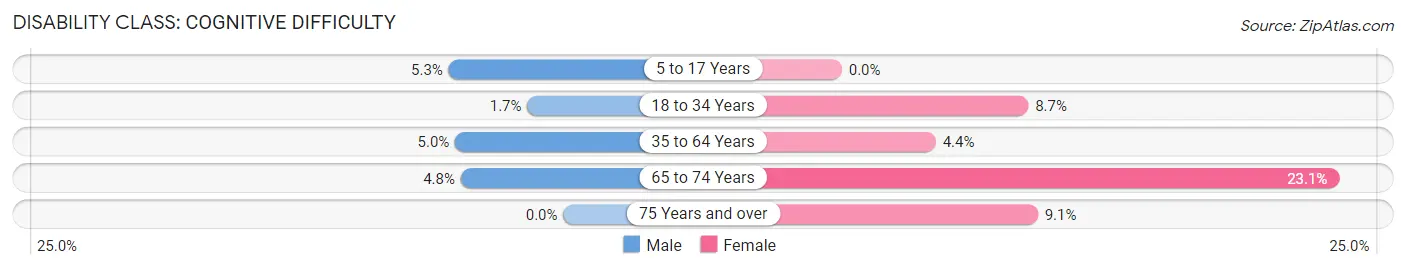
| Age Bracket | Male | Female |
| 5 to 17 Years | 21 (5.3%) | 0 (0.0%) |
| 18 to 34 Years | 6 (1.7%) | 27 (8.6%) |
| 35 to 64 Years | 30 (5.0%) | 23 (4.4%) |
| 65 to 74 Years | 5 (4.8%) | 24 (23.1%) |
| 75 Years and over | 0 (0.0%) | 6 (9.1%) |
Disability Class: Ambulatory Difficulty
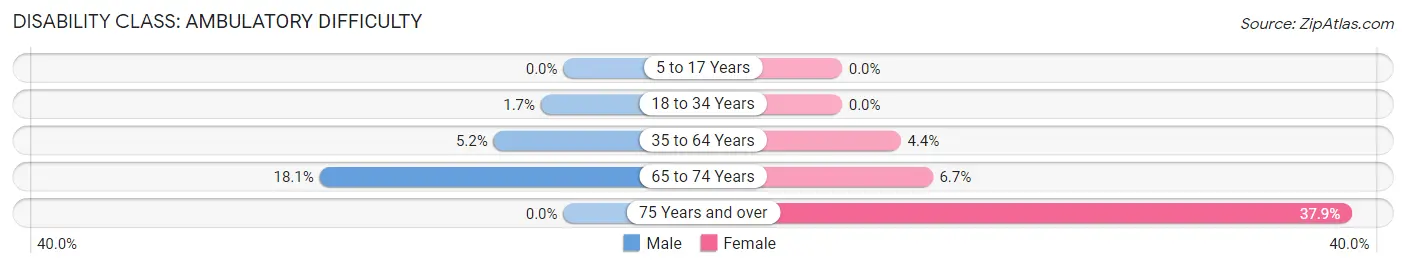
| Age Bracket | Male | Female |
| 5 to 17 Years | 0 (0.0%) | 0 (0.0%) |
| 18 to 34 Years | 6 (1.7%) | 0 (0.0%) |
| 35 to 64 Years | 31 (5.2%) | 23 (4.4%) |
| 65 to 74 Years | 19 (18.1%) | 7 (6.7%) |
| 75 Years and over | 0 (0.0%) | 25 (37.9%) |
Disability Class: Self-Care Difficulty
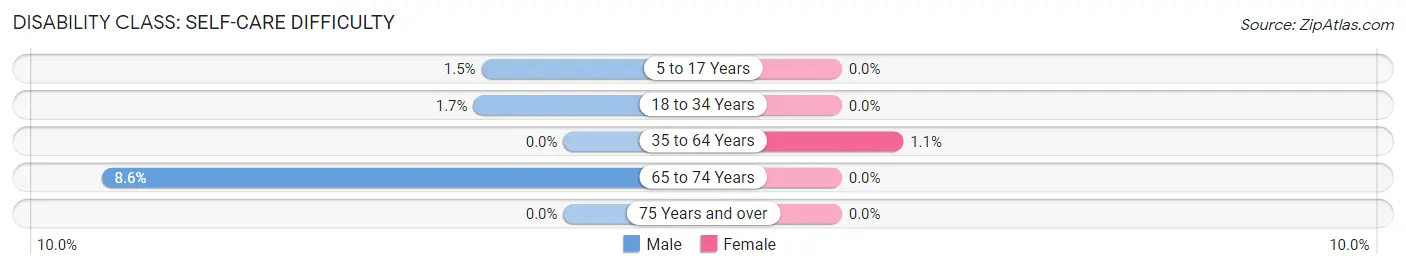
| Age Bracket | Male | Female |
| 5 to 17 Years | 6 (1.5%) | 0 (0.0%) |
| 18 to 34 Years | 6 (1.7%) | 0 (0.0%) |
| 35 to 64 Years | 0 (0.0%) | 6 (1.1%) |
| 65 to 74 Years | 9 (8.6%) | 0 (0.0%) |
| 75 Years and over | 0 (0.0%) | 0 (0.0%) |
Technology Access in Genoa City
Computing Device Access in Genoa City
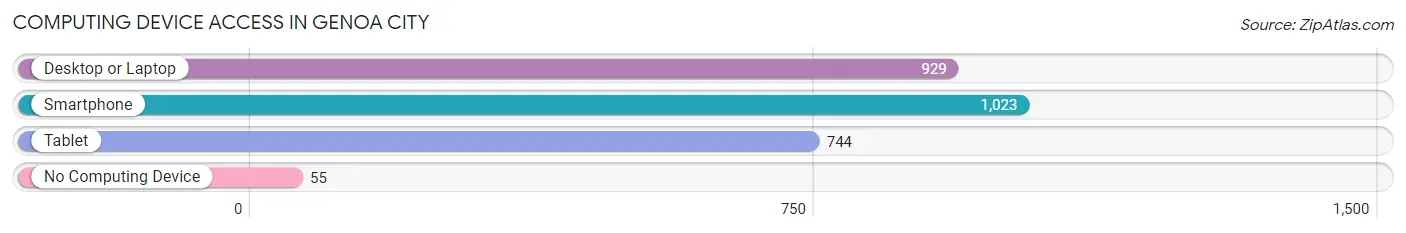
| Device Type | # Households | % Households |
| Desktop or Laptop | 929 | 83.8% |
| Smartphone | 1,023 | 92.2% |
| Tablet | 744 | 67.1% |
| No Computing Device | 55 | 5.0% |
| Total | 1,109 | 100.0% |
Internet Access in Genoa City
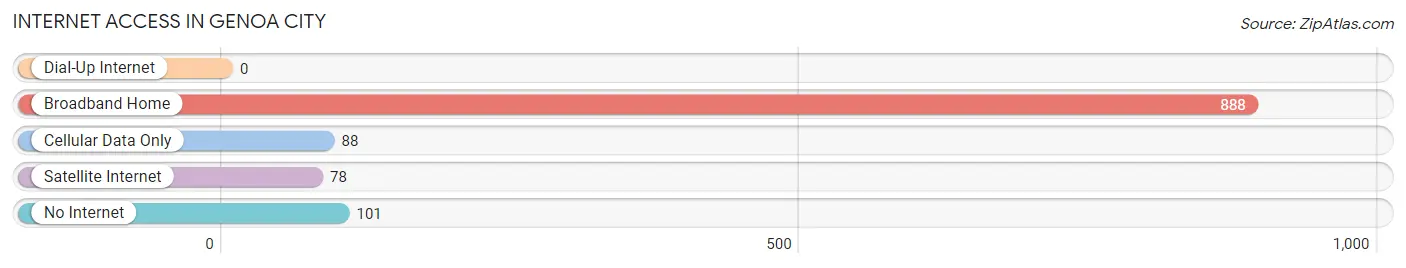
| Internet Type | # Households | % Households |
| Dial-Up Internet | 0 | 0.0% |
| Broadband Home | 888 | 80.1% |
| Cellular Data Only | 88 | 7.9% |
| Satellite Internet | 78 | 7.0% |
| No Internet | 101 | 9.1% |
| Total | 1,109 | 100.0% |
Genoa City Summary
Genoa City, Wisconsin is a small village located in Walworth County, Wisconsin. It is situated on the banks of the Fox River, about 25 miles southwest of Milwaukee. The village has a population of about 2,500 people and is part of the larger Lake Geneva-Genoa City Metropolitan Statistical Area.
History
Genoa City was founded in 1836 by a group of settlers from Genoa, New York. The settlers were attracted to the area by the abundance of natural resources, including timber, water, and fertile soil. The village was named after the city of Genoa in Italy.
In the late 19th century, Genoa City became a popular tourist destination due to its proximity to Lake Geneva. The village was home to several resorts, including the Genoa City Hotel, which was built in 1887. The hotel was a popular destination for wealthy tourists from Chicago and Milwaukee.
In the early 20th century, Genoa City experienced a period of growth and development. The village was incorporated in 1921 and the first mayor was elected in 1922. During this time, the village saw the construction of several new buildings, including a post office, a bank, and a library.
Geography
Genoa City is located in southeastern Wisconsin, about 25 miles southwest of Milwaukee. The village is situated on the banks of the Fox River, which flows through the village and into Lake Geneva. The village is surrounded by rolling hills and is home to several parks and nature preserves.
The climate in Genoa City is typical of the Midwest, with hot summers and cold winters. The average temperature in the summer is around 75 degrees Fahrenheit, while the average temperature in the winter is around 25 degrees Fahrenheit.
Economy
The economy of Genoa City is largely based on tourism and agriculture. The village is home to several resorts and hotels, which attract visitors from all over the Midwest. The village is also home to several farms, which produce a variety of crops, including corn, soybeans, and wheat.
In addition to tourism and agriculture, Genoa City is home to several small businesses, including restaurants, shops, and professional services. The village is also home to several manufacturing companies, which produce a variety of products, including furniture, clothing, and electronics.
Demographics
As of the 2010 census, the population of Genoa City was 2,500. The racial makeup of the village was 97.2% White, 0.8% African American, 0.4% Native American, 0.4% Asian, and 1.2% from other races. The median household income was $50,000, and the median age was 42.
Genoa City is a small, close-knit community. The village is home to several churches, schools, and community organizations. The village is also home to several festivals and events, including the Genoa City Days Festival, which is held every summer.
Common Questions
What is Per Capita Income in Genoa City?
Per Capita income in Genoa City is $34,791.
What is the Median Family Income in Genoa City?
Median Family Income in Genoa City is $88,095.
What is the Median Household income in Genoa City?
Median Household Income in Genoa City is $82,063.
What is Income or Wage Gap in Genoa City?
Income or Wage Gap in Genoa City is 32.7%.
Women in Genoa City earn 67.3 cents for every dollar earned by a man.
What is Inequality or Gini Index in Genoa City?
Inequality or Gini Index in Genoa City is 0.36.
What is the Total Population of Genoa City?
Total Population of Genoa City is 2,975.
What is the Total Male Population of Genoa City?
Total Male Population of Genoa City is 1,570.
What is the Total Female Population of Genoa City?
Total Female Population of Genoa City is 1,405.
What is the Ratio of Males per 100 Females in Genoa City?
There are 111.74 Males per 100 Females in Genoa City.
What is the Ratio of Females per 100 Males in Genoa City?
There are 89.49 Females per 100 Males in Genoa City.
What is the Median Population Age in Genoa City?
Median Population Age in Genoa City is 33.7 Years.
What is the Average Family Size in Genoa City
Average Family Size in Genoa City is 3.1 People.
What is the Average Household Size in Genoa City
Average Household Size in Genoa City is 2.6 People.
How Large is the Labor Force in Genoa City?
There are 1,663 People in the Labor Forcein in Genoa City.
What is the Percentage of People in the Labor Force in Genoa City?
77.4% of People are in the Labor Force in Genoa City.
What is the Unemployment Rate in Genoa City?
Unemployment Rate in Genoa City is 4.9%.