Cascade, WI Map & Demographics
Cascade Map
Cascade Overview
$42,024
PER CAPITA INCOME
$97,188
AVG FAMILY INCOME
$81,806
AVG HOUSEHOLD INCOME
40.5%
WAGE / INCOME GAP [ % ]
59.5¢/ $1
WAGE / INCOME GAP [ $ ]
0.39
INEQUALITY / GINI INDEX
650
TOTAL POPULATION
336
MALE POPULATION
314
FEMALE POPULATION
107.01
MALES / 100 FEMALES
93.45
FEMALES / 100 MALES
44.1
MEDIAN AGE
2.9
AVG FAMILY SIZE
2.4
AVG HOUSEHOLD SIZE
372
LABOR FORCE [ PEOPLE ]
72.1%
PERCENT IN LABOR FORCE
0.8%
UNEMPLOYMENT RATE
Cascade Zip Codes
Cascade Area Codes
Income in Cascade
Income Overview in Cascade
Per Capita Income in Cascade is $42,024, while median incomes of families and households are $97,188 and $81,806 respectively.
| Characteristic | Number | Measure |
| Per Capita Income | 650 | $42,024 |
| Median Family Income | 191 | $97,188 |
| Mean Family Income | 191 | $91,274 |
| Median Household Income | 267 | $81,806 |
| Mean Household Income | 267 | $98,688 |
| Income Deficit | 191 | $0 |
| Wage / Income Gap (%) | 650 | 40.46% |
| Wage / Income Gap ($) | 650 | 59.54¢ per $1 |
| Gini / Inequality Index | 650 | 0.39 |
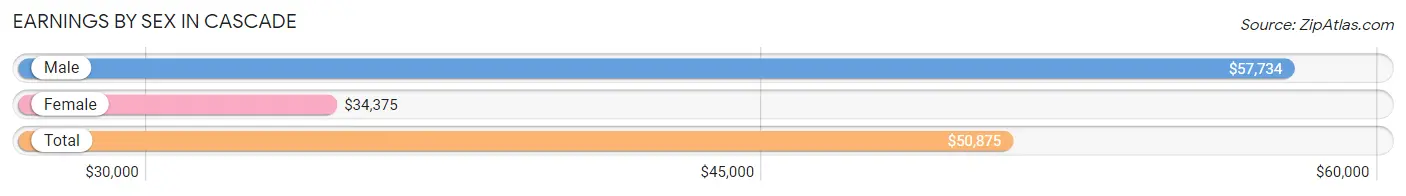
Earnings by Sex in Cascade
Average Earnings in Cascade are $50,875, $57,734 for men and $34,375 for women, a difference of 40.5%.
| Sex | Number | Average Earnings |
| Male | 221 (58.3%) | $57,734 |
| Female | 158 (41.7%) | $34,375 |
| Total | 379 (100.0%) | $50,875 |
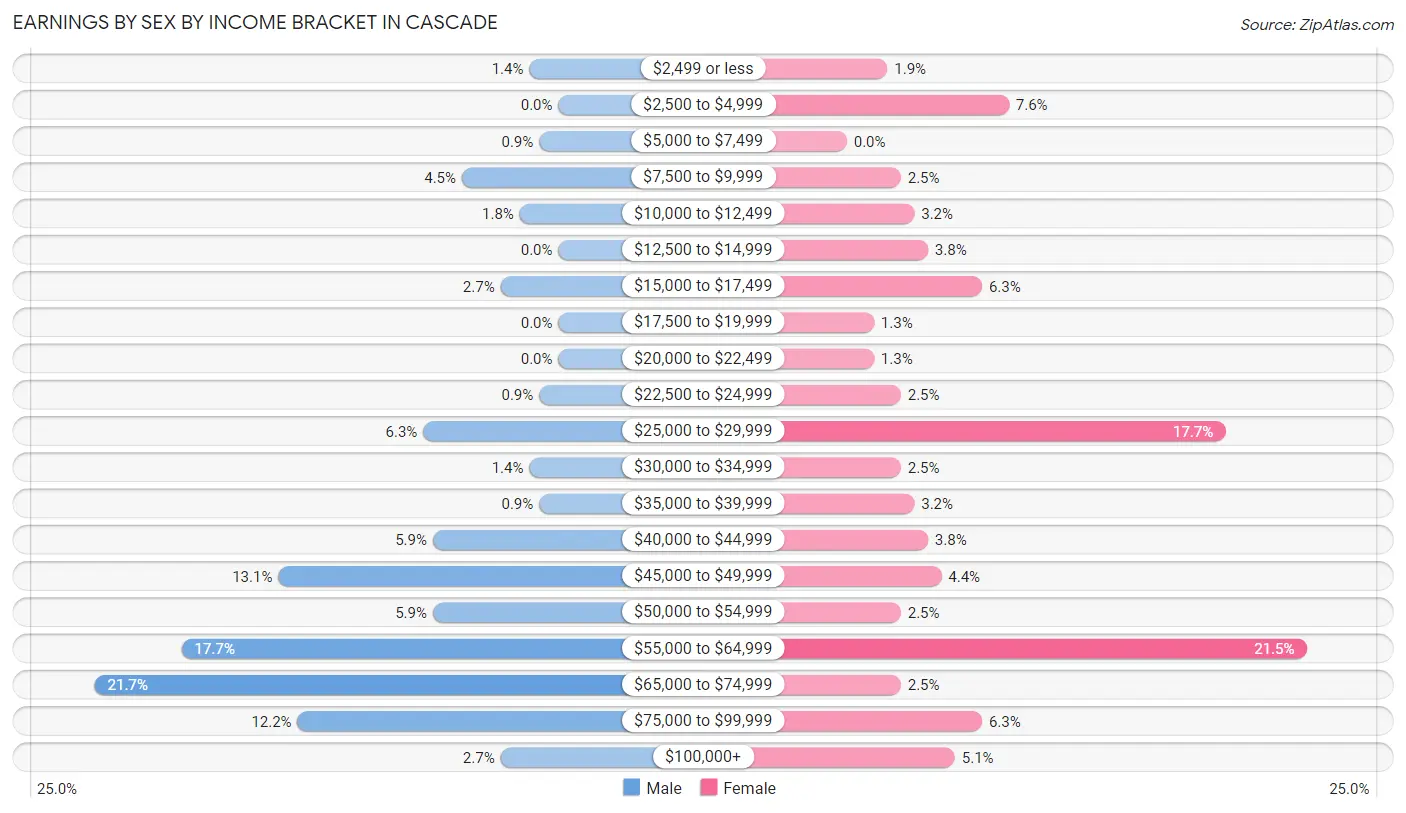
Earnings by Sex by Income Bracket in Cascade
The most common earnings brackets in Cascade are $65,000 to $74,999 for men (48 | 21.7%) and $55,000 to $64,999 for women (34 | 21.5%).
| Income | Male | Female |
| $2,499 or less | 3 (1.4%) | 3 (1.9%) |
| $2,500 to $4,999 | 0 (0.0%) | 12 (7.6%) |
| $5,000 to $7,499 | 2 (0.9%) | 0 (0.0%) |
| $7,500 to $9,999 | 10 (4.5%) | 4 (2.5%) |
| $10,000 to $12,499 | 4 (1.8%) | 5 (3.2%) |
| $12,500 to $14,999 | 0 (0.0%) | 6 (3.8%) |
| $15,000 to $17,499 | 6 (2.7%) | 10 (6.3%) |
| $17,500 to $19,999 | 0 (0.0%) | 2 (1.3%) |
| $20,000 to $22,499 | 0 (0.0%) | 2 (1.3%) |
| $22,500 to $24,999 | 2 (0.9%) | 4 (2.5%) |
| $25,000 to $29,999 | 14 (6.3%) | 28 (17.7%) |
| $30,000 to $34,999 | 3 (1.4%) | 4 (2.5%) |
| $35,000 to $39,999 | 2 (0.9%) | 5 (3.2%) |
| $40,000 to $44,999 | 13 (5.9%) | 6 (3.8%) |
| $45,000 to $49,999 | 29 (13.1%) | 7 (4.4%) |
| $50,000 to $54,999 | 13 (5.9%) | 4 (2.5%) |
| $55,000 to $64,999 | 39 (17.6%) | 34 (21.5%) |
| $65,000 to $74,999 | 48 (21.7%) | 4 (2.5%) |
| $75,000 to $99,999 | 27 (12.2%) | 10 (6.3%) |
| $100,000+ | 6 (2.7%) | 8 (5.1%) |
| Total | 221 (100.0%) | 158 (100.0%) |
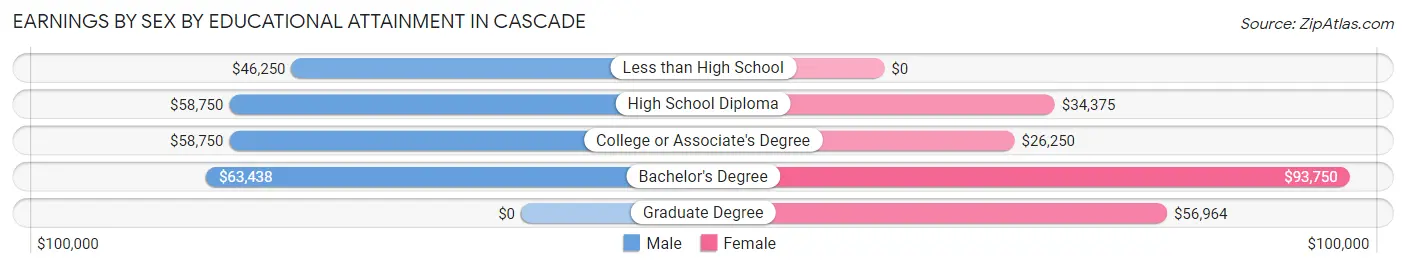
Earnings by Sex by Educational Attainment in Cascade
Average earnings in Cascade are $58,281 for men and $39,000 for women, a difference of 33.1%. Men with an educational attainment of bachelor's degree enjoy the highest average annual earnings of $63,438, while those with less than high school education earn the least with $46,250. Women with an educational attainment of bachelor's degree earn the most with the average annual earnings of $93,750, while those with college or associate's degree education have the smallest earnings of $26,250.
| Educational Attainment | Male Income | Female Income |
| Less than High School | $46,250 | $0 |
| High School Diploma | $58,750 | $34,375 |
| College or Associate's Degree | $58,750 | $26,250 |
| Bachelor's Degree | $63,438 | $93,750 |
| Graduate Degree | - | - |
| Total | $58,281 | $39,000 |
Family Income in Cascade
Family Income Brackets in Cascade
According to the Cascade family income data, there are 75 families falling into the $100,000 to $149,999 income range, which is the most common income bracket and makes up 39.3% of all families.
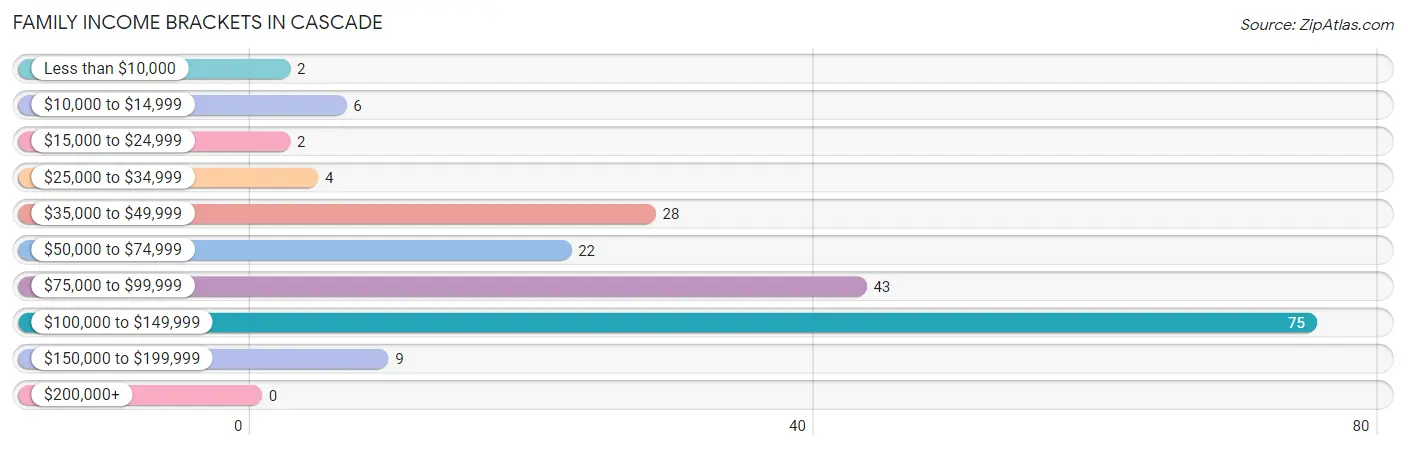
| Income Bracket | # Families | % Families |
| Less than $10,000 | 2 | 1.0% |
| $10,000 to $14,999 | 6 | 3.1% |
| $15,000 to $24,999 | 2 | 1.0% |
| $25,000 to $34,999 | 4 | 2.1% |
| $35,000 to $49,999 | 28 | 14.7% |
| $50,000 to $74,999 | 22 | 11.5% |
| $75,000 to $99,999 | 43 | 22.5% |
| $100,000 to $149,999 | 75 | 39.3% |
| $150,000 to $199,999 | 9 | 4.7% |
| $200,000+ | 0 | 0.0% |
Family Income by Famaliy Size in Cascade
4-person families (26 | 13.6%) account for the highest median family income in Cascade with $118,438 per family, while 2-person families (100 | 52.4%) have the highest median income of $39,375 per family member.
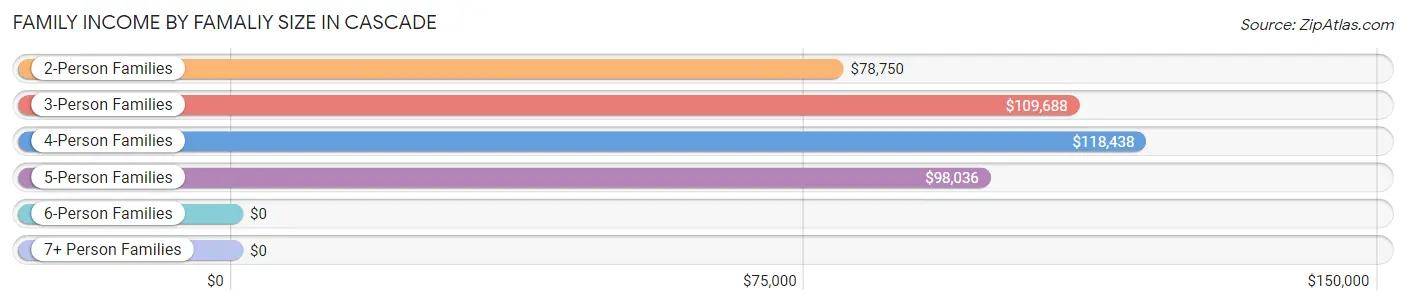
| Income Bracket | # Families | Median Income |
| 2-Person Families | 100 (52.4%) | $78,750 |
| 3-Person Families | 46 (24.1%) | $109,688 |
| 4-Person Families | 26 (13.6%) | $118,438 |
| 5-Person Families | 19 (10.0%) | $98,036 |
| 6-Person Families | 0 (0.0%) | $0 |
| 7+ Person Families | 0 (0.0%) | $0 |
| Total | 191 (100.0%) | $97,188 |
Family Income by Number of Earners in Cascade
The median family income in Cascade is $97,188, with families comprising 3+ earners (22) having the highest median family income of $125,714, while families with no earners (33) have the lowest median family income of $48,558, accounting for 11.5% and 17.3% of families, respectively.
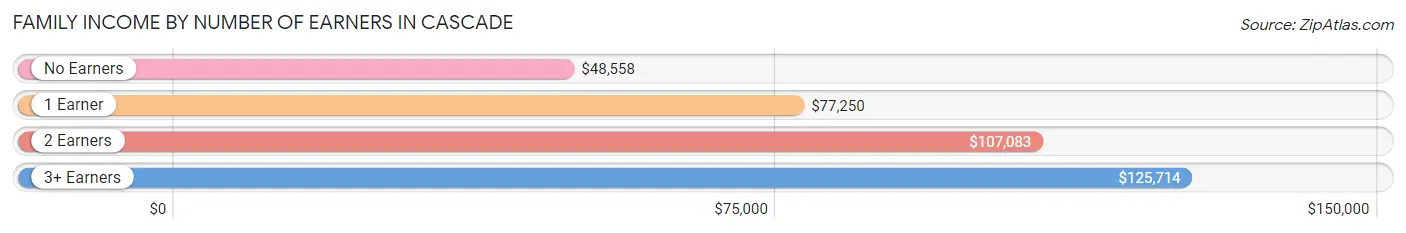
| Number of Earners | # Families | Median Income |
| No Earners | 33 (17.3%) | $48,558 |
| 1 Earner | 37 (19.4%) | $77,250 |
| 2 Earners | 99 (51.8%) | $107,083 |
| 3+ Earners | 22 (11.5%) | $125,714 |
| Total | 191 (100.0%) | $97,188 |
Household Income in Cascade
Household Income Brackets in Cascade
With 78 households falling in the category, the $100,000 to $149,999 income range is the most frequent in Cascade, accounting for 29.2% of all households. In contrast, only 3 households (1.1%) fall into the less than $10,000 income bracket, making it the least populous group.
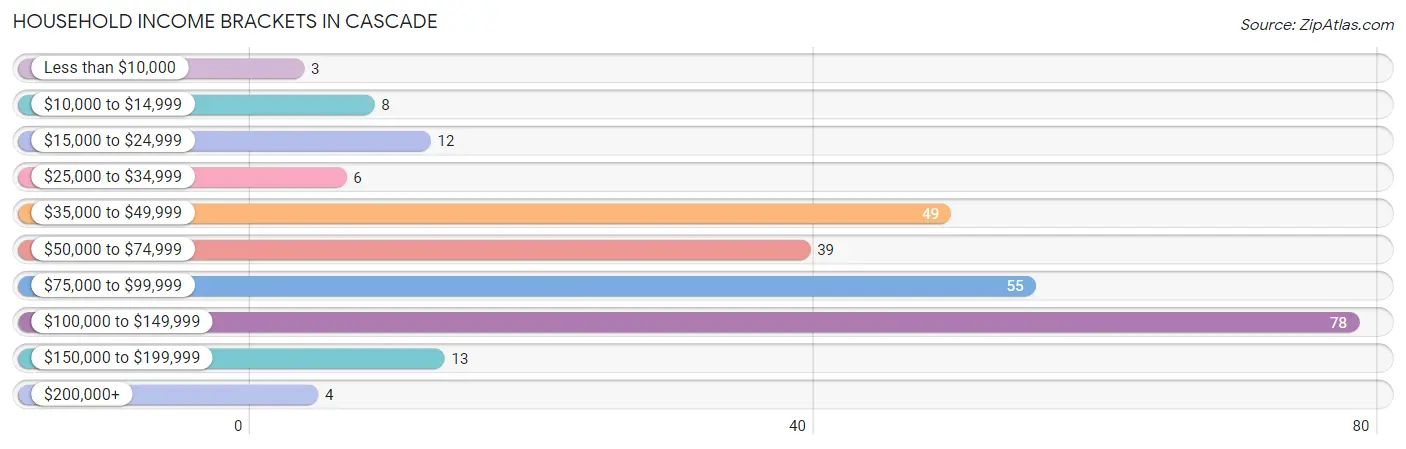
| Income Bracket | # Households | % Households |
| Less than $10,000 | 3 | 1.1% |
| $10,000 to $14,999 | 8 | 3.0% |
| $15,000 to $24,999 | 12 | 4.5% |
| $25,000 to $34,999 | 6 | 2.2% |
| $35,000 to $49,999 | 49 | 18.4% |
| $50,000 to $74,999 | 39 | 14.6% |
| $75,000 to $99,999 | 55 | 20.6% |
| $100,000 to $149,999 | 78 | 29.2% |
| $150,000 to $199,999 | 13 | 4.9% |
| $200,000+ | 4 | 1.5% |
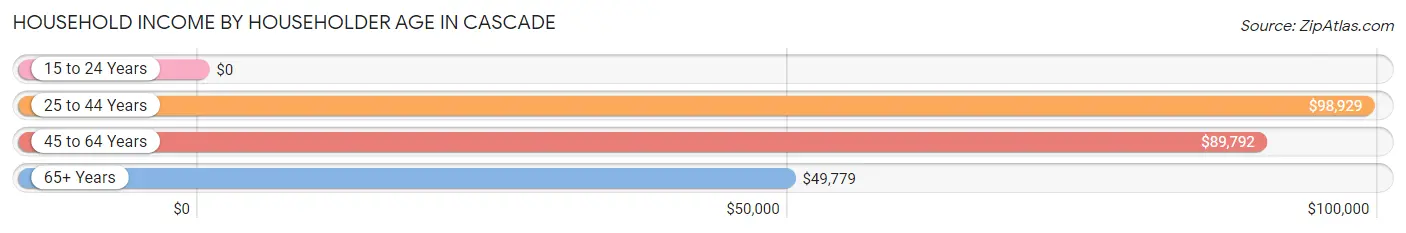
Household Income by Householder Age in Cascade
The median household income in Cascade is $81,806, with the highest median household income of $98,929 found in the 25 to 44 years age bracket for the primary householder. A total of 68 households (25.5%) fall into this category. Meanwhile, the 15 to 24 years age bracket for the primary householder has the lowest median household income of $0, with 3 households (1.1%) in this group.
| Income Bracket | # Households | Median Income |
| 15 to 24 Years | 3 (1.1%) | $0 |
| 25 to 44 Years | 68 (25.5%) | $98,929 |
| 45 to 64 Years | 119 (44.6%) | $89,792 |
| 65+ Years | 77 (28.8%) | $49,779 |
| Total | 267 (100.0%) | $81,806 |
Poverty in Cascade
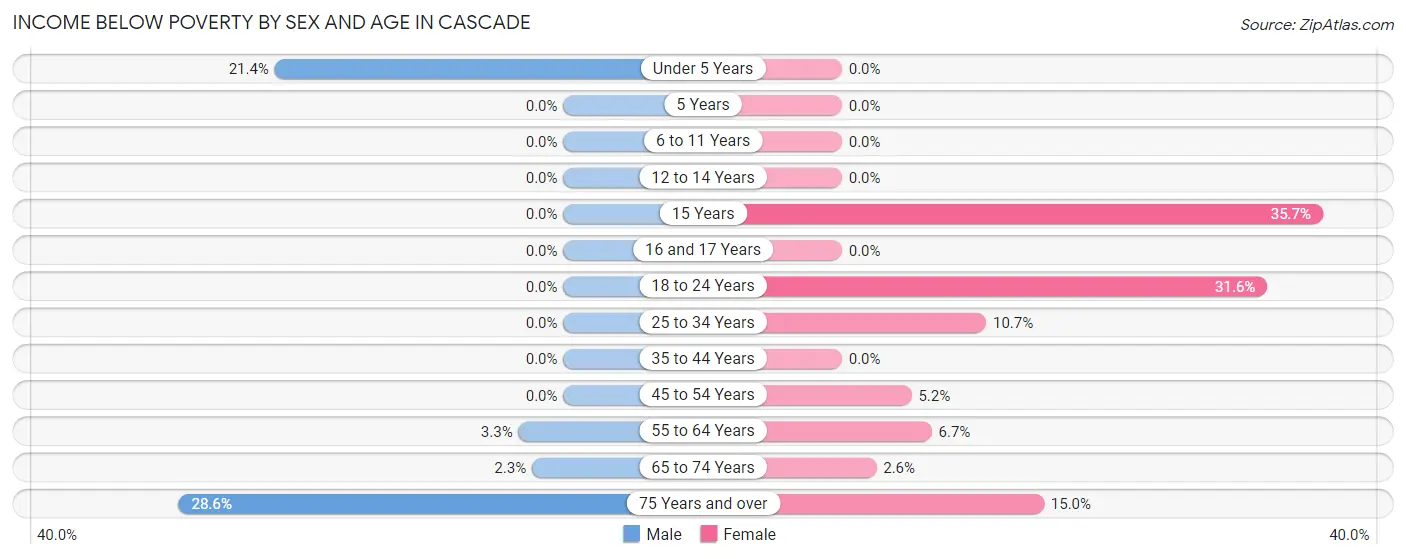
Income Below Poverty by Sex and Age in Cascade
With 2.4% poverty level for males and 7.3% for females among the residents of Cascade, 75 year old and over males and 15 year old females are the most vulnerable to poverty, with 2 males (28.6%) and 5 females (35.7%) in their respective age groups living below the poverty level.
| Age Bracket | Male | Female |
| Under 5 Years | 3 (21.4%) | 0 (0.0%) |
| 5 Years | 0 (0.0%) | 0 (0.0%) |
| 6 to 11 Years | 0 (0.0%) | 0 (0.0%) |
| 12 to 14 Years | 0 (0.0%) | 0 (0.0%) |
| 15 Years | 0 (0.0%) | 5 (35.7%) |
| 16 and 17 Years | 0 (0.0%) | 0 (0.0%) |
| 18 to 24 Years | 0 (0.0%) | 6 (31.6%) |
| 25 to 34 Years | 0 (0.0%) | 3 (10.7%) |
| 35 to 44 Years | 0 (0.0%) | 0 (0.0%) |
| 45 to 54 Years | 0 (0.0%) | 3 (5.2%) |
| 55 to 64 Years | 2 (3.3%) | 2 (6.7%) |
| 65 to 74 Years | 1 (2.3%) | 1 (2.6%) |
| 75 Years and over | 2 (28.6%) | 3 (15.0%) |
| Total | 8 (2.4%) | 23 (7.3%) |
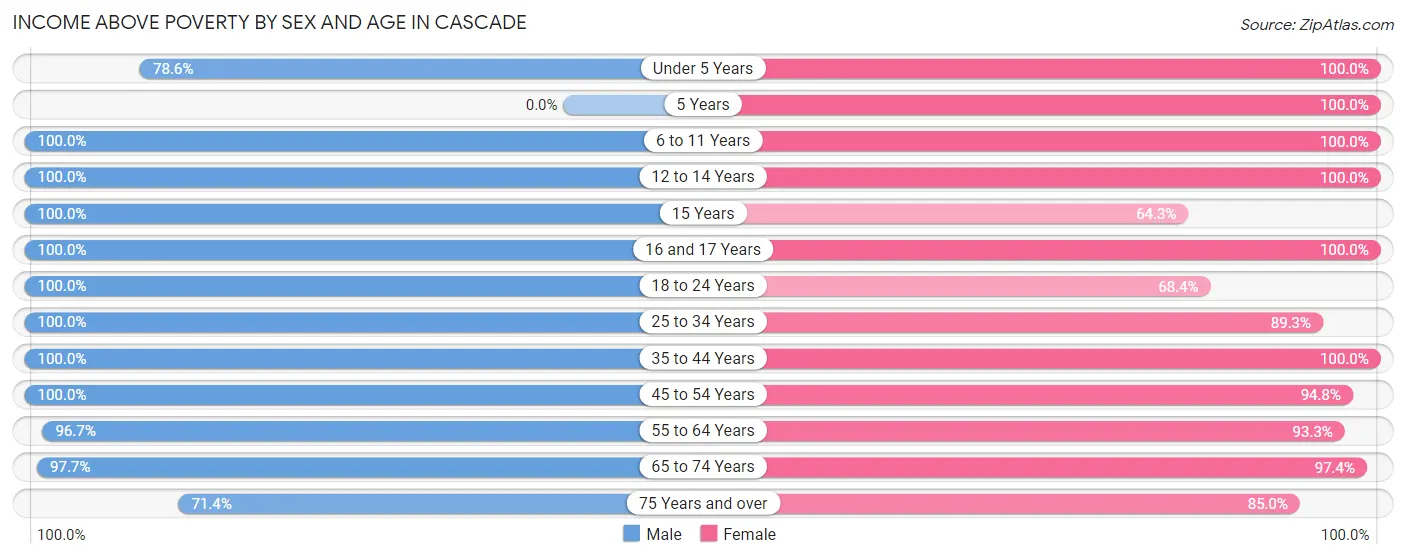
Income Above Poverty by Sex and Age in Cascade
According to the poverty statistics in Cascade, males aged 6 to 11 years and females aged under 5 years are the age groups that are most secure financially, with 100.0% of males and 100.0% of females in these age groups living above the poverty line.
| Age Bracket | Male | Female |
| Under 5 Years | 11 (78.6%) | 11 (100.0%) |
| 5 Years | 0 (0.0%) | 1 (100.0%) |
| 6 to 11 Years | 18 (100.0%) | 30 (100.0%) |
| 12 to 14 Years | 22 (100.0%) | 17 (100.0%) |
| 15 Years | 7 (100.0%) | 9 (64.3%) |
| 16 and 17 Years | 5 (100.0%) | 8 (100.0%) |
| 18 to 24 Years | 15 (100.0%) | 13 (68.4%) |
| 25 to 34 Years | 37 (100.0%) | 25 (89.3%) |
| 35 to 44 Years | 48 (100.0%) | 39 (100.0%) |
| 45 to 54 Years | 60 (100.0%) | 55 (94.8%) |
| 55 to 64 Years | 58 (96.7%) | 28 (93.3%) |
| 65 to 74 Years | 42 (97.7%) | 38 (97.4%) |
| 75 Years and over | 5 (71.4%) | 17 (85.0%) |
| Total | 328 (97.6%) | 291 (92.7%) |
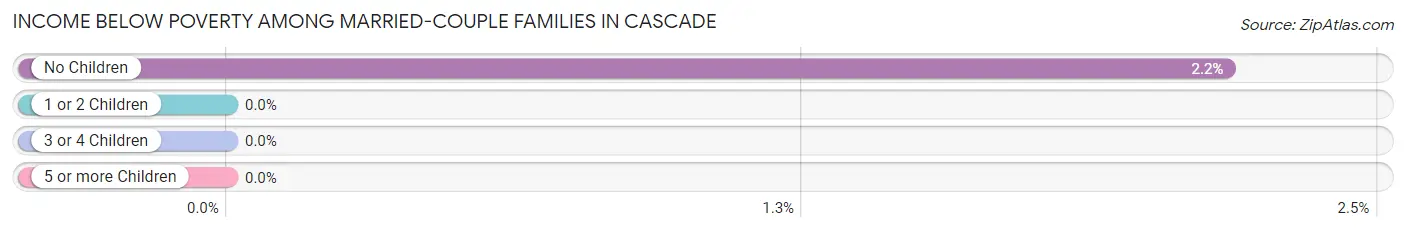
Income Below Poverty Among Married-Couple Families in Cascade
The poverty statistics for married-couple families in Cascade show that 1.3% or 2 of the total 156 families live below the poverty line. Families with no children have the highest poverty rate of 2.2%, comprising of 2 families. On the other hand, families with 1 or 2 children have the lowest poverty rate of 0.0%, which includes 0 families.
| Children | Above Poverty | Below Poverty |
| No Children | 90 (97.8%) | 2 (2.2%) |
| 1 or 2 Children | 51 (100.0%) | 0 (0.0%) |
| 3 or 4 Children | 13 (100.0%) | 0 (0.0%) |
| 5 or more Children | 0 (0.0%) | 0 (0.0%) |
| Total | 154 (98.7%) | 2 (1.3%) |
Income Below Poverty Among Single-Parent Households in Cascade
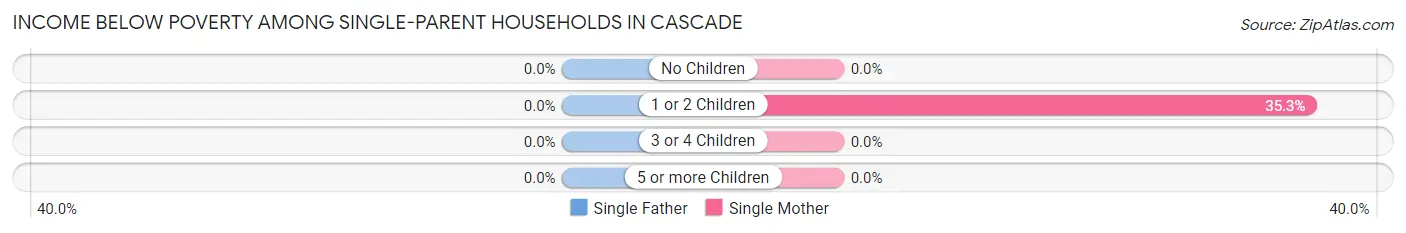
| Children | Single Father | Single Mother |
| No Children | 0 (0.0%) | 0 (0.0%) |
| 1 or 2 Children | 0 (0.0%) | 6 (35.3%) |
| 3 or 4 Children | 0 (0.0%) | 0 (0.0%) |
| 5 or more Children | 0 (0.0%) | 0 (0.0%) |
| Total | 0 (0.0%) | 6 (25.0%) |
Income Below Poverty Among Married-Couple vs Single-Parent Households in Cascade
The poverty data for Cascade shows that 2 of the married-couple family households (1.3%) and 6 of the single-parent households (17.1%) are living below the poverty level. Within the married-couple family households, those with no children have the highest poverty rate, with 2 households (2.2%) falling below the poverty line. Among the single-parent households, those with 1 or 2 children have the highest poverty rate, with 6 household (30.0%) living below poverty.
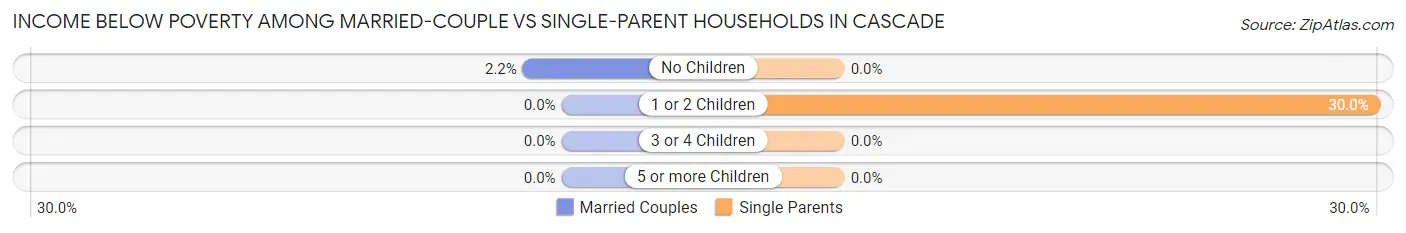
| Children | Married-Couple Families | Single-Parent Households |
| No Children | 2 (2.2%) | 0 (0.0%) |
| 1 or 2 Children | 0 (0.0%) | 6 (30.0%) |
| 3 or 4 Children | 0 (0.0%) | 0 (0.0%) |
| 5 or more Children | 0 (0.0%) | 0 (0.0%) |
| Total | 2 (1.3%) | 6 (17.1%) |
Race in Cascade
The most populous races in Cascade are White / Caucasian (610 | 93.9%), Two or more Races (26 | 4.0%), and Hispanic or Latino (18 | 2.8%).
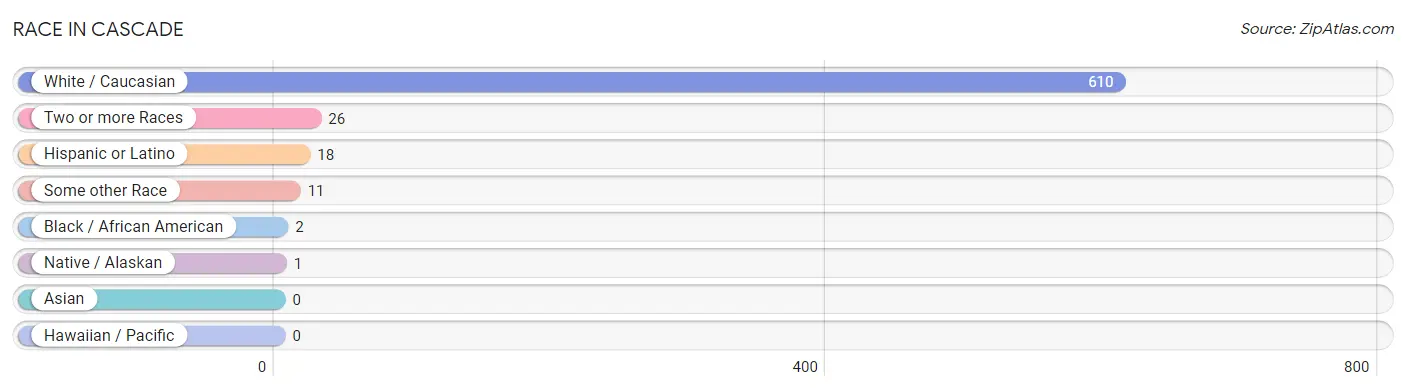
| Race | # Population | % Population |
| Asian | 0 | 0.0% |
| Black / African American | 2 | 0.3% |
| Hawaiian / Pacific | 0 | 0.0% |
| Hispanic or Latino | 18 | 2.8% |
| Native / Alaskan | 1 | 0.2% |
| White / Caucasian | 610 | 93.9% |
| Two or more Races | 26 | 4.0% |
| Some other Race | 11 | 1.7% |
| Total | 650 | 100.0% |
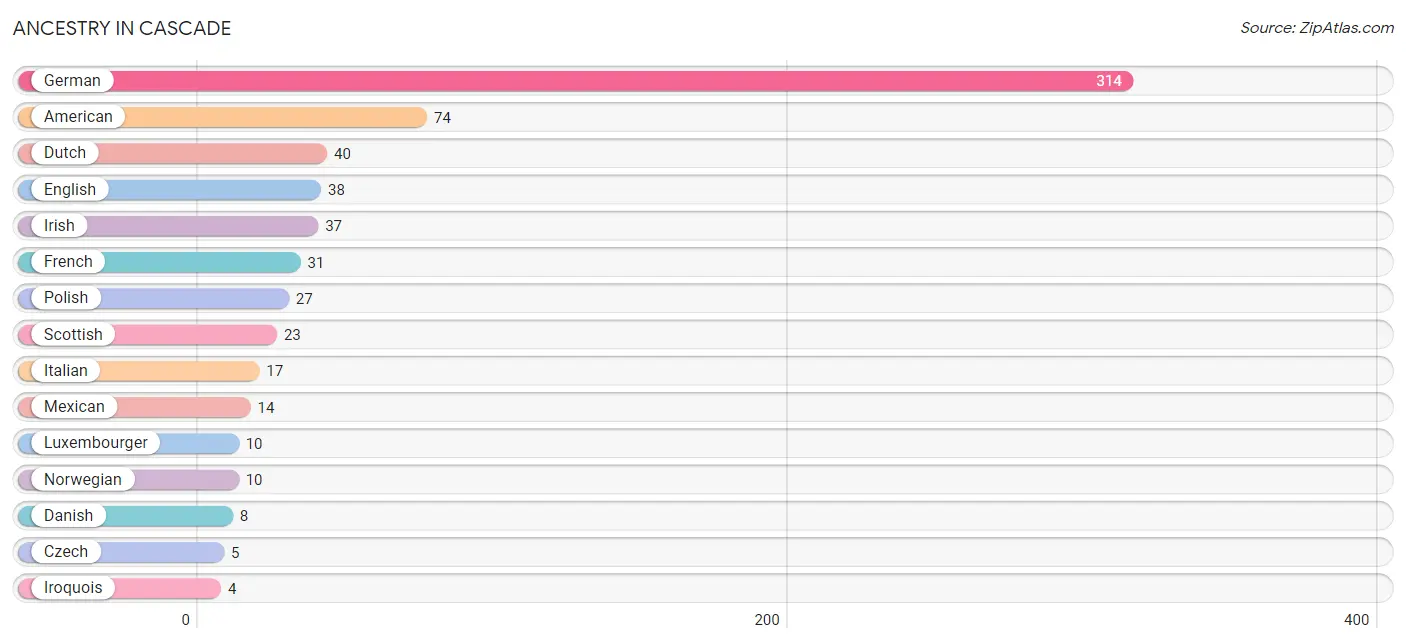
Ancestry in Cascade
The most populous ancestries reported in Cascade are German (314 | 48.3%), American (74 | 11.4%), Dutch (40 | 6.1%), English (38 | 5.9%), and Irish (37 | 5.7%), together accounting for 77.4% of all Cascade residents.
| Ancestry | # Population | % Population |
| American | 74 | 11.4% |
| Canadian | 1 | 0.2% |
| Central American | 1 | 0.2% |
| Central American Indian | 1 | 0.2% |
| Chippewa | 3 | 0.5% |
| Cuban | 3 | 0.5% |
| Czech | 5 | 0.8% |
| Danish | 8 | 1.2% |
| Dutch | 40 | 6.1% |
| English | 38 | 5.9% |
| European | 2 | 0.3% |
| Finnish | 1 | 0.2% |
| French | 31 | 4.8% |
| French Canadian | 3 | 0.5% |
| German | 314 | 48.3% |
| Honduran | 1 | 0.2% |
| Hungarian | 1 | 0.2% |
| Irish | 37 | 5.7% |
| Iroquois | 4 | 0.6% |
| Italian | 17 | 2.6% |
| Luxembourger | 10 | 1.5% |
| Mexican | 14 | 2.1% |
| Norwegian | 10 | 1.5% |
| Polish | 27 | 4.2% |
| Russian | 3 | 0.5% |
| Scottish | 23 | 3.5% |
| Slovene | 3 | 0.5% |
| Swedish | 2 | 0.3% | View All 28 Rows |
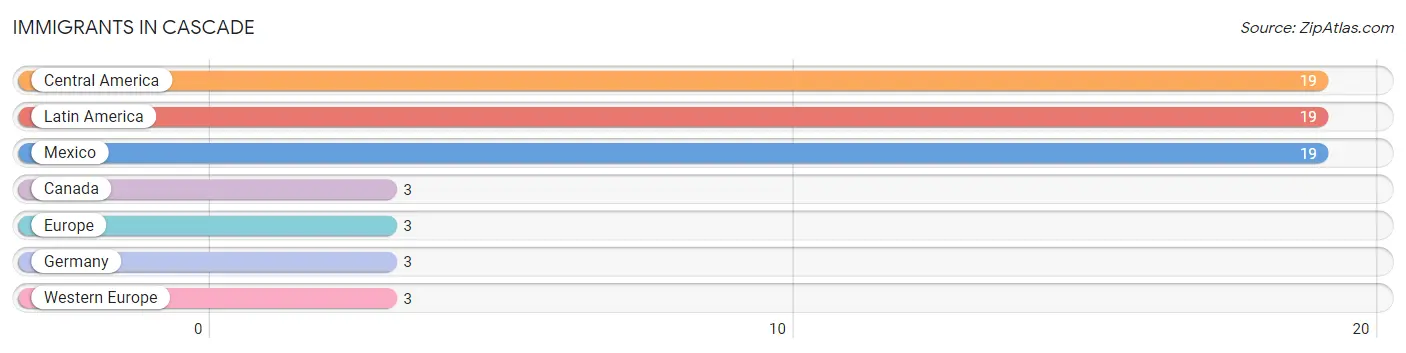
Immigrants in Cascade
The most numerous immigrant groups reported in Cascade came from Central America (19 | 2.9%), Latin America (19 | 2.9%), Mexico (19 | 2.9%), Canada (3 | 0.5%), and Europe (3 | 0.5%), together accounting for 9.7% of all Cascade residents.
| Immigration Origin | # Population | % Population |
| Canada | 3 | 0.5% |
| Central America | 19 | 2.9% |
| Europe | 3 | 0.5% |
| Germany | 3 | 0.5% |
| Latin America | 19 | 2.9% |
| Mexico | 19 | 2.9% |
| Western Europe | 3 | 0.5% | View All 7 Rows |
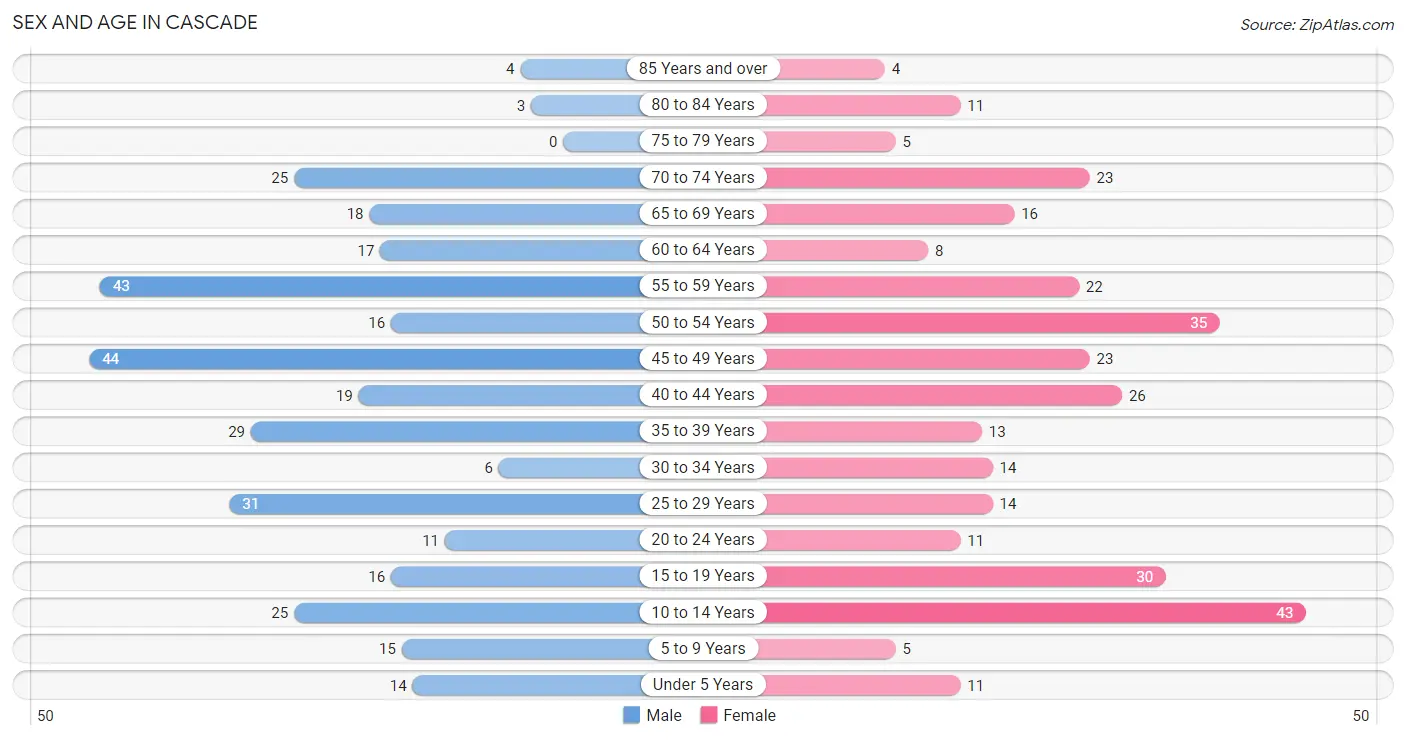
Sex and Age in Cascade
Sex and Age in Cascade
The most populous age groups in Cascade are 45 to 49 Years (44 | 13.1%) for men and 10 to 14 Years (43 | 13.7%) for women.
| Age Bracket | Male | Female |
| Under 5 Years | 14 (4.2%) | 11 (3.5%) |
| 5 to 9 Years | 15 (4.5%) | 5 (1.6%) |
| 10 to 14 Years | 25 (7.4%) | 43 (13.7%) |
| 15 to 19 Years | 16 (4.8%) | 30 (9.6%) |
| 20 to 24 Years | 11 (3.3%) | 11 (3.5%) |
| 25 to 29 Years | 31 (9.2%) | 14 (4.5%) |
| 30 to 34 Years | 6 (1.8%) | 14 (4.5%) |
| 35 to 39 Years | 29 (8.6%) | 13 (4.1%) |
| 40 to 44 Years | 19 (5.7%) | 26 (8.3%) |
| 45 to 49 Years | 44 (13.1%) | 23 (7.3%) |
| 50 to 54 Years | 16 (4.8%) | 35 (11.2%) |
| 55 to 59 Years | 43 (12.8%) | 22 (7.0%) |
| 60 to 64 Years | 17 (5.1%) | 8 (2.5%) |
| 65 to 69 Years | 18 (5.4%) | 16 (5.1%) |
| 70 to 74 Years | 25 (7.4%) | 23 (7.3%) |
| 75 to 79 Years | 0 (0.0%) | 5 (1.6%) |
| 80 to 84 Years | 3 (0.9%) | 11 (3.5%) |
| 85 Years and over | 4 (1.2%) | 4 (1.3%) |
| Total | 336 (100.0%) | 314 (100.0%) |
Families and Households in Cascade
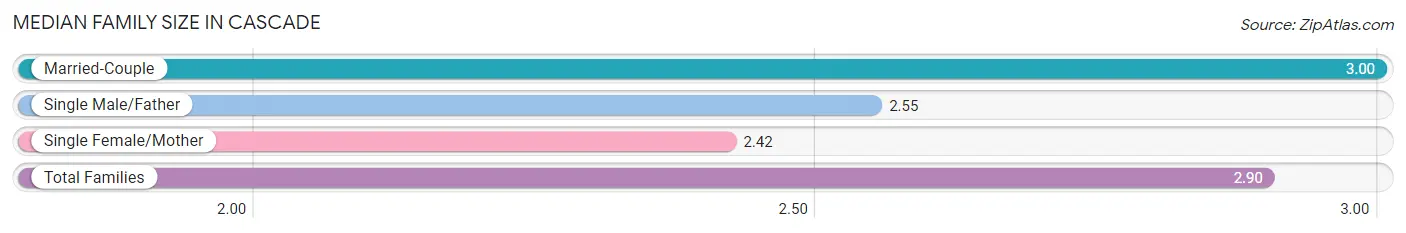
Median Family Size in Cascade
The median family size in Cascade is 2.90 persons per family, with married-couple families (156 | 81.7%) accounting for the largest median family size of 3 persons per family. On the other hand, single female/mother families (24 | 12.6%) represent the smallest median family size with 2.42 persons per family.
| Family Type | # Families | Family Size |
| Married-Couple | 156 (81.7%) | 3.00 |
| Single Male/Father | 11 (5.8%) | 2.55 |
| Single Female/Mother | 24 (12.6%) | 2.42 |
| Total Families | 191 (100.0%) | 2.90 |
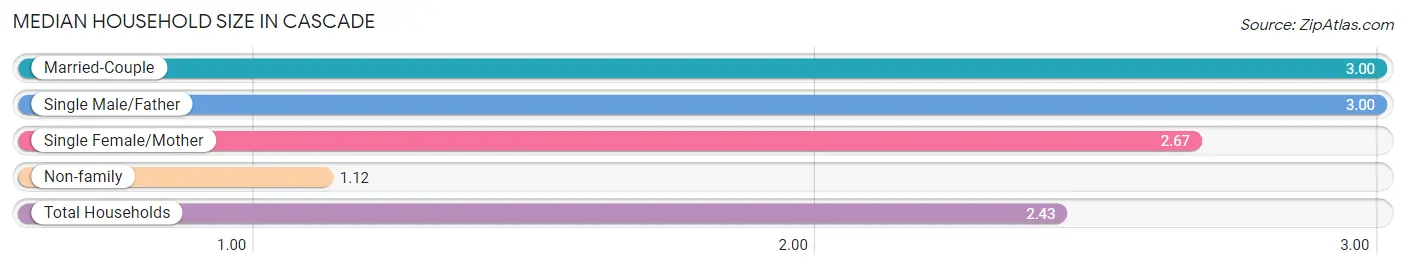
Median Household Size in Cascade
The median household size in Cascade is 2.43 persons per household, with married-couple households (156 | 58.4%) accounting for the largest median household size of 3 persons per household. non-family households (76 | 28.5%) represent the smallest median household size with 1.12 persons per household.
| Household Type | # Households | Household Size |
| Married-Couple | 156 (58.4%) | 3.00 |
| Single Male/Father | 11 (4.1%) | 3.00 |
| Single Female/Mother | 24 (9.0%) | 2.67 |
| Non-family | 76 (28.5%) | 1.12 |
| Total Households | 267 (100.0%) | 2.43 |
Household Size by Marriage Status in Cascade
Out of a total of 267 households in Cascade, 191 (71.5%) are family households, while 76 (28.5%) are nonfamily households. The most numerous type of family households are 2-person households, comprising 89, and the most common type of nonfamily households are 1-person households, comprising 65.
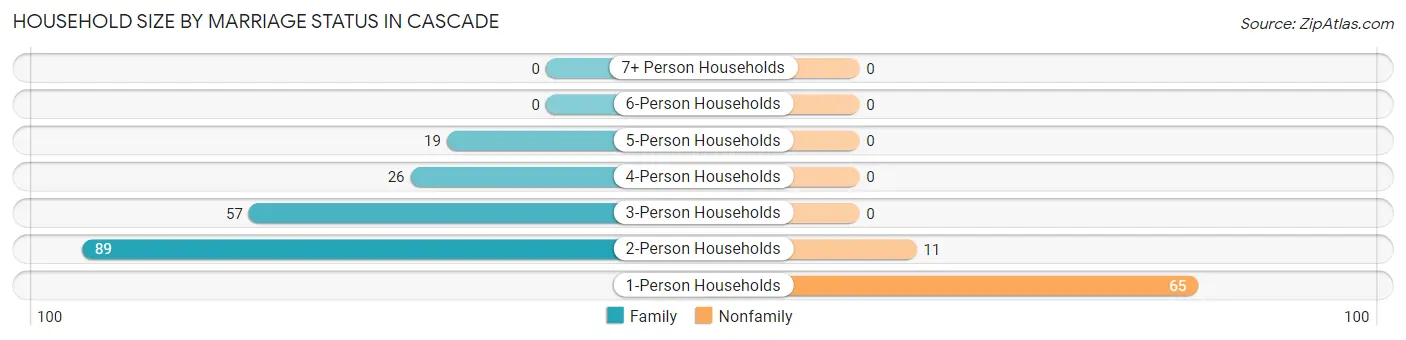
| Household Size | Family Households | Nonfamily Households |
| 1-Person Households | - | 65 (24.3%) |
| 2-Person Households | 89 (33.3%) | 11 (4.1%) |
| 3-Person Households | 57 (21.3%) | 0 (0.0%) |
| 4-Person Households | 26 (9.7%) | 0 (0.0%) |
| 5-Person Households | 19 (7.1%) | 0 (0.0%) |
| 6-Person Households | 0 (0.0%) | 0 (0.0%) |
| 7+ Person Households | 0 (0.0%) | 0 (0.0%) |
| Total | 191 (71.5%) | 76 (28.5%) |
Female Fertility in Cascade
Fertility by Age in Cascade
Average fertility rate in Cascade is 83.0 births per 1,000 women. Women in the age bracket of 35 to 50 years have the highest fertility rate with 109.0 births per 1,000 women. Women in the age bracket of 35 to 50 years acount for 63.6% of all women with births.
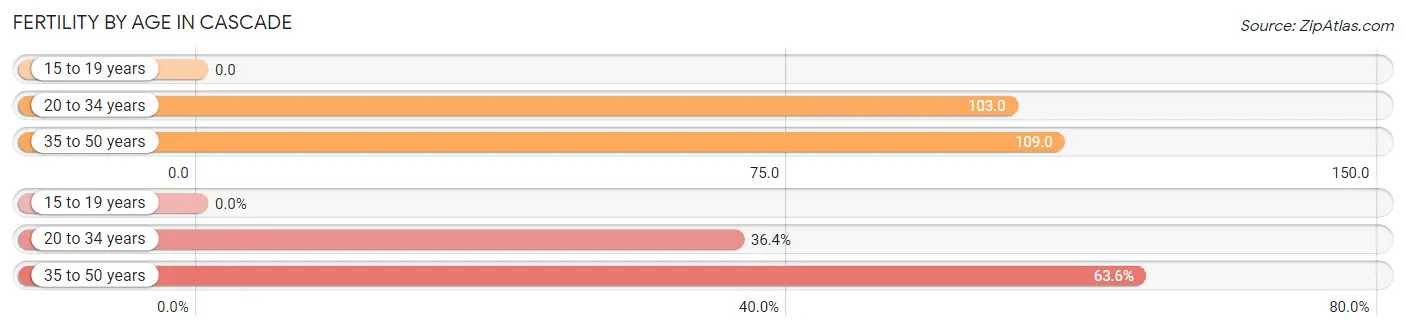
| Age Bracket | Women with Births | Births / 1,000 Women |
| 15 to 19 years | 0 (0.0%) | 0.0 |
| 20 to 34 years | 4 (36.4%) | 103.0 |
| 35 to 50 years | 7 (63.6%) | 109.0 |
| Total | 11 (100.0%) | 83.0 |
Fertility by Age by Marriage Status in Cascade
72.7% of women with births (11) in Cascade are married. The highest percentage of unmarried women with births falls into 20 to 34 years age bracket with 75.0% of them unmarried at the time of birth, while the lowest percentage of unmarried women with births belong to 35 to 50 years age bracket with 0.0% of them unmarried.
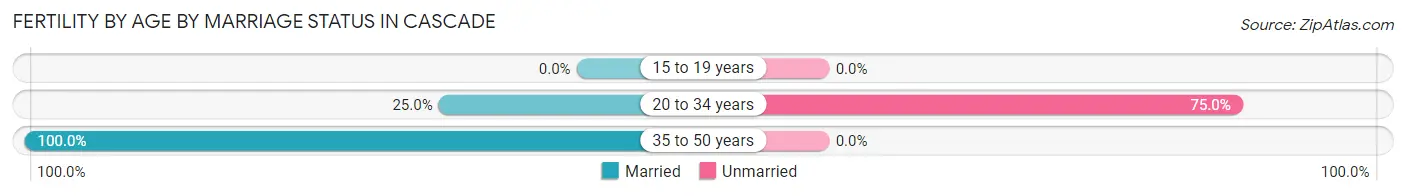
| Age Bracket | Married | Unmarried |
| 15 to 19 years | 0 (0.0%) | 0 (0.0%) |
| 20 to 34 years | 1 (25.0%) | 3 (75.0%) |
| 35 to 50 years | 7 (100.0%) | 0 (0.0%) |
| Total | 8 (72.7%) | 3 (27.3%) |
Fertility by Education in Cascade
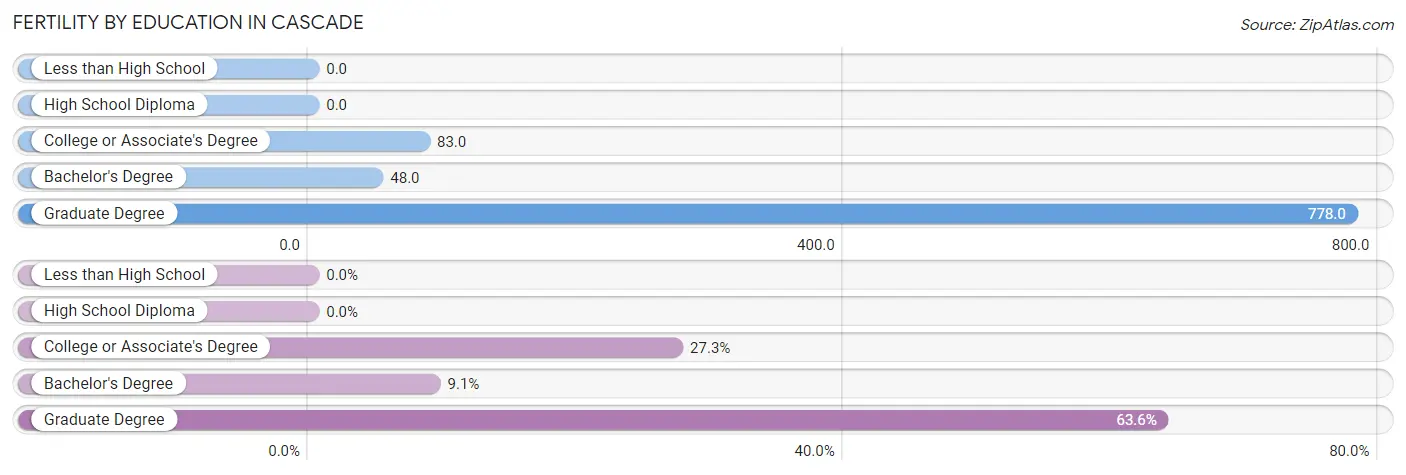
| Educational Attainment | Women with Births | Births / 1,000 Women |
| Less than High School | 0 (0.0%) | 0.0 |
| High School Diploma | 0 (0.0%) | 0.0 |
| College or Associate's Degree | 3 (27.3%) | 83.0 |
| Bachelor's Degree | 1 (9.1%) | 48.0 |
| Graduate Degree | 7 (63.6%) | 778.0 |
| Total | 11 (100.0%) | 83.0 |
Fertility by Education by Marriage Status in Cascade
27.3% of women with births in Cascade are unmarried. Women with the educational attainment of bachelor's degree are most likely to be married with 100.0% of them married at childbirth, while women with the educational attainment of college or associate's degree are least likely to be married with 100.0% of them unmarried at childbirth.
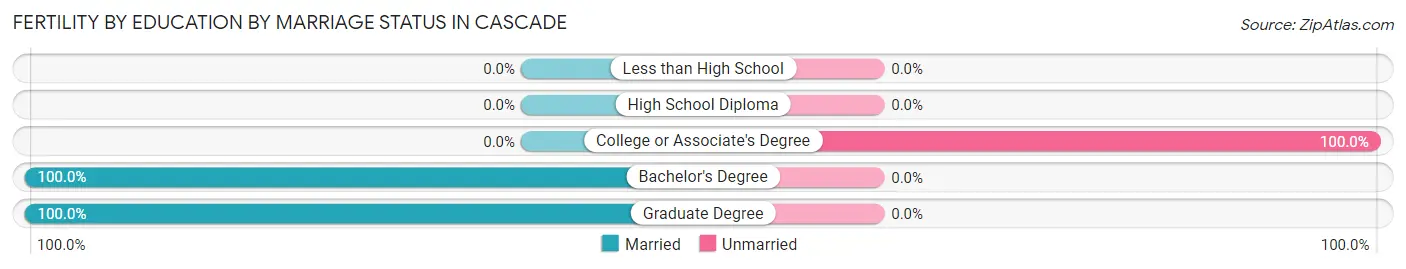
| Educational Attainment | Married | Unmarried |
| Less than High School | 0 (0.0%) | 0 (0.0%) |
| High School Diploma | 0 (0.0%) | 0 (0.0%) |
| College or Associate's Degree | 0 (0.0%) | 3 (100.0%) |
| Bachelor's Degree | 1 (100.0%) | 0 (0.0%) |
| Graduate Degree | 7 (100.0%) | 0 (0.0%) |
| Total | 8 (72.7%) | 3 (27.3%) |
Employment Characteristics in Cascade
Employment by Class of Employer in Cascade
Among the 367 employed individuals in Cascade, private company employees (274 | 74.7%), local government employees (36 | 9.8%), and self-employed (incorporated) (17 | 4.6%) make up the most common classes of employment.
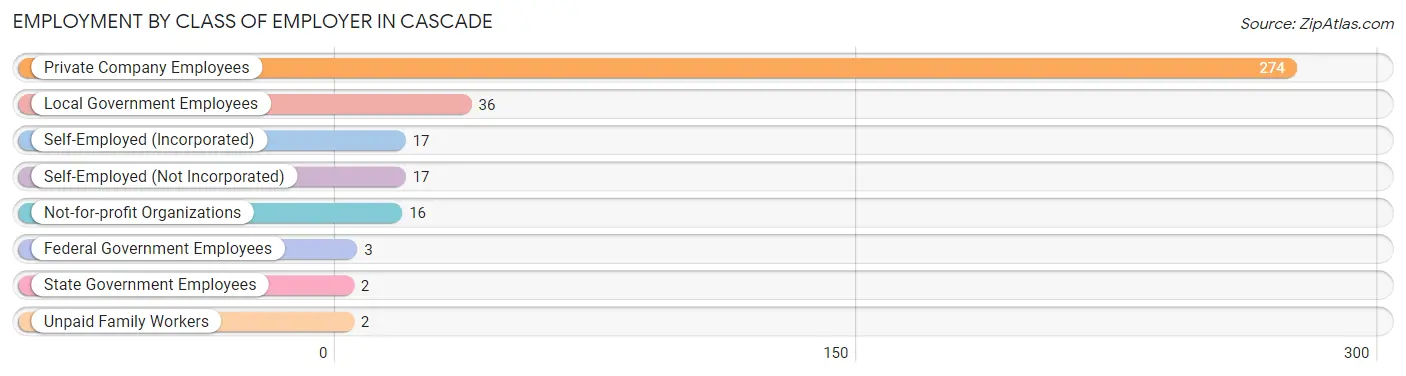
| Employer Class | # Employees | % Employees |
| Private Company Employees | 274 | 74.7% |
| Self-Employed (Incorporated) | 17 | 4.6% |
| Self-Employed (Not Incorporated) | 17 | 4.6% |
| Not-for-profit Organizations | 16 | 4.4% |
| Local Government Employees | 36 | 9.8% |
| State Government Employees | 2 | 0.5% |
| Federal Government Employees | 3 | 0.8% |
| Unpaid Family Workers | 2 | 0.5% |
| Total | 367 | 100.0% |
Employment Status by Age in Cascade
According to the labor force statistics for Cascade, out of the total population over 16 years of age (516), 72.1% or 372 individuals are in the labor force, with 0.8% or 3 of them unemployed. The age group with the highest labor force participation rate is 20 to 24 years, with 100.0% or 22 individuals in the labor force. Within the labor force, the 45 to 54 years age range has the highest percentage of unemployed individuals, with 2.8% or 3 of them being unemployed.
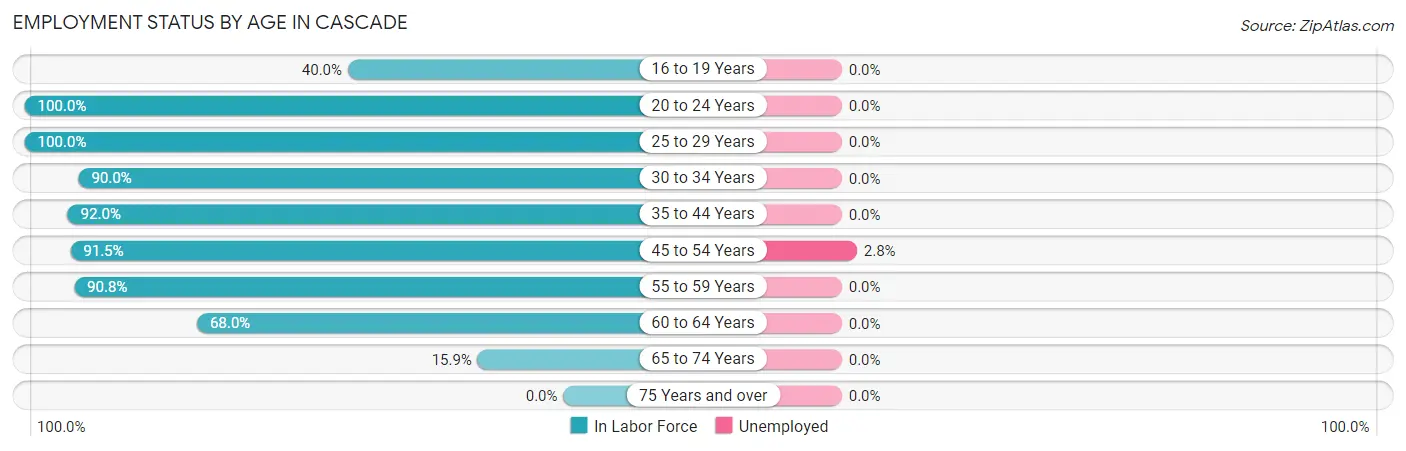
| Age Bracket | In Labor Force | Unemployed |
| 16 to 19 Years | 10 (40.0%) | 0 (0.0%) |
| 20 to 24 Years | 22 (100.0%) | 0 (0.0%) |
| 25 to 29 Years | 45 (100.0%) | 0 (0.0%) |
| 30 to 34 Years | 18 (90.0%) | 0 (0.0%) |
| 35 to 44 Years | 80 (92.0%) | 0 (0.0%) |
| 45 to 54 Years | 108 (91.5%) | 3 (2.8%) |
| 55 to 59 Years | 59 (90.8%) | 0 (0.0%) |
| 60 to 64 Years | 17 (68.0%) | 0 (0.0%) |
| 65 to 74 Years | 13 (15.9%) | 0 (0.0%) |
| 75 Years and over | 0 (0.0%) | 0 (0.0%) |
| Total | 372 (72.1%) | 3 (0.8%) |
Employment Status by Educational Attainment in Cascade
According to labor force statistics for Cascade, 90.8% of individuals (327) out of the total population between 25 and 64 years of age (360) are in the labor force, with 0.9% or 3 of them being unemployed. The group with the highest labor force participation rate are those with the educational attainment of less than high school, with 100.0% or 19 individuals in the labor force. Within the labor force, individuals with college / associate degree education have the highest percentage of unemployment, with 2.4% or 3 of them being unemployed.
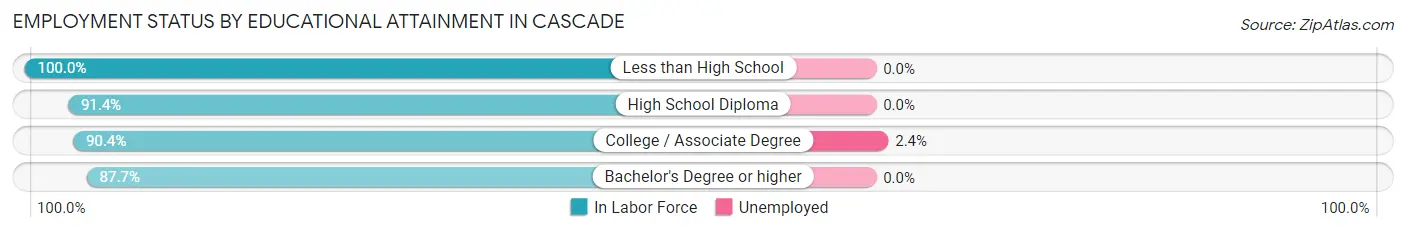
| Educational Attainment | In Labor Force | Unemployed |
| Less than High School | 19 (100.0%) | 0 (0.0%) |
| High School Diploma | 128 (91.4%) | 0 (0.0%) |
| College / Associate Degree | 123 (90.4%) | 3 (2.4%) |
| Bachelor's Degree or higher | 57 (87.7%) | 0 (0.0%) |
| Total | 327 (90.8%) | 3 (0.9%) |
Employment Occupations by Sex in Cascade
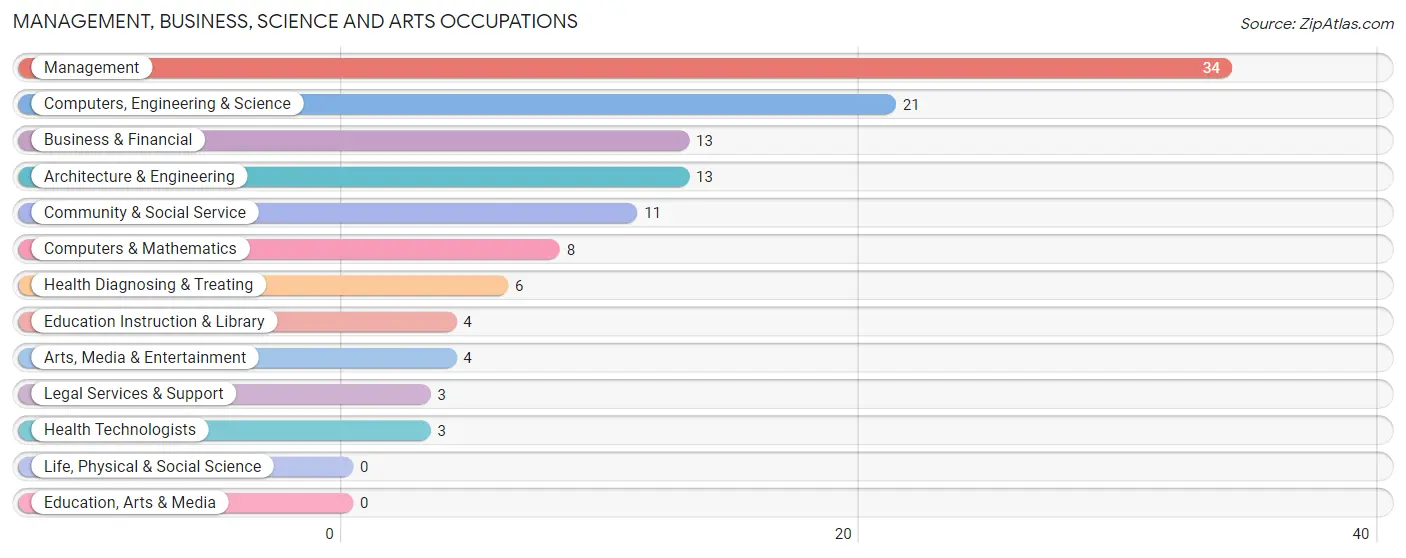
Management, Business, Science and Arts Occupations
The most common Management, Business, Science and Arts occupations in Cascade are Management (34 | 9.2%), Computers, Engineering & Science (21 | 5.7%), Business & Financial (13 | 3.5%), Architecture & Engineering (13 | 3.5%), and Community & Social Service (11 | 3.0%).
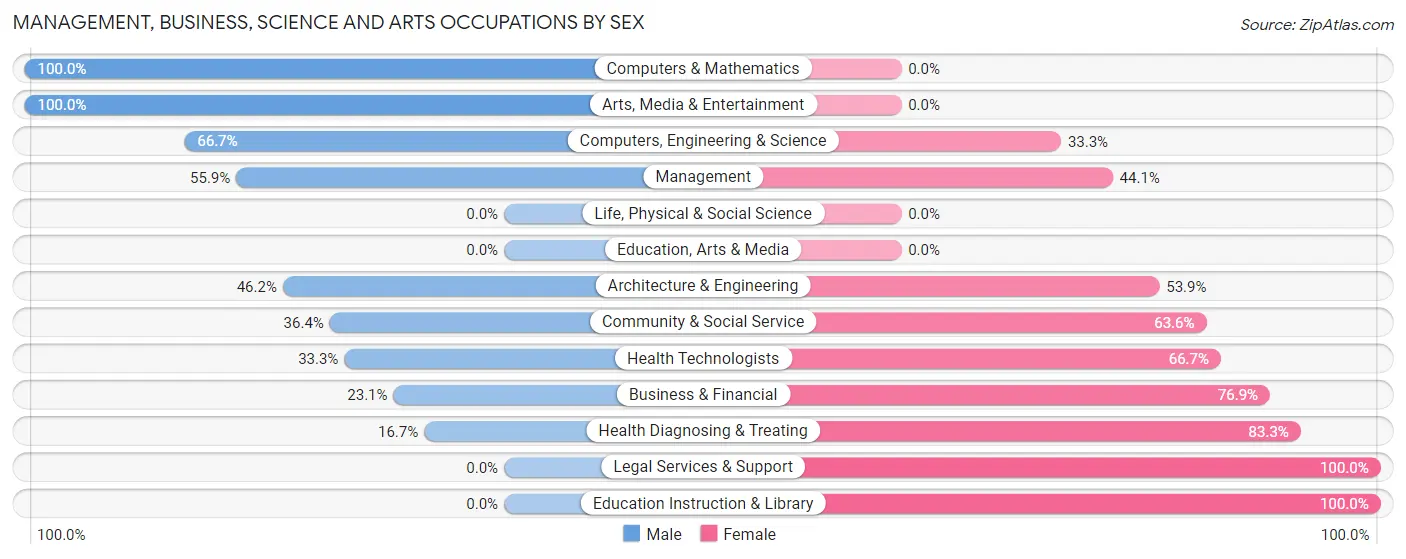
Management, Business, Science and Arts Occupations by Sex
Within the Management, Business, Science and Arts occupations in Cascade, the most male-oriented occupations are Computers & Mathematics (100.0%), Arts, Media & Entertainment (100.0%), and Computers, Engineering & Science (66.7%), while the most female-oriented occupations are Legal Services & Support (100.0%), Education Instruction & Library (100.0%), and Health Diagnosing & Treating (83.3%).
| Occupation | Male | Female |
| Management | 19 (55.9%) | 15 (44.1%) |
| Business & Financial | 3 (23.1%) | 10 (76.9%) |
| Computers, Engineering & Science | 14 (66.7%) | 7 (33.3%) |
| Computers & Mathematics | 8 (100.0%) | 0 (0.0%) |
| Architecture & Engineering | 6 (46.2%) | 7 (53.8%) |
| Life, Physical & Social Science | 0 (0.0%) | 0 (0.0%) |
| Community & Social Service | 4 (36.4%) | 7 (63.6%) |
| Education, Arts & Media | 0 (0.0%) | 0 (0.0%) |
| Legal Services & Support | 0 (0.0%) | 3 (100.0%) |
| Education Instruction & Library | 0 (0.0%) | 4 (100.0%) |
| Arts, Media & Entertainment | 4 (100.0%) | 0 (0.0%) |
| Health Diagnosing & Treating | 1 (16.7%) | 5 (83.3%) |
| Health Technologists | 1 (33.3%) | 2 (66.7%) |
| Total (Category) | 41 (48.2%) | 44 (51.8%) |
| Total (Overall) | 221 (59.9%) | 148 (40.1%) |
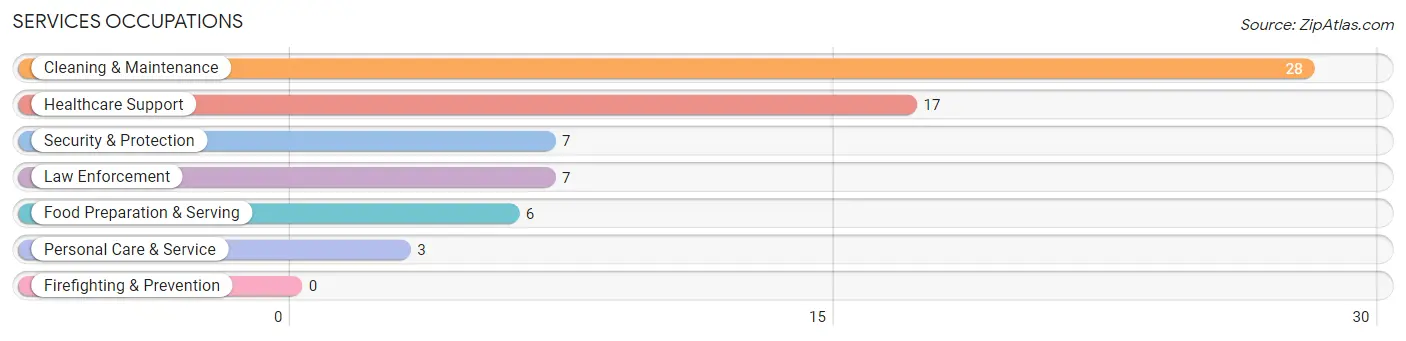
Services Occupations
The most common Services occupations in Cascade are Cleaning & Maintenance (28 | 7.6%), Healthcare Support (17 | 4.6%), Security & Protection (7 | 1.9%), Law Enforcement (7 | 1.9%), and Food Preparation & Serving (6 | 1.6%).
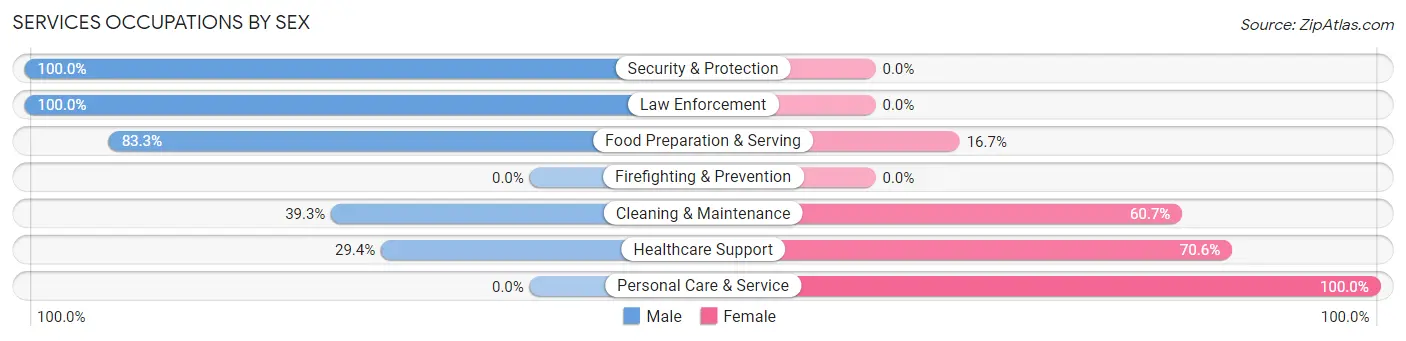
Services Occupations by Sex
Within the Services occupations in Cascade, the most male-oriented occupations are Security & Protection (100.0%), Law Enforcement (100.0%), and Food Preparation & Serving (83.3%), while the most female-oriented occupations are Personal Care & Service (100.0%), Healthcare Support (70.6%), and Cleaning & Maintenance (60.7%).
| Occupation | Male | Female |
| Healthcare Support | 5 (29.4%) | 12 (70.6%) |
| Security & Protection | 7 (100.0%) | 0 (0.0%) |
| Firefighting & Prevention | 0 (0.0%) | 0 (0.0%) |
| Law Enforcement | 7 (100.0%) | 0 (0.0%) |
| Food Preparation & Serving | 5 (83.3%) | 1 (16.7%) |
| Cleaning & Maintenance | 11 (39.3%) | 17 (60.7%) |
| Personal Care & Service | 0 (0.0%) | 3 (100.0%) |
| Total (Category) | 28 (45.9%) | 33 (54.1%) |
| Total (Overall) | 221 (59.9%) | 148 (40.1%) |
Sales and Office Occupations
The most common Sales and Office occupations in Cascade are Office & Administration (23 | 6.2%), and Sales & Related (18 | 4.9%).
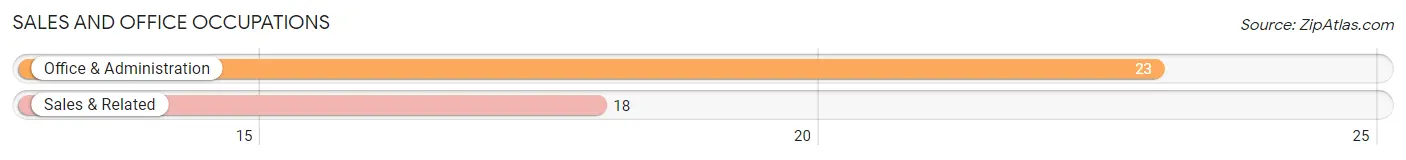
Sales and Office Occupations by Sex
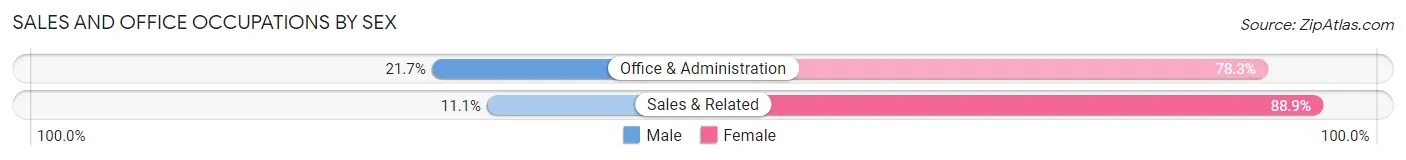
| Occupation | Male | Female |
| Sales & Related | 2 (11.1%) | 16 (88.9%) |
| Office & Administration | 5 (21.7%) | 18 (78.3%) |
| Total (Category) | 7 (17.1%) | 34 (82.9%) |
| Total (Overall) | 221 (59.9%) | 148 (40.1%) |
Natural Resources, Construction and Maintenance Occupations
The most common Natural Resources, Construction and Maintenance occupations in Cascade are Installation, Maintenance & Repair (31 | 8.4%), Construction & Extraction (17 | 4.6%), and Farming, Fishing & Forestry (13 | 3.5%).
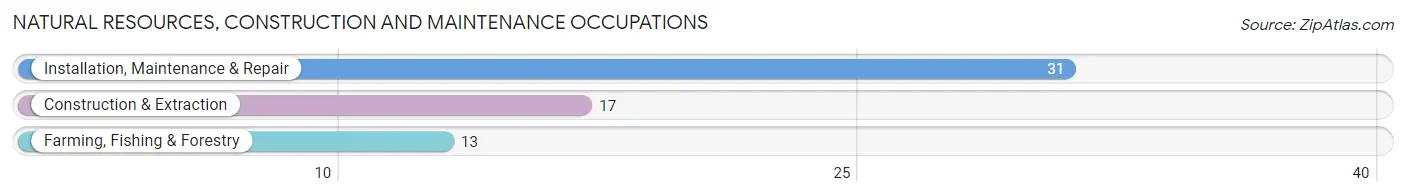
Natural Resources, Construction and Maintenance Occupations by Sex
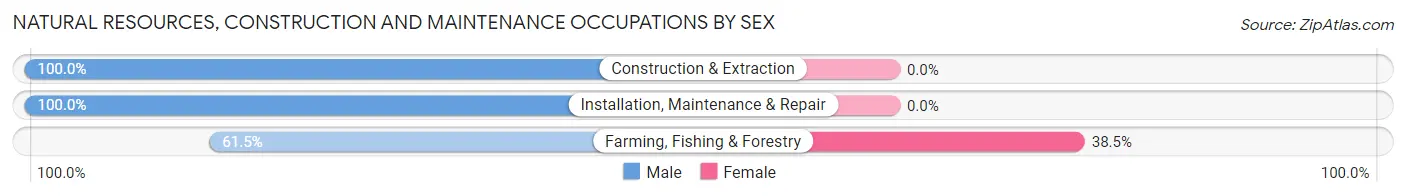
| Occupation | Male | Female |
| Farming, Fishing & Forestry | 8 (61.5%) | 5 (38.5%) |
| Construction & Extraction | 17 (100.0%) | 0 (0.0%) |
| Installation, Maintenance & Repair | 31 (100.0%) | 0 (0.0%) |
| Total (Category) | 56 (91.8%) | 5 (8.2%) |
| Total (Overall) | 221 (59.9%) | 148 (40.1%) |
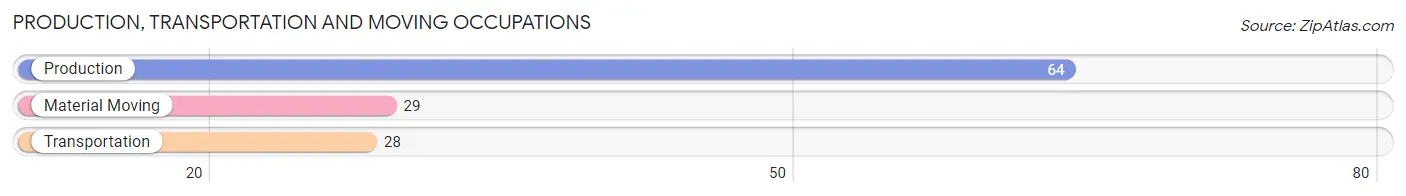
Production, Transportation and Moving Occupations
The most common Production, Transportation and Moving occupations in Cascade are Production (64 | 17.3%), Material Moving (29 | 7.9%), and Transportation (28 | 7.6%).
Production, Transportation and Moving Occupations by Sex
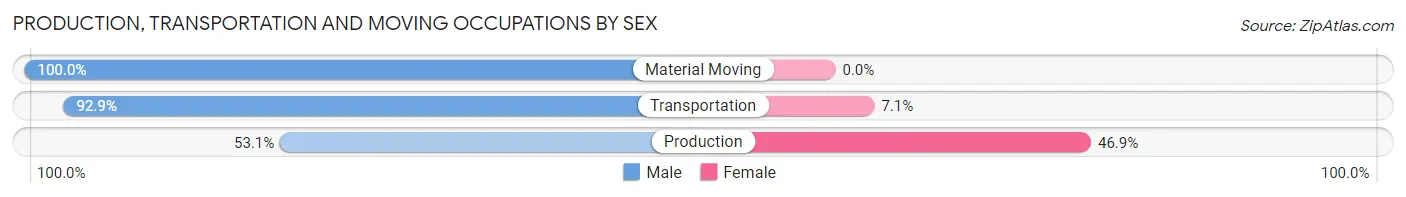
| Occupation | Male | Female |
| Production | 34 (53.1%) | 30 (46.9%) |
| Transportation | 26 (92.9%) | 2 (7.1%) |
| Material Moving | 29 (100.0%) | 0 (0.0%) |
| Total (Category) | 89 (73.6%) | 32 (26.5%) |
| Total (Overall) | 221 (59.9%) | 148 (40.1%) |
Employment Industries by Sex in Cascade
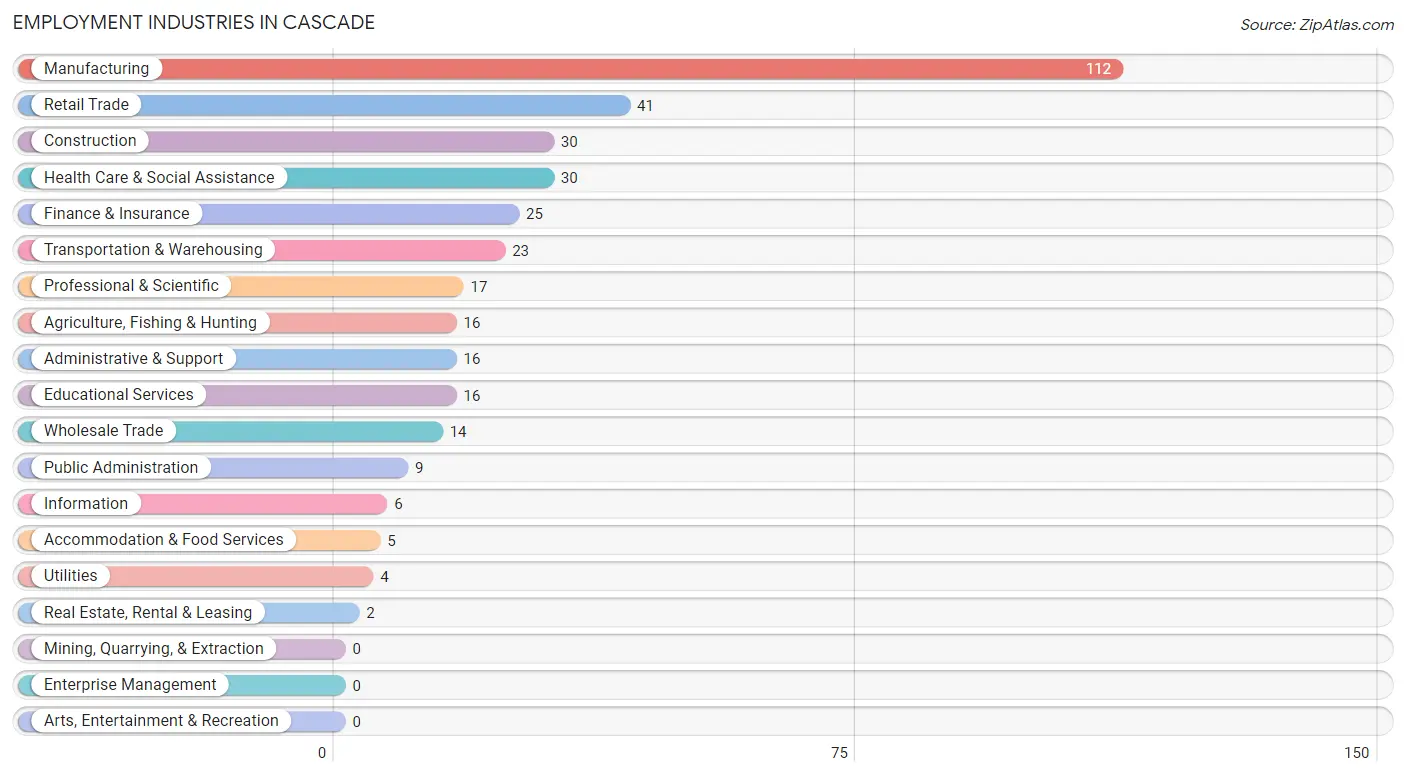
Employment Industries in Cascade
The major employment industries in Cascade include Manufacturing (112 | 30.3%), Retail Trade (41 | 11.1%), Construction (30 | 8.1%), Health Care & Social Assistance (30 | 8.1%), and Finance & Insurance (25 | 6.8%).
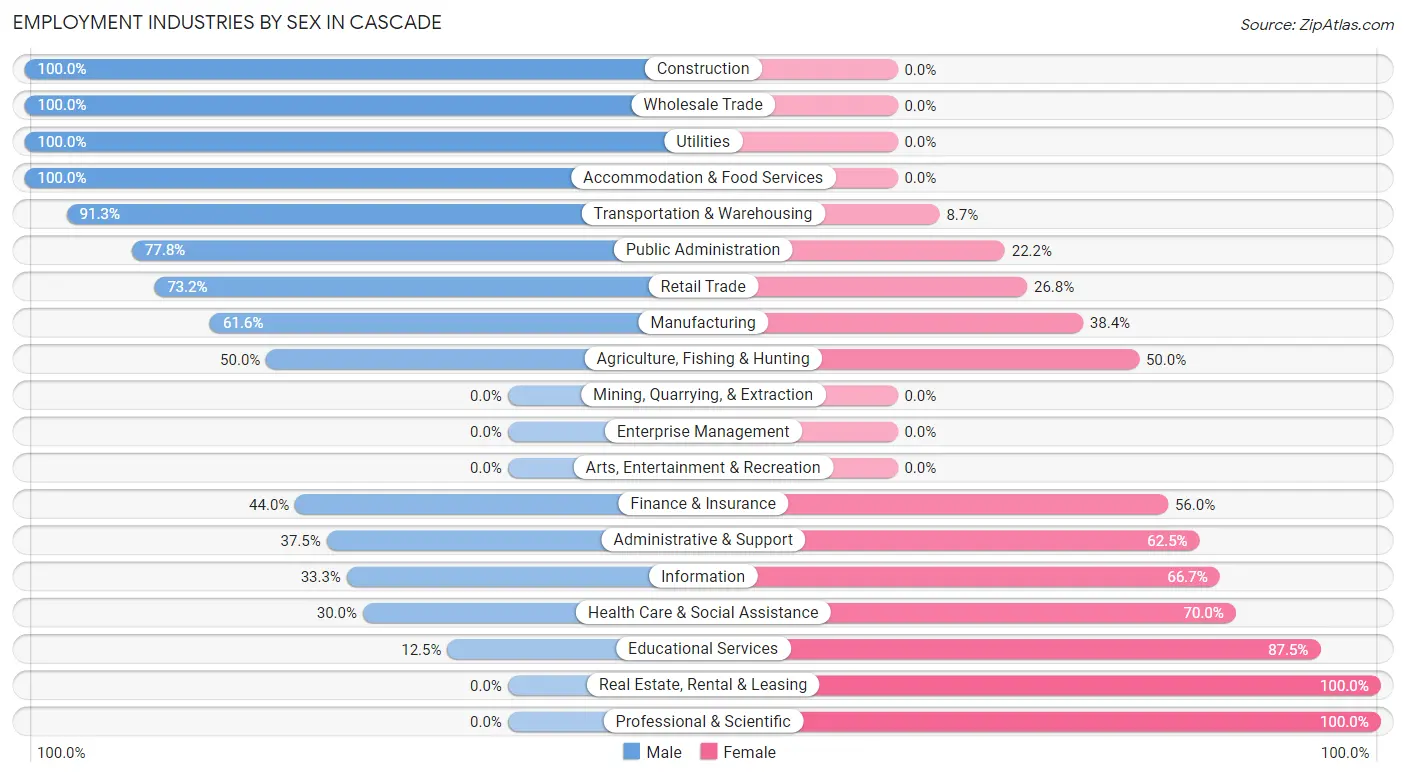
Employment Industries by Sex in Cascade
The Cascade industries that see more men than women are Construction (100.0%), Wholesale Trade (100.0%), and Utilities (100.0%), whereas the industries that tend to have a higher number of women are Real Estate, Rental & Leasing (100.0%), Professional & Scientific (100.0%), and Educational Services (87.5%).
| Industry | Male | Female |
| Agriculture, Fishing & Hunting | 8 (50.0%) | 8 (50.0%) |
| Mining, Quarrying, & Extraction | 0 (0.0%) | 0 (0.0%) |
| Construction | 30 (100.0%) | 0 (0.0%) |
| Manufacturing | 69 (61.6%) | 43 (38.4%) |
| Wholesale Trade | 14 (100.0%) | 0 (0.0%) |
| Retail Trade | 30 (73.2%) | 11 (26.8%) |
| Transportation & Warehousing | 21 (91.3%) | 2 (8.7%) |
| Utilities | 4 (100.0%) | 0 (0.0%) |
| Information | 2 (33.3%) | 4 (66.7%) |
| Finance & Insurance | 11 (44.0%) | 14 (56.0%) |
| Real Estate, Rental & Leasing | 0 (0.0%) | 2 (100.0%) |
| Professional & Scientific | 0 (0.0%) | 17 (100.0%) |
| Enterprise Management | 0 (0.0%) | 0 (0.0%) |
| Administrative & Support | 6 (37.5%) | 10 (62.5%) |
| Educational Services | 2 (12.5%) | 14 (87.5%) |
| Health Care & Social Assistance | 9 (30.0%) | 21 (70.0%) |
| Arts, Entertainment & Recreation | 0 (0.0%) | 0 (0.0%) |
| Accommodation & Food Services | 5 (100.0%) | 0 (0.0%) |
| Public Administration | 7 (77.8%) | 2 (22.2%) |
| Total | 221 (59.9%) | 148 (40.1%) |
Education in Cascade
School Enrollment in Cascade
The most common levels of schooling among the 149 students in Cascade are high school (50 | 33.6%), middle school (41 | 27.5%), and elementary school (31 | 20.8%).
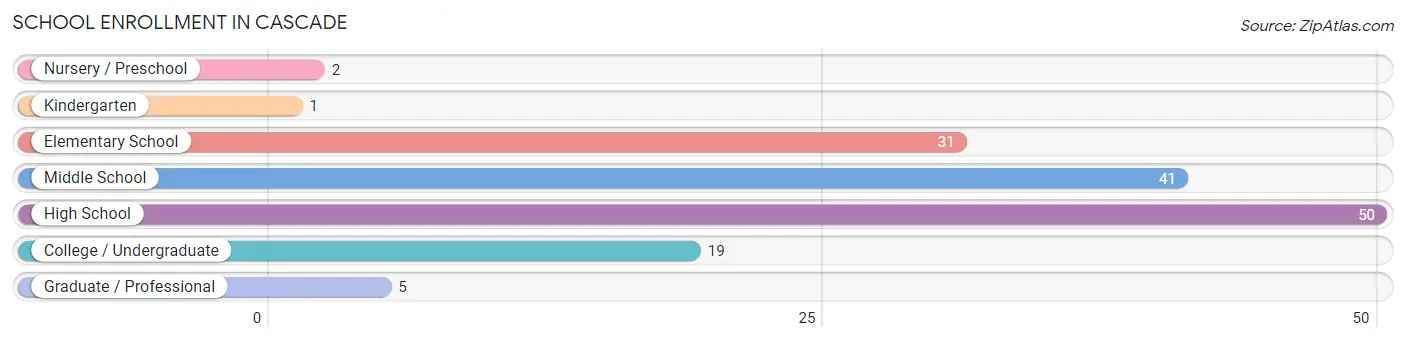
| School Level | # Students | % Students |
| Nursery / Preschool | 2 | 1.3% |
| Kindergarten | 1 | 0.7% |
| Elementary School | 31 | 20.8% |
| Middle School | 41 | 27.5% |
| High School | 50 | 33.6% |
| College / Undergraduate | 19 | 12.8% |
| Graduate / Professional | 5 | 3.4% |
| Total | 149 | 100.0% |
School Enrollment by Age by Funding Source in Cascade
Out of a total of 149 students who are enrolled in schools in Cascade, 40 (26.8%) attend a private institution, while the remaining 109 (73.2%) are enrolled in public schools. The age group of 10 to 14 year olds has the highest likelihood of being enrolled in private schools, with 27 (39.7% in the age bracket) enrolled. Conversely, the age group of 3 to 4 year olds has the lowest likelihood of being enrolled in a private school, with 2 (100.0% in the age bracket) attending a public institution.
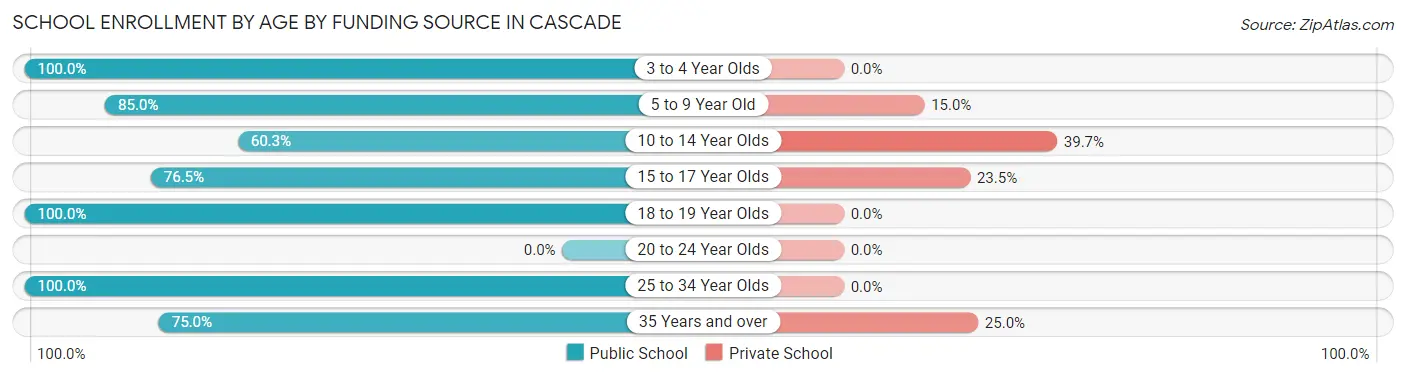
| Age Bracket | Public School | Private School |
| 3 to 4 Year Olds | 2 (100.0%) | 0 (0.0%) |
| 5 to 9 Year Old | 17 (85.0%) | 3 (15.0%) |
| 10 to 14 Year Olds | 41 (60.3%) | 27 (39.7%) |
| 15 to 17 Year Olds | 26 (76.5%) | 8 (23.5%) |
| 18 to 19 Year Olds | 7 (100.0%) | 0 (0.0%) |
| 20 to 24 Year Olds | 0 (0.0%) | 0 (0.0%) |
| 25 to 34 Year Olds | 10 (100.0%) | 0 (0.0%) |
| 35 Years and over | 6 (75.0%) | 2 (25.0%) |
| Total | 109 (73.2%) | 40 (26.8%) |
Educational Attainment by Field of Study in Cascade
Business (27 | 27.6%), science & technology (25 | 25.5%), visual & performing arts (11 | 11.2%), arts & humanities (8 | 8.2%), and bio, nature & agricultural (5 | 5.1%) are the most common fields of study among 98 individuals in Cascade who have obtained a bachelor's degree or higher.
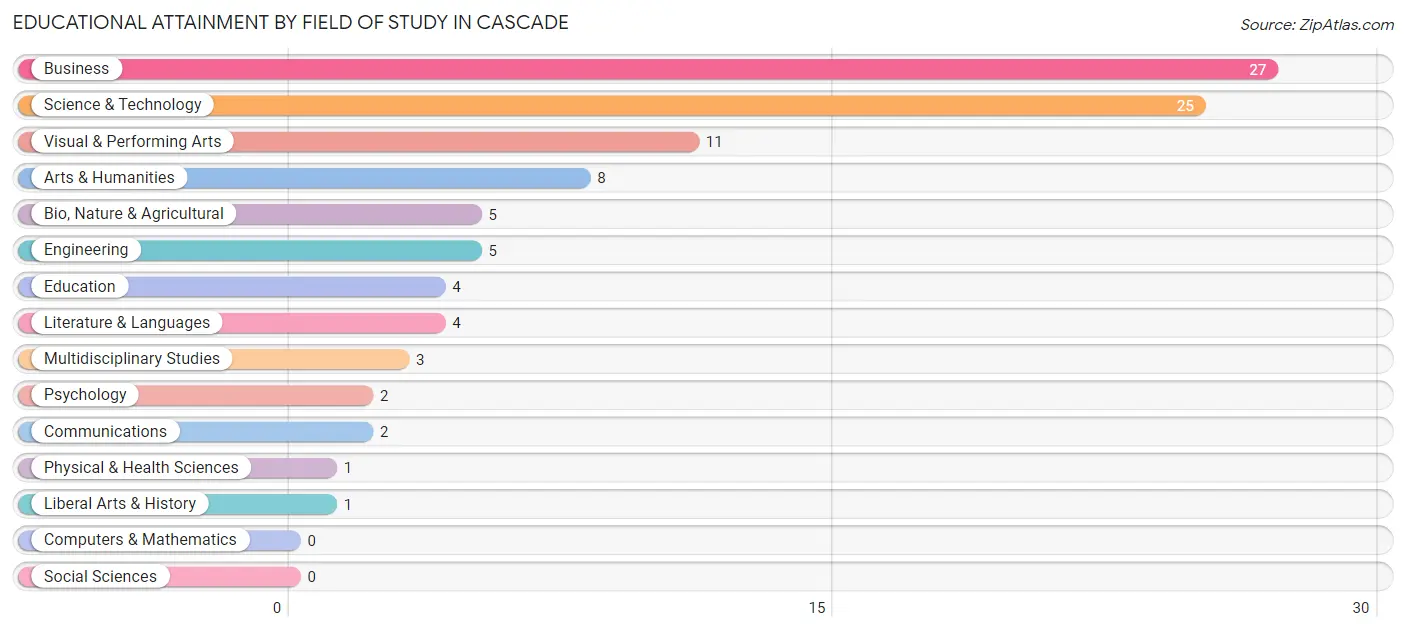
| Field of Study | # Graduates | % Graduates |
| Computers & Mathematics | 0 | 0.0% |
| Bio, Nature & Agricultural | 5 | 5.1% |
| Physical & Health Sciences | 1 | 1.0% |
| Psychology | 2 | 2.0% |
| Social Sciences | 0 | 0.0% |
| Engineering | 5 | 5.1% |
| Multidisciplinary Studies | 3 | 3.1% |
| Science & Technology | 25 | 25.5% |
| Business | 27 | 27.6% |
| Education | 4 | 4.1% |
| Literature & Languages | 4 | 4.1% |
| Liberal Arts & History | 1 | 1.0% |
| Visual & Performing Arts | 11 | 11.2% |
| Communications | 2 | 2.0% |
| Arts & Humanities | 8 | 8.2% |
| Total | 98 | 100.0% |
Transportation & Commute in Cascade
Vehicle Availability by Sex in Cascade
The most prevalent vehicle ownership categories in Cascade are males with 2 vehicles (81, accounting for 37.0%) and females with 2 vehicles (60, making up 54.7%).
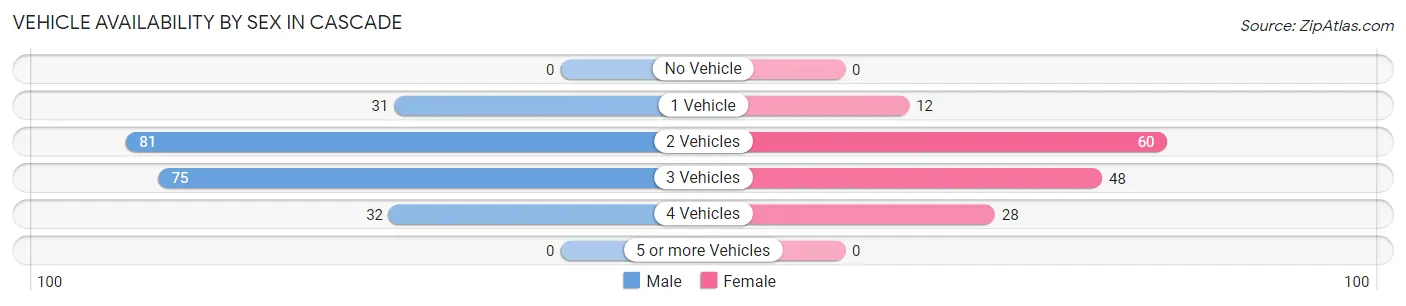
| Vehicles Available | Male | Female |
| No Vehicle | 0 (0.0%) | 0 (0.0%) |
| 1 Vehicle | 31 (14.2%) | 12 (8.1%) |
| 2 Vehicles | 81 (37.0%) | 60 (40.5%) |
| 3 Vehicles | 75 (34.3%) | 48 (32.4%) |
| 4 Vehicles | 32 (14.6%) | 28 (18.9%) |
| 5 or more Vehicles | 0 (0.0%) | 0 (0.0%) |
| Total | 219 (100.0%) | 148 (100.0%) |
Commute Time in Cascade
The most frequently occuring commute durations in Cascade are 25 to 29 minutes (60 commuters, 17.9%), 10 to 14 minutes (57 commuters, 17.0%), and 20 to 24 minutes (42 commuters, 12.5%).
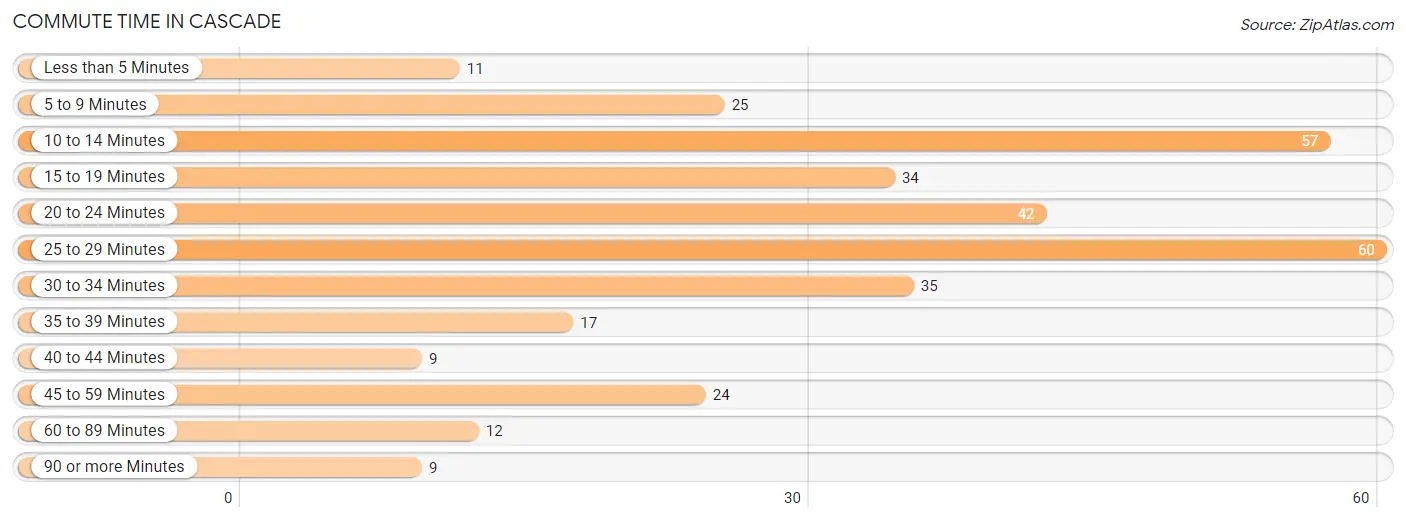
| Commute Time | # Commuters | % Commuters |
| Less than 5 Minutes | 11 | 3.3% |
| 5 to 9 Minutes | 25 | 7.5% |
| 10 to 14 Minutes | 57 | 17.0% |
| 15 to 19 Minutes | 34 | 10.2% |
| 20 to 24 Minutes | 42 | 12.5% |
| 25 to 29 Minutes | 60 | 17.9% |
| 30 to 34 Minutes | 35 | 10.4% |
| 35 to 39 Minutes | 17 | 5.1% |
| 40 to 44 Minutes | 9 | 2.7% |
| 45 to 59 Minutes | 24 | 7.2% |
| 60 to 89 Minutes | 12 | 3.6% |
| 90 or more Minutes | 9 | 2.7% |
Commute Time by Sex in Cascade
The most common commute times in Cascade are 25 to 29 minutes (36 commuters, 18.1%) for males and 10 to 14 minutes (25 commuters, 18.4%) for females.
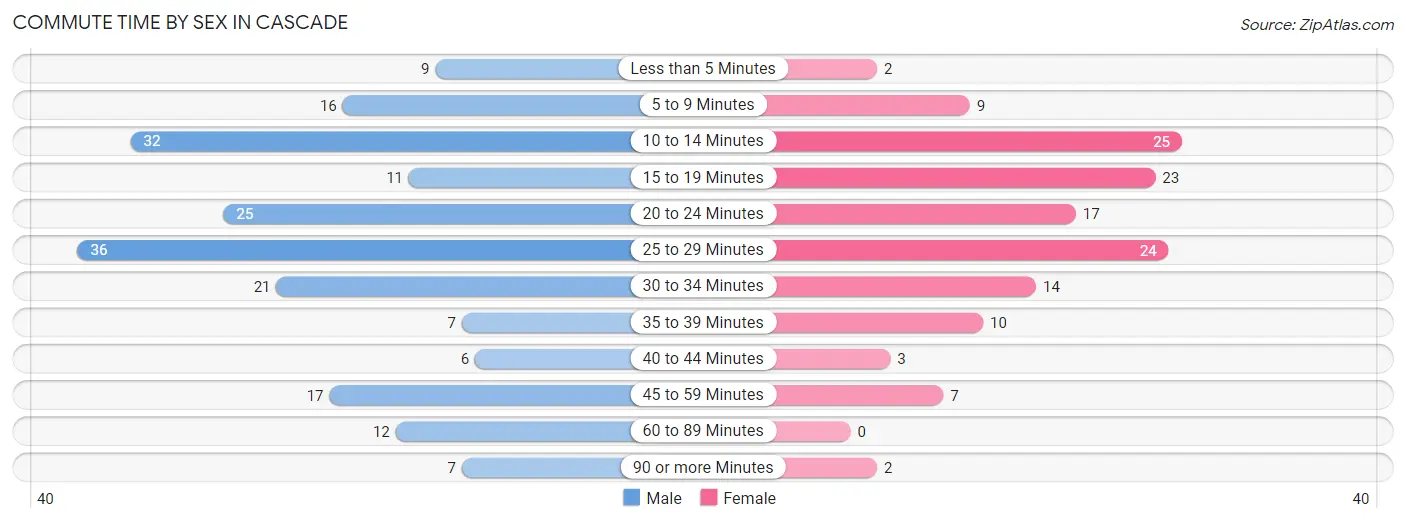
| Commute Time | Male | Female |
| Less than 5 Minutes | 9 (4.5%) | 2 (1.5%) |
| 5 to 9 Minutes | 16 (8.0%) | 9 (6.6%) |
| 10 to 14 Minutes | 32 (16.1%) | 25 (18.4%) |
| 15 to 19 Minutes | 11 (5.5%) | 23 (16.9%) |
| 20 to 24 Minutes | 25 (12.6%) | 17 (12.5%) |
| 25 to 29 Minutes | 36 (18.1%) | 24 (17.6%) |
| 30 to 34 Minutes | 21 (10.5%) | 14 (10.3%) |
| 35 to 39 Minutes | 7 (3.5%) | 10 (7.3%) |
| 40 to 44 Minutes | 6 (3.0%) | 3 (2.2%) |
| 45 to 59 Minutes | 17 (8.5%) | 7 (5.1%) |
| 60 to 89 Minutes | 12 (6.0%) | 0 (0.0%) |
| 90 or more Minutes | 7 (3.5%) | 2 (1.5%) |
Time of Departure to Work by Sex in Cascade
The most frequent times of departure to work in Cascade are 6:00 AM to 6:29 AM (33, 16.6%) for males and 7:00 AM to 7:29 AM (21, 15.4%) for females.
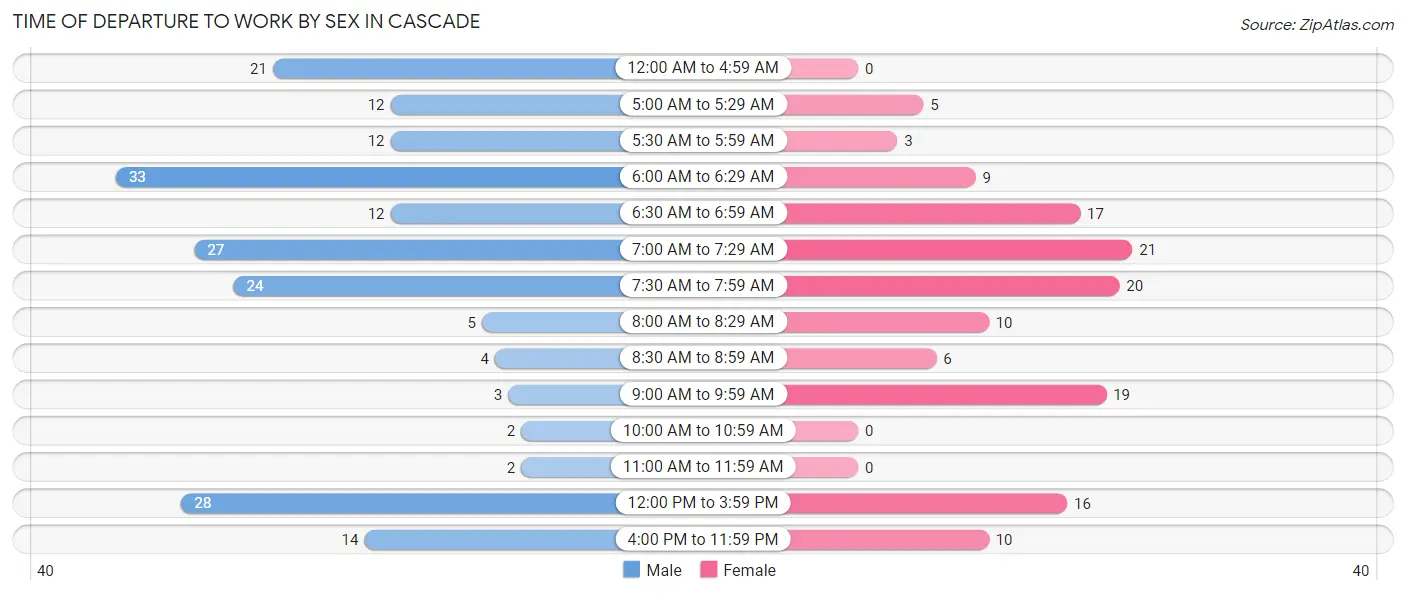
| Time of Departure | Male | Female |
| 12:00 AM to 4:59 AM | 21 (10.5%) | 0 (0.0%) |
| 5:00 AM to 5:29 AM | 12 (6.0%) | 5 (3.7%) |
| 5:30 AM to 5:59 AM | 12 (6.0%) | 3 (2.2%) |
| 6:00 AM to 6:29 AM | 33 (16.6%) | 9 (6.6%) |
| 6:30 AM to 6:59 AM | 12 (6.0%) | 17 (12.5%) |
| 7:00 AM to 7:29 AM | 27 (13.6%) | 21 (15.4%) |
| 7:30 AM to 7:59 AM | 24 (12.1%) | 20 (14.7%) |
| 8:00 AM to 8:29 AM | 5 (2.5%) | 10 (7.3%) |
| 8:30 AM to 8:59 AM | 4 (2.0%) | 6 (4.4%) |
| 9:00 AM to 9:59 AM | 3 (1.5%) | 19 (14.0%) |
| 10:00 AM to 10:59 AM | 2 (1.0%) | 0 (0.0%) |
| 11:00 AM to 11:59 AM | 2 (1.0%) | 0 (0.0%) |
| 12:00 PM to 3:59 PM | 28 (14.1%) | 16 (11.8%) |
| 4:00 PM to 11:59 PM | 14 (7.0%) | 10 (7.3%) |
| Total | 199 (100.0%) | 136 (100.0%) |
Housing Occupancy in Cascade
Occupancy by Ownership in Cascade
Of the total 267 dwellings in Cascade, owner-occupied units account for 234 (87.6%), while renter-occupied units make up 33 (12.4%).
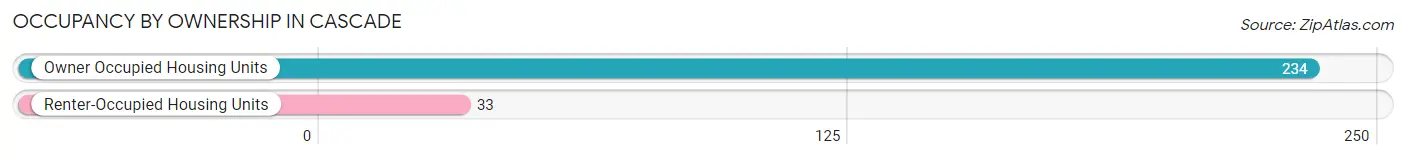
| Occupancy | # Housing Units | % Housing Units |
| Owner Occupied Housing Units | 234 | 87.6% |
| Renter-Occupied Housing Units | 33 | 12.4% |
| Total Occupied Housing Units | 267 | 100.0% |
Occupancy by Household Size in Cascade
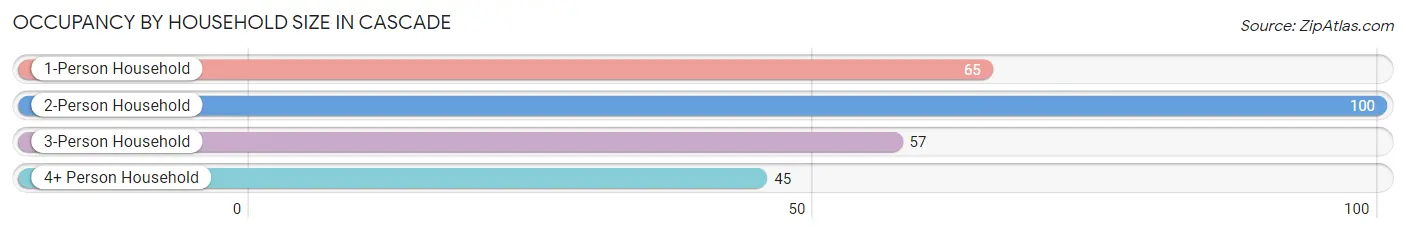
| Household Size | # Housing Units | % Housing Units |
| 1-Person Household | 65 | 24.3% |
| 2-Person Household | 100 | 37.4% |
| 3-Person Household | 57 | 21.3% |
| 4+ Person Household | 45 | 16.9% |
| Total Housing Units | 267 | 100.0% |
Occupancy by Ownership by Household Size in Cascade
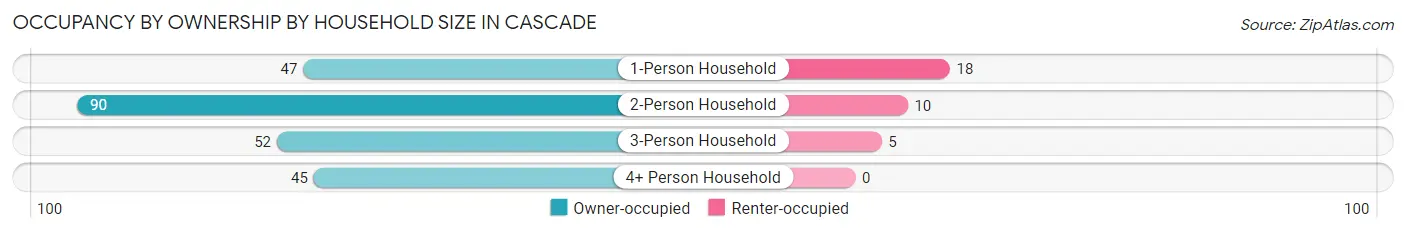
| Household Size | Owner-occupied | Renter-occupied |
| 1-Person Household | 47 (72.3%) | 18 (27.7%) |
| 2-Person Household | 90 (90.0%) | 10 (10.0%) |
| 3-Person Household | 52 (91.2%) | 5 (8.8%) |
| 4+ Person Household | 45 (100.0%) | 0 (0.0%) |
| Total Housing Units | 234 (87.6%) | 33 (12.4%) |
Occupancy by Educational Attainment in Cascade
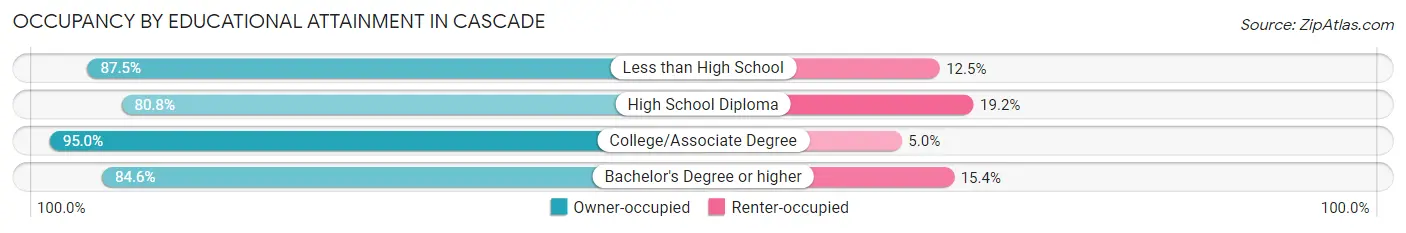
| Household Size | Owner-occupied | Renter-occupied |
| Less than High School | 21 (87.5%) | 3 (12.5%) |
| High School Diploma | 63 (80.8%) | 15 (19.2%) |
| College/Associate Degree | 95 (95.0%) | 5 (5.0%) |
| Bachelor's Degree or higher | 55 (84.6%) | 10 (15.4%) |
Occupancy by Age of Householder in Cascade
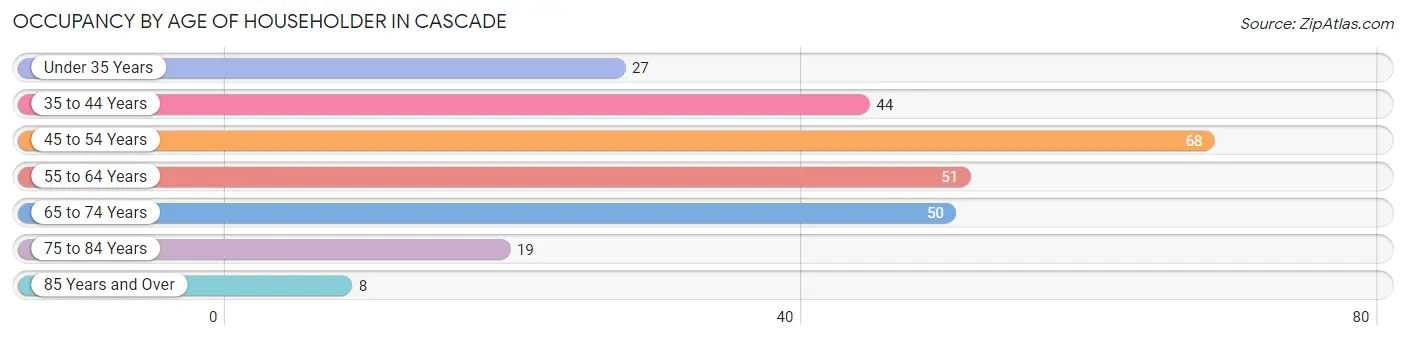
| Age Bracket | # Households | % Households |
| Under 35 Years | 27 | 10.1% |
| 35 to 44 Years | 44 | 16.5% |
| 45 to 54 Years | 68 | 25.5% |
| 55 to 64 Years | 51 | 19.1% |
| 65 to 74 Years | 50 | 18.7% |
| 75 to 84 Years | 19 | 7.1% |
| 85 Years and Over | 8 | 3.0% |
| Total | 267 | 100.0% |
Housing Finances in Cascade
Median Income by Occupancy in Cascade
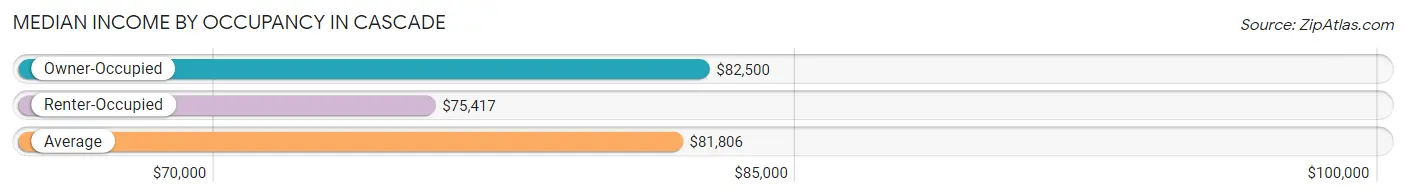
| Occupancy Type | # Households | Median Income |
| Owner-Occupied | 234 (87.6%) | $82,500 |
| Renter-Occupied | 33 (12.4%) | $75,417 |
| Average | 267 (100.0%) | $81,806 |
Occupancy by Householder Income Bracket in Cascade
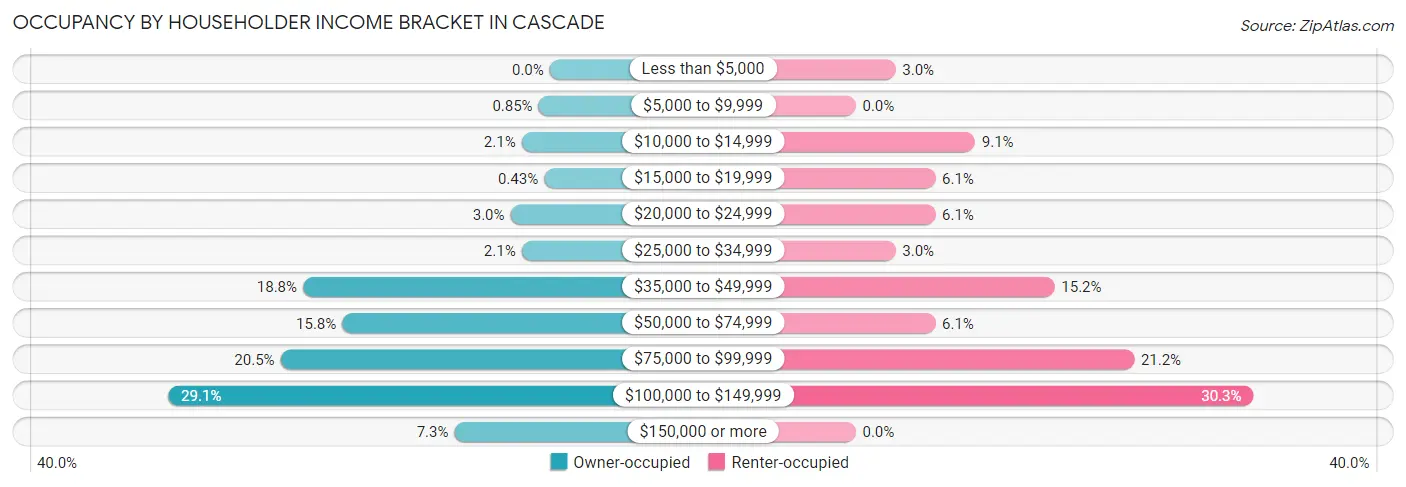
| Income Bracket | Owner-occupied | Renter-occupied |
| Less than $5,000 | 0 (0.0%) | 1 (3.0%) |
| $5,000 to $9,999 | 2 (0.9%) | 0 (0.0%) |
| $10,000 to $14,999 | 5 (2.1%) | 3 (9.1%) |
| $15,000 to $19,999 | 1 (0.4%) | 2 (6.1%) |
| $20,000 to $24,999 | 7 (3.0%) | 2 (6.1%) |
| $25,000 to $34,999 | 5 (2.1%) | 1 (3.0%) |
| $35,000 to $49,999 | 44 (18.8%) | 5 (15.1%) |
| $50,000 to $74,999 | 37 (15.8%) | 2 (6.1%) |
| $75,000 to $99,999 | 48 (20.5%) | 7 (21.2%) |
| $100,000 to $149,999 | 68 (29.1%) | 10 (30.3%) |
| $150,000 or more | 17 (7.3%) | 0 (0.0%) |
| Total | 234 (100.0%) | 33 (100.0%) |
Monthly Housing Cost Tiers in Cascade
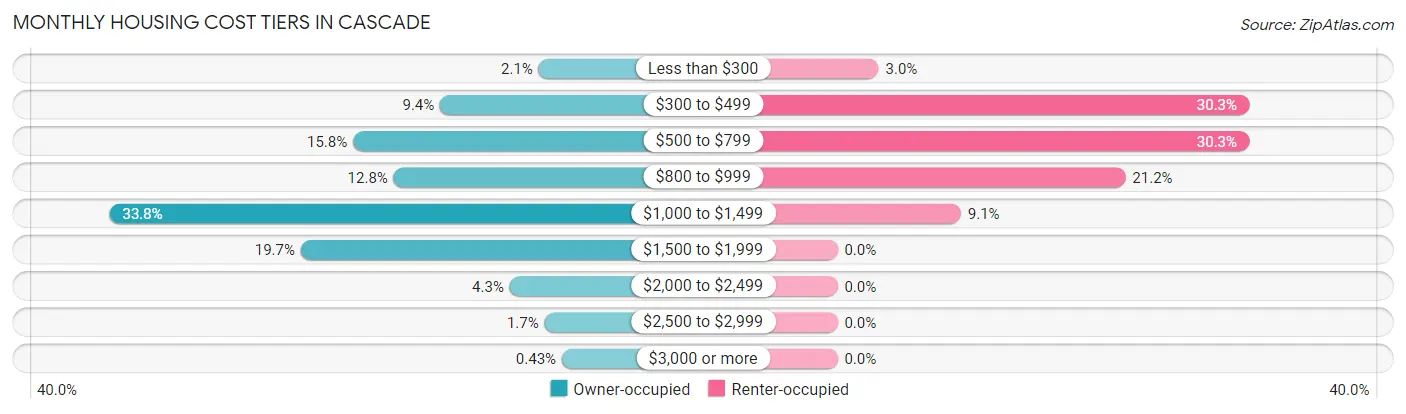
| Monthly Cost | Owner-occupied | Renter-occupied |
| Less than $300 | 5 (2.1%) | 1 (3.0%) |
| $300 to $499 | 22 (9.4%) | 10 (30.3%) |
| $500 to $799 | 37 (15.8%) | 10 (30.3%) |
| $800 to $999 | 30 (12.8%) | 7 (21.2%) |
| $1,000 to $1,499 | 79 (33.8%) | 3 (9.1%) |
| $1,500 to $1,999 | 46 (19.7%) | 0 (0.0%) |
| $2,000 to $2,499 | 10 (4.3%) | 0 (0.0%) |
| $2,500 to $2,999 | 4 (1.7%) | 0 (0.0%) |
| $3,000 or more | 1 (0.4%) | 0 (0.0%) |
| Total | 234 (100.0%) | 33 (100.0%) |
Physical Housing Characteristics in Cascade
Housing Structures in Cascade
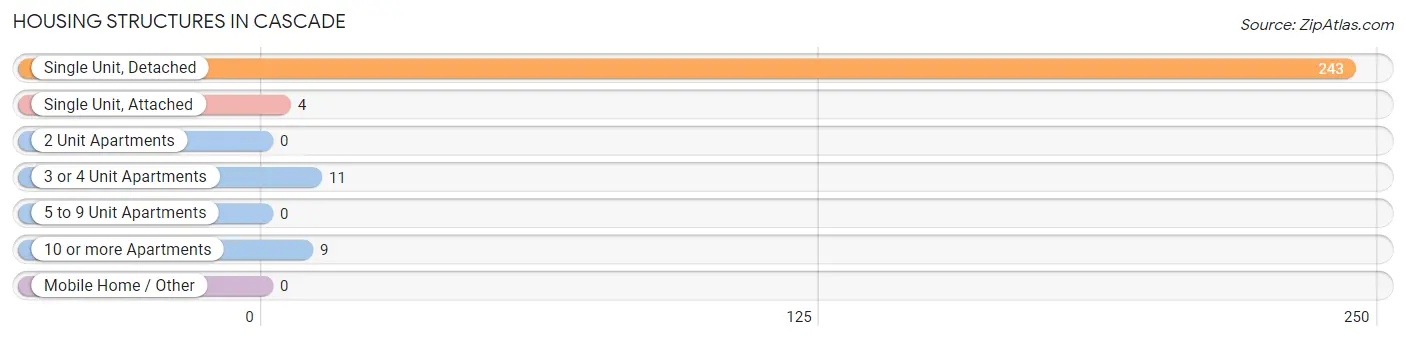
| Structure Type | # Housing Units | % Housing Units |
| Single Unit, Detached | 243 | 91.0% |
| Single Unit, Attached | 4 | 1.5% |
| 2 Unit Apartments | 0 | 0.0% |
| 3 or 4 Unit Apartments | 11 | 4.1% |
| 5 to 9 Unit Apartments | 0 | 0.0% |
| 10 or more Apartments | 9 | 3.4% |
| Mobile Home / Other | 0 | 0.0% |
| Total | 267 | 100.0% |
Housing Structures by Occupancy in Cascade
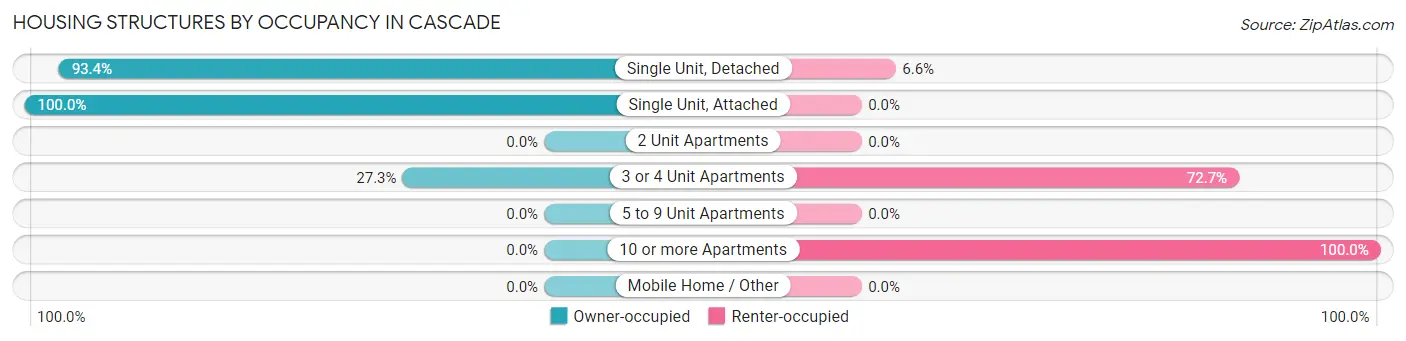
| Structure Type | Owner-occupied | Renter-occupied |
| Single Unit, Detached | 227 (93.4%) | 16 (6.6%) |
| Single Unit, Attached | 4 (100.0%) | 0 (0.0%) |
| 2 Unit Apartments | 0 (0.0%) | 0 (0.0%) |
| 3 or 4 Unit Apartments | 3 (27.3%) | 8 (72.7%) |
| 5 to 9 Unit Apartments | 0 (0.0%) | 0 (0.0%) |
| 10 or more Apartments | 0 (0.0%) | 9 (100.0%) |
| Mobile Home / Other | 0 (0.0%) | 0 (0.0%) |
| Total | 234 (87.6%) | 33 (12.4%) |
Housing Structures by Number of Rooms in Cascade
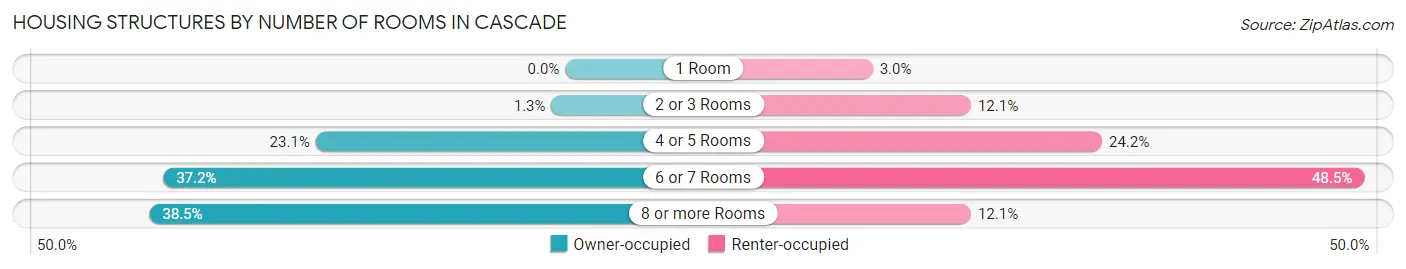
| Number of Rooms | Owner-occupied | Renter-occupied |
| 1 Room | 0 (0.0%) | 1 (3.0%) |
| 2 or 3 Rooms | 3 (1.3%) | 4 (12.1%) |
| 4 or 5 Rooms | 54 (23.1%) | 8 (24.2%) |
| 6 or 7 Rooms | 87 (37.2%) | 16 (48.5%) |
| 8 or more Rooms | 90 (38.5%) | 4 (12.1%) |
| Total | 234 (100.0%) | 33 (100.0%) |
Housing Structure by Heating Type in Cascade
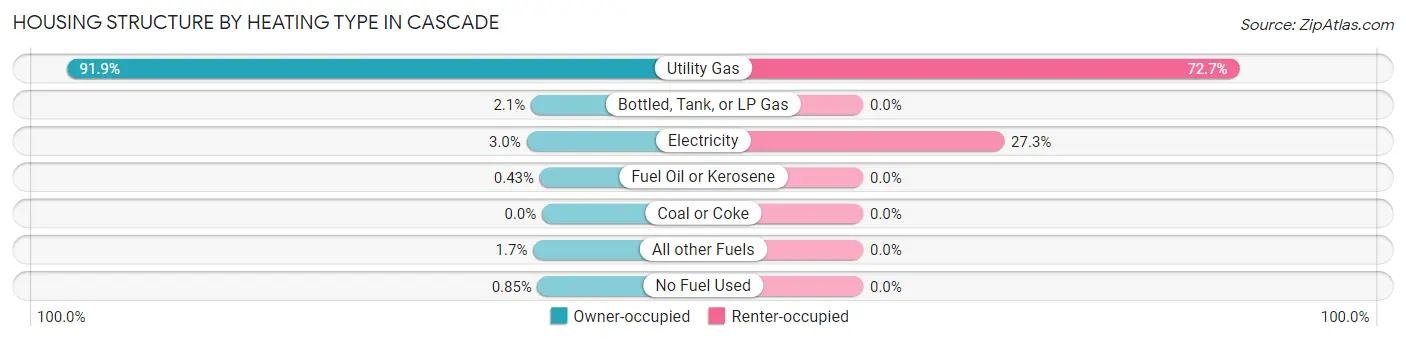
| Heating Type | Owner-occupied | Renter-occupied |
| Utility Gas | 215 (91.9%) | 24 (72.7%) |
| Bottled, Tank, or LP Gas | 5 (2.1%) | 0 (0.0%) |
| Electricity | 7 (3.0%) | 9 (27.3%) |
| Fuel Oil or Kerosene | 1 (0.4%) | 0 (0.0%) |
| Coal or Coke | 0 (0.0%) | 0 (0.0%) |
| All other Fuels | 4 (1.7%) | 0 (0.0%) |
| No Fuel Used | 2 (0.9%) | 0 (0.0%) |
| Total | 234 (100.0%) | 33 (100.0%) |
Household Vehicle Usage in Cascade
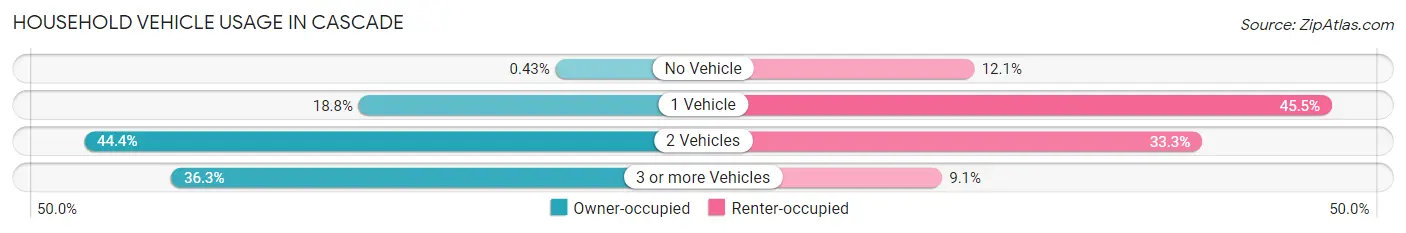
| Vehicles per Household | Owner-occupied | Renter-occupied |
| No Vehicle | 1 (0.4%) | 4 (12.1%) |
| 1 Vehicle | 44 (18.8%) | 15 (45.5%) |
| 2 Vehicles | 104 (44.4%) | 11 (33.3%) |
| 3 or more Vehicles | 85 (36.3%) | 3 (9.1%) |
| Total | 234 (100.0%) | 33 (100.0%) |
Real Estate & Mortgages in Cascade
Real Estate and Mortgage Overview in Cascade
| Characteristic | Without Mortgage | With Mortgage |
| Housing Units | 56 | 178 |
| Median Property Value | $165,900 | $158,300 |
| Median Household Income | $73,750 | $12 |
| Monthly Housing Costs | $507 | $1 |
| Real Estate Taxes | $2,579 | $1 |
Property Value by Mortgage Status in Cascade
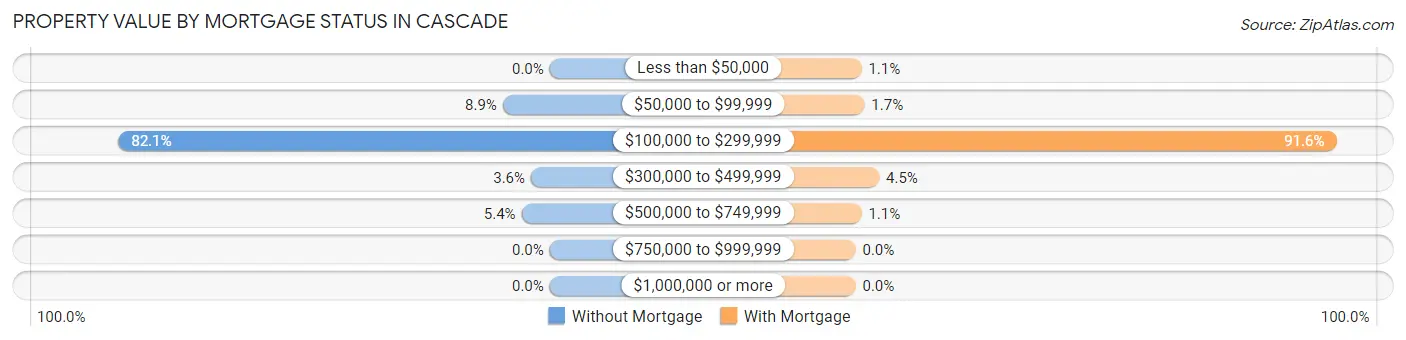
| Property Value | Without Mortgage | With Mortgage |
| Less than $50,000 | 0 (0.0%) | 2 (1.1%) |
| $50,000 to $99,999 | 5 (8.9%) | 3 (1.7%) |
| $100,000 to $299,999 | 46 (82.1%) | 163 (91.6%) |
| $300,000 to $499,999 | 2 (3.6%) | 8 (4.5%) |
| $500,000 to $749,999 | 3 (5.4%) | 2 (1.1%) |
| $750,000 to $999,999 | 0 (0.0%) | 0 (0.0%) |
| $1,000,000 or more | 0 (0.0%) | 0 (0.0%) |
| Total | 56 (100.0%) | 178 (100.0%) |
Household Income by Mortgage Status in Cascade
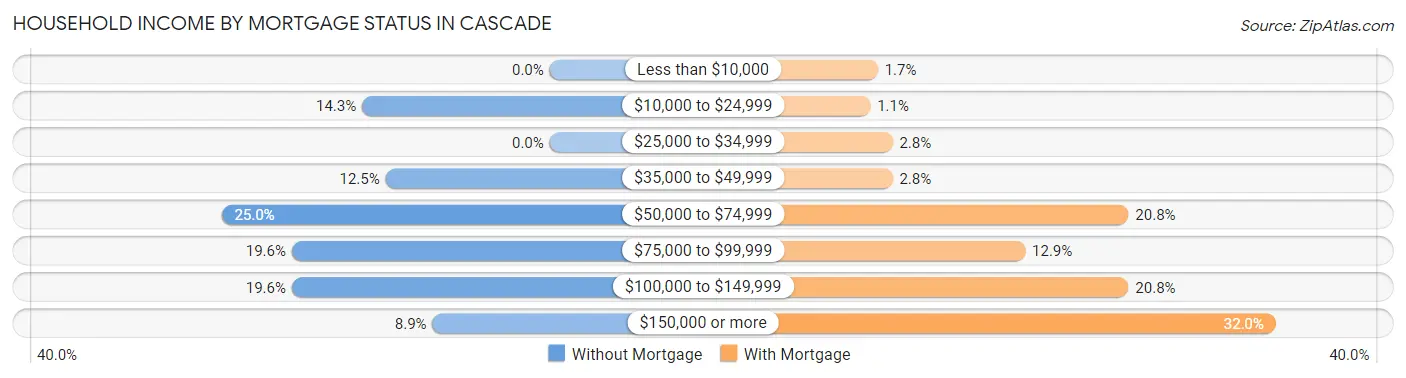
| Household Income | Without Mortgage | With Mortgage |
| Less than $10,000 | 0 (0.0%) | 3 (1.7%) |
| $10,000 to $24,999 | 8 (14.3%) | 2 (1.1%) |
| $25,000 to $34,999 | 0 (0.0%) | 5 (2.8%) |
| $35,000 to $49,999 | 7 (12.5%) | 5 (2.8%) |
| $50,000 to $74,999 | 14 (25.0%) | 37 (20.8%) |
| $75,000 to $99,999 | 11 (19.6%) | 23 (12.9%) |
| $100,000 to $149,999 | 11 (19.6%) | 37 (20.8%) |
| $150,000 or more | 5 (8.9%) | 57 (32.0%) |
| Total | 56 (100.0%) | 178 (100.0%) |
Property Value to Household Income Ratio in Cascade
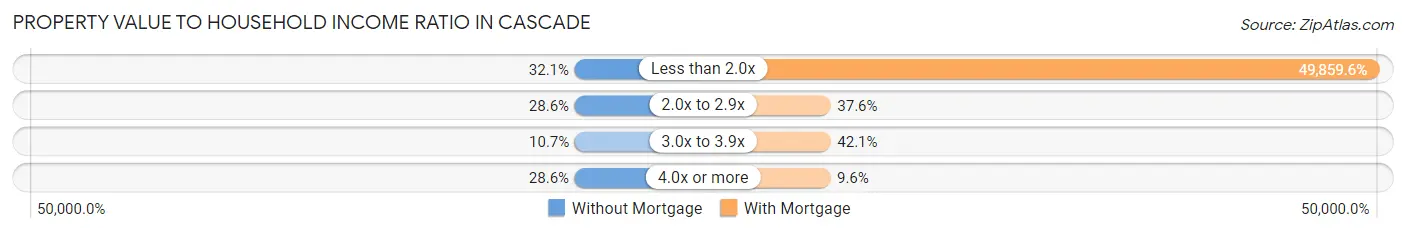
| Value-to-Income Ratio | Without Mortgage | With Mortgage |
| Less than 2.0x | 18 (32.1%) | 88,750 (49,859.6%) |
| 2.0x to 2.9x | 16 (28.6%) | 67 (37.6%) |
| 3.0x to 3.9x | 6 (10.7%) | 75 (42.1%) |
| 4.0x or more | 16 (28.6%) | 17 (9.6%) |
| Total | 56 (100.0%) | 178 (100.0%) |
Real Estate Taxes by Mortgage Status in Cascade
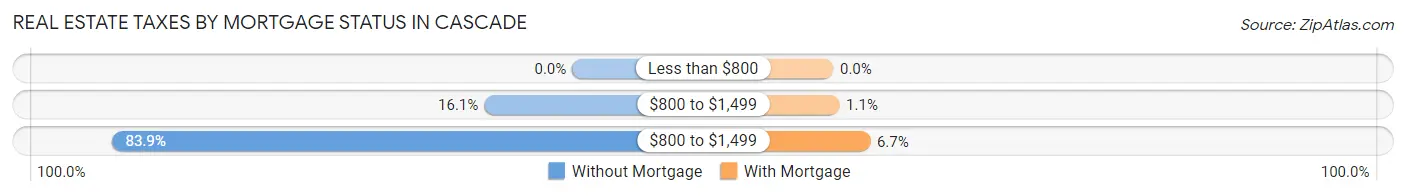
| Property Taxes | Without Mortgage | With Mortgage |
| Less than $800 | 0 (0.0%) | 0 (0.0%) |
| $800 to $1,499 | 9 (16.1%) | 2 (1.1%) |
| $800 to $1,499 | 47 (83.9%) | 12 (6.7%) |
| Total | 56 (100.0%) | 178 (100.0%) |
Health & Disability in Cascade
Health Insurance Coverage by Age in Cascade
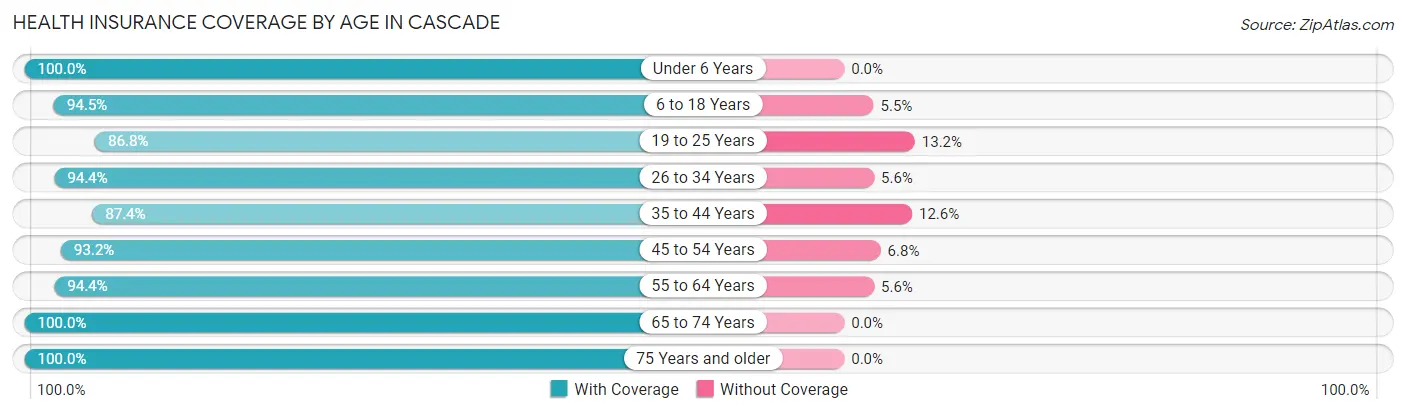
| Age Bracket | With Coverage | Without Coverage |
| Under 6 Years | 26 (100.0%) | 0 (0.0%) |
| 6 to 18 Years | 121 (94.5%) | 7 (5.5%) |
| 19 to 25 Years | 33 (86.8%) | 5 (13.2%) |
| 26 to 34 Years | 51 (94.4%) | 3 (5.6%) |
| 35 to 44 Years | 76 (87.4%) | 11 (12.6%) |
| 45 to 54 Years | 110 (93.2%) | 8 (6.8%) |
| 55 to 64 Years | 85 (94.4%) | 5 (5.6%) |
| 65 to 74 Years | 82 (100.0%) | 0 (0.0%) |
| 75 Years and older | 27 (100.0%) | 0 (0.0%) |
| Total | 611 (94.0%) | 39 (6.0%) |
Health Insurance Coverage by Citizenship Status in Cascade
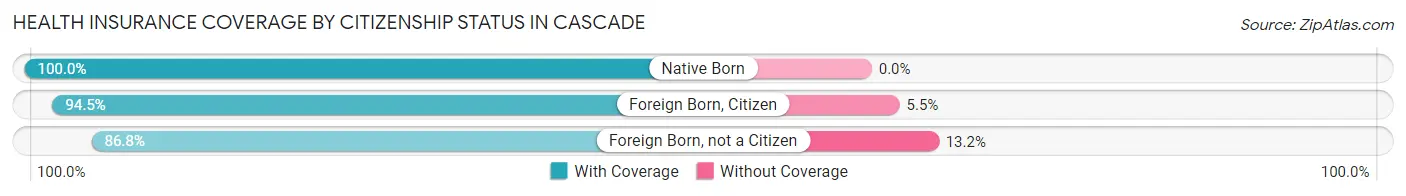
| Citizenship Status | With Coverage | Without Coverage |
| Native Born | 26 (100.0%) | 0 (0.0%) |
| Foreign Born, Citizen | 121 (94.5%) | 7 (5.5%) |
| Foreign Born, not a Citizen | 33 (86.8%) | 5 (13.2%) |
Health Insurance Coverage by Household Income in Cascade
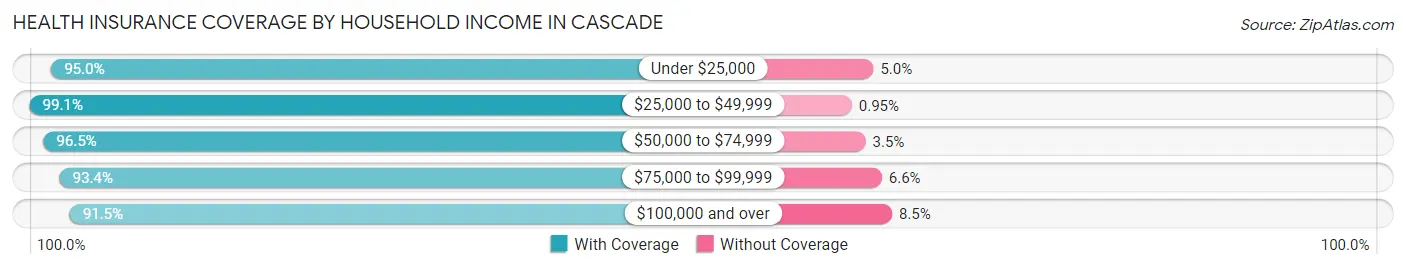
| Household Income | With Coverage | Without Coverage |
| Under $25,000 | 38 (95.0%) | 2 (5.0%) |
| $25,000 to $49,999 | 104 (99.1%) | 1 (0.9%) |
| $50,000 to $74,999 | 82 (96.5%) | 3 (3.5%) |
| $75,000 to $99,999 | 128 (93.4%) | 9 (6.6%) |
| $100,000 and over | 259 (91.5%) | 24 (8.5%) |
Public vs Private Health Insurance Coverage by Age in Cascade
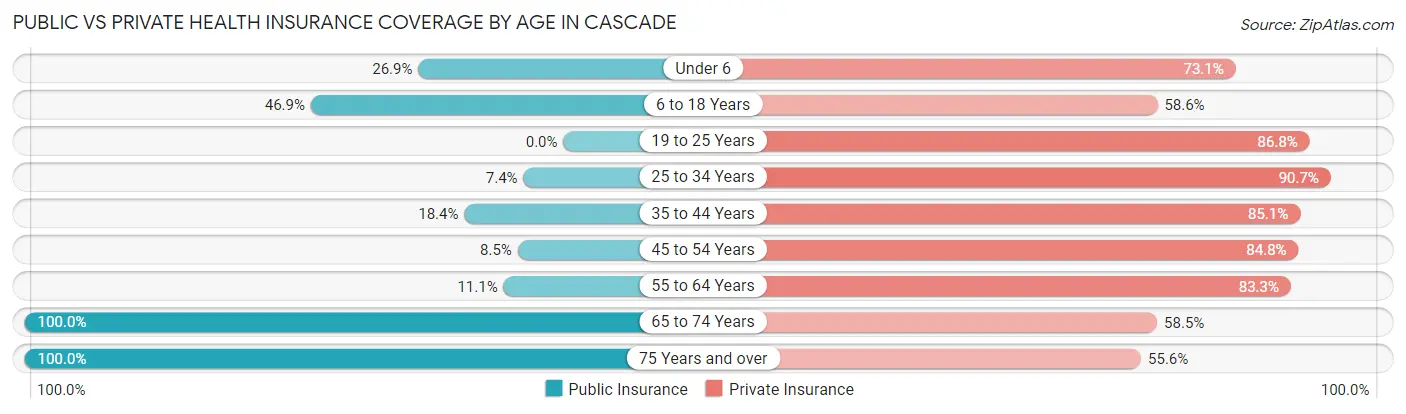
| Age Bracket | Public Insurance | Private Insurance |
| Under 6 | 7 (26.9%) | 19 (73.1%) |
| 6 to 18 Years | 60 (46.9%) | 75 (58.6%) |
| 19 to 25 Years | 0 (0.0%) | 33 (86.8%) |
| 25 to 34 Years | 4 (7.4%) | 49 (90.7%) |
| 35 to 44 Years | 16 (18.4%) | 74 (85.1%) |
| 45 to 54 Years | 10 (8.5%) | 100 (84.8%) |
| 55 to 64 Years | 10 (11.1%) | 75 (83.3%) |
| 65 to 74 Years | 82 (100.0%) | 48 (58.5%) |
| 75 Years and over | 27 (100.0%) | 15 (55.6%) |
| Total | 216 (33.2%) | 488 (75.1%) |
Disability Status by Sex by Age in Cascade
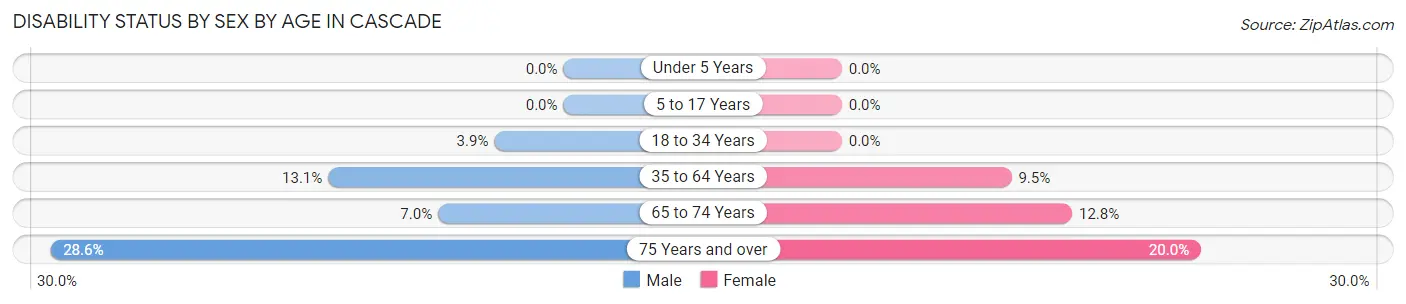
| Age Bracket | Male | Female |
| Under 5 Years | 0 (0.0%) | 0 (0.0%) |
| 5 to 17 Years | 0 (0.0%) | 0 (0.0%) |
| 18 to 34 Years | 2 (3.8%) | 0 (0.0%) |
| 35 to 64 Years | 22 (13.1%) | 12 (9.5%) |
| 65 to 74 Years | 3 (7.0%) | 5 (12.8%) |
| 75 Years and over | 2 (28.6%) | 4 (20.0%) |
Disability Class by Sex by Age in Cascade
Disability Class: Hearing Difficulty
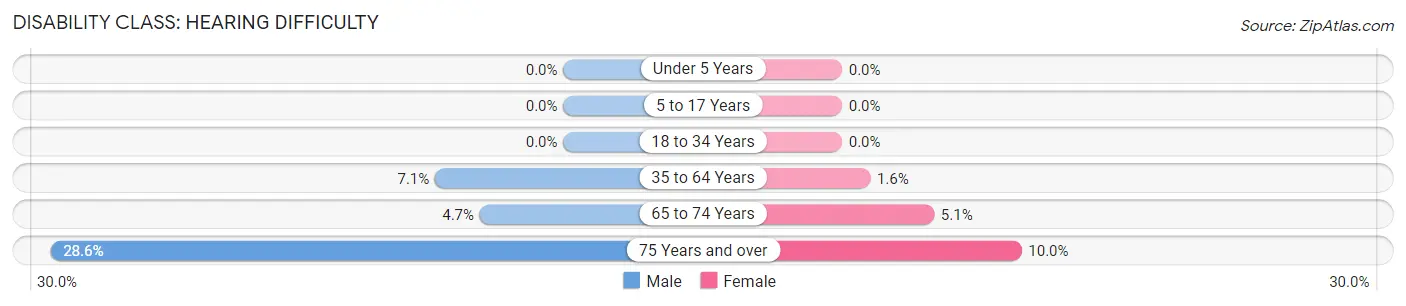
| Age Bracket | Male | Female |
| Under 5 Years | 0 (0.0%) | 0 (0.0%) |
| 5 to 17 Years | 0 (0.0%) | 0 (0.0%) |
| 18 to 34 Years | 0 (0.0%) | 0 (0.0%) |
| 35 to 64 Years | 12 (7.1%) | 2 (1.6%) |
| 65 to 74 Years | 2 (4.6%) | 2 (5.1%) |
| 75 Years and over | 2 (28.6%) | 2 (10.0%) |
Disability Class: Vision Difficulty
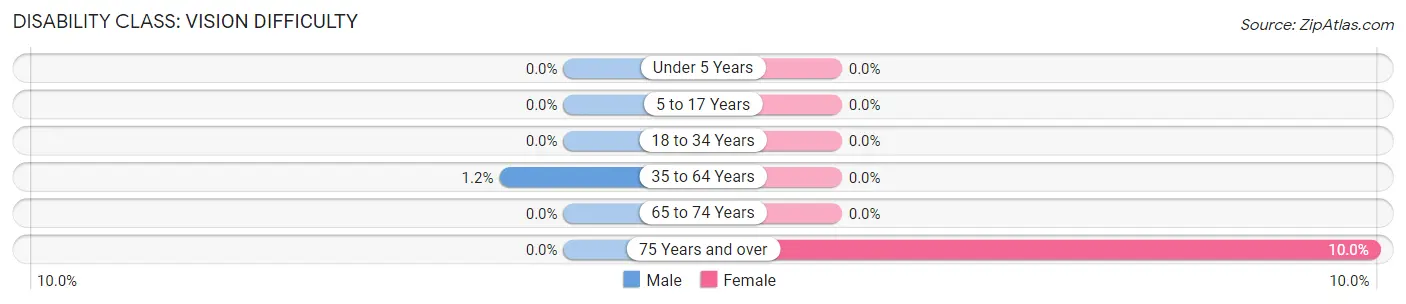
| Age Bracket | Male | Female |
| Under 5 Years | 0 (0.0%) | 0 (0.0%) |
| 5 to 17 Years | 0 (0.0%) | 0 (0.0%) |
| 18 to 34 Years | 0 (0.0%) | 0 (0.0%) |
| 35 to 64 Years | 2 (1.2%) | 0 (0.0%) |
| 65 to 74 Years | 0 (0.0%) | 0 (0.0%) |
| 75 Years and over | 0 (0.0%) | 2 (10.0%) |
Disability Class: Cognitive Difficulty
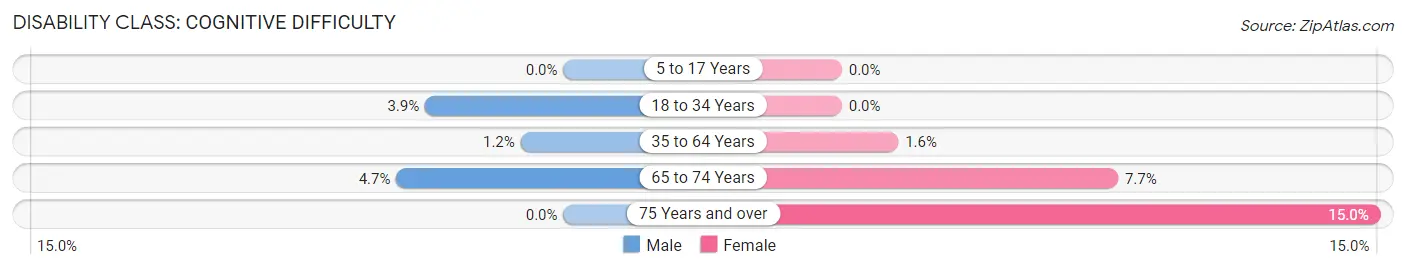
| Age Bracket | Male | Female |
| 5 to 17 Years | 0 (0.0%) | 0 (0.0%) |
| 18 to 34 Years | 2 (3.8%) | 0 (0.0%) |
| 35 to 64 Years | 2 (1.2%) | 2 (1.6%) |
| 65 to 74 Years | 2 (4.6%) | 3 (7.7%) |
| 75 Years and over | 0 (0.0%) | 3 (15.0%) |
Disability Class: Ambulatory Difficulty
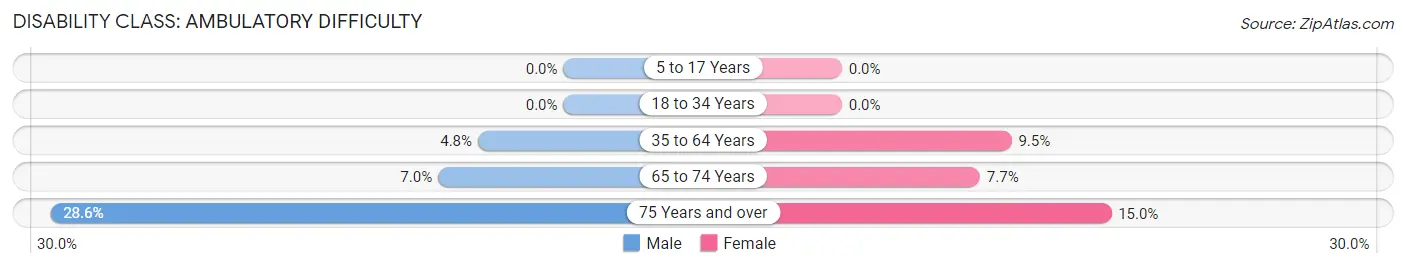
| Age Bracket | Male | Female |
| 5 to 17 Years | 0 (0.0%) | 0 (0.0%) |
| 18 to 34 Years | 0 (0.0%) | 0 (0.0%) |
| 35 to 64 Years | 8 (4.8%) | 12 (9.5%) |
| 65 to 74 Years | 3 (7.0%) | 3 (7.7%) |
| 75 Years and over | 2 (28.6%) | 3 (15.0%) |
Disability Class: Self-Care Difficulty
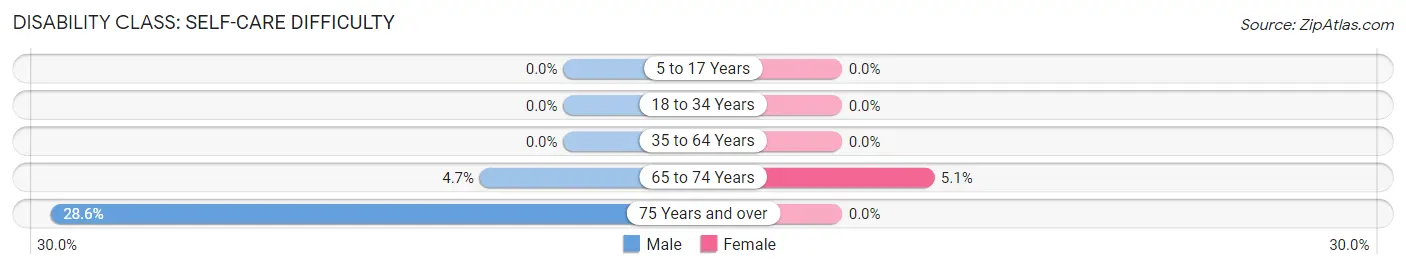
| Age Bracket | Male | Female |
| 5 to 17 Years | 0 (0.0%) | 0 (0.0%) |
| 18 to 34 Years | 0 (0.0%) | 0 (0.0%) |
| 35 to 64 Years | 0 (0.0%) | 0 (0.0%) |
| 65 to 74 Years | 2 (4.6%) | 2 (5.1%) |
| 75 Years and over | 2 (28.6%) | 0 (0.0%) |
Technology Access in Cascade
Computing Device Access in Cascade
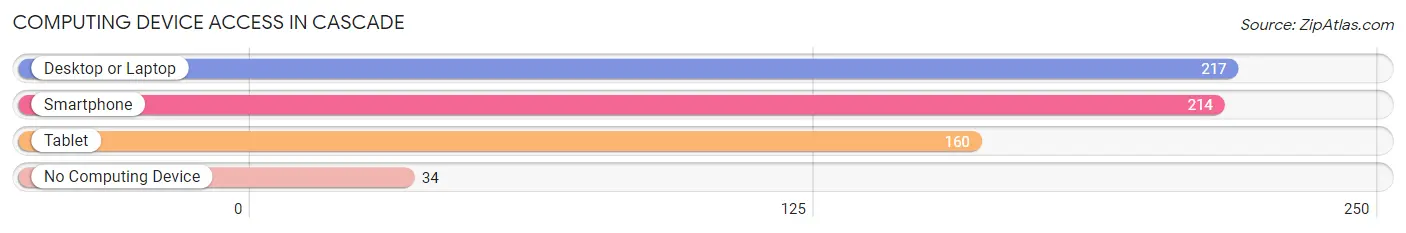
| Device Type | # Households | % Households |
| Desktop or Laptop | 217 | 81.3% |
| Smartphone | 214 | 80.1% |
| Tablet | 160 | 59.9% |
| No Computing Device | 34 | 12.7% |
| Total | 267 | 100.0% |
Internet Access in Cascade
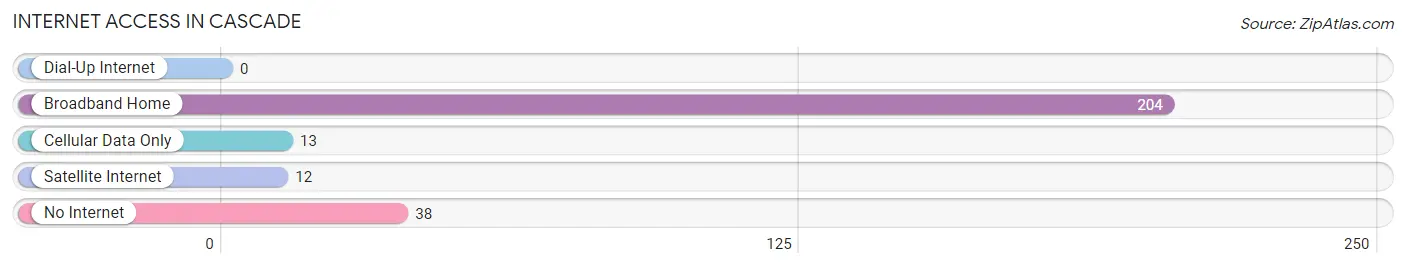
| Internet Type | # Households | % Households |
| Dial-Up Internet | 0 | 0.0% |
| Broadband Home | 204 | 76.4% |
| Cellular Data Only | 13 | 4.9% |
| Satellite Internet | 12 | 4.5% |
| No Internet | 38 | 14.2% |
| Total | 267 | 100.0% |
Cascade Summary
Cascade, Wisconsin is a small village located in Sheboygan County, Wisconsin. It is situated on the Sheboygan River, approximately 25 miles north of Sheboygan and 40 miles south of Milwaukee. The village has a population of 1,845 people, according to the 2010 census.
History
The area that is now Cascade was first settled in the early 1800s by German immigrants. The village was originally known as “Kleine Kaskade”, which translates to “Little Cascade” in English. The name was changed to Cascade in 1845 when the village was officially incorporated.
The village was an important stop on the Milwaukee and Northern Railroad, which ran from Milwaukee to Sheboygan. The railroad was a major factor in the growth of the village, as it allowed for the transportation of goods and people.
In the late 1800s, Cascade was a thriving community with a variety of businesses, including a hotel, a bank, a sawmill, a grist mill, a blacksmith shop, and a cheese factory. The village also had a number of churches, including a Catholic church, a Lutheran church, and a Methodist church.
Geography
Cascade is located in the southeastern corner of Sheboygan County, Wisconsin. It is situated on the Sheboygan River, approximately 25 miles north of Sheboygan and 40 miles south of Milwaukee. The village is surrounded by rolling hills and farmland.
The village has a total area of 1.2 square miles, all of which is land. The elevation of the village is 845 feet above sea level.
Economy
The economy of Cascade is largely based on agriculture and tourism. The village is home to a number of farms, which produce a variety of crops, including corn, soybeans, and wheat. The village also has a number of small businesses, including restaurants, shops, and a gas station.
Tourism is an important part of the local economy. The village is home to a number of attractions, including the Cascade Historical Society Museum, the Cascade Mill, and the Cascade Water Park. The village also hosts a number of festivals and events throughout the year, including the Cascade Summer Festival and the Cascade Fall Festival.
Demographics
According to the 2010 census, the population of Cascade was 1,845 people. The racial makeup of the village was 97.3% White, 0.7% African American, 0.3% Native American, 0.3% Asian, 0.2% from other races, and 1.2% from two or more races. Hispanic or Latino of any race were 1.2% of the population.
The median household income in Cascade was $50,938, and the median family income was $60,000. The per capita income for the village was $22,845. About 5.3% of families and 7.2% of the population were below the poverty line, including 8.3% of those under age 18 and 5.2% of those age 65 or over.
Common Questions
What is Per Capita Income in Cascade?
Per Capita income in Cascade is $42,024.
What is the Median Family Income in Cascade?
Median Family Income in Cascade is $97,188.
What is the Median Household income in Cascade?
Median Household Income in Cascade is $81,806.
What is Income or Wage Gap in Cascade?
Income or Wage Gap in Cascade is 40.5%.
Women in Cascade earn 59.5 cents for every dollar earned by a man.
What is Inequality or Gini Index in Cascade?
Inequality or Gini Index in Cascade is 0.39.
What is the Total Population of Cascade?
Total Population of Cascade is 650.
What is the Total Male Population of Cascade?
Total Male Population of Cascade is 336.
What is the Total Female Population of Cascade?
Total Female Population of Cascade is 314.
What is the Ratio of Males per 100 Females in Cascade?
There are 107.01 Males per 100 Females in Cascade.
What is the Ratio of Females per 100 Males in Cascade?
There are 93.45 Females per 100 Males in Cascade.
What is the Median Population Age in Cascade?
Median Population Age in Cascade is 44.1 Years.
What is the Average Family Size in Cascade
Average Family Size in Cascade is 2.9 People.
What is the Average Household Size in Cascade
Average Household Size in Cascade is 2.4 People.
How Large is the Labor Force in Cascade?
There are 372 People in the Labor Forcein in Cascade.
What is the Percentage of People in the Labor Force in Cascade?
72.1% of People are in the Labor Force in Cascade.
What is the Unemployment Rate in Cascade?
Unemployment Rate in Cascade is 0.8%.