Zip Codes with the Highest Percentage of Population Employed in Transportation & Warehousing in Washington
RELATED REPORTS & OPTIONS
Transportation & Warehousing
Washington
Compare Zip Codes
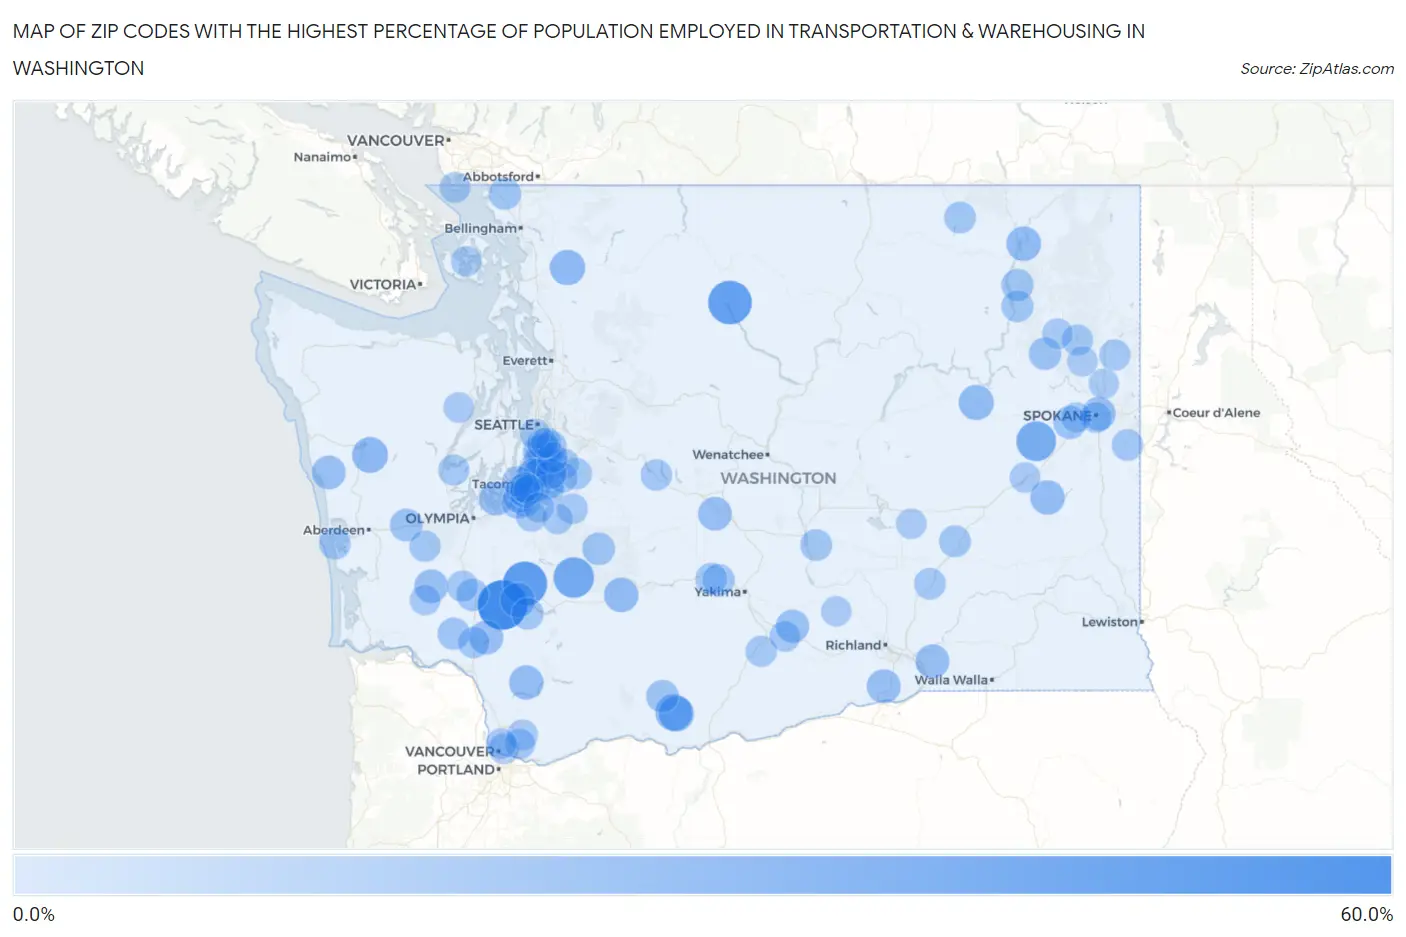
Map of Zip Codes with the Highest Percentage of Population Employed in Transportation & Warehousing in Washington
0.0%
60.0%
Zip Codes with the Highest Percentage of Population Employed in Transportation & Warehousing in Washington
| Zip Code | % Employed | vs State | vs National | |
| 1. | 98582 | 51.0% | 4.9%(+46.1)#1 | 4.9%(+46.0)#73 |
| 2. | 98533 | 38.8% | 4.9%(+33.9)#2 | 4.9%(+33.9)#138 |
| 3. | 98852 | 37.5% | 4.9%(+32.6)#3 | 4.9%(+32.6)#151 |
| 4. | 98355 | 30.1% | 4.9%(+25.2)#4 | 4.9%(+25.2)#224 |
| 5. | 99008 | 28.3% | 4.9%(+23.4)#5 | 4.9%(+23.3)#264 |
| 6. | 98670 | 21.4% | 4.9%(+16.5)#6 | 4.9%(+16.5)#459 |
| 7. | 98575 | 19.6% | 4.9%(+14.7)#7 | 4.9%(+14.6)#570 |
| 8. | 98628 | 18.9% | 4.9%(+14.0)#8 | 4.9%(+14.0)#597 |
| 9. | 98263 | 18.6% | 4.9%(+13.6)#9 | 4.9%(+13.6)#633 |
| 10. | 99117 | 18.1% | 4.9%(+13.2)#10 | 4.9%(+13.2)#673 |
| 11. | 98585 | 17.2% | 4.9%(+12.3)#11 | 4.9%(+12.3)#750 |
| 12. | 99151 | 17.0% | 4.9%(+12.1)#12 | 4.9%(+12.1)#773 |
| 13. | 99017 | 16.8% | 4.9%(+11.9)#13 | 4.9%(+11.9)#791 |
| 14. | 98361 | 16.8% | 4.9%(+11.9)#14 | 4.9%(+11.9)#792 |
| 15. | 98603 | 16.5% | 4.9%(+11.6)#15 | 4.9%(+11.6)#841 |
| 16. | 98645 | 15.7% | 4.9%(+10.8)#16 | 4.9%(+10.7)#953 |
| 17. | 99346 | 15.6% | 4.9%(+10.6)#17 | 4.9%(+10.6)#966 |
| 18. | 98303 | 15.3% | 4.9%(+10.4)#18 | 4.9%(+10.4)#1,007 |
| 19. | 99323 | 15.1% | 4.9%(+10.2)#19 | 4.9%(+10.2)#1,034 |
| 20. | 98587 | 15.1% | 4.9%(+10.2)#20 | 4.9%(+10.2)#1,041 |
| 21. | 98946 | 15.1% | 4.9%(+10.2)#21 | 4.9%(+10.1)#1,044 |
| 22. | 98539 | 15.1% | 4.9%(+10.1)#22 | 4.9%(+10.1)#1,055 |
| 23. | 99258 | 15.0% | 4.9%(+10.1)#23 | 4.9%(+10.1)#1,064 |
| 24. | 98188 | 14.6% | 4.9%(+9.72)#24 | 4.9%(+9.68)#1,137 |
| 25. | 98938 | 14.2% | 4.9%(+9.27)#25 | 4.9%(+9.24)#1,244 |
| 26. | 98047 | 14.1% | 4.9%(+9.15)#26 | 4.9%(+9.11)#1,272 |
| 27. | 99011 | 13.9% | 4.9%(+8.97)#27 | 4.9%(+8.94)#1,305 |
| 28. | 98032 | 13.8% | 4.9%(+8.85)#28 | 4.9%(+8.82)#1,329 |
| 29. | 98198 | 13.1% | 4.9%(+8.18)#29 | 4.9%(+8.15)#1,514 |
| 30. | 98583 | 12.8% | 4.9%(+7.85)#30 | 4.9%(+7.82)#1,604 |
| 31. | 98304 | 12.6% | 4.9%(+7.72)#31 | 4.9%(+7.69)#1,641 |
| 32. | 98619 | 12.5% | 4.9%(+7.63)#32 | 4.9%(+7.60)#1,665 |
| 33. | 99173 | 12.4% | 4.9%(+7.54)#33 | 4.9%(+7.50)#1,701 |
| 34. | 98581 | 11.9% | 4.9%(+6.95)#34 | 4.9%(+6.92)#1,915 |
| 35. | 98565 | 11.8% | 4.9%(+6.93)#35 | 4.9%(+6.90)#1,923 |
| 36. | 99167 | 11.8% | 4.9%(+6.87)#36 | 4.9%(+6.84)#1,956 |
| 37. | 98240 | 11.6% | 4.9%(+6.67)#37 | 4.9%(+6.64)#2,035 |
| 38. | 98923 | 11.5% | 4.9%(+6.58)#38 | 4.9%(+6.55)#2,075 |
| 39. | 98424 | 11.4% | 4.9%(+6.44)#39 | 4.9%(+6.40)#2,148 |
| 40. | 98439 | 11.3% | 4.9%(+6.39)#40 | 4.9%(+6.35)#2,178 |
| 41. | 98564 | 11.2% | 4.9%(+6.29)#41 | 4.9%(+6.26)#2,227 |
| 42. | 99131 | 11.1% | 4.9%(+6.20)#42 | 4.9%(+6.16)#2,274 |
| 43. | 99321 | 11.0% | 4.9%(+6.05)#43 | 4.9%(+6.02)#2,340 |
| 44. | 99341 | 10.8% | 4.9%(+5.93)#44 | 4.9%(+5.90)#2,398 |
| 45. | 99150 | 10.7% | 4.9%(+5.75)#45 | 4.9%(+5.72)#2,487 |
| 46. | 98947 | 10.6% | 4.9%(+5.72)#46 | 4.9%(+5.69)#2,511 |
| 47. | 99030 | 10.6% | 4.9%(+5.65)#47 | 4.9%(+5.62)#2,547 |
| 48. | 99326 | 10.6% | 4.9%(+5.64)#48 | 4.9%(+5.61)#2,560 |
| 49. | 98925 | 10.5% | 4.9%(+5.56)#49 | 4.9%(+5.53)#2,600 |
| 50. | 98148 | 10.2% | 4.9%(+5.33)#50 | 4.9%(+5.30)#2,731 |
| 51. | 98422 | 10.2% | 4.9%(+5.30)#51 | 4.9%(+5.27)#2,748 |
| 52. | 98595 | 10.2% | 4.9%(+5.30)#52 | 4.9%(+5.27)#2,751 |
| 53. | 98611 | 10.1% | 4.9%(+5.18)#53 | 4.9%(+5.15)#2,831 |
| 54. | 98010 | 10.0% | 4.9%(+5.11)#54 | 4.9%(+5.08)#2,868 |
| 55. | 98023 | 9.9% | 4.9%(+4.97)#55 | 4.9%(+4.94)#2,957 |
| 56. | 98568 | 9.8% | 4.9%(+4.86)#56 | 4.9%(+4.83)#3,025 |
| 57. | 98948 | 9.8% | 4.9%(+4.84)#57 | 4.9%(+4.81)#3,036 |
| 58. | 99009 | 9.4% | 4.9%(+4.44)#58 | 4.9%(+4.41)#3,358 |
| 59. | 98532 | 9.4% | 4.9%(+4.44)#59 | 4.9%(+4.40)#3,359 |
| 60. | 98030 | 9.2% | 4.9%(+4.30)#60 | 4.9%(+4.26)#3,474 |
| 61. | 98057 | 9.2% | 4.9%(+4.26)#61 | 4.9%(+4.23)#3,506 |
| 62. | 99148 | 9.2% | 4.9%(+4.24)#62 | 4.9%(+4.21)#3,525 |
| 63. | 98932 | 9.0% | 4.9%(+4.13)#63 | 4.9%(+4.10)#3,656 |
| 64. | 98444 | 9.0% | 4.9%(+4.12)#64 | 4.9%(+4.08)#3,670 |
| 65. | 98592 | 9.0% | 4.9%(+4.09)#65 | 4.9%(+4.06)#3,693 |
| 66. | 98281 | 9.0% | 4.9%(+4.09)#66 | 4.9%(+4.06)#3,698 |
| 67. | 99204 | 9.0% | 4.9%(+4.06)#67 | 4.9%(+4.02)#3,732 |
| 68. | 98499 | 8.8% | 4.9%(+3.91)#68 | 4.9%(+3.88)#3,898 |
| 69. | 98396 | 8.8% | 4.9%(+3.86)#69 | 4.9%(+3.83)#3,951 |
| 70. | 98409 | 8.7% | 4.9%(+3.74)#70 | 4.9%(+3.71)#4,090 |
| 71. | 98661 | 8.7% | 4.9%(+3.74)#71 | 4.9%(+3.71)#4,095 |
| 72. | 98387 | 8.6% | 4.9%(+3.70)#72 | 4.9%(+3.67)#4,140 |
| 73. | 98408 | 8.6% | 4.9%(+3.65)#73 | 4.9%(+3.61)#4,198 |
| 74. | 98606 | 8.5% | 4.9%(+3.59)#74 | 4.9%(+3.56)#4,270 |
| 75. | 98003 | 8.5% | 4.9%(+3.58)#75 | 4.9%(+3.55)#4,283 |
| 76. | 98360 | 8.4% | 4.9%(+3.52)#76 | 4.9%(+3.49)#4,349 |
| 77. | 99181 | 8.4% | 4.9%(+3.52)#77 | 4.9%(+3.48)#4,351 |
| 78. | 98042 | 8.4% | 4.9%(+3.51)#78 | 4.9%(+3.48)#4,364 |
| 79. | 98390 | 8.4% | 4.9%(+3.49)#79 | 4.9%(+3.46)#4,385 |
| 80. | 98682 | 8.3% | 4.9%(+3.43)#80 | 4.9%(+3.40)#4,451 |
| 81. | 98665 | 8.3% | 4.9%(+3.36)#81 | 4.9%(+3.33)#4,537 |
| 82. | 98572 | 8.3% | 4.9%(+3.35)#82 | 4.9%(+3.32)#4,559 |
| 83. | 98406 | 8.3% | 4.9%(+3.35)#83 | 4.9%(+3.32)#4,560 |
| 84. | 98320 | 8.2% | 4.9%(+3.33)#84 | 4.9%(+3.30)#4,581 |
| 85. | 98092 | 8.2% | 4.9%(+3.31)#85 | 4.9%(+3.28)#4,605 |
| 86. | 99032 | 8.0% | 4.9%(+3.13)#86 | 4.9%(+3.10)#4,826 |
| 87. | 98002 | 8.0% | 4.9%(+3.09)#87 | 4.9%(+3.06)#4,892 |
| 88. | 98031 | 8.0% | 4.9%(+3.08)#88 | 4.9%(+3.05)#4,905 |
| 89. | 98168 | 8.0% | 4.9%(+3.08)#89 | 4.9%(+3.05)#4,908 |
| 90. | 98857 | 8.0% | 4.9%(+3.06)#90 | 4.9%(+3.02)#4,942 |
| 91. | 98404 | 7.9% | 4.9%(+3.00)#91 | 4.9%(+2.96)#5,016 |
| 92. | 98418 | 7.9% | 4.9%(+2.99)#92 | 4.9%(+2.96)#5,019 |
| 93. | 99001 | 7.9% | 4.9%(+2.95)#93 | 4.9%(+2.92)#5,093 |
| 94. | 98286 | 7.8% | 4.9%(+2.93)#94 | 4.9%(+2.90)#5,122 |
| 95. | 98106 | 7.8% | 4.9%(+2.89)#95 | 4.9%(+2.86)#5,180 |
| 96. | 98375 | 7.7% | 4.9%(+2.80)#96 | 4.9%(+2.77)#5,302 |
| 97. | 99005 | 7.7% | 4.9%(+2.77)#97 | 4.9%(+2.73)#5,359 |
| 98. | 98944 | 7.7% | 4.9%(+2.76)#98 | 4.9%(+2.73)#5,363 |
| 99. | 98178 | 7.7% | 4.9%(+2.74)#99 | 4.9%(+2.70)#5,394 |
| 100. | 99006 | 7.6% | 4.9%(+2.69)#100 | 4.9%(+2.66)#5,484 |
Common Questions
What are the Top 10 Zip Codes with the Highest Percentage of Population Employed in Transportation & Warehousing in Washington?
Top 10 Zip Codes with the Highest Percentage of Population Employed in Transportation & Warehousing in Washington are:
What zip code has the Highest Percentage of Population Employed in Transportation & Warehousing in Washington?
98582 has the Highest Percentage of Population Employed in Transportation & Warehousing in Washington with 51.0%.
What is the Percentage of Population Employed in Transportation & Warehousing in the State of Washington?
Percentage of Population Employed in Transportation & Warehousing in Washington is 4.9%.
What is the Percentage of Population Employed in Transportation & Warehousing in the United States?
Percentage of Population Employed in Transportation & Warehousing in the United States is 4.9%.