Zip Codes with the Highest Percentage of Population with a Degree in Literature and Languages in Washington
RELATED REPORTS & OPTIONS
Literature and Languages
Washington
Compare Zip Codes
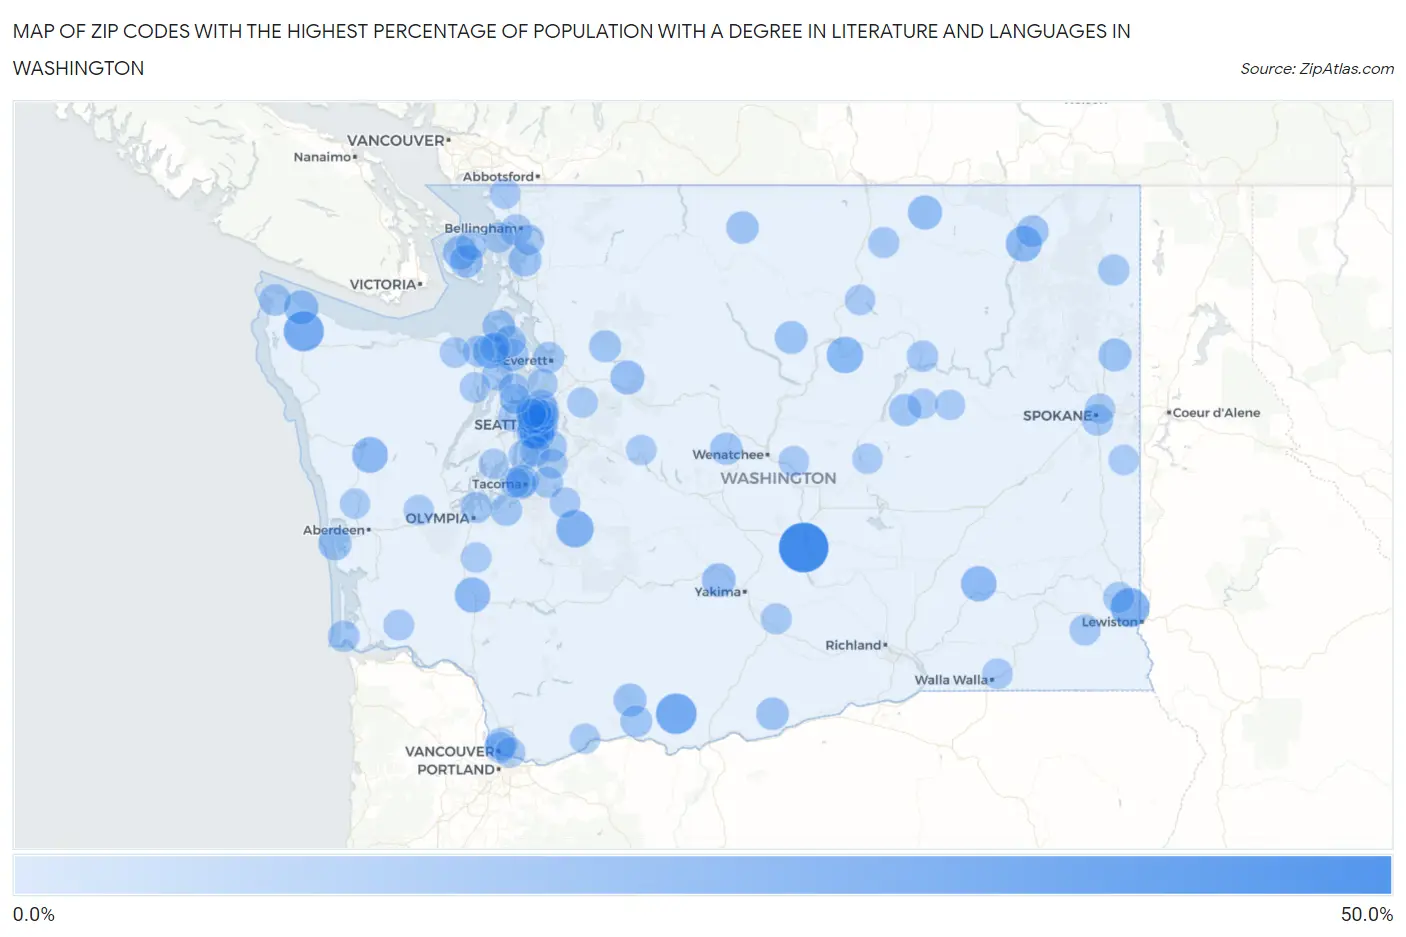
Map of Zip Codes with the Highest Percentage of Population with a Degree in Literature and Languages in Washington
0.0%
50.0%
Zip Codes with the Highest Percentage of Population with a Degree in Literature and Languages in Washington
| Zip Code | % Graduates | vs State | vs National | |
| 1. | 98950 | 50.0% | 5.3%(+44.7)#1 | 4.4%(+45.6)#77 |
| 2. | 98628 | 29.6% | 5.3%(+24.3)#2 | 4.4%(+25.2)#205 |
| 3. | 98326 | 28.7% | 5.3%(+23.4)#3 | 4.4%(+24.3)#218 |
| 4. | 99179 | 25.5% | 5.3%(+20.2)#4 | 4.4%(+21.1)#292 |
| 5. | 98323 | 22.5% | 5.3%(+17.3)#5 | 4.4%(+18.1)#373 |
| 6. | 98134 | 20.8% | 5.3%(+15.5)#6 | 4.4%(+16.4)#447 |
| 7. | 98813 | 20.4% | 5.3%(+15.1)#7 | 4.4%(+16.0)#459 |
| 8. | 99151 | 19.2% | 5.3%(+13.9)#8 | 4.4%(+14.8)#513 |
| 9. | 98575 | 19.0% | 5.3%(+13.8)#9 | 4.4%(+14.6)#518 |
| 10. | 98565 | 18.2% | 5.3%(+12.9)#10 | 4.4%(+13.8)#565 |
| 11. | 99335 | 18.2% | 5.3%(+12.9)#11 | 4.4%(+13.8)#568 |
| 12. | 98339 | 15.8% | 5.3%(+10.5)#12 | 4.4%(+11.4)#739 |
| 13. | 98381 | 15.8% | 5.3%(+10.5)#13 | 4.4%(+11.4)#743 |
| 14. | 98859 | 15.6% | 5.3%(+10.3)#14 | 4.4%(+11.2)#760 |
| 15. | 98251 | 15.2% | 5.3%(+9.90)#15 | 4.4%(+10.8)#801 |
| 16. | 98243 | 14.9% | 5.3%(+9.60)#16 | 4.4%(+10.5)#828 |
| 17. | 98923 | 14.4% | 5.3%(+9.11)#17 | 4.4%(+9.98)#883 |
| 18. | 98595 | 13.4% | 5.3%(+8.11)#18 | 4.4%(+8.99)#994 |
| 19. | 98286 | 13.3% | 5.3%(+7.98)#19 | 4.4%(+8.86)#1,017 |
| 20. | 98232 | 13.0% | 5.3%(+7.73)#20 | 4.4%(+8.60)#1,046 |
| 21. | 99009 | 13.0% | 5.3%(+7.70)#21 | 4.4%(+8.57)#1,052 |
| 22. | 98650 | 12.8% | 5.3%(+7.47)#22 | 4.4%(+8.35)#1,088 |
| 23. | 98834 | 12.7% | 5.3%(+7.42)#23 | 4.4%(+8.29)#1,100 |
| 24. | 98402 | 12.4% | 5.3%(+7.11)#24 | 4.4%(+7.98)#1,156 |
| 25. | 99356 | 12.1% | 5.3%(+6.84)#25 | 4.4%(+7.71)#1,202 |
| 26. | 98239 | 12.0% | 5.3%(+6.68)#26 | 4.4%(+7.55)#1,228 |
| 27. | 98833 | 11.9% | 5.3%(+6.62)#27 | 4.4%(+7.50)#1,238 |
| 28. | 98847 | 11.5% | 5.3%(+6.26)#28 | 4.4%(+7.14)#1,321 |
| 29. | 99135 | 11.5% | 5.3%(+6.19)#29 | 4.4%(+7.07)#1,337 |
| 30. | 98249 | 11.4% | 5.3%(+6.09)#30 | 4.4%(+6.96)#1,368 |
| 31. | 99126 | 11.1% | 5.3%(+5.83)#31 | 4.4%(+6.70)#1,429 |
| 32. | 98252 | 10.8% | 5.3%(+5.55)#32 | 4.4%(+6.42)#1,520 |
| 33. | 98672 | 10.4% | 5.3%(+5.07)#33 | 4.4%(+5.95)#1,692 |
| 34. | 98253 | 10.3% | 5.3%(+4.97)#34 | 4.4%(+5.84)#1,728 |
| 35. | 98665 | 10.2% | 5.3%(+4.95)#35 | 4.4%(+5.83)#1,731 |
| 36. | 98357 | 10.2% | 5.3%(+4.93)#36 | 4.4%(+5.81)#1,738 |
| 37. | 98433 | 10.2% | 5.3%(+4.89)#37 | 4.4%(+5.77)#1,751 |
| 38. | 98225 | 9.9% | 5.3%(+4.58)#38 | 4.4%(+5.45)#1,887 |
| 39. | 98644 | 9.8% | 5.3%(+4.54)#39 | 4.4%(+5.42)#1,904 |
| 40. | 98368 | 9.8% | 5.3%(+4.48)#40 | 4.4%(+5.35)#1,931 |
| 41. | 99124 | 9.5% | 5.3%(+4.24)#41 | 4.4%(+5.11)#2,031 |
| 42. | 98506 | 9.4% | 5.3%(+4.12)#42 | 4.4%(+4.99)#2,084 |
| 43. | 99203 | 9.4% | 5.3%(+4.09)#43 | 4.4%(+4.96)#2,105 |
| 44. | 98112 | 9.2% | 5.3%(+3.95)#44 | 4.4%(+4.83)#2,187 |
| 45. | 98201 | 9.2% | 5.3%(+3.93)#45 | 4.4%(+4.81)#2,195 |
| 46. | 98365 | 9.2% | 5.3%(+3.91)#46 | 4.4%(+4.79)#2,210 |
| 47. | 99119 | 9.1% | 5.3%(+3.86)#47 | 4.4%(+4.73)#2,240 |
| 48. | 98855 | 9.0% | 5.3%(+3.69)#48 | 4.4%(+4.57)#2,332 |
| 49. | 98057 | 9.0% | 5.3%(+3.67)#49 | 4.4%(+4.54)#2,342 |
| 50. | 98110 | 8.9% | 5.3%(+3.59)#50 | 4.4%(+4.47)#2,387 |
| 51. | 99113 | 8.9% | 5.3%(+3.59)#51 | 4.4%(+4.47)#2,388 |
| 52. | 98126 | 8.9% | 5.3%(+3.59)#52 | 4.4%(+4.46)#2,391 |
| 53. | 98663 | 8.7% | 5.3%(+3.42)#53 | 4.4%(+4.30)#2,469 |
| 54. | 98108 | 8.7% | 5.3%(+3.42)#54 | 4.4%(+4.29)#2,475 |
| 55. | 98953 | 8.7% | 5.3%(+3.37)#55 | 4.4%(+4.25)#2,510 |
| 56. | 99347 | 8.5% | 5.3%(+3.26)#56 | 4.4%(+4.14)#2,580 |
| 57. | 98117 | 8.4% | 5.3%(+3.15)#57 | 4.4%(+4.02)#2,658 |
| 58. | 98047 | 8.4% | 5.3%(+3.14)#58 | 4.4%(+4.01)#2,665 |
| 59. | 98346 | 8.3% | 5.3%(+3.05)#59 | 4.4%(+3.92)#2,716 |
| 60. | 98125 | 8.3% | 5.3%(+3.04)#60 | 4.4%(+3.91)#2,744 |
| 61. | 98621 | 8.1% | 5.3%(+2.86)#61 | 4.4%(+3.73)#2,874 |
| 62. | 98106 | 8.0% | 5.3%(+2.76)#62 | 4.4%(+3.63)#2,953 |
| 63. | 98376 | 8.0% | 5.3%(+2.73)#63 | 4.4%(+3.60)#2,967 |
| 64. | 98144 | 8.0% | 5.3%(+2.73)#64 | 4.4%(+3.60)#2,970 |
| 65. | 98385 | 8.0% | 5.3%(+2.72)#65 | 4.4%(+3.59)#2,982 |
| 66. | 98229 | 8.0% | 5.3%(+2.67)#66 | 4.4%(+3.55)#3,019 |
| 67. | 98262 | 7.9% | 5.3%(+2.58)#67 | 4.4%(+3.45)#3,096 |
| 68. | 98850 | 7.8% | 5.3%(+2.53)#68 | 4.4%(+3.40)#3,145 |
| 69. | 98240 | 7.8% | 5.3%(+2.53)#69 | 4.4%(+3.40)#3,150 |
| 70. | 98102 | 7.8% | 5.3%(+2.51)#70 | 4.4%(+3.39)#3,162 |
| 71. | 98019 | 7.8% | 5.3%(+2.50)#71 | 4.4%(+3.37)#3,177 |
| 72. | 98115 | 7.8% | 5.3%(+2.49)#72 | 4.4%(+3.36)#3,185 |
| 73. | 98664 | 7.7% | 5.3%(+2.45)#73 | 4.4%(+3.33)#3,220 |
| 74. | 99362 | 7.6% | 5.3%(+2.37)#74 | 4.4%(+3.24)#3,307 |
| 75. | 98382 | 7.6% | 5.3%(+2.34)#75 | 4.4%(+3.22)#3,330 |
| 76. | 98070 | 7.5% | 5.3%(+2.26)#76 | 4.4%(+3.14)#3,399 |
| 77. | 98840 | 7.5% | 5.3%(+2.26)#77 | 4.4%(+3.13)#3,404 |
| 78. | 98851 | 7.5% | 5.3%(+2.25)#78 | 4.4%(+3.13)#3,407 |
| 79. | 98037 | 7.5% | 5.3%(+2.25)#79 | 4.4%(+3.12)#3,408 |
| 80. | 98530 | 7.5% | 5.3%(+2.22)#80 | 4.4%(+3.09)#3,438 |
| 81. | 98405 | 7.5% | 5.3%(+2.19)#81 | 4.4%(+3.06)#3,476 |
| 82. | 99012 | 7.5% | 5.3%(+2.19)#82 | 4.4%(+3.06)#3,479 |
| 83. | 98648 | 7.5% | 5.3%(+2.18)#83 | 4.4%(+3.05)#3,486 |
| 84. | 98119 | 7.4% | 5.3%(+2.17)#84 | 4.4%(+3.04)#3,498 |
| 85. | 98245 | 7.4% | 5.3%(+2.16)#85 | 4.4%(+3.03)#3,504 |
| 86. | 98068 | 7.4% | 5.3%(+2.16)#86 | 4.4%(+3.03)#3,508 |
| 87. | 99207 | 7.3% | 5.3%(+2.07)#87 | 4.4%(+2.94)#3,606 |
| 88. | 98105 | 7.3% | 5.3%(+2.06)#88 | 4.4%(+2.93)#3,612 |
| 89. | 98166 | 7.3% | 5.3%(+2.00)#89 | 4.4%(+2.87)#3,676 |
| 90. | 99103 | 7.3% | 5.3%(+1.99)#90 | 4.4%(+2.86)#3,682 |
| 91. | 98103 | 7.3% | 5.3%(+1.98)#91 | 4.4%(+2.85)#3,691 |
| 92. | 98465 | 7.2% | 5.3%(+1.96)#92 | 4.4%(+2.83)#3,716 |
| 93. | 98550 | 7.2% | 5.3%(+1.95)#93 | 4.4%(+2.82)#3,727 |
| 94. | 98329 | 7.2% | 5.3%(+1.91)#94 | 4.4%(+2.78)#3,770 |
| 95. | 98541 | 7.1% | 5.3%(+1.85)#95 | 4.4%(+2.73)#3,831 |
| 96. | 98358 | 7.1% | 5.3%(+1.83)#96 | 4.4%(+2.70)#3,854 |
| 97. | 98030 | 7.1% | 5.3%(+1.83)#97 | 4.4%(+2.70)#3,855 |
| 98. | 99185 | 7.1% | 5.3%(+1.80)#98 | 4.4%(+2.67)#3,893 |
| 99. | 98107 | 7.1% | 5.3%(+1.79)#99 | 4.4%(+2.66)#3,924 |
| 100. | 98342 | 7.1% | 5.3%(+1.78)#100 | 4.4%(+2.66)#3,927 |
Common Questions
What are the Top 10 Zip Codes with the Highest Percentage of Population with a Degree in Literature and Languages in Washington?
Top 10 Zip Codes with the Highest Percentage of Population with a Degree in Literature and Languages in Washington are:
What zip code has the Highest Percentage of Population with a Degree in Literature and Languages in Washington?
98950 has the Highest Percentage of Population with a Degree in Literature and Languages in Washington with 50.0%.
What is the Percentage of Population with a Degree in Literature and Languages in the State of Washington?
Percentage of Population with a Degree in Literature and Languages in Washington is 5.3%.
What is the Percentage of Population with a Degree in Literature and Languages in the United States?
Percentage of Population with a Degree in Literature and Languages in the United States is 4.4%.