Zip Codes with the Highest Percentage of Households Without a Vehicle in Washington
RELATED REPORTS & OPTIONS
Households without a Cars
Washington
Compare Zip Codes
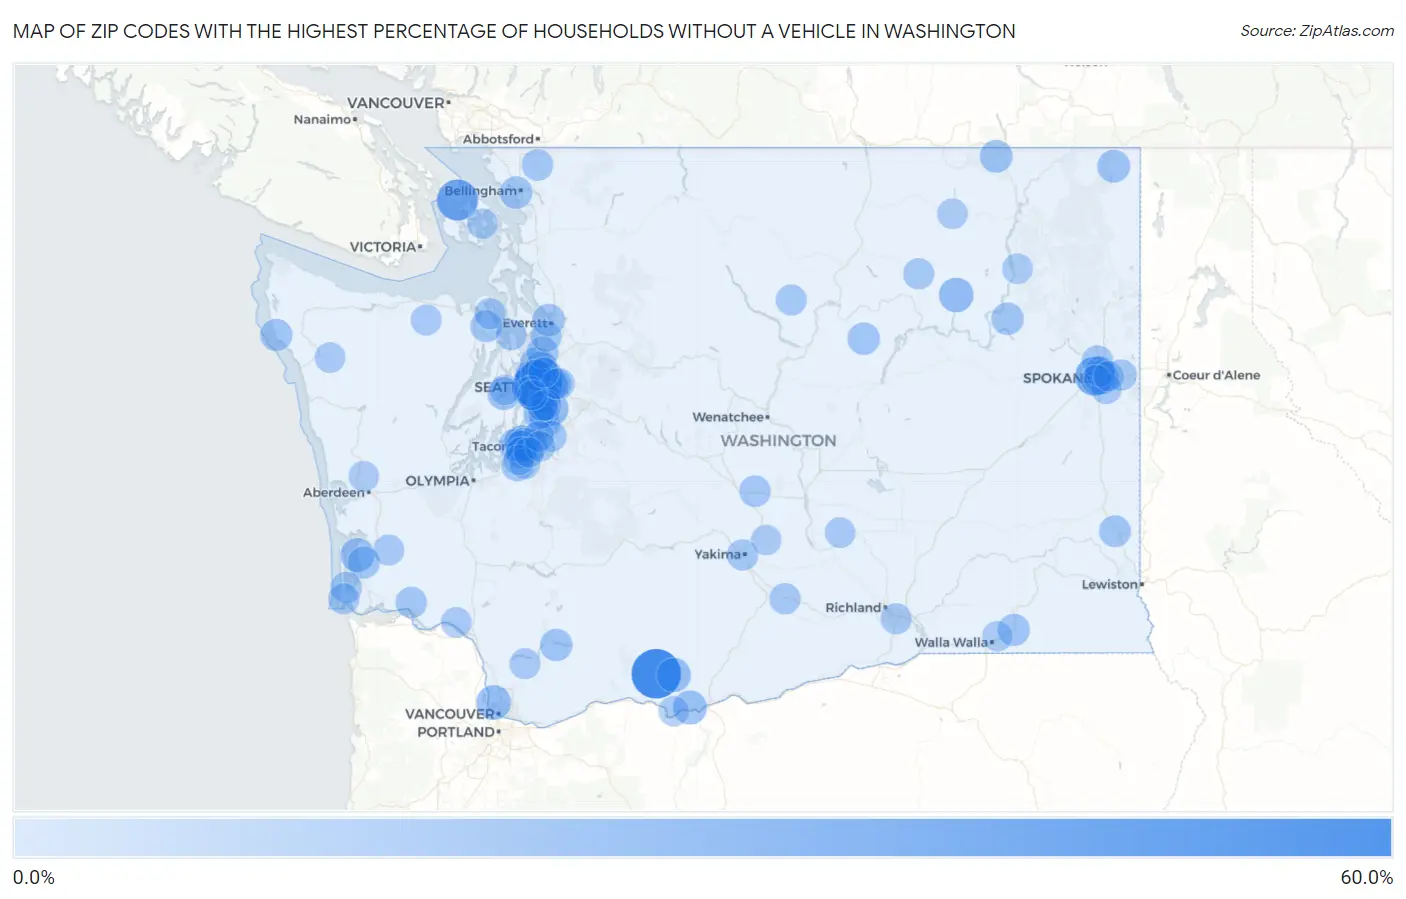
Map of Zip Codes with the Highest Percentage of Households Without a Vehicle in Washington
0.0%
60.0%
Zip Codes with the Highest Percentage of Households Without a Vehicle in Washington
| Zip Code | Housholds Without a Car | vs State | vs National | |
| 1. | 98602 | 56.7% | 6.9%(+49.8)#1 | 8.3%(+48.4)#296 |
| 2. | 98104 | 55.1% | 6.9%(+48.2)#2 | 8.3%(+46.8)#307 |
| 3. | 98101 | 51.6% | 6.9%(+44.7)#3 | 8.3%(+43.3)#332 |
| 4. | 98121 | 42.5% | 6.9%(+35.6)#4 | 8.3%(+34.2)#467 |
| 5. | 98297 | 35.0% | 6.9%(+28.1)#5 | 8.3%(+26.7)#638 |
| 6. | 98122 | 34.1% | 6.9%(+27.2)#6 | 8.3%(+25.8)#656 |
| 7. | 99201 | 30.9% | 6.9%(+24.0)#7 | 8.3%(+22.6)#769 |
| 8. | 98109 | 30.0% | 6.9%(+23.1)#8 | 8.3%(+21.7)#796 |
| 9. | 98102 | 29.2% | 6.9%(+22.3)#9 | 8.3%(+20.9)#833 |
| 10. | 98164 | 28.6% | 6.9%(+21.7)#10 | 8.3%(+20.3)#867 |
| 11. | 98105 | 27.9% | 6.9%(+21.0)#11 | 8.3%(+19.6)#891 |
| 12. | 98134 | 24.1% | 6.9%(+17.2)#12 | 8.3%(+15.8)#1,132 |
| 13. | 98402 | 23.8% | 6.9%(+16.9)#13 | 8.3%(+15.5)#1,153 |
| 14. | 98119 | 21.4% | 6.9%(+14.5)#14 | 8.3%(+13.1)#1,346 |
| 15. | 98660 | 18.6% | 6.9%(+11.7)#15 | 8.3%(+10.3)#1,697 |
| 16. | 98057 | 18.1% | 6.9%(+11.2)#16 | 8.3%(+9.80)#1,768 |
| 17. | 99140 | 18.0% | 6.9%(+11.1)#17 | 8.3%(+9.70)#1,787 |
| 18. | 98670 | 17.6% | 6.9%(+10.7)#18 | 8.3%(+9.30)#1,856 |
| 19. | 98673 | 16.8% | 6.9%(+9.90)#19 | 8.3%(+8.50)#2,004 |
| 20. | 99202 | 16.4% | 6.9%(+9.50)#20 | 8.3%(+8.10)#2,077 |
| 21. | 98421 | 16.4% | 6.9%(+9.50)#21 | 8.3%(+8.10)#2,084 |
| 22. | 98527 | 16.4% | 6.9%(+9.50)#22 | 8.3%(+8.10)#2,085 |
| 23. | 98144 | 15.0% | 6.9%(+8.10)#23 | 8.3%(+6.70)#2,383 |
| 24. | 98004 | 14.7% | 6.9%(+7.80)#24 | 8.3%(+6.40)#2,466 |
| 25. | 98108 | 14.2% | 6.9%(+7.30)#25 | 8.3%(+5.90)#2,626 |
| 26. | 99153 | 13.7% | 6.9%(+6.80)#26 | 8.3%(+5.40)#2,834 |
| 27. | 99146 | 13.5% | 6.9%(+6.60)#27 | 8.3%(+5.20)#2,909 |
| 28. | 98133 | 13.4% | 6.9%(+6.50)#28 | 8.3%(+5.10)#2,912 |
| 29. | 98107 | 13.3% | 6.9%(+6.40)#29 | 8.3%(+5.00)#2,963 |
| 30. | 98337 | 13.2% | 6.9%(+6.30)#30 | 8.3%(+4.90)#3,016 |
| 31. | 98225 | 13.0% | 6.9%(+6.10)#31 | 8.3%(+4.70)#3,084 |
| 32. | 98830 | 13.0% | 6.9%(+6.10)#32 | 8.3%(+4.70)#3,116 |
| 33. | 98201 | 12.9% | 6.9%(+6.00)#33 | 8.3%(+4.60)#3,134 |
| 34. | 98439 | 12.8% | 6.9%(+5.90)#34 | 8.3%(+4.50)#3,195 |
| 35. | 99129 | 12.8% | 6.9%(+5.90)#35 | 8.3%(+4.50)#3,211 |
| 36. | 98465 | 12.7% | 6.9%(+5.80)#36 | 8.3%(+4.40)#3,238 |
| 37. | 98112 | 12.6% | 6.9%(+5.70)#37 | 8.3%(+4.30)#3,276 |
| 38. | 98616 | 12.5% | 6.9%(+5.60)#38 | 8.3%(+4.20)#3,350 |
| 39. | 98350 | 12.4% | 6.9%(+5.50)#39 | 8.3%(+4.10)#3,399 |
| 40. | 99329 | 12.3% | 6.9%(+5.40)#40 | 8.3%(+4.00)#3,452 |
| 41. | 98586 | 12.1% | 6.9%(+5.20)#41 | 8.3%(+3.80)#3,534 |
| 42. | 98125 | 12.0% | 6.9%(+5.10)#42 | 8.3%(+3.70)#3,545 |
| 43. | 98106 | 11.6% | 6.9%(+4.70)#43 | 8.3%(+3.30)#3,763 |
| 44. | 98036 | 11.2% | 6.9%(+4.30)#44 | 8.3%(+2.90)#4,000 |
| 45. | 99163 | 11.2% | 6.9%(+4.30)#45 | 8.3%(+2.90)#4,008 |
| 46. | 98403 | 11.2% | 6.9%(+4.30)#46 | 8.3%(+2.90)#4,028 |
| 47. | 98325 | 11.2% | 6.9%(+4.30)#47 | 8.3%(+2.90)#4,051 |
| 48. | 98405 | 11.1% | 6.9%(+4.20)#48 | 8.3%(+2.80)#4,076 |
| 49. | 98007 | 10.9% | 6.9%(+4.00)#49 | 8.3%(+2.60)#4,187 |
| 50. | 98118 | 10.7% | 6.9%(+3.80)#50 | 8.3%(+2.40)#4,300 |
| 51. | 98934 | 10.6% | 6.9%(+3.70)#51 | 8.3%(+2.30)#4,424 |
| 52. | 99218 | 10.5% | 6.9%(+3.60)#52 | 8.3%(+2.20)#4,464 |
| 53. | 98631 | 10.4% | 6.9%(+3.50)#53 | 8.3%(+2.10)#4,574 |
| 54. | 98647 | 10.4% | 6.9%(+3.50)#54 | 8.3%(+2.10)#4,614 |
| 55. | 98247 | 10.3% | 6.9%(+3.40)#55 | 8.3%(+2.00)#4,652 |
| 56. | 98032 | 10.2% | 6.9%(+3.30)#56 | 8.3%(+1.90)#4,697 |
| 57. | 98188 | 10.0% | 6.9%(+3.10)#57 | 8.3%(+1.70)#4,855 |
| 58. | 98339 | 9.9% | 6.9%(+3.00)#58 | 8.3%(+1.60)#4,976 |
| 59. | 98902 | 9.8% | 6.9%(+2.90)#59 | 8.3%(+1.50)#5,006 |
| 60. | 98932 | 9.8% | 6.9%(+2.90)#60 | 8.3%(+1.50)#5,053 |
| 61. | 98103 | 9.7% | 6.9%(+2.80)#61 | 8.3%(+1.40)#5,096 |
| 62. | 98644 | 9.7% | 6.9%(+2.80)#62 | 8.3%(+1.40)#5,167 |
| 63. | 99336 | 9.5% | 6.9%(+2.60)#63 | 8.3%(+1.20)#5,251 |
| 64. | 98204 | 9.5% | 6.9%(+2.60)#64 | 8.3%(+1.20)#5,252 |
| 65. | 98002 | 9.5% | 6.9%(+2.60)#65 | 8.3%(+1.20)#5,254 |
| 66. | 98409 | 9.5% | 6.9%(+2.60)#66 | 8.3%(+1.20)#5,262 |
| 67. | 99216 | 9.5% | 6.9%(+2.60)#67 | 8.3%(+1.20)#5,264 |
| 68. | 99155 | 9.5% | 6.9%(+2.60)#68 | 8.3%(+1.20)#5,319 |
| 69. | 98148 | 9.4% | 6.9%(+2.50)#69 | 8.3%(+1.10)#5,364 |
| 70. | 98834 | 9.2% | 6.9%(+2.30)#70 | 8.3%(+0.900)#5,609 |
| 71. | 98178 | 9.1% | 6.9%(+2.20)#71 | 8.3%(+0.800)#5,627 |
| 72. | 98362 | 9.1% | 6.9%(+2.20)#72 | 8.3%(+0.800)#5,630 |
| 73. | 98577 | 9.1% | 6.9%(+2.20)#73 | 8.3%(+0.800)#5,653 |
| 74. | 98601 | 9.1% | 6.9%(+2.20)#74 | 8.3%(+0.800)#5,674 |
| 75. | 98632 | 8.7% | 6.9%(+1.80)#75 | 8.3%(+0.400)#6,050 |
| 76. | 98168 | 8.6% | 6.9%(+1.70)#76 | 8.3%(+0.300)#6,172 |
| 77. | 99223 | 8.6% | 6.9%(+1.70)#77 | 8.3%(+0.300)#6,173 |
| 78. | 98116 | 8.5% | 6.9%(+1.60)#78 | 8.3%(+0.200)#6,316 |
| 79. | 98310 | 8.5% | 6.9%(+1.60)#79 | 8.3%(+0.200)#6,327 |
| 80. | 99207 | 8.4% | 6.9%(+1.50)#80 | 8.3%(+0.100)#6,429 |
| 81. | 98005 | 8.4% | 6.9%(+1.50)#81 | 8.3%(+0.100)#6,439 |
| 82. | 98340 | 8.4% | 6.9%(+1.50)#82 | 8.3%(+0.100)#6,488 |
| 83. | 98003 | 8.3% | 6.9%(+1.40)#83 | 8.3%(=0.000)#6,524 |
| 84. | 99349 | 8.2% | 6.9%(+1.30)#84 | 8.3%(-0.100)#6,691 |
| 85. | 98331 | 8.2% | 6.9%(+1.30)#85 | 8.3%(-0.100)#6,697 |
| 86. | 99131 | 8.2% | 6.9%(+1.30)#86 | 8.3%(-0.100)#6,773 |
| 87. | 98444 | 8.1% | 6.9%(+1.20)#87 | 8.3%(-0.200)#6,789 |
| 88. | 98126 | 8.1% | 6.9%(+1.20)#88 | 8.3%(-0.200)#6,803 |
| 89. | 99204 | 8.1% | 6.9%(+1.20)#89 | 8.3%(-0.200)#6,836 |
| 90. | 98115 | 8.0% | 6.9%(+1.10)#90 | 8.3%(-0.300)#6,897 |
| 91. | 98520 | 8.0% | 6.9%(+1.10)#91 | 8.3%(-0.300)#6,922 |
| 92. | 99166 | 8.0% | 6.9%(+1.10)#92 | 8.3%(-0.300)#7,000 |
| 93. | 98617 | 8.0% | 6.9%(+1.10)#93 | 8.3%(-0.300)#7,034 |
| 94. | 98499 | 7.9% | 6.9%(+1.000)#94 | 8.3%(-0.400)#7,077 |
| 95. | 98901 | 7.9% | 6.9%(+1.000)#95 | 8.3%(-0.400)#7,079 |
| 96. | 99362 | 7.8% | 6.9%(+0.900)#96 | 8.3%(-0.500)#7,211 |
| 97. | 99212 | 7.8% | 6.9%(+0.900)#97 | 8.3%(-0.500)#7,244 |
| 98. | 98354 | 7.8% | 6.9%(+0.900)#98 | 8.3%(-0.500)#7,269 |
| 99. | 98222 | 7.8% | 6.9%(+0.900)#99 | 8.3%(-0.500)#7,346 |
| 100. | 98404 | 7.7% | 6.9%(+0.800)#100 | 8.3%(-0.600)#7,367 |
Common Questions
What are the Top 10 Zip Codes with the Highest Percentage of Households Without a Vehicle in Washington?
Top 10 Zip Codes with the Highest Percentage of Households Without a Vehicle in Washington are:
What zip code has the Highest Percentage of Households Without a Vehicle in Washington?
98602 has the Highest Percentage of Households Without a Vehicle in Washington with 56.7%.
What is the Percentage of Households Without a Vehicle in the State of Washington?
Percentage of Households Without a Vehicle in Washington is 6.9%.
What is the Percentage of Households Without a Vehicle in the United States?
Percentage of Households Without a Vehicle in the United States is 8.3%.