Zip Codes with the Highest Percentage of Population Employed in Community & Social Service in Washington
RELATED REPORTS & OPTIONS
Community & Social Service
Washington
Compare Zip Codes
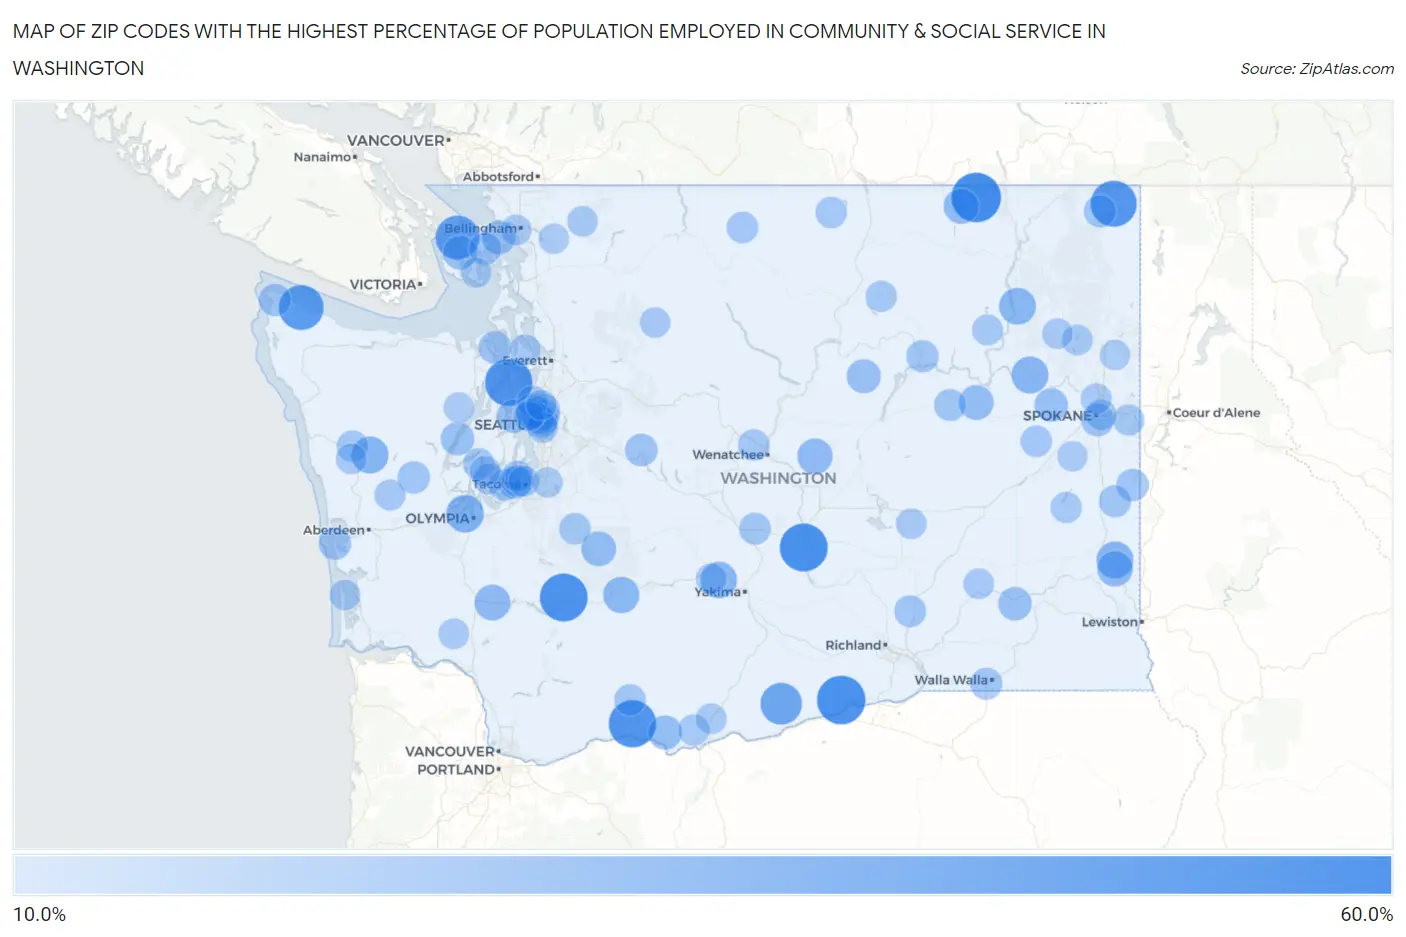
Map of Zip Codes with the Highest Percentage of Population Employed in Community & Social Service in Washington
10.0%
60.0%
Zip Codes with the Highest Percentage of Population Employed in Community & Social Service in Washington
| Zip Code | % Employed | vs State | vs National | |
| 1. | 99121 | 54.5% | 10.7%(+43.8)#1 | 11.2%(+43.3)#116 |
| 2. | 99345 | 52.4% | 10.7%(+41.7)#2 | 11.2%(+41.2)#132 |
| 3. | 98950 | 51.1% | 10.7%(+40.3)#3 | 11.2%(+39.8)#148 |
| 4. | 98336 | 50.9% | 10.7%(+40.2)#4 | 11.2%(+39.7)#149 |
| 5. | 98364 | 50.0% | 10.7%(+39.3)#5 | 11.2%(+38.8)#164 |
| 6. | 98623 | 50.0% | 10.7%(+39.3)#6 | 11.2%(+38.8)#168 |
| 7. | 99153 | 47.2% | 10.7%(+36.5)#7 | 11.2%(+36.0)#188 |
| 8. | 98381 | 44.7% | 10.7%(+34.0)#8 | 11.2%(+33.5)#229 |
| 9. | 98297 | 42.9% | 10.7%(+32.1)#9 | 11.2%(+31.6)#249 |
| 10. | 99322 | 37.9% | 10.7%(+27.2)#10 | 11.2%(+26.7)#332 |
| 11. | 98505 | 29.5% | 10.7%(+18.8)#11 | 11.2%(+18.3)#613 |
| 12. | 98575 | 28.3% | 10.7%(+17.5)#12 | 11.2%(+17.0)#676 |
| 13. | 99040 | 28.1% | 10.7%(+17.4)#13 | 11.2%(+16.9)#682 |
| 14. | 99102 | 28.1% | 10.7%(+17.4)#14 | 11.2%(+16.9)#683 |
| 15. | 99131 | 27.8% | 10.7%(+17.1)#15 | 11.2%(+16.6)#709 |
| 16. | 98923 | 27.2% | 10.7%(+16.5)#16 | 11.2%(+16.0)#748 |
| 17. | 98361 | 26.4% | 10.7%(+15.7)#17 | 11.2%(+15.2)#825 |
| 18. | 98542 | 25.6% | 10.7%(+14.9)#18 | 11.2%(+14.4)#909 |
| 19. | 99163 | 25.2% | 10.7%(+14.5)#19 | 11.2%(+14.0)#941 |
| 20. | 98845 | 24.7% | 10.7%(+14.0)#20 | 11.2%(+13.5)#1,017 |
| 21. | 99118 | 24.6% | 10.7%(+13.9)#21 | 11.2%(+13.4)#1,031 |
| 22. | 99117 | 23.8% | 10.7%(+13.1)#22 | 11.2%(+12.6)#1,133 |
| 23. | 98304 | 23.7% | 10.7%(+13.0)#23 | 11.2%(+12.5)#1,148 |
| 24. | 98635 | 22.3% | 10.7%(+11.6)#24 | 11.2%(+11.1)#1,404 |
| 25. | 98830 | 22.2% | 10.7%(+11.5)#25 | 11.2%(+11.0)#1,440 |
| 26. | 98243 | 22.2% | 10.7%(+11.4)#26 | 11.2%(+10.9)#1,444 |
| 27. | 98110 | 21.3% | 10.7%(+10.6)#27 | 11.2%(+10.1)#1,635 |
| 28. | 98262 | 21.3% | 10.7%(+10.5)#28 | 11.2%(+10.0)#1,645 |
| 29. | 99359 | 21.1% | 10.7%(+10.3)#29 | 11.2%(+9.84)#1,705 |
| 30. | 98555 | 20.9% | 10.7%(+10.2)#30 | 11.2%(+9.72)#1,728 |
| 31. | 99029 | 20.8% | 10.7%(+10.1)#31 | 11.2%(+9.60)#1,771 |
| 32. | 98358 | 19.9% | 10.7%(+9.17)#32 | 11.2%(+8.67)#2,055 |
| 33. | 98465 | 19.8% | 10.7%(+9.06)#33 | 11.2%(+8.56)#2,097 |
| 34. | 99203 | 19.7% | 10.7%(+9.01)#34 | 11.2%(+8.51)#2,115 |
| 35. | 98068 | 19.2% | 10.7%(+8.44)#35 | 11.2%(+7.94)#2,328 |
| 36. | 98115 | 19.1% | 10.7%(+8.33)#36 | 11.2%(+7.84)#2,377 |
| 37. | 98357 | 19.0% | 10.7%(+8.25)#37 | 11.2%(+7.75)#2,406 |
| 38. | 98560 | 18.9% | 10.7%(+8.20)#38 | 11.2%(+7.70)#2,427 |
| 39. | 98595 | 18.7% | 10.7%(+8.02)#39 | 11.2%(+7.52)#2,498 |
| 40. | 99152 | 18.6% | 10.7%(+7.93)#40 | 11.2%(+7.43)#2,536 |
| 41. | 99033 | 18.6% | 10.7%(+7.88)#41 | 11.2%(+7.38)#2,556 |
| 42. | 98279 | 18.6% | 10.7%(+7.87)#42 | 11.2%(+7.37)#2,560 |
| 43. | 99124 | 18.5% | 10.7%(+7.76)#43 | 11.2%(+7.26)#2,603 |
| 44. | 99158 | 18.3% | 10.7%(+7.57)#44 | 11.2%(+7.07)#2,676 |
| 45. | 99324 | 18.1% | 10.7%(+7.35)#45 | 11.2%(+6.86)#2,781 |
| 46. | 98117 | 18.0% | 10.7%(+7.27)#46 | 11.2%(+6.78)#2,818 |
| 47. | 98103 | 18.0% | 10.7%(+7.25)#47 | 11.2%(+6.76)#2,827 |
| 48. | 99330 | 18.0% | 10.7%(+7.24)#48 | 11.2%(+6.75)#2,833 |
| 49. | 99185 | 17.9% | 10.7%(+7.19)#49 | 11.2%(+6.69)#2,869 |
| 50. | 98934 | 17.8% | 10.7%(+7.06)#50 | 11.2%(+6.56)#2,934 |
| 51. | 98105 | 17.6% | 10.7%(+6.87)#51 | 11.2%(+6.37)#3,023 |
| 52. | 98526 | 17.3% | 10.7%(+6.62)#52 | 11.2%(+6.12)#3,166 |
| 53. | 98122 | 17.3% | 10.7%(+6.57)#53 | 11.2%(+6.07)#3,196 |
| 54. | 98650 | 17.3% | 10.7%(+6.56)#54 | 11.2%(+6.06)#3,198 |
| 55. | 98112 | 17.3% | 10.7%(+6.55)#55 | 11.2%(+6.05)#3,206 |
| 56. | 98833 | 17.2% | 10.7%(+6.52)#56 | 11.2%(+6.03)#3,219 |
| 57. | 98333 | 17.2% | 10.7%(+6.44)#57 | 11.2%(+5.94)#3,274 |
| 58. | 98836 | 17.1% | 10.7%(+6.41)#58 | 11.2%(+5.91)#3,301 |
| 59. | 99008 | 17.1% | 10.7%(+6.39)#59 | 11.2%(+5.89)#3,313 |
| 60. | 98406 | 16.9% | 10.7%(+6.17)#60 | 11.2%(+5.67)#3,458 |
| 61. | 98323 | 16.8% | 10.7%(+6.10)#61 | 11.2%(+5.60)#3,503 |
| 62. | 98827 | 16.8% | 10.7%(+6.10)#62 | 11.2%(+5.60)#3,506 |
| 63. | 98524 | 16.6% | 10.7%(+5.85)#63 | 11.2%(+5.35)#3,658 |
| 64. | 98613 | 16.5% | 10.7%(+5.80)#64 | 11.2%(+5.31)#3,681 |
| 65. | 98841 | 16.5% | 10.7%(+5.76)#65 | 11.2%(+5.26)#3,713 |
| 66. | 98407 | 16.5% | 10.7%(+5.74)#66 | 11.2%(+5.24)#3,730 |
| 67. | 98102 | 16.4% | 10.7%(+5.67)#67 | 11.2%(+5.17)#3,774 |
| 68. | 99016 | 16.4% | 10.7%(+5.67)#68 | 11.2%(+5.17)#3,778 |
| 69. | 98177 | 16.4% | 10.7%(+5.65)#69 | 11.2%(+5.16)#3,788 |
| 70. | 99171 | 16.4% | 10.7%(+5.65)#70 | 11.2%(+5.15)#3,792 |
| 71. | 98563 | 16.1% | 10.7%(+5.39)#71 | 11.2%(+4.89)#3,996 |
| 72. | 98403 | 16.1% | 10.7%(+5.34)#72 | 11.2%(+4.84)#4,030 |
| 73. | 98349 | 16.0% | 10.7%(+5.24)#73 | 11.2%(+4.74)#4,101 |
| 74. | 99202 | 15.9% | 10.7%(+5.22)#74 | 11.2%(+4.72)#4,114 |
| 75. | 99138 | 15.9% | 10.7%(+5.21)#75 | 11.2%(+4.71)#4,121 |
| 76. | 98144 | 15.8% | 10.7%(+5.12)#76 | 11.2%(+4.62)#4,201 |
| 77. | 99251 | 15.8% | 10.7%(+5.07)#77 | 11.2%(+4.58)#4,246 |
| 78. | 98260 | 15.8% | 10.7%(+5.07)#78 | 11.2%(+4.57)#4,263 |
| 79. | 98620 | 15.6% | 10.7%(+4.84)#79 | 11.2%(+4.35)#4,440 |
| 80. | 98947 | 15.6% | 10.7%(+4.84)#80 | 11.2%(+4.34)#4,442 |
| 81. | 98566 | 15.5% | 10.7%(+4.82)#81 | 11.2%(+4.32)#4,469 |
| 82. | 99148 | 15.5% | 10.7%(+4.80)#82 | 11.2%(+4.30)#4,485 |
| 83. | 98394 | 15.5% | 10.7%(+4.75)#83 | 11.2%(+4.25)#4,538 |
| 84. | 98225 | 15.5% | 10.7%(+4.74)#84 | 11.2%(+4.24)#4,557 |
| 85. | 98241 | 15.4% | 10.7%(+4.69)#85 | 11.2%(+4.20)#4,590 |
| 86. | 99335 | 15.4% | 10.7%(+4.67)#86 | 11.2%(+4.17)#4,619 |
| 87. | 98244 | 15.4% | 10.7%(+4.64)#87 | 11.2%(+4.15)#4,652 |
| 88. | 99181 | 15.3% | 10.7%(+4.61)#88 | 11.2%(+4.11)#4,680 |
| 89. | 98857 | 15.3% | 10.7%(+4.56)#89 | 11.2%(+4.06)#4,728 |
| 90. | 98581 | 15.3% | 10.7%(+4.54)#90 | 11.2%(+4.04)#4,747 |
| 91. | 98261 | 15.2% | 10.7%(+4.51)#91 | 11.2%(+4.01)#4,771 |
| 92. | 98107 | 15.2% | 10.7%(+4.48)#92 | 11.2%(+3.98)#4,793 |
| 93. | 98640 | 15.1% | 10.7%(+4.43)#93 | 11.2%(+3.93)#4,837 |
| 94. | 98047 | 15.0% | 10.7%(+4.31)#94 | 11.2%(+3.81)#4,941 |
| 95. | 98199 | 15.0% | 10.7%(+4.30)#95 | 11.2%(+3.81)#4,943 |
| 96. | 98320 | 14.9% | 10.7%(+4.23)#96 | 11.2%(+3.73)#5,017 |
| 97. | 98220 | 14.9% | 10.7%(+4.18)#97 | 11.2%(+3.69)#5,055 |
| 98. | 99009 | 14.8% | 10.7%(+4.11)#98 | 11.2%(+3.61)#5,137 |
| 99. | 99004 | 14.8% | 10.7%(+4.08)#99 | 11.2%(+3.58)#5,161 |
| 100. | 98125 | 14.7% | 10.7%(+3.99)#100 | 11.2%(+3.49)#5,260 |
Common Questions
What are the Top 10 Zip Codes with the Highest Percentage of Population Employed in Community & Social Service in Washington?
Top 10 Zip Codes with the Highest Percentage of Population Employed in Community & Social Service in Washington are:
What zip code has the Highest Percentage of Population Employed in Community & Social Service in Washington?
99121 has the Highest Percentage of Population Employed in Community & Social Service in Washington with 54.5%.
What is the Percentage of Population Employed in Community & Social Service in the State of Washington?
Percentage of Population Employed in Community & Social Service in Washington is 10.7%.
What is the Percentage of Population Employed in Community & Social Service in the United States?
Percentage of Population Employed in Community & Social Service in the United States is 11.2%.