Zip Codes with the Highest Percentage of Population with a Degree in Business in Washington
RELATED REPORTS & OPTIONS
Business
Washington
Compare Zip Codes
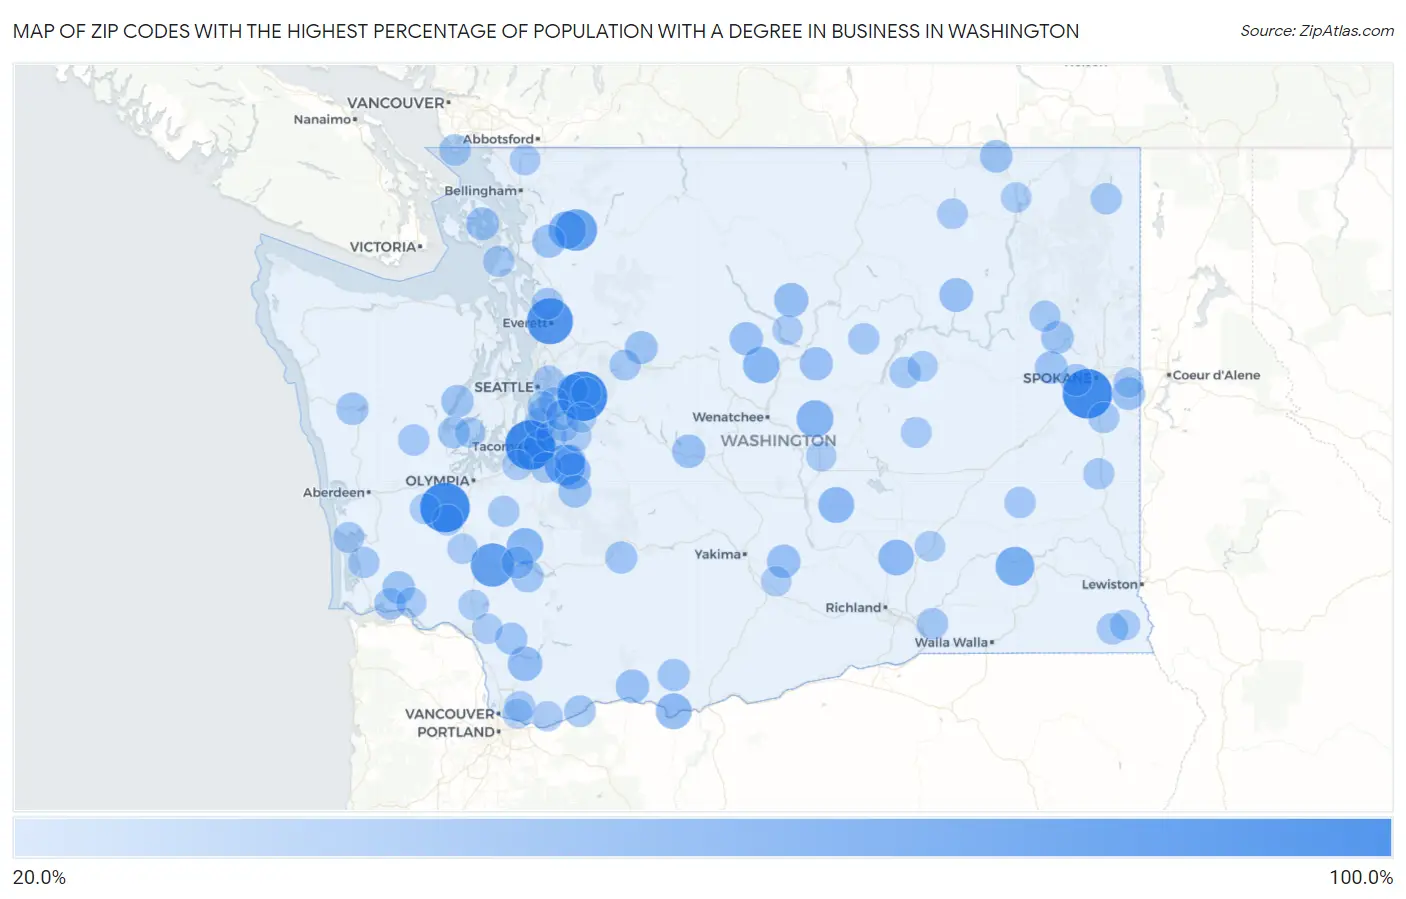
Map of Zip Codes with the Highest Percentage of Population with a Degree in Business in Washington
20.0%
100.0%
Zip Codes with the Highest Percentage of Population with a Degree in Business in Washington
| Zip Code | % Graduates | vs State | vs National | |
| 1. | 98421 | 100.0% | 15.6%(+84.4)#1 | 19.5%(+80.5)#14 |
| 2. | 98556 | 100.0% | 15.6%(+84.4)#2 | 19.5%(+80.5)#32 |
| 3. | 98050 | 100.0% | 15.6%(+84.4)#3 | 19.5%(+80.5)#131 |
| 4. | 99020 | 100.0% | 15.6%(+84.4)#4 | 19.5%(+80.5)#182 |
| 5. | 98207 | 85.3% | 15.6%(+69.7)#5 | 19.5%(+65.8)#208 |
| 6. | 98542 | 73.8% | 15.6%(+58.2)#6 | 19.5%(+54.3)#271 |
| 7. | 98255 | 67.2% | 15.6%(+51.6)#7 | 19.5%(+47.7)#321 |
| 8. | 98385 | 62.0% | 15.6%(+46.4)#8 | 19.5%(+42.5)#398 |
| 9. | 99359 | 55.6% | 15.6%(+40.0)#9 | 19.5%(+36.1)#509 |
| 10. | 98263 | 50.0% | 15.6%(+34.4)#10 | 19.5%(+30.5)#683 |
| 11. | 98845 | 47.6% | 15.6%(+32.1)#11 | 19.5%(+28.1)#769 |
| 12. | 98811 | 45.9% | 15.6%(+30.4)#12 | 19.5%(+26.4)#848 |
| 13. | 98533 | 45.6% | 15.6%(+30.1)#13 | 19.5%(+26.1)#861 |
| 14. | 98396 | 45.1% | 15.6%(+29.5)#14 | 19.5%(+25.6)#884 |
| 15. | 98617 | 43.0% | 15.6%(+27.5)#15 | 19.5%(+23.5)#993 |
| 16. | 99357 | 42.9% | 15.6%(+27.4)#16 | 19.5%(+23.4)#999 |
| 17. | 99343 | 42.3% | 15.6%(+26.8)#17 | 19.5%(+22.8)#1,048 |
| 18. | 98601 | 37.5% | 15.6%(+22.0)#18 | 19.5%(+18.0)#1,421 |
| 19. | 98834 | 36.5% | 15.6%(+20.9)#19 | 19.5%(+17.0)#1,541 |
| 20. | 99140 | 34.9% | 15.6%(+19.3)#20 | 19.5%(+15.4)#1,747 |
| 21. | 98623 | 33.3% | 15.6%(+17.8)#21 | 19.5%(+13.8)#2,040 |
| 22. | 98936 | 33.3% | 15.6%(+17.7)#22 | 19.5%(+13.8)#2,049 |
| 23. | 98858 | 33.0% | 15.6%(+17.5)#23 | 19.5%(+13.5)#2,072 |
| 24. | 98941 | 33.0% | 15.6%(+17.5)#24 | 19.5%(+13.5)#2,074 |
| 25. | 98822 | 32.9% | 15.6%(+17.4)#25 | 19.5%(+13.4)#2,086 |
| 26. | 98235 | 32.3% | 15.6%(+16.7)#26 | 19.5%(+12.8)#2,204 |
| 27. | 98222 | 31.2% | 15.6%(+15.7)#27 | 19.5%(+11.8)#2,467 |
| 28. | 98256 | 30.8% | 15.6%(+15.2)#28 | 19.5%(+11.3)#2,601 |
| 29. | 99034 | 30.6% | 15.6%(+15.0)#29 | 19.5%(+11.1)#2,644 |
| 30. | 98323 | 30.4% | 15.6%(+14.8)#30 | 19.5%(+10.9)#2,708 |
| 31. | 99023 | 30.3% | 15.6%(+14.7)#31 | 19.5%(+10.8)#2,732 |
| 32. | 98621 | 30.2% | 15.6%(+14.7)#32 | 19.5%(+10.7)#2,750 |
| 33. | 99146 | 30.0% | 15.6%(+14.4)#33 | 19.5%(+10.5)#2,846 |
| 34. | 98443 | 29.7% | 15.6%(+14.2)#34 | 19.5%(+10.2)#2,918 |
| 35. | 98555 | 29.7% | 15.6%(+14.2)#35 | 19.5%(+10.2)#2,922 |
| 36. | 99029 | 29.6% | 15.6%(+14.0)#36 | 19.5%(+10.1)#2,970 |
| 37. | 98526 | 29.4% | 15.6%(+13.8)#37 | 19.5%(+9.91)#3,052 |
| 38. | 98354 | 29.1% | 15.6%(+13.5)#38 | 19.5%(+9.60)#3,167 |
| 39. | 98564 | 28.6% | 15.6%(+13.0)#39 | 19.5%(+9.12)#3,362 |
| 40. | 98670 | 28.6% | 15.6%(+13.0)#40 | 19.5%(+9.07)#3,416 |
| 41. | 98625 | 28.2% | 15.6%(+12.6)#41 | 19.5%(+8.68)#3,581 |
| 42. | 98361 | 28.2% | 15.6%(+12.6)#42 | 19.5%(+8.67)#3,589 |
| 43. | 99001 | 28.1% | 15.6%(+12.5)#43 | 19.5%(+8.61)#3,617 |
| 44. | 98585 | 27.7% | 15.6%(+12.1)#44 | 19.5%(+8.16)#3,846 |
| 45. | 98271 | 26.7% | 15.6%(+11.2)#45 | 19.5%(+7.22)#4,369 |
| 46. | 98592 | 26.6% | 15.6%(+11.0)#46 | 19.5%(+7.06)#4,505 |
| 47. | 98639 | 26.3% | 15.6%(+10.7)#47 | 19.5%(+6.82)#4,665 |
| 48. | 98281 | 25.8% | 15.6%(+10.2)#48 | 19.5%(+6.26)#5,046 |
| 49. | 98643 | 25.6% | 15.6%(+10.0)#49 | 19.5%(+6.11)#5,168 |
| 50. | 99323 | 25.4% | 15.6%(+9.88)#50 | 19.5%(+5.95)#5,293 |
| 51. | 98039 | 25.4% | 15.6%(+9.88)#51 | 19.5%(+5.95)#5,295 |
| 52. | 99401 | 25.3% | 15.6%(+9.77)#52 | 19.5%(+5.84)#5,377 |
| 53. | 98830 | 25.2% | 15.6%(+9.58)#53 | 19.5%(+5.65)#5,520 |
| 54. | 98560 | 25.0% | 15.6%(+9.43)#54 | 19.5%(+5.50)#5,708 |
| 55. | 99105 | 25.0% | 15.6%(+9.43)#55 | 19.5%(+5.50)#5,713 |
| 56. | 98586 | 24.9% | 15.6%(+9.34)#56 | 19.5%(+5.41)#5,775 |
| 57. | 99139 | 24.8% | 15.6%(+9.22)#57 | 19.5%(+5.29)#5,866 |
| 58. | 98278 | 24.7% | 15.6%(+9.14)#58 | 19.5%(+5.21)#5,941 |
| 59. | 99135 | 24.6% | 15.6%(+9.02)#59 | 19.5%(+5.09)#6,042 |
| 60. | 98576 | 24.5% | 15.6%(+8.97)#60 | 19.5%(+5.04)#6,084 |
| 61. | 98075 | 24.3% | 15.6%(+8.75)#61 | 19.5%(+4.82)#6,289 |
| 62. | 99031 | 24.2% | 15.6%(+8.64)#62 | 19.5%(+4.71)#6,402 |
| 63. | 99173 | 24.0% | 15.6%(+8.40)#63 | 19.5%(+4.47)#6,633 |
| 64. | 98198 | 23.9% | 15.6%(+8.34)#64 | 19.5%(+4.41)#6,701 |
| 65. | 98590 | 23.7% | 15.6%(+8.12)#65 | 19.5%(+4.19)#6,933 |
| 66. | 98579 | 23.5% | 15.6%(+7.96)#66 | 19.5%(+4.03)#7,083 |
| 67. | 99176 | 23.5% | 15.6%(+7.96)#67 | 19.5%(+4.03)#7,100 |
| 68. | 98374 | 23.5% | 15.6%(+7.96)#68 | 19.5%(+4.03)#7,104 |
| 69. | 98224 | 23.3% | 15.6%(+7.76)#69 | 19.5%(+3.83)#7,300 |
| 70. | 98321 | 22.8% | 15.6%(+7.24)#70 | 19.5%(+3.31)#7,847 |
| 71. | 98832 | 22.7% | 15.6%(+7.16)#71 | 19.5%(+3.23)#7,950 |
| 72. | 98002 | 22.4% | 15.6%(+6.86)#72 | 19.5%(+2.93)#8,275 |
| 73. | 98188 | 22.4% | 15.6%(+6.80)#73 | 19.5%(+2.87)#8,350 |
| 74. | 98682 | 22.2% | 15.6%(+6.60)#74 | 19.5%(+2.67)#8,591 |
| 75. | 99166 | 21.9% | 15.6%(+6.29)#75 | 19.5%(+2.36)#9,004 |
| 76. | 98611 | 21.8% | 15.6%(+6.26)#76 | 19.5%(+2.33)#9,044 |
| 77. | 99103 | 21.8% | 15.6%(+6.25)#77 | 19.5%(+2.32)#9,053 |
| 78. | 98056 | 21.8% | 15.6%(+6.24)#78 | 19.5%(+2.31)#9,062 |
| 79. | 98264 | 21.7% | 15.6%(+6.12)#79 | 19.5%(+2.19)#9,222 |
| 80. | 98010 | 21.5% | 15.6%(+5.93)#80 | 19.5%(+2.00)#9,467 |
| 81. | 98568 | 21.3% | 15.6%(+5.70)#81 | 19.5%(+1.77)#9,787 |
| 82. | 98532 | 21.2% | 15.6%(+5.67)#82 | 19.5%(+1.74)#9,817 |
| 83. | 98626 | 21.2% | 15.6%(+5.60)#83 | 19.5%(+1.67)#9,930 |
| 84. | 99326 | 21.1% | 15.6%(+5.58)#84 | 19.5%(+1.65)#9,966 |
| 85. | 98953 | 21.1% | 15.6%(+5.53)#85 | 19.5%(+1.60)#10,020 |
| 86. | 98439 | 21.1% | 15.6%(+5.50)#86 | 19.5%(+1.57)#10,055 |
| 87. | 99402 | 21.0% | 15.6%(+5.43)#87 | 19.5%(+1.50)#10,162 |
| 88. | 98848 | 21.0% | 15.6%(+5.42)#88 | 19.5%(+1.49)#10,169 |
| 89. | 98024 | 21.0% | 15.6%(+5.41)#89 | 19.5%(+1.48)#10,182 |
| 90. | 98168 | 21.0% | 15.6%(+5.40)#90 | 19.5%(+1.47)#10,194 |
| 91. | 98831 | 20.9% | 15.6%(+5.36)#91 | 19.5%(+1.43)#10,247 |
| 92. | 98042 | 20.9% | 15.6%(+5.30)#92 | 19.5%(+1.37)#10,326 |
| 93. | 98671 | 20.8% | 15.6%(+5.27)#93 | 19.5%(+1.34)#10,380 |
| 94. | 98058 | 20.8% | 15.6%(+5.27)#94 | 19.5%(+1.34)#10,384 |
| 95. | 98647 | 20.8% | 15.6%(+5.26)#95 | 19.5%(+1.33)#10,407 |
| 96. | 98684 | 20.8% | 15.6%(+5.26)#96 | 19.5%(+1.33)#10,418 |
| 97. | 99141 | 20.8% | 15.6%(+5.25)#97 | 19.5%(+1.32)#10,423 |
| 98. | 98038 | 20.8% | 15.6%(+5.23)#98 | 19.5%(+1.30)#10,452 |
| 99. | 98546 | 20.8% | 15.6%(+5.21)#99 | 19.5%(+1.28)#10,473 |
| 100. | 99016 | 20.8% | 15.6%(+5.20)#100 | 19.5%(+1.27)#10,483 |
Common Questions
What are the Top 10 Zip Codes with the Highest Percentage of Population with a Degree in Business in Washington?
Top 10 Zip Codes with the Highest Percentage of Population with a Degree in Business in Washington are:
What zip code has the Highest Percentage of Population with a Degree in Business in Washington?
98421 has the Highest Percentage of Population with a Degree in Business in Washington with 100.0%.
What is the Percentage of Population with a Degree in Business in the State of Washington?
Percentage of Population with a Degree in Business in Washington is 15.6%.
What is the Percentage of Population with a Degree in Business in the United States?
Percentage of Population with a Degree in Business in the United States is 19.5%.