Yoakum County, TX Map & Demographics
Yoakum County Map
Yoakum County Overview
$34,168
PER CAPITA INCOME
$86,369
AVG FAMILY INCOME
$80,317
AVG HOUSEHOLD INCOME
59.2%
WAGE / INCOME GAP [ % ]
40.8¢/ $1
WAGE / INCOME GAP [ $ ]
$9,728
FAMILY INCOME DEFICIT
0.42
INEQUALITY / GINI INDEX
7,630
TOTAL POPULATION
3,576
MALE POPULATION
4,054
FEMALE POPULATION
88.21
MALES / 100 FEMALES
113.37
FEMALES / 100 MALES
30.0
MEDIAN AGE
3.3
AVG FAMILY SIZE
2.9
AVG HOUSEHOLD SIZE
3,423
LABOR FORCE [ PEOPLE ]
64.1%
PERCENT IN LABOR FORCE
3.9%
UNEMPLOYMENT RATE
Income in Yoakum County
Income Overview in Yoakum County
Per Capita Income in Yoakum County is $34,168, while median incomes of families and households are $86,369 and $80,317 respectively.
| Characteristic | Number | Measure |
| Per Capita Income | 7,630 | $34,168 |
| Median Family Income | 2,070 | $86,369 |
| Mean Family Income | 2,070 | $108,910 |
| Median Household Income | 2,654 | $80,317 |
| Mean Household Income | 2,654 | $98,866 |
| Income Deficit | 2,070 | $9,728 |
| Wage / Income Gap (%) | 7,630 | 59.20% |
| Wage / Income Gap ($) | 7,630 | 40.80¢ per $1 |
| Gini / Inequality Index | 7,630 | 0.42 |
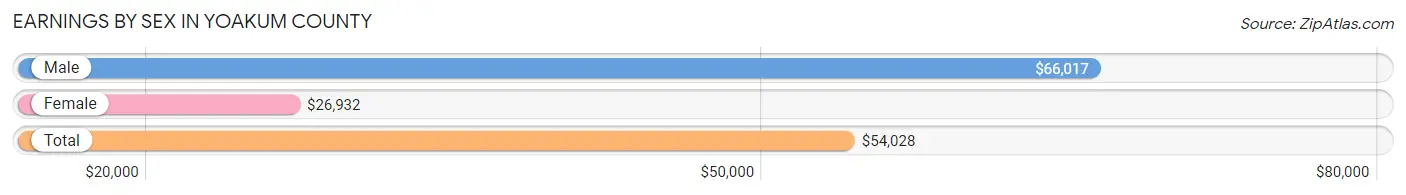
Earnings by Sex in Yoakum County
Average Earnings in Yoakum County are $54,028, $66,017 for men and $26,932 for women, a difference of 59.2%.
| Sex | Number | Average Earnings |
| Male | 2,262 (62.9%) | $66,017 |
| Female | 1,333 (37.1%) | $26,932 |
| Total | 3,595 (100.0%) | $54,028 |
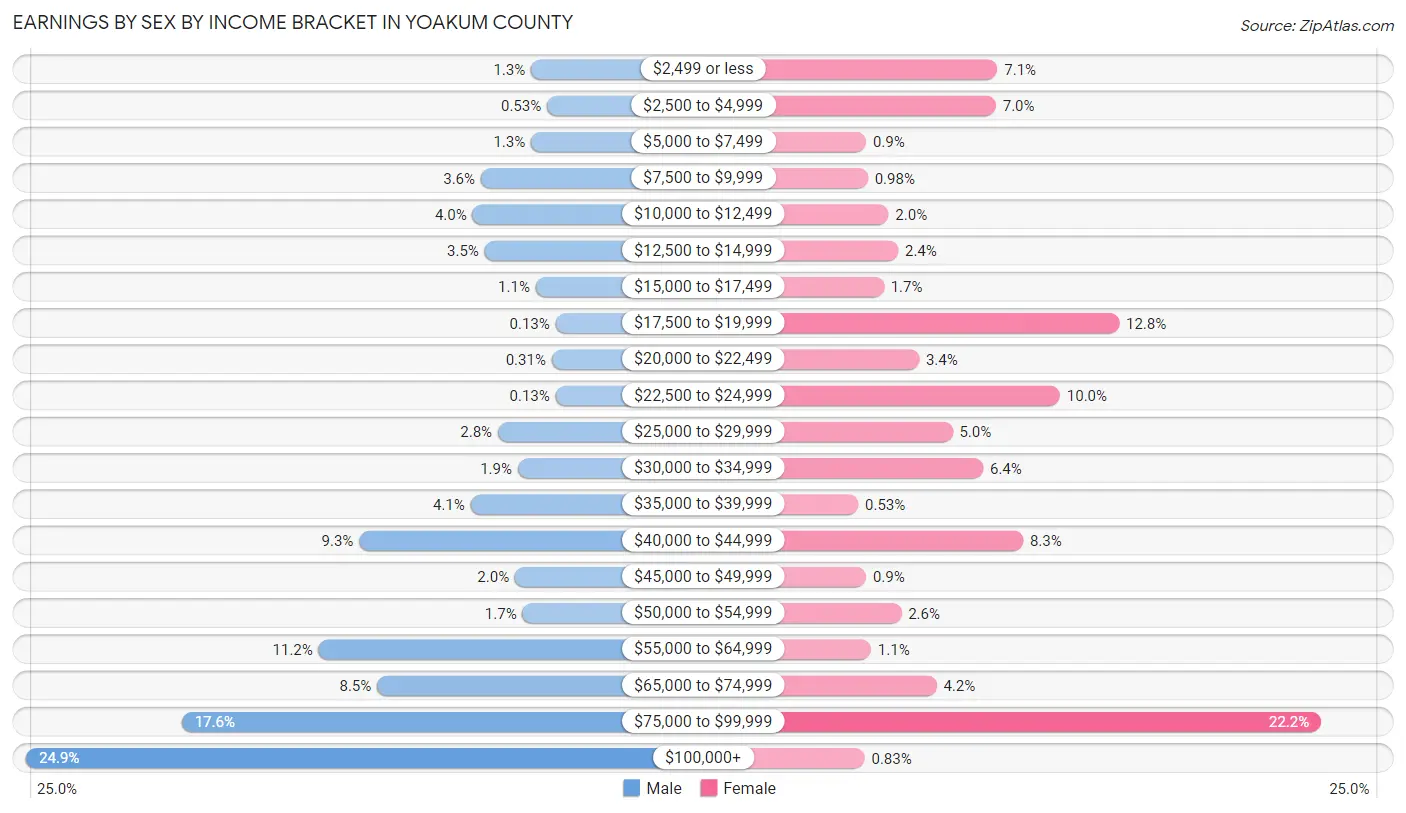
Earnings by Sex by Income Bracket in Yoakum County
The most common earnings brackets in Yoakum County are $100,000+ for men (564 | 24.9%) and $75,000 to $99,999 for women (296 | 22.2%).
| Income | Male | Female |
| $2,499 or less | 29 (1.3%) | 94 (7.0%) |
| $2,500 to $4,999 | 12 (0.5%) | 93 (7.0%) |
| $5,000 to $7,499 | 29 (1.3%) | 12 (0.9%) |
| $7,500 to $9,999 | 82 (3.6%) | 13 (1.0%) |
| $10,000 to $12,499 | 91 (4.0%) | 26 (1.9%) |
| $12,500 to $14,999 | 78 (3.5%) | 32 (2.4%) |
| $15,000 to $17,499 | 24 (1.1%) | 23 (1.7%) |
| $17,500 to $19,999 | 3 (0.1%) | 170 (12.8%) |
| $20,000 to $22,499 | 7 (0.3%) | 45 (3.4%) |
| $22,500 to $24,999 | 3 (0.1%) | 133 (10.0%) |
| $25,000 to $29,999 | 64 (2.8%) | 66 (5.0%) |
| $30,000 to $34,999 | 43 (1.9%) | 85 (6.4%) |
| $35,000 to $39,999 | 93 (4.1%) | 7 (0.5%) |
| $40,000 to $44,999 | 211 (9.3%) | 110 (8.3%) |
| $45,000 to $49,999 | 46 (2.0%) | 12 (0.9%) |
| $50,000 to $54,999 | 38 (1.7%) | 34 (2.5%) |
| $55,000 to $64,999 | 254 (11.2%) | 15 (1.1%) |
| $65,000 to $74,999 | 192 (8.5%) | 56 (4.2%) |
| $75,000 to $99,999 | 399 (17.6%) | 296 (22.2%) |
| $100,000+ | 564 (24.9%) | 11 (0.8%) |
| Total | 2,262 (100.0%) | 1,333 (100.0%) |
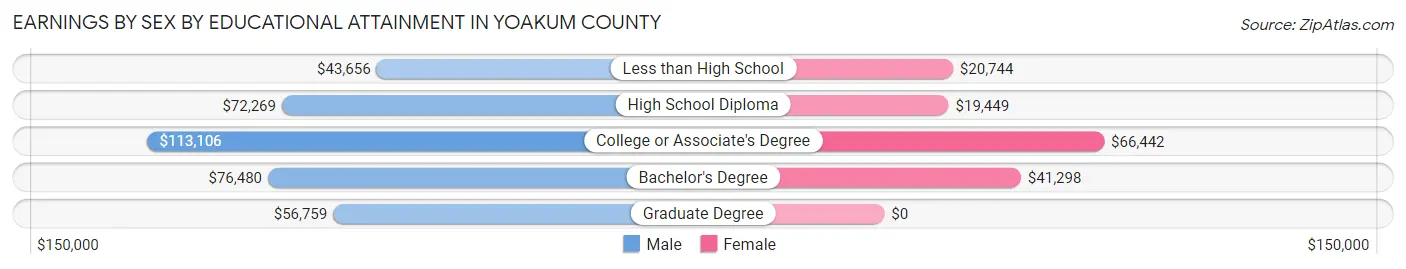
Earnings by Sex by Educational Attainment in Yoakum County
Average earnings in Yoakum County are $72,022 for men and $28,200 for women, a difference of 60.9%. Men with an educational attainment of college or associate's degree enjoy the highest average annual earnings of $113,106, while those with less than high school education earn the least with $43,656. Women with an educational attainment of college or associate's degree earn the most with the average annual earnings of $66,442, while those with high school diploma education have the smallest earnings of $19,449.
| Educational Attainment | Male Income | Female Income |
| Less than High School | $43,656 | $20,744 |
| High School Diploma | $72,269 | $19,449 |
| College or Associate's Degree | $113,106 | $66,442 |
| Bachelor's Degree | $76,480 | $41,298 |
| Graduate Degree | $56,759 | $0 |
| Total | $72,022 | $28,200 |
Family Income in Yoakum County
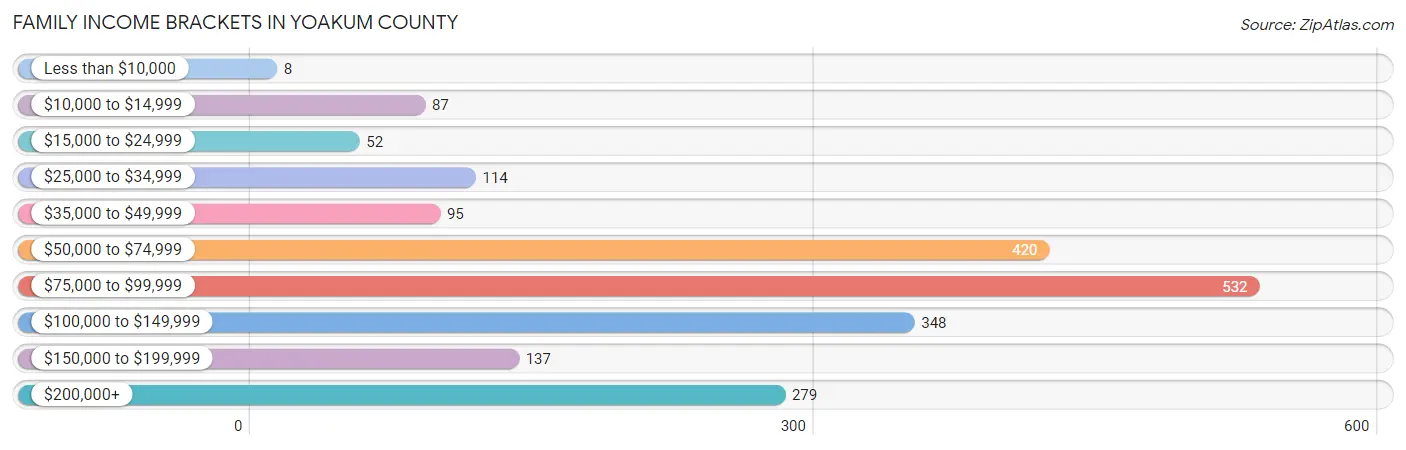
Family Income Brackets in Yoakum County
According to the Yoakum County family income data, there are 532 families falling into the $75,000 to $99,999 income range, which is the most common income bracket and makes up 25.7% of all families. Conversely, the less than $10,000 income bracket is the least frequent group with only 8 families (0.4%) belonging to this category.
| Income Bracket | # Families | % Families |
| Less than $10,000 | 8 | 0.4% |
| $10,000 to $14,999 | 87 | 4.2% |
| $15,000 to $24,999 | 52 | 2.5% |
| $25,000 to $34,999 | 114 | 5.5% |
| $35,000 to $49,999 | 95 | 4.6% |
| $50,000 to $74,999 | 420 | 20.3% |
| $75,000 to $99,999 | 532 | 25.7% |
| $100,000 to $149,999 | 348 | 16.8% |
| $150,000 to $199,999 | 137 | 6.6% |
| $200,000+ | 279 | 13.5% |
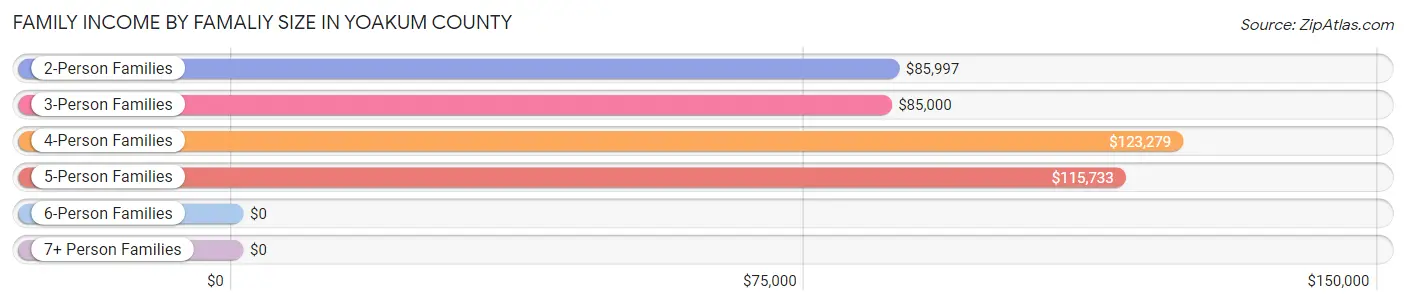
Family Income by Famaliy Size in Yoakum County
4-person families (537 | 25.9%) account for the highest median family income in Yoakum County with $123,279 per family, while 2-person families (579 | 28.0%) have the highest median income of $42,998 per family member.
| Income Bracket | # Families | Median Income |
| 2-Person Families | 579 (28.0%) | $85,997 |
| 3-Person Families | 340 (16.4%) | $85,000 |
| 4-Person Families | 537 (25.9%) | $123,279 |
| 5-Person Families | 447 (21.6%) | $115,733 |
| 6-Person Families | 142 (6.9%) | $0 |
| 7+ Person Families | 25 (1.2%) | $0 |
| Total | 2,070 (100.0%) | $86,369 |
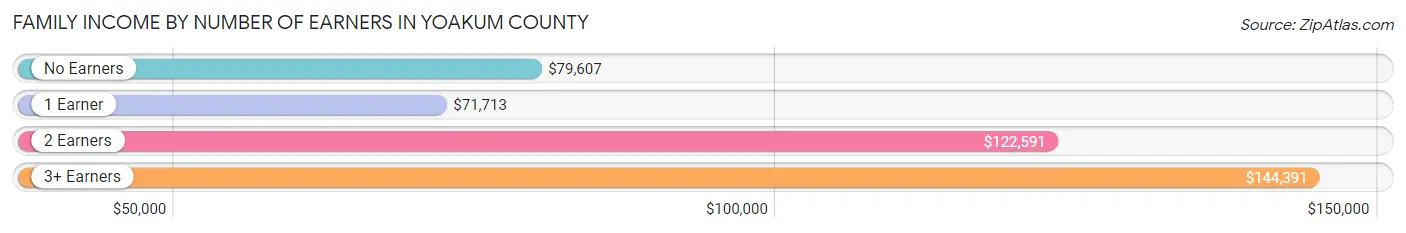
Family Income by Number of Earners in Yoakum County
The median family income in Yoakum County is $86,369, with families comprising 3+ earners (217) having the highest median family income of $144,391, while families with 1 earner (933) have the lowest median family income of $71,713, accounting for 10.5% and 45.1% of families, respectively.
| Number of Earners | # Families | Median Income |
| No Earners | 125 (6.0%) | $79,607 |
| 1 Earner | 933 (45.1%) | $71,713 |
| 2 Earners | 795 (38.4%) | $122,591 |
| 3+ Earners | 217 (10.5%) | $144,391 |
| Total | 2,070 (100.0%) | $86,369 |
Household Income in Yoakum County
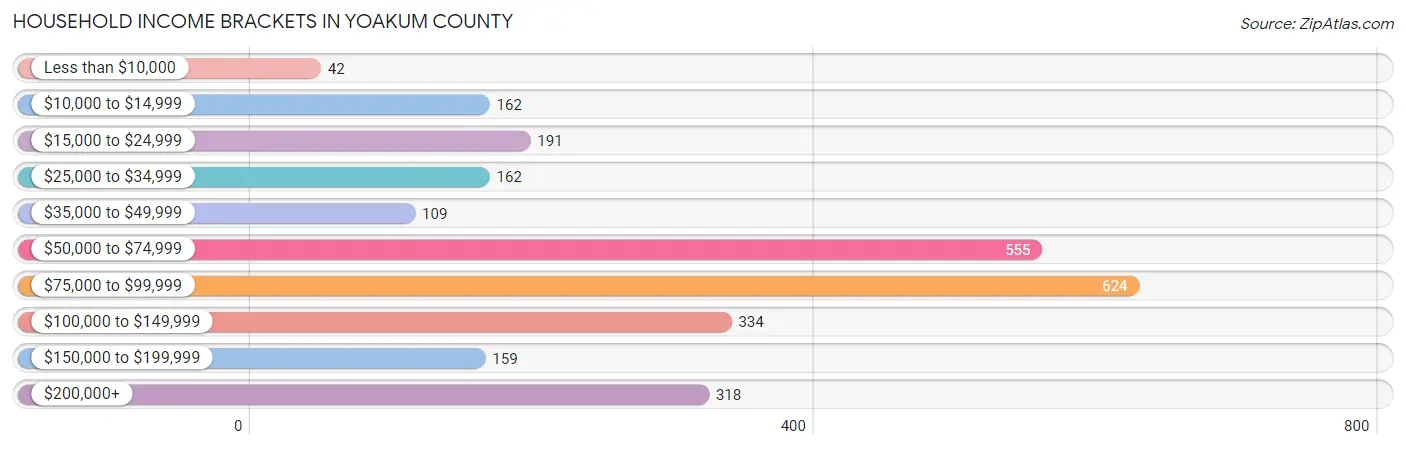
Household Income Brackets in Yoakum County
With 624 households falling in the category, the $75,000 to $99,999 income range is the most frequent in Yoakum County, accounting for 23.5% of all households. In contrast, only 42 households (1.6%) fall into the less than $10,000 income bracket, making it the least populous group.
| Income Bracket | # Households | % Households |
| Less than $10,000 | 42 | 1.6% |
| $10,000 to $14,999 | 162 | 6.1% |
| $15,000 to $24,999 | 191 | 7.2% |
| $25,000 to $34,999 | 162 | 6.1% |
| $35,000 to $49,999 | 109 | 4.1% |
| $50,000 to $74,999 | 555 | 20.9% |
| $75,000 to $99,999 | 624 | 23.5% |
| $100,000 to $149,999 | 334 | 12.6% |
| $150,000 to $199,999 | 159 | 6.0% |
| $200,000+ | 318 | 12.0% |
Household Income by Householder Age in Yoakum County
The median household income in Yoakum County is $80,317, with the highest median household income of $87,158 found in the 45 to 64 years age bracket for the primary householder. A total of 1,022 households (38.5%) fall into this category. Meanwhile, the 15 to 24 years age bracket for the primary householder has the lowest median household income of $0, with 82 households (3.1%) in this group.
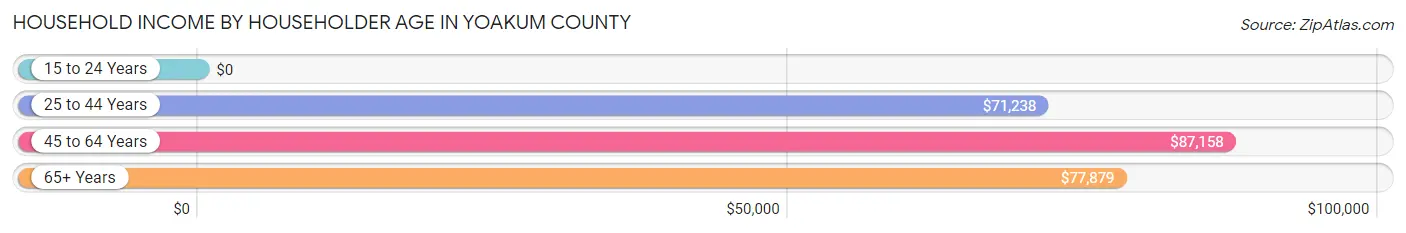
| Income Bracket | # Households | Median Income |
| 15 to 24 Years | 82 (3.1%) | $0 |
| 25 to 44 Years | 1,103 (41.6%) | $71,238 |
| 45 to 64 Years | 1,022 (38.5%) | $87,158 |
| 65+ Years | 447 (16.8%) | $77,879 |
| Total | 2,654 (100.0%) | $80,317 |
Poverty in Yoakum County
Income Below Poverty by Sex and Age in Yoakum County
With 15.5% poverty level for males and 12.0% for females among the residents of Yoakum County, 12 to 14 year old males and 18 to 24 year old females are the most vulnerable to poverty, with 45 males (83.3%) and 68 females (42.5%) in their respective age groups living below the poverty level.
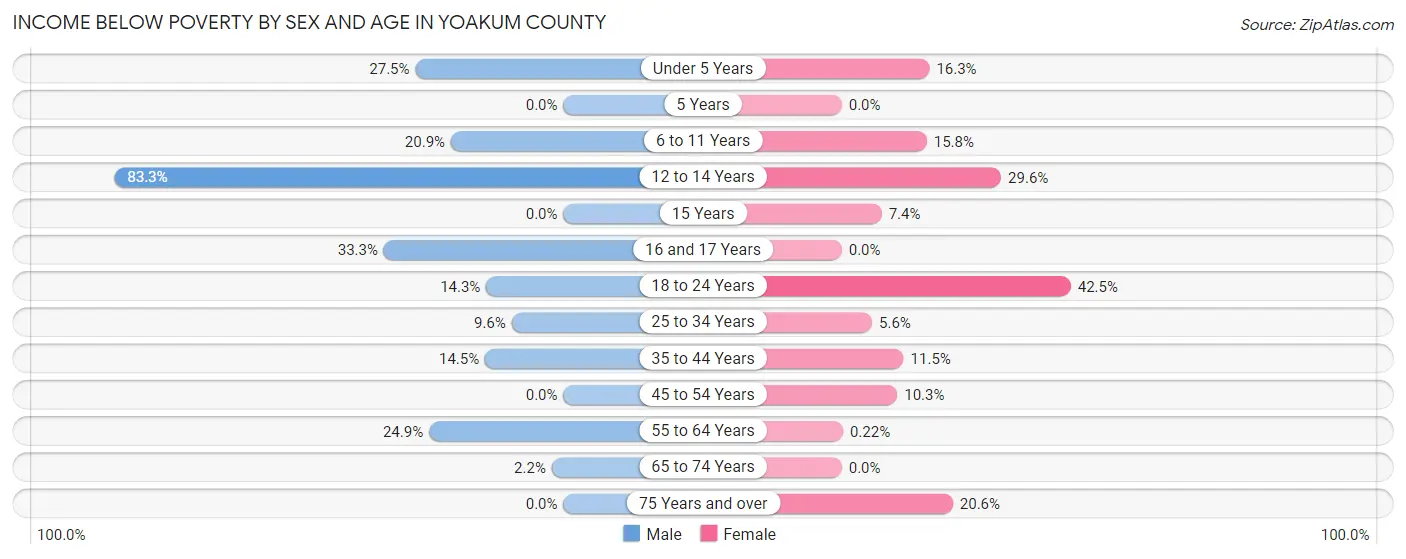
| Age Bracket | Male | Female |
| Under 5 Years | 128 (27.5%) | 34 (16.3%) |
| 5 Years | 0 (0.0%) | 0 (0.0%) |
| 6 to 11 Years | 48 (20.9%) | 101 (15.8%) |
| 12 to 14 Years | 45 (83.3%) | 92 (29.6%) |
| 15 Years | 0 (0.0%) | 12 (7.4%) |
| 16 and 17 Years | 40 (33.3%) | 0 (0.0%) |
| 18 to 24 Years | 59 (14.3%) | 68 (42.5%) |
| 25 to 34 Years | 41 (9.6%) | 34 (5.6%) |
| 35 to 44 Years | 73 (14.5%) | 62 (11.5%) |
| 45 to 54 Years | 0 (0.0%) | 45 (10.3%) |
| 55 to 64 Years | 113 (24.9%) | 1 (0.2%) |
| 65 to 74 Years | 6 (2.2%) | 0 (0.0%) |
| 75 Years and over | 0 (0.0%) | 34 (20.6%) |
| Total | 553 (15.5%) | 483 (12.0%) |
Income Above Poverty by Sex and Age in Yoakum County
According to the poverty statistics in Yoakum County, males aged 5 years and females aged 5 years are the age groups that are most secure financially, with 100.0% of males and 100.0% of females in these age groups living above the poverty line.
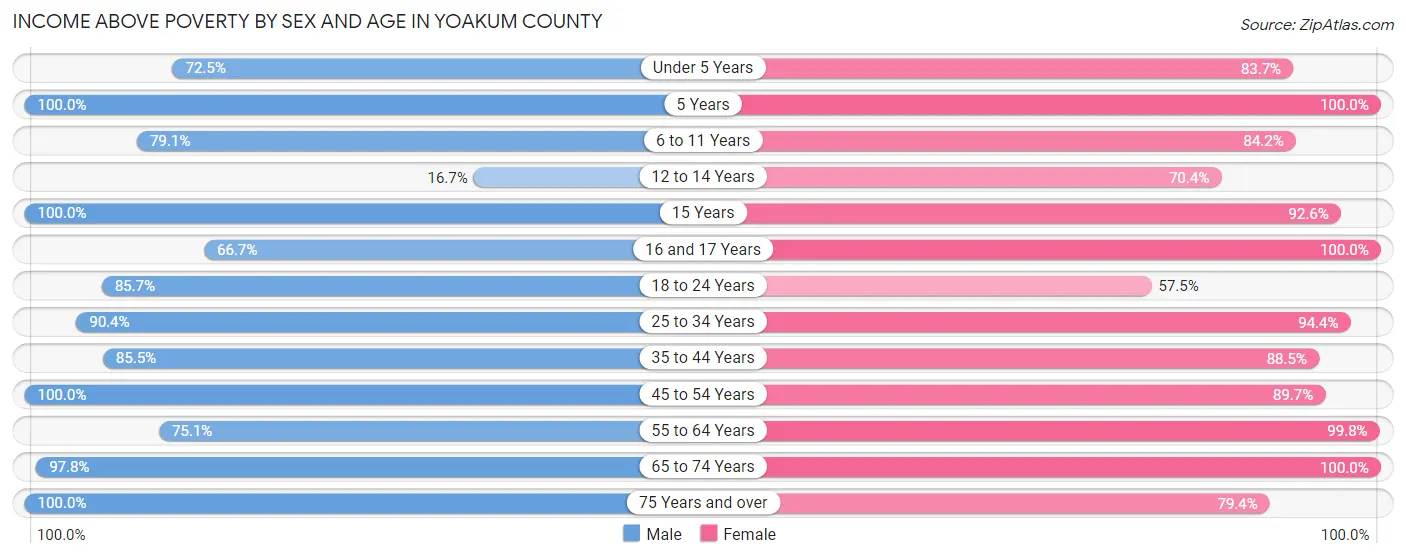
| Age Bracket | Male | Female |
| Under 5 Years | 338 (72.5%) | 175 (83.7%) |
| 5 Years | 71 (100.0%) | 95 (100.0%) |
| 6 to 11 Years | 182 (79.1%) | 539 (84.2%) |
| 12 to 14 Years | 9 (16.7%) | 219 (70.4%) |
| 15 Years | 52 (100.0%) | 150 (92.6%) |
| 16 and 17 Years | 80 (66.7%) | 52 (100.0%) |
| 18 to 24 Years | 353 (85.7%) | 92 (57.5%) |
| 25 to 34 Years | 386 (90.4%) | 571 (94.4%) |
| 35 to 44 Years | 429 (85.5%) | 478 (88.5%) |
| 45 to 54 Years | 411 (100.0%) | 392 (89.7%) |
| 55 to 64 Years | 340 (75.1%) | 455 (99.8%) |
| 65 to 74 Years | 272 (97.8%) | 198 (100.0%) |
| 75 Years and over | 100 (100.0%) | 131 (79.4%) |
| Total | 3,023 (84.5%) | 3,547 (88.0%) |
Income Below Poverty Among Married-Couple Families in Yoakum County
The poverty statistics for married-couple families in Yoakum County show that 8.3% or 130 of the total 1,575 families live below the poverty line. Families with 3 or 4 children have the highest poverty rate of 21.0%, comprising of 61 families. On the other hand, families with 5 or more children have the lowest poverty rate of 0.0%, which includes 0 families.
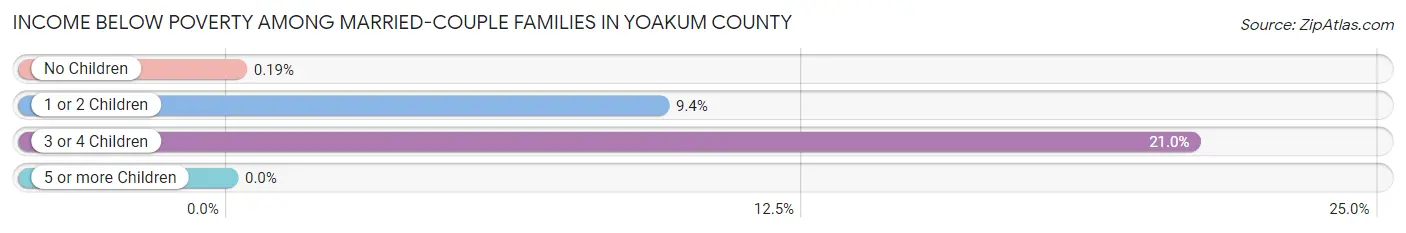
| Children | Above Poverty | Below Poverty |
| No Children | 533 (99.8%) | 1 (0.2%) |
| 1 or 2 Children | 657 (90.6%) | 68 (9.4%) |
| 3 or 4 Children | 230 (79.0%) | 61 (21.0%) |
| 5 or more Children | 25 (100.0%) | 0 (0.0%) |
| Total | 1,445 (91.7%) | 130 (8.3%) |
Income Below Poverty Among Single-Parent Households in Yoakum County
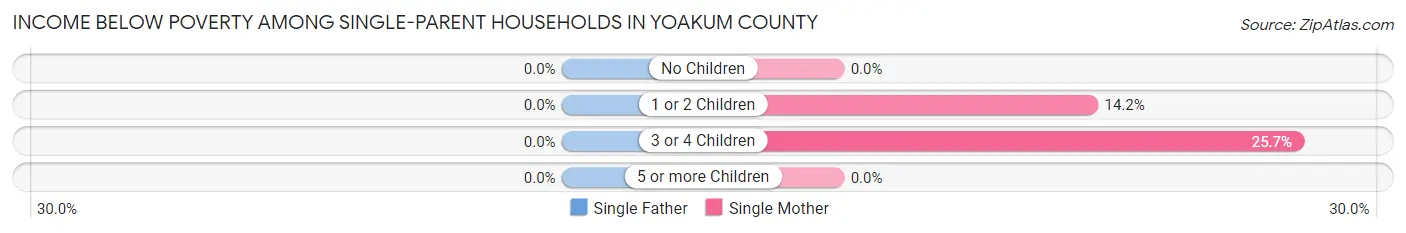
| Children | Single Father | Single Mother |
| No Children | 0 (0.0%) | 0 (0.0%) |
| 1 or 2 Children | 0 (0.0%) | 44 (14.2%) |
| 3 or 4 Children | 0 (0.0%) | 9 (25.7%) |
| 5 or more Children | 0 (0.0%) | 0 (0.0%) |
| Total | 0 (0.0%) | 53 (11.1%) |
Income Below Poverty Among Married-Couple vs Single-Parent Households in Yoakum County
The poverty data for Yoakum County shows that 130 of the married-couple family households (8.3%) and 53 of the single-parent households (10.7%) are living below the poverty level. Within the married-couple family households, those with 3 or 4 children have the highest poverty rate, with 61 households (21.0%) falling below the poverty line. Among the single-parent households, those with 3 or 4 children have the highest poverty rate, with 9 household (25.7%) living below poverty.
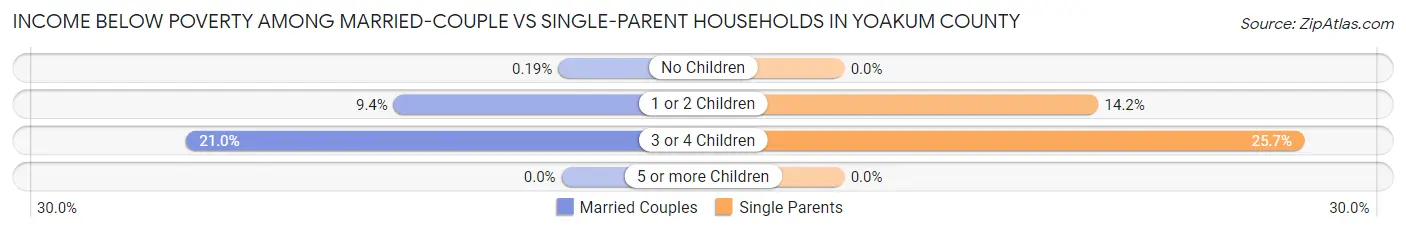
| Children | Married-Couple Families | Single-Parent Households |
| No Children | 1 (0.2%) | 0 (0.0%) |
| 1 or 2 Children | 68 (9.4%) | 44 (14.2%) |
| 3 or 4 Children | 61 (21.0%) | 9 (25.7%) |
| 5 or more Children | 0 (0.0%) | 0 (0.0%) |
| Total | 130 (8.3%) | 53 (10.7%) |
Race in Yoakum County
The most populous races in Yoakum County are Hispanic or Latino (5,183 | 67.9%), White / Caucasian (4,938 | 64.7%), and Two or more Races (1,772 | 23.2%).
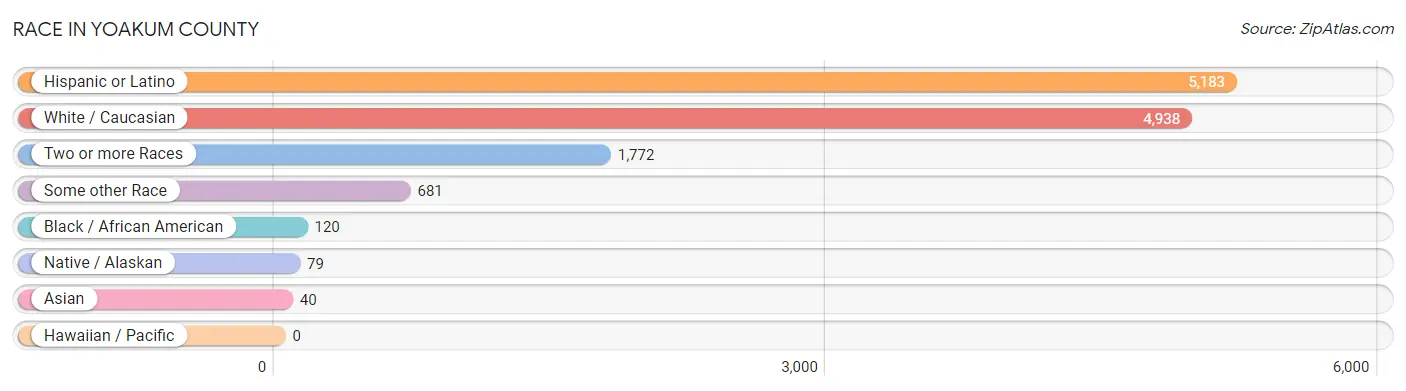
| Race | # Population | % Population |
| Asian | 40 | 0.5% |
| Black / African American | 120 | 1.6% |
| Hawaiian / Pacific | 0 | 0.0% |
| Hispanic or Latino | 5,183 | 67.9% |
| Native / Alaskan | 79 | 1.0% |
| White / Caucasian | 4,938 | 64.7% |
| Two or more Races | 1,772 | 23.2% |
| Some other Race | 681 | 8.9% |
| Total | 7,630 | 100.0% |
Ancestry in Yoakum County
The most populous ancestries reported in Yoakum County are Mexican (4,924 | 64.5%), English (326 | 4.3%), American (277 | 3.6%), German (277 | 3.6%), and Scottish (193 | 2.5%), together accounting for 78.6% of all Yoakum County residents.
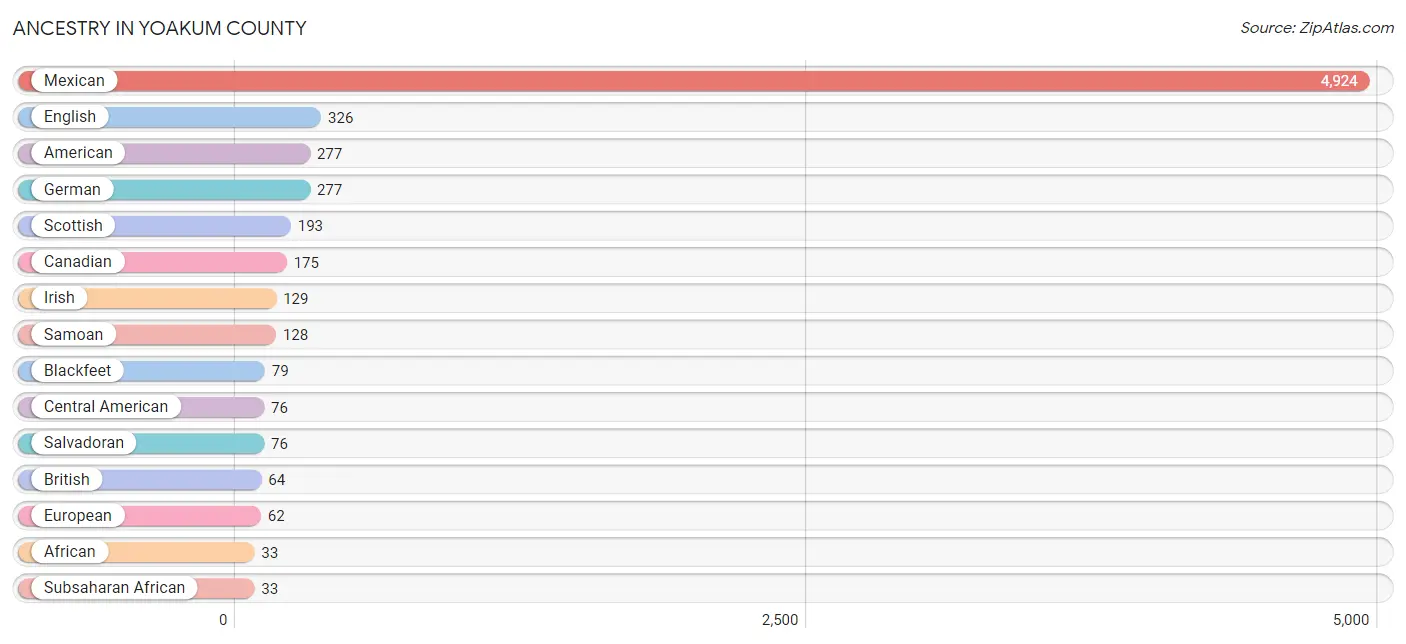
| Ancestry | # Population | % Population |
| African | 33 | 0.4% |
| American | 277 | 3.6% |
| Blackfeet | 79 | 1.0% |
| British | 64 | 0.8% |
| Canadian | 175 | 2.3% |
| Central American | 76 | 1.0% |
| Cherokee | 22 | 0.3% |
| Czech | 17 | 0.2% |
| English | 326 | 4.3% |
| European | 62 | 0.8% |
| French | 27 | 0.4% |
| German | 277 | 3.6% |
| Irish | 129 | 1.7% |
| Italian | 18 | 0.2% |
| Mexican | 4,924 | 64.5% |
| Norwegian | 27 | 0.4% |
| Polish | 17 | 0.2% |
| Salvadoran | 76 | 1.0% |
| Samoan | 128 | 1.7% |
| Scotch-Irish | 12 | 0.2% |
| Scottish | 193 | 2.5% |
| Subsaharan African | 33 | 0.4% |
| Swedish | 3 | 0.0% | View All 23 Rows |
Immigrants in Yoakum County
The most numerous immigrant groups reported in Yoakum County came from Latin America (1,854 | 24.3%), Central America (1,836 | 24.1%), Mexico (1,773 | 23.2%), El Salvador (63 | 0.8%), and Canada (23 | 0.3%), together accounting for 72.7% of all Yoakum County residents.
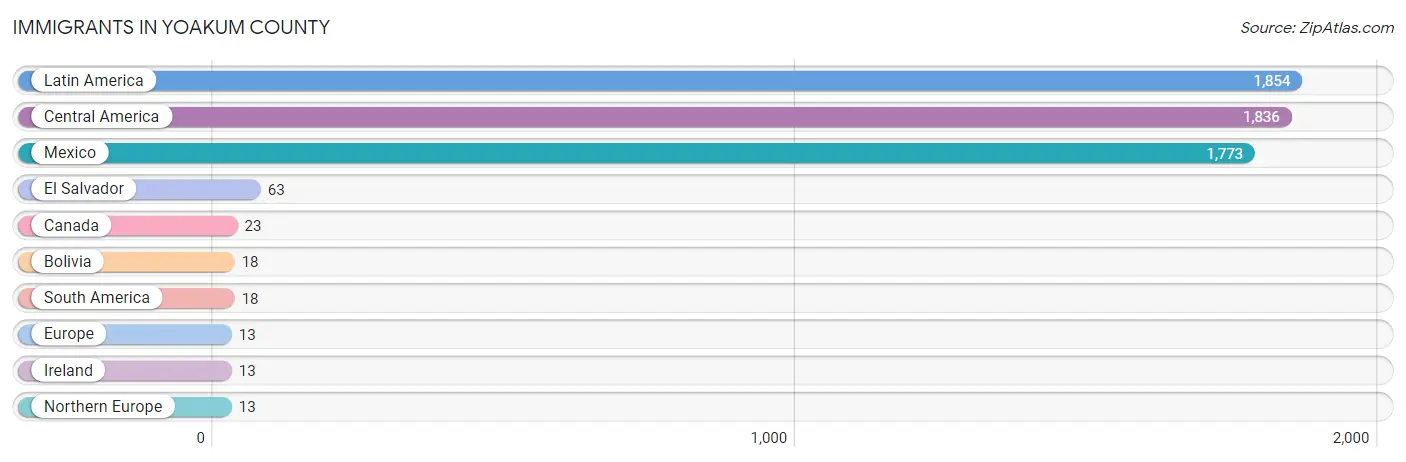
| Immigration Origin | # Population | % Population |
| Bolivia | 18 | 0.2% |
| Canada | 23 | 0.3% |
| Central America | 1,836 | 24.1% |
| El Salvador | 63 | 0.8% |
| Europe | 13 | 0.2% |
| Ireland | 13 | 0.2% |
| Latin America | 1,854 | 24.3% |
| Mexico | 1,773 | 23.2% |
| Northern Europe | 13 | 0.2% |
| South America | 18 | 0.2% | View All 10 Rows |
Sex and Age in Yoakum County
Sex and Age in Yoakum County
The most populous age groups in Yoakum County are Under 5 Years (466 | 13.0%) for men and 5 to 9 Years (618 | 15.2%) for women.
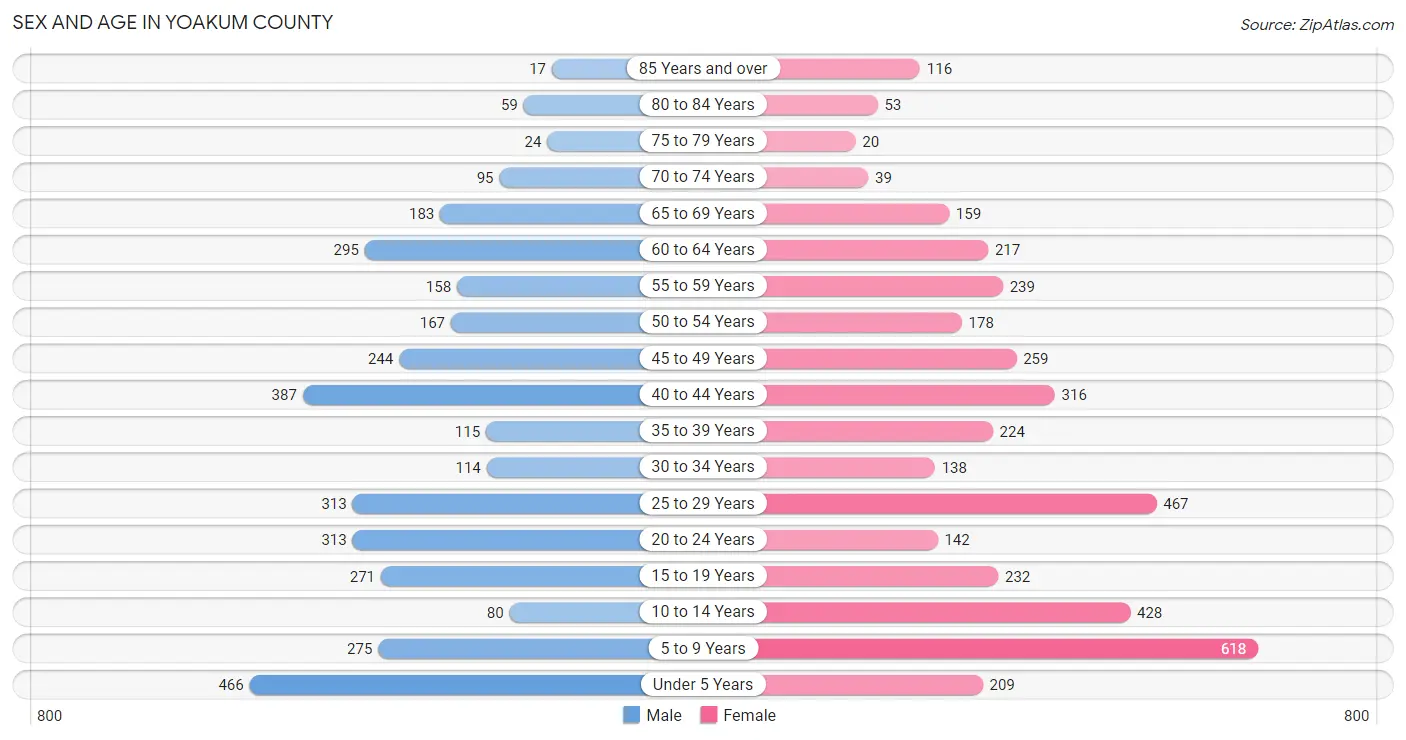
| Age Bracket | Male | Female |
| Under 5 Years | 466 (13.0%) | 209 (5.2%) |
| 5 to 9 Years | 275 (7.7%) | 618 (15.2%) |
| 10 to 14 Years | 80 (2.2%) | 428 (10.6%) |
| 15 to 19 Years | 271 (7.6%) | 232 (5.7%) |
| 20 to 24 Years | 313 (8.7%) | 142 (3.5%) |
| 25 to 29 Years | 313 (8.7%) | 467 (11.5%) |
| 30 to 34 Years | 114 (3.2%) | 138 (3.4%) |
| 35 to 39 Years | 115 (3.2%) | 224 (5.5%) |
| 40 to 44 Years | 387 (10.8%) | 316 (7.8%) |
| 45 to 49 Years | 244 (6.8%) | 259 (6.4%) |
| 50 to 54 Years | 167 (4.7%) | 178 (4.4%) |
| 55 to 59 Years | 158 (4.4%) | 239 (5.9%) |
| 60 to 64 Years | 295 (8.3%) | 217 (5.3%) |
| 65 to 69 Years | 183 (5.1%) | 159 (3.9%) |
| 70 to 74 Years | 95 (2.7%) | 39 (1.0%) |
| 75 to 79 Years | 24 (0.7%) | 20 (0.5%) |
| 80 to 84 Years | 59 (1.7%) | 53 (1.3%) |
| 85 Years and over | 17 (0.5%) | 116 (2.9%) |
| Total | 3,576 (100.0%) | 4,054 (100.0%) |
Families and Households in Yoakum County
Median Family Size in Yoakum County
The median family size in Yoakum County is 3.31 persons per family, with married-couple families (1,575 | 76.1%) accounting for the largest median family size of 3.53 persons per family. On the other hand, single male/father families (18 | 0.9%) represent the smallest median family size with 1.56 persons per family.
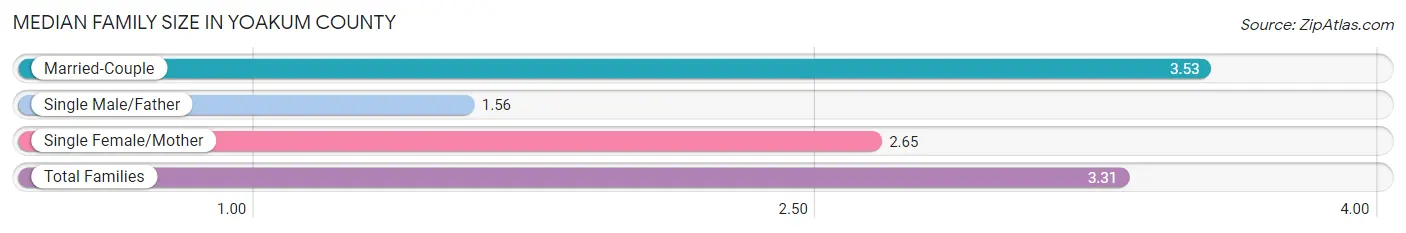
| Family Type | # Families | Family Size |
| Married-Couple | 1,575 (76.1%) | 3.53 |
| Single Male/Father | 18 (0.9%) | 1.56 |
| Single Female/Mother | 477 (23.0%) | 2.65 |
| Total Families | 2,070 (100.0%) | 3.31 |
Median Household Size in Yoakum County
The median household size in Yoakum County is 2.87 persons per household, with married-couple households (1,575 | 59.3%) accounting for the largest median household size of 3.53 persons per household. non-family households (584 | 22.0%) represent the smallest median household size with 1.13 persons per household.
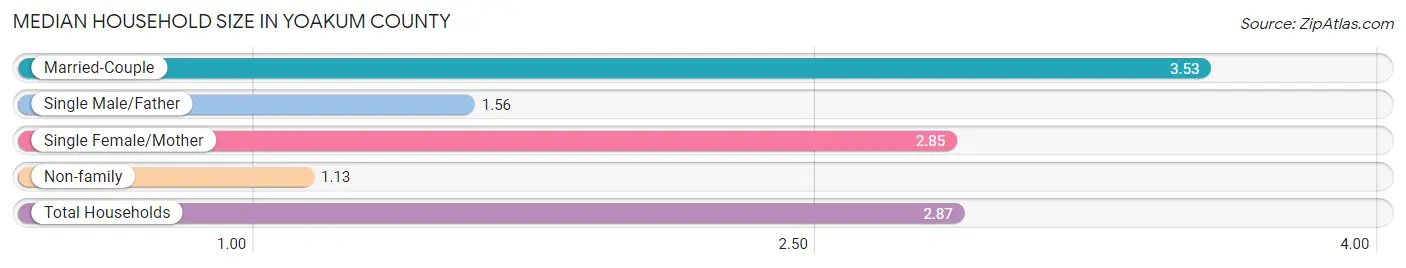
| Household Type | # Households | Household Size |
| Married-Couple | 1,575 (59.3%) | 3.53 |
| Single Male/Father | 18 (0.7%) | 1.56 |
| Single Female/Mother | 477 (18.0%) | 2.85 |
| Non-family | 584 (22.0%) | 1.13 |
| Total Households | 2,654 (100.0%) | 2.87 |
Household Size by Marriage Status in Yoakum County
Out of a total of 2,654 households in Yoakum County, 2,070 (78.0%) are family households, while 584 (22.0%) are nonfamily households. The most numerous type of family households are 2-person households, comprising 579, and the most common type of nonfamily households are 1-person households, comprising 483.
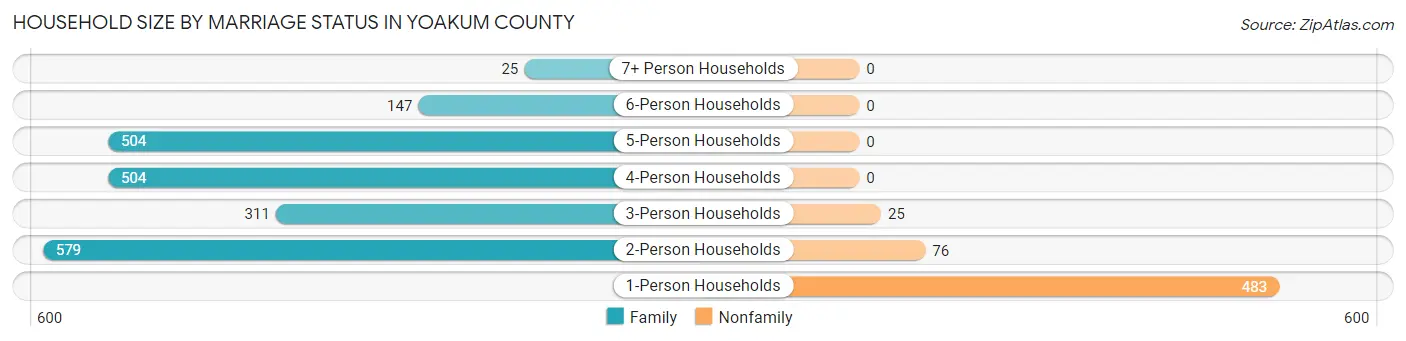
| Household Size | Family Households | Nonfamily Households |
| 1-Person Households | - | 483 (18.2%) |
| 2-Person Households | 579 (21.8%) | 76 (2.9%) |
| 3-Person Households | 311 (11.7%) | 25 (0.9%) |
| 4-Person Households | 504 (19.0%) | 0 (0.0%) |
| 5-Person Households | 504 (19.0%) | 0 (0.0%) |
| 6-Person Households | 147 (5.5%) | 0 (0.0%) |
| 7+ Person Households | 25 (0.9%) | 0 (0.0%) |
| Total | 2,070 (78.0%) | 584 (22.0%) |
Female Fertility in Yoakum County
Fertility by Age in Yoakum County
Average fertility rate in Yoakum County is 41.0 births per 1,000 women. Women in the age bracket of 20 to 34 years have the highest fertility rate with 74.0 births per 1,000 women. Women in the age bracket of 20 to 34 years acount for 74.3% of all women with births.
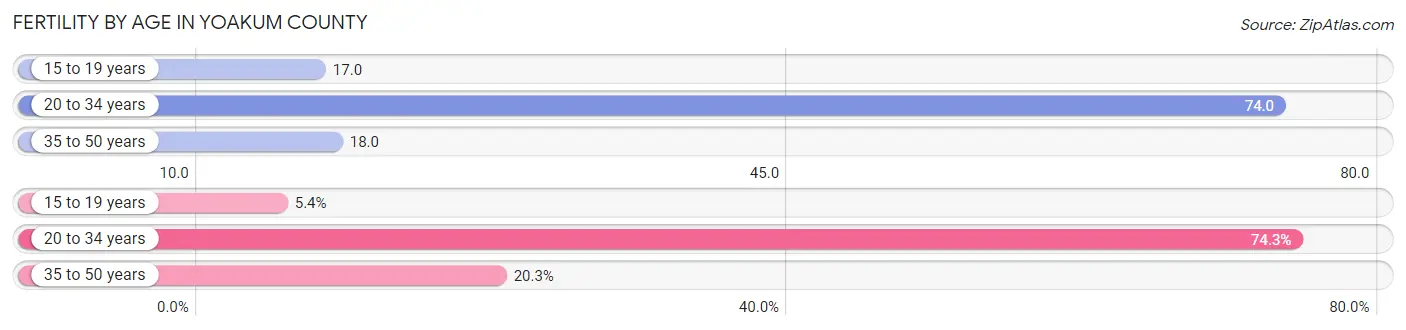
| Age Bracket | Women with Births | Births / 1,000 Women |
| 15 to 19 years | 4 (5.4%) | 17.0 |
| 20 to 34 years | 55 (74.3%) | 74.0 |
| 35 to 50 years | 15 (20.3%) | 18.0 |
| Total | 74 (100.0%) | 41.0 |
Fertility by Age by Marriage Status in Yoakum County
83.8% of women with births (74) in Yoakum County are married. The highest percentage of unmarried women with births falls into 15 to 19 years age bracket with 100.0% of them unmarried at the time of birth, while the lowest percentage of unmarried women with births belong to 35 to 50 years age bracket with 0.0% of them unmarried.
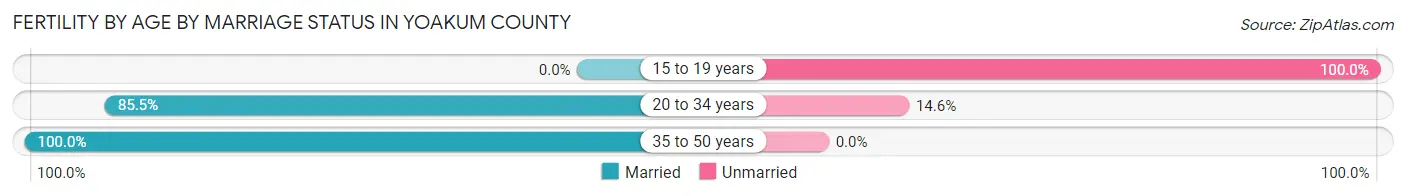
| Age Bracket | Married | Unmarried |
| 15 to 19 years | 0 (0.0%) | 4 (100.0%) |
| 20 to 34 years | 47 (85.5%) | 8 (14.5%) |
| 35 to 50 years | 15 (100.0%) | 0 (0.0%) |
| Total | 62 (83.8%) | 12 (16.2%) |
Fertility by Education in Yoakum County
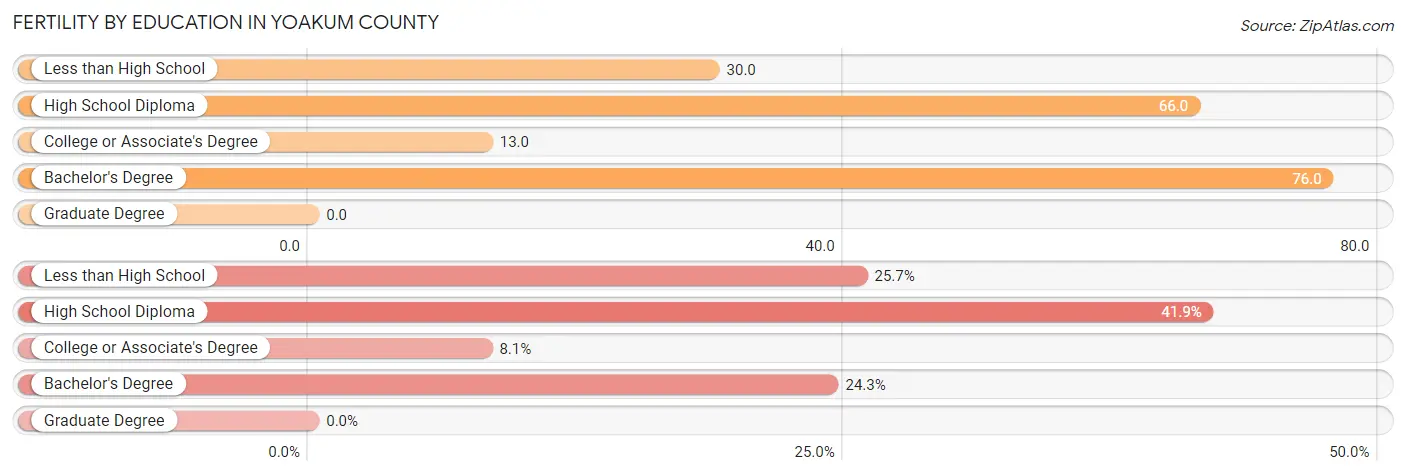
| Educational Attainment | Women with Births | Births / 1,000 Women |
| Less than High School | 19 (25.7%) | 30.0 |
| High School Diploma | 31 (41.9%) | 66.0 |
| College or Associate's Degree | 6 (8.1%) | 13.0 |
| Bachelor's Degree | 18 (24.3%) | 76.0 |
| Graduate Degree | 0 (0.0%) | 0.0 |
| Total | 74 (100.0%) | 41.0 |
Fertility by Education by Marriage Status in Yoakum County
16.2% of women with births in Yoakum County are unmarried. Women with the educational attainment of college or associate's degree are most likely to be married with 100.0% of them married at childbirth, while women with the educational attainment of high school diploma are least likely to be married with 25.8% of them unmarried at childbirth.
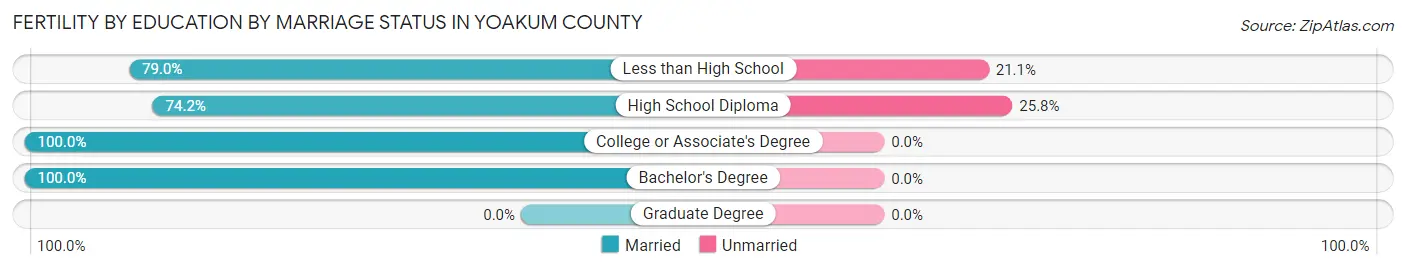
| Educational Attainment | Married | Unmarried |
| Less than High School | 15 (78.9%) | 4 (21.0%) |
| High School Diploma | 23 (74.2%) | 8 (25.8%) |
| College or Associate's Degree | 6 (100.0%) | 0 (0.0%) |
| Bachelor's Degree | 18 (100.0%) | 0 (0.0%) |
| Graduate Degree | 0 (0.0%) | 0 (0.0%) |
| Total | 62 (83.8%) | 12 (16.2%) |
Employment Characteristics in Yoakum County
Employment by Class of Employer in Yoakum County
Among the 3,273 employed individuals in Yoakum County, private company employees (2,595 | 79.3%), local government employees (301 | 9.2%), and self-employed (not incorporated) (126 | 3.8%) make up the most common classes of employment.
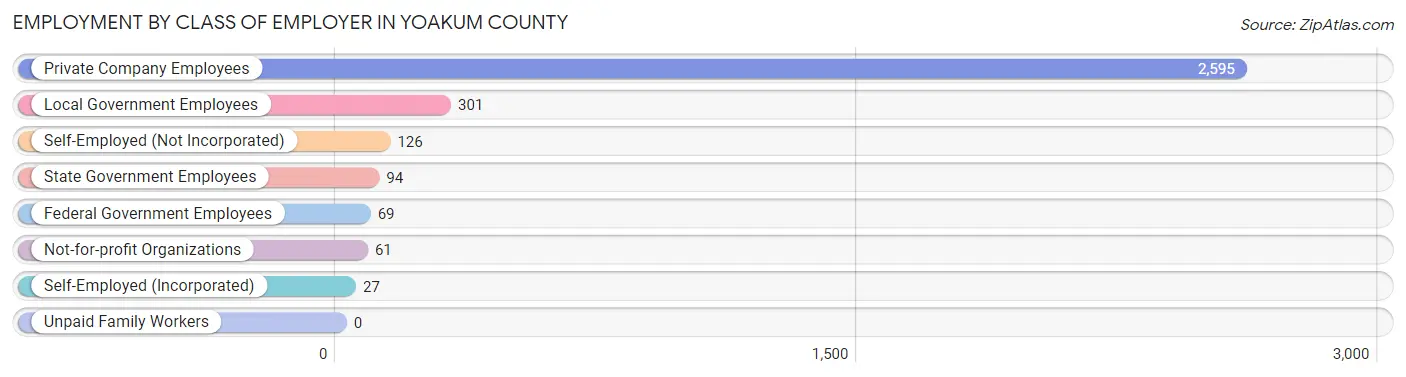
| Employer Class | # Employees | % Employees |
| Private Company Employees | 2,595 | 79.3% |
| Self-Employed (Incorporated) | 27 | 0.8% |
| Self-Employed (Not Incorporated) | 126 | 3.8% |
| Not-for-profit Organizations | 61 | 1.9% |
| Local Government Employees | 301 | 9.2% |
| State Government Employees | 94 | 2.9% |
| Federal Government Employees | 69 | 2.1% |
| Unpaid Family Workers | 0 | 0.0% |
| Total | 3,273 | 100.0% |
Employment Status by Age in Yoakum County
According to the labor force statistics for Yoakum County, out of the total population over 16 years of age (5,340), 64.1% or 3,423 individuals are in the labor force, with 3.9% or 133 of them unemployed. The age group with the highest labor force participation rate is 45 to 54 years, with 82.7% or 701 individuals in the labor force. Within the labor force, the 65 to 74 years age range has the highest percentage of unemployed individuals, with 14.9% or 31 of them being unemployed.
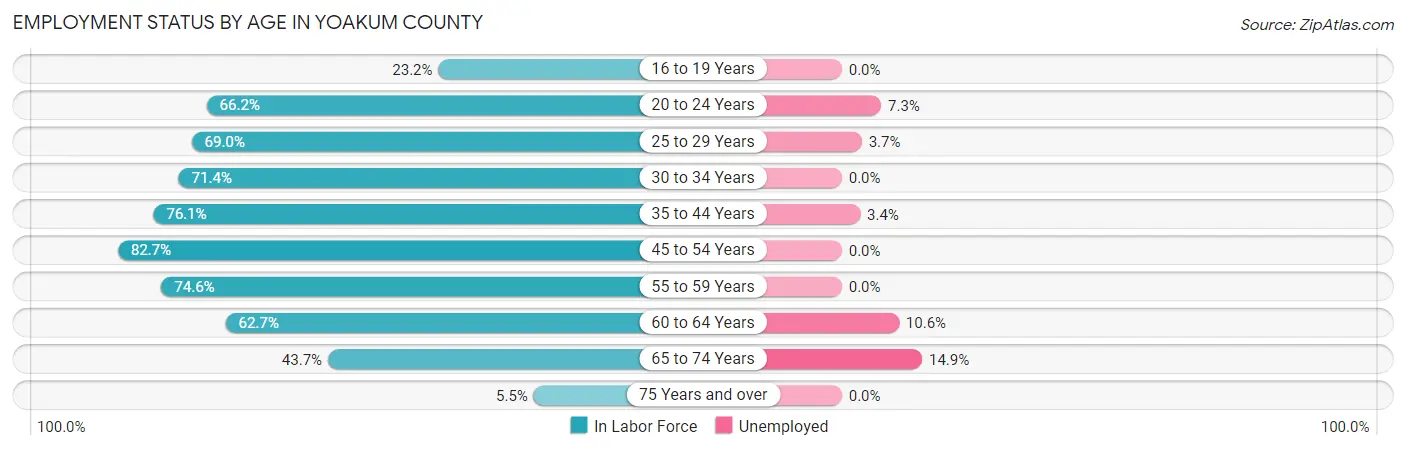
| Age Bracket | In Labor Force | Unemployed |
| 16 to 19 Years | 67 (23.2%) | 0 (0.0%) |
| 20 to 24 Years | 301 (66.2%) | 22 (7.3%) |
| 25 to 29 Years | 538 (69.0%) | 20 (3.7%) |
| 30 to 34 Years | 180 (71.4%) | 0 (0.0%) |
| 35 to 44 Years | 793 (76.1%) | 27 (3.4%) |
| 45 to 54 Years | 701 (82.7%) | 0 (0.0%) |
| 55 to 59 Years | 296 (74.6%) | 0 (0.0%) |
| 60 to 64 Years | 321 (62.7%) | 34 (10.6%) |
| 65 to 74 Years | 208 (43.7%) | 31 (14.9%) |
| 75 Years and over | 16 (5.5%) | 0 (0.0%) |
| Total | 3,423 (64.1%) | 133 (3.9%) |
Employment Status by Educational Attainment in Yoakum County
According to labor force statistics for Yoakum County, 73.8% of individuals (2,827) out of the total population between 25 and 64 years of age (3,831) are in the labor force, with 2.9% or 82 of them being unemployed. The group with the highest labor force participation rate are those with the educational attainment of bachelor's degree or higher, with 93.9% or 387 individuals in the labor force. Within the labor force, individuals with less than high school education have the highest percentage of unemployment, with 8.0% or 52 of them being unemployed.
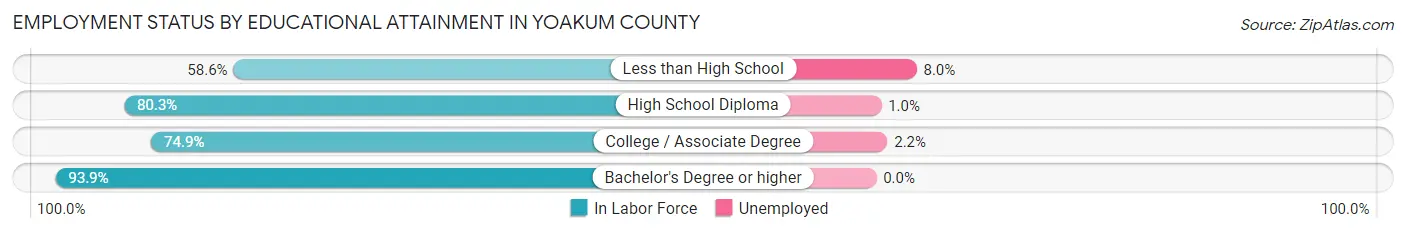
| Educational Attainment | In Labor Force | Unemployed |
| Less than High School | 648 (58.6%) | 88 (8.0%) |
| High School Diploma | 903 (80.3%) | 11 (1.0%) |
| College / Associate Degree | 891 (74.9%) | 26 (2.2%) |
| Bachelor's Degree or higher | 387 (93.9%) | 0 (0.0%) |
| Total | 2,827 (73.8%) | 111 (2.9%) |
Employment Occupations by Sex in Yoakum County
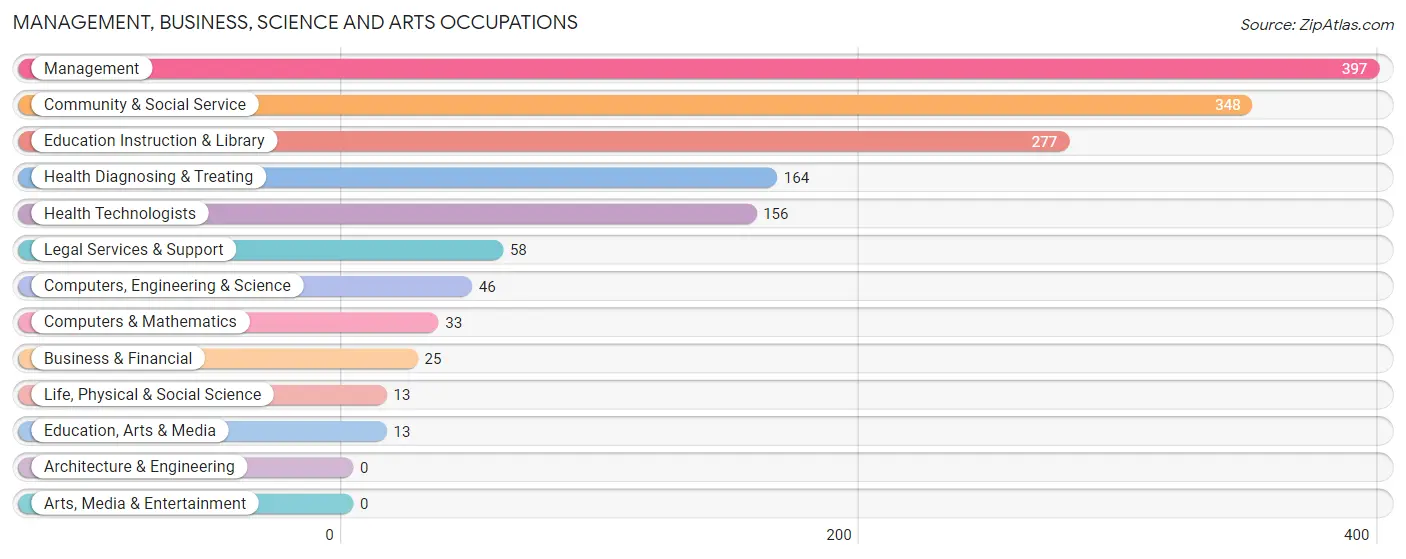
Management, Business, Science and Arts Occupations
The most common Management, Business, Science and Arts occupations in Yoakum County are Management (397 | 12.1%), Community & Social Service (348 | 10.6%), Education Instruction & Library (277 | 8.4%), Health Diagnosing & Treating (164 | 5.0%), and Health Technologists (156 | 4.8%).
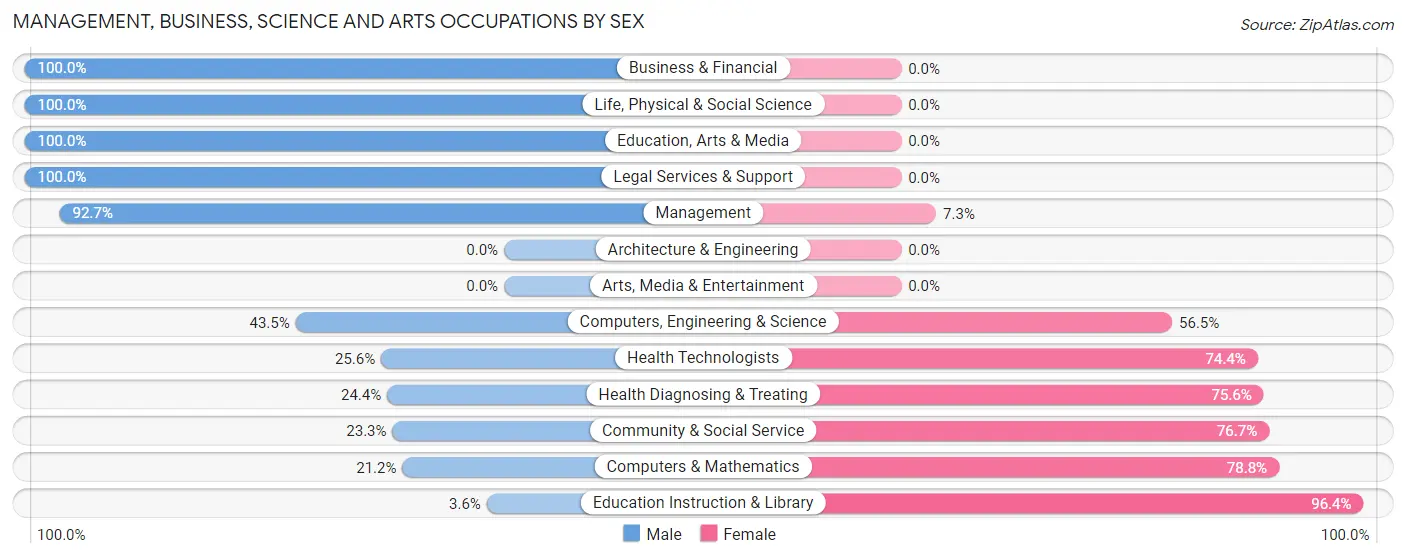
Management, Business, Science and Arts Occupations by Sex
Within the Management, Business, Science and Arts occupations in Yoakum County, the most male-oriented occupations are Business & Financial (100.0%), Life, Physical & Social Science (100.0%), and Education, Arts & Media (100.0%), while the most female-oriented occupations are Education Instruction & Library (96.4%), Computers & Mathematics (78.8%), and Community & Social Service (76.7%).
| Occupation | Male | Female |
| Management | 368 (92.7%) | 29 (7.3%) |
| Business & Financial | 25 (100.0%) | 0 (0.0%) |
| Computers, Engineering & Science | 20 (43.5%) | 26 (56.5%) |
| Computers & Mathematics | 7 (21.2%) | 26 (78.8%) |
| Architecture & Engineering | 0 (0.0%) | 0 (0.0%) |
| Life, Physical & Social Science | 13 (100.0%) | 0 (0.0%) |
| Community & Social Service | 81 (23.3%) | 267 (76.7%) |
| Education, Arts & Media | 13 (100.0%) | 0 (0.0%) |
| Legal Services & Support | 58 (100.0%) | 0 (0.0%) |
| Education Instruction & Library | 10 (3.6%) | 267 (96.4%) |
| Arts, Media & Entertainment | 0 (0.0%) | 0 (0.0%) |
| Health Diagnosing & Treating | 40 (24.4%) | 124 (75.6%) |
| Health Technologists | 40 (25.6%) | 116 (74.4%) |
| Total (Category) | 534 (54.5%) | 446 (45.5%) |
| Total (Overall) | 2,089 (63.5%) | 1,198 (36.4%) |
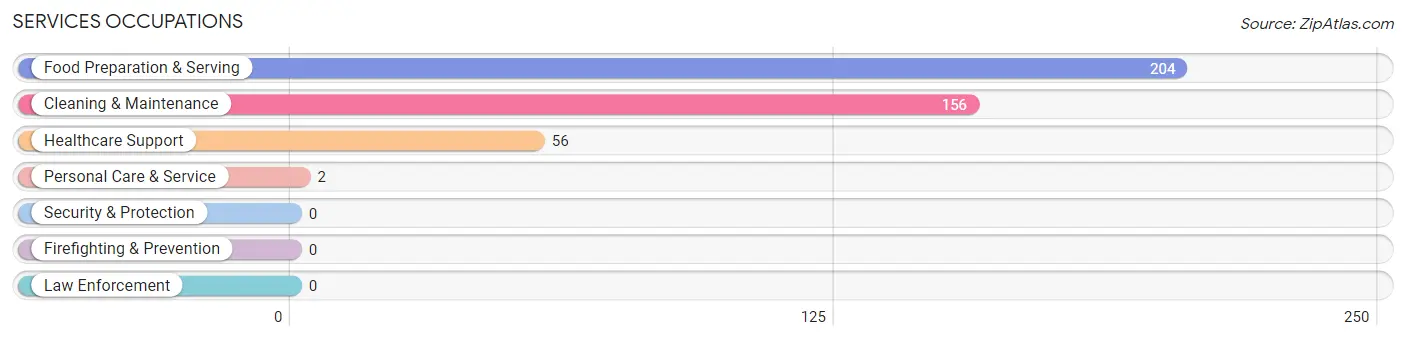
Services Occupations
The most common Services occupations in Yoakum County are Food Preparation & Serving (204 | 6.2%), Cleaning & Maintenance (156 | 4.8%), Healthcare Support (56 | 1.7%), and Personal Care & Service (2 | 0.1%).
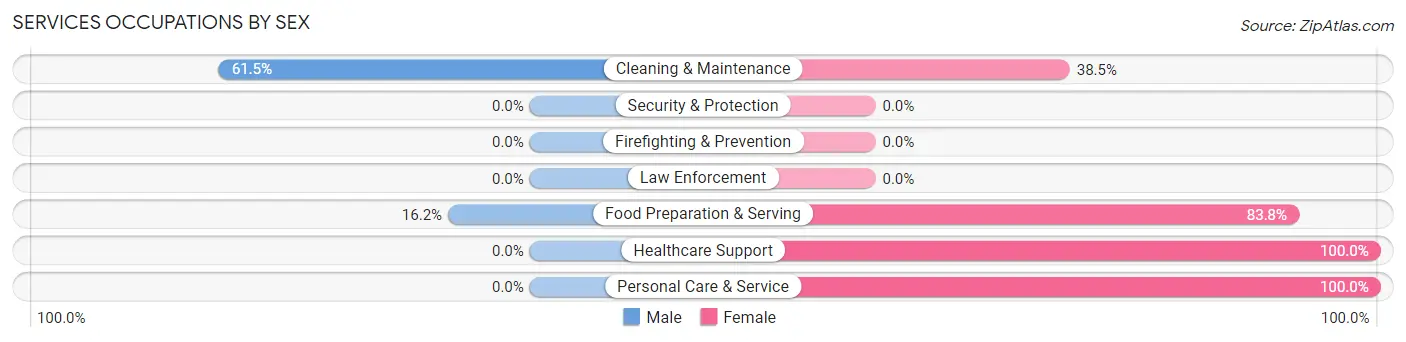
Services Occupations by Sex
Within the Services occupations in Yoakum County, the most male-oriented occupations are Cleaning & Maintenance (61.5%), and Food Preparation & Serving (16.2%), while the most female-oriented occupations are Healthcare Support (100.0%), Personal Care & Service (100.0%), and Food Preparation & Serving (83.8%).
| Occupation | Male | Female |
| Healthcare Support | 0 (0.0%) | 56 (100.0%) |
| Security & Protection | 0 (0.0%) | 0 (0.0%) |
| Firefighting & Prevention | 0 (0.0%) | 0 (0.0%) |
| Law Enforcement | 0 (0.0%) | 0 (0.0%) |
| Food Preparation & Serving | 33 (16.2%) | 171 (83.8%) |
| Cleaning & Maintenance | 96 (61.5%) | 60 (38.5%) |
| Personal Care & Service | 0 (0.0%) | 2 (100.0%) |
| Total (Category) | 129 (30.9%) | 289 (69.1%) |
| Total (Overall) | 2,089 (63.5%) | 1,198 (36.4%) |
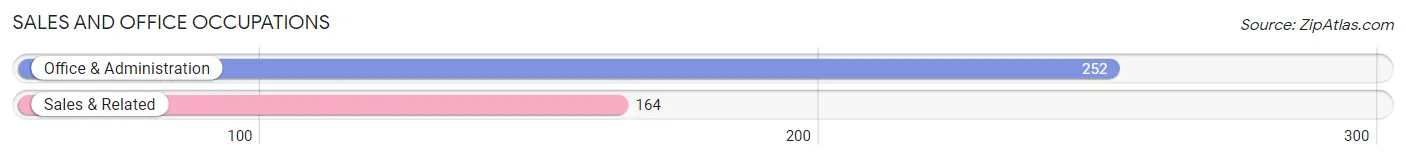
Sales and Office Occupations
The most common Sales and Office occupations in Yoakum County are Office & Administration (252 | 7.7%), and Sales & Related (164 | 5.0%).
Sales and Office Occupations by Sex
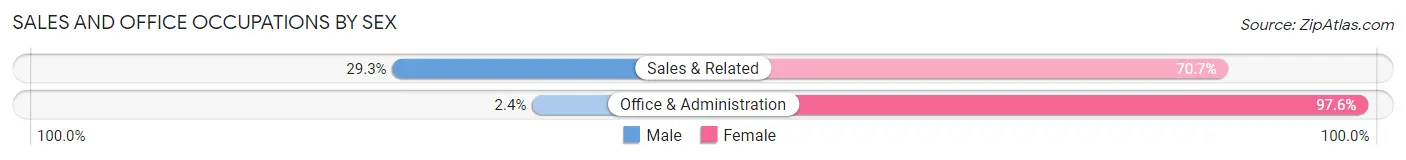
| Occupation | Male | Female |
| Sales & Related | 48 (29.3%) | 116 (70.7%) |
| Office & Administration | 6 (2.4%) | 246 (97.6%) |
| Total (Category) | 54 (13.0%) | 362 (87.0%) |
| Total (Overall) | 2,089 (63.5%) | 1,198 (36.4%) |
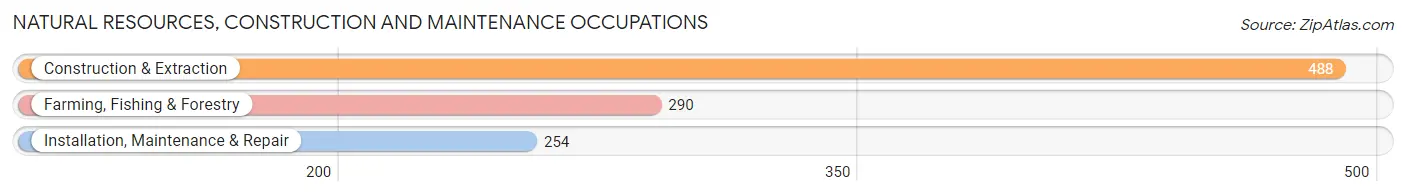
Natural Resources, Construction and Maintenance Occupations
The most common Natural Resources, Construction and Maintenance occupations in Yoakum County are Construction & Extraction (488 | 14.8%), Farming, Fishing & Forestry (290 | 8.8%), and Installation, Maintenance & Repair (254 | 7.7%).
Natural Resources, Construction and Maintenance Occupations by Sex
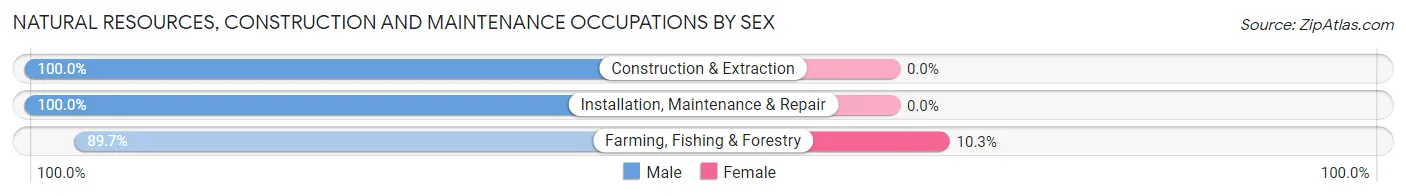
| Occupation | Male | Female |
| Farming, Fishing & Forestry | 260 (89.7%) | 30 (10.3%) |
| Construction & Extraction | 488 (100.0%) | 0 (0.0%) |
| Installation, Maintenance & Repair | 254 (100.0%) | 0 (0.0%) |
| Total (Category) | 1,002 (97.1%) | 30 (2.9%) |
| Total (Overall) | 2,089 (63.5%) | 1,198 (36.4%) |
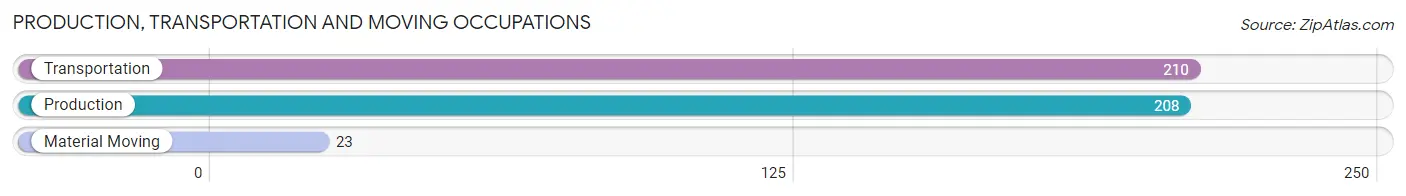
Production, Transportation and Moving Occupations
The most common Production, Transportation and Moving occupations in Yoakum County are Transportation (210 | 6.4%), Production (208 | 6.3%), and Material Moving (23 | 0.7%).
Production, Transportation and Moving Occupations by Sex
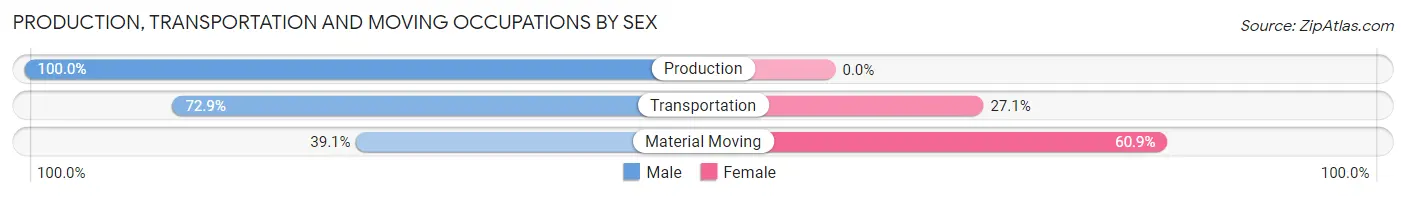
| Occupation | Male | Female |
| Production | 208 (100.0%) | 0 (0.0%) |
| Transportation | 153 (72.9%) | 57 (27.1%) |
| Material Moving | 9 (39.1%) | 14 (60.9%) |
| Total (Category) | 370 (83.9%) | 71 (16.1%) |
| Total (Overall) | 2,089 (63.5%) | 1,198 (36.4%) |
Employment Industries by Sex in Yoakum County
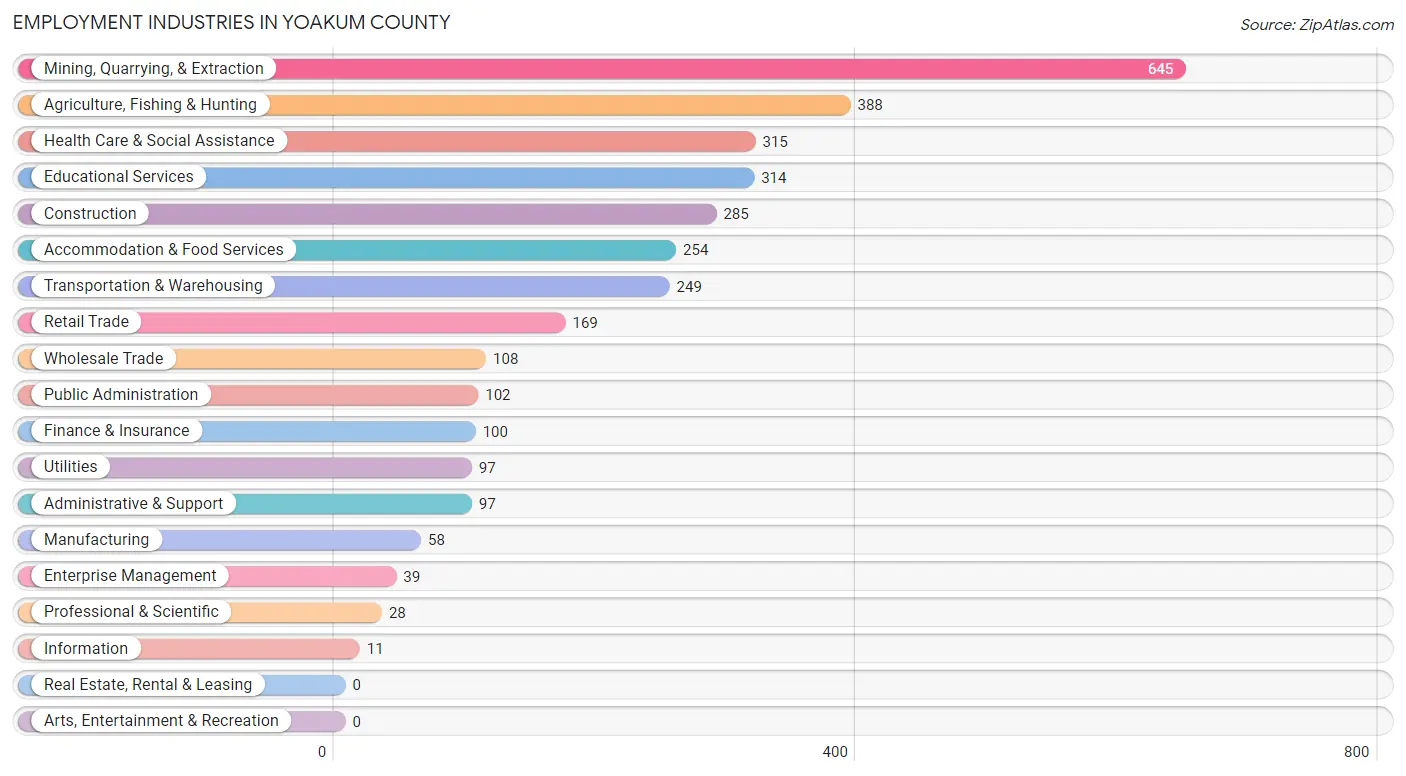
Employment Industries in Yoakum County
The major employment industries in Yoakum County include Mining, Quarrying, & Extraction (645 | 19.6%), Agriculture, Fishing & Hunting (388 | 11.8%), Health Care & Social Assistance (315 | 9.6%), Educational Services (314 | 9.6%), and Construction (285 | 8.7%).
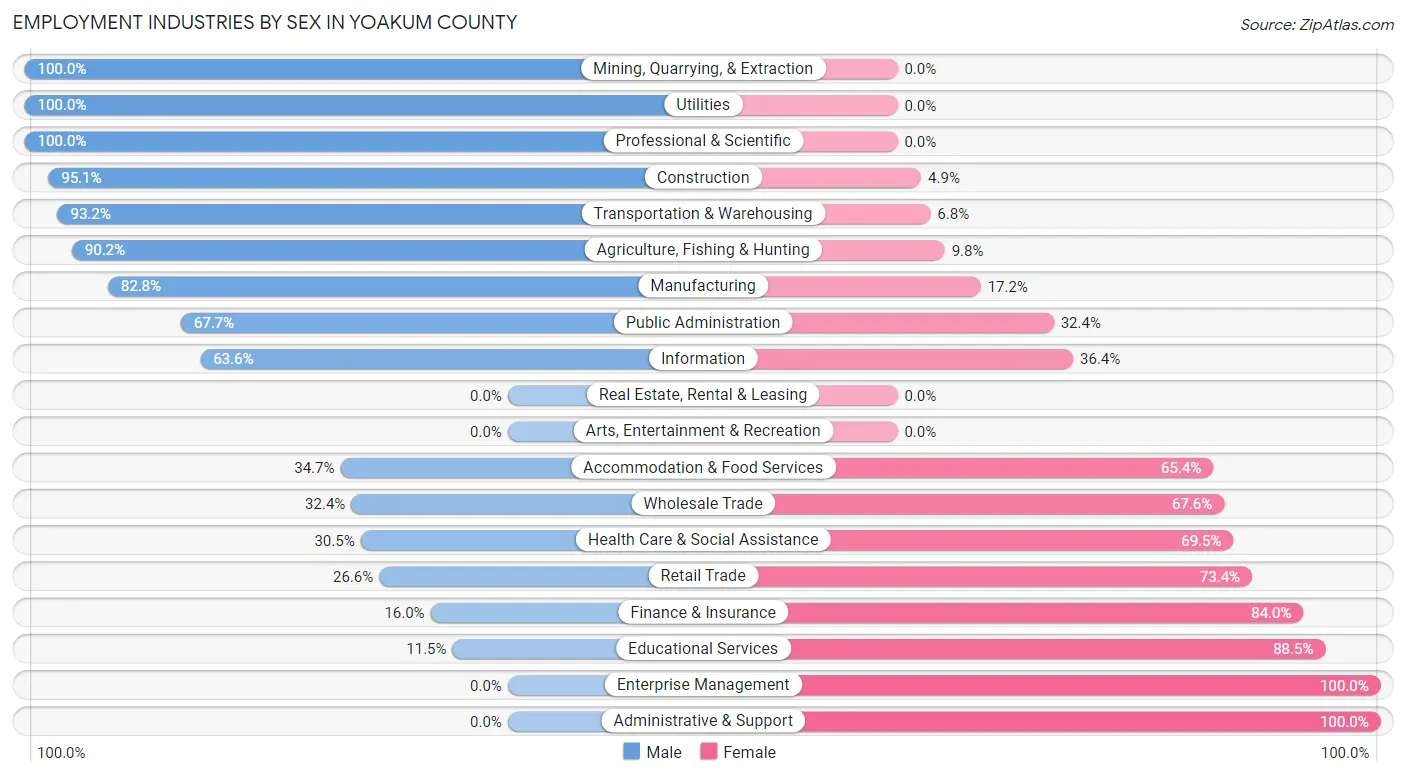
Employment Industries by Sex in Yoakum County
The Yoakum County industries that see more men than women are Mining, Quarrying, & Extraction (100.0%), Utilities (100.0%), and Professional & Scientific (100.0%), whereas the industries that tend to have a higher number of women are Enterprise Management (100.0%), Administrative & Support (100.0%), and Educational Services (88.5%).
| Industry | Male | Female |
| Agriculture, Fishing & Hunting | 350 (90.2%) | 38 (9.8%) |
| Mining, Quarrying, & Extraction | 645 (100.0%) | 0 (0.0%) |
| Construction | 271 (95.1%) | 14 (4.9%) |
| Manufacturing | 48 (82.8%) | 10 (17.2%) |
| Wholesale Trade | 35 (32.4%) | 73 (67.6%) |
| Retail Trade | 45 (26.6%) | 124 (73.4%) |
| Transportation & Warehousing | 232 (93.2%) | 17 (6.8%) |
| Utilities | 97 (100.0%) | 0 (0.0%) |
| Information | 7 (63.6%) | 4 (36.4%) |
| Finance & Insurance | 16 (16.0%) | 84 (84.0%) |
| Real Estate, Rental & Leasing | 0 (0.0%) | 0 (0.0%) |
| Professional & Scientific | 28 (100.0%) | 0 (0.0%) |
| Enterprise Management | 0 (0.0%) | 39 (100.0%) |
| Administrative & Support | 0 (0.0%) | 97 (100.0%) |
| Educational Services | 36 (11.5%) | 278 (88.5%) |
| Health Care & Social Assistance | 96 (30.5%) | 219 (69.5%) |
| Arts, Entertainment & Recreation | 0 (0.0%) | 0 (0.0%) |
| Accommodation & Food Services | 88 (34.6%) | 166 (65.3%) |
| Public Administration | 69 (67.6%) | 33 (32.4%) |
| Total | 2,089 (63.5%) | 1,198 (36.4%) |
Education in Yoakum County
School Enrollment in Yoakum County
The most common levels of schooling among the 2,087 students in Yoakum County are elementary school (663 | 31.8%), high school (447 | 21.4%), and middle school (386 | 18.5%).
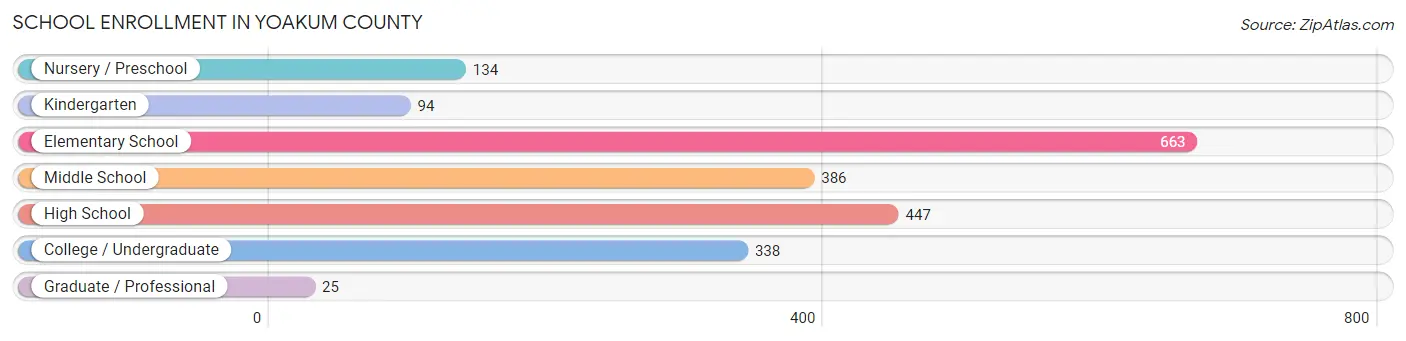
| School Level | # Students | % Students |
| Nursery / Preschool | 134 | 6.4% |
| Kindergarten | 94 | 4.5% |
| Elementary School | 663 | 31.8% |
| Middle School | 386 | 18.5% |
| High School | 447 | 21.4% |
| College / Undergraduate | 338 | 16.2% |
| Graduate / Professional | 25 | 1.2% |
| Total | 2,087 | 100.0% |
School Enrollment by Age by Funding Source in Yoakum County
Out of a total of 2,087 students who are enrolled in schools in Yoakum County, 119 (5.7%) attend a private institution, while the remaining 1,968 (94.3%) are enrolled in public schools. The age group of 3 to 4 year olds has the highest likelihood of being enrolled in private schools, with 10 (100.0% in the age bracket) enrolled. Conversely, the age group of 10 to 14 year olds has the lowest likelihood of being enrolled in a private school, with 471 (100.0% in the age bracket) attending a public institution.
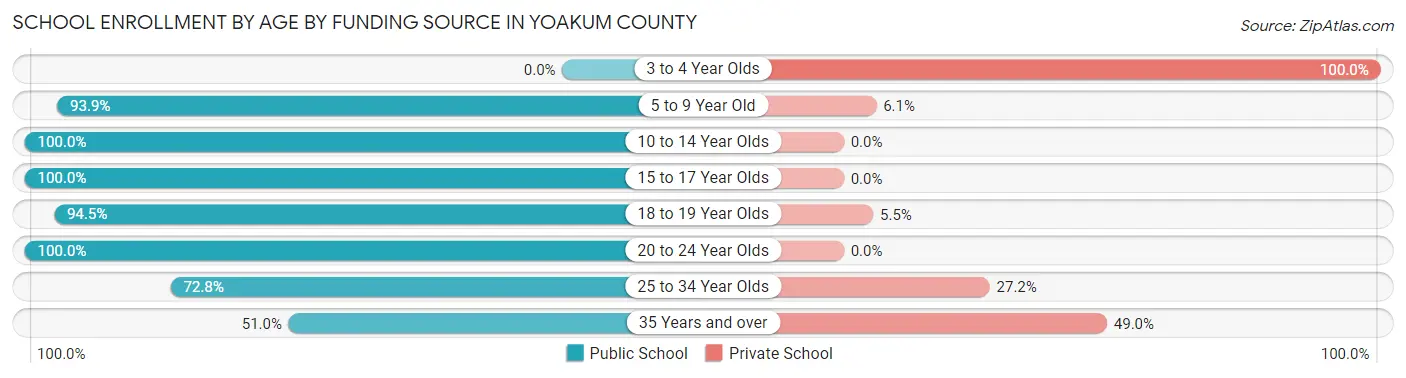
| Age Bracket | Public School | Private School |
| 3 to 4 Year Olds | 0 (0.0%) | 10 (100.0%) |
| 5 to 9 Year Old | 822 (93.9%) | 53 (6.1%) |
| 10 to 14 Year Olds | 471 (100.0%) | 0 (0.0%) |
| 15 to 17 Year Olds | 339 (100.0%) | 0 (0.0%) |
| 18 to 19 Year Olds | 69 (94.5%) | 4 (5.5%) |
| 20 to 24 Year Olds | 165 (100.0%) | 0 (0.0%) |
| 25 to 34 Year Olds | 75 (72.8%) | 28 (27.2%) |
| 35 Years and over | 26 (51.0%) | 25 (49.0%) |
| Total | 1,968 (94.3%) | 119 (5.7%) |
Educational Attainment by Field of Study in Yoakum County
Education (200 | 39.9%), business (77 | 15.4%), visual & performing arts (45 | 9.0%), literature & languages (36 | 7.2%), and engineering (35 | 7.0%) are the most common fields of study among 501 individuals in Yoakum County who have obtained a bachelor's degree or higher.
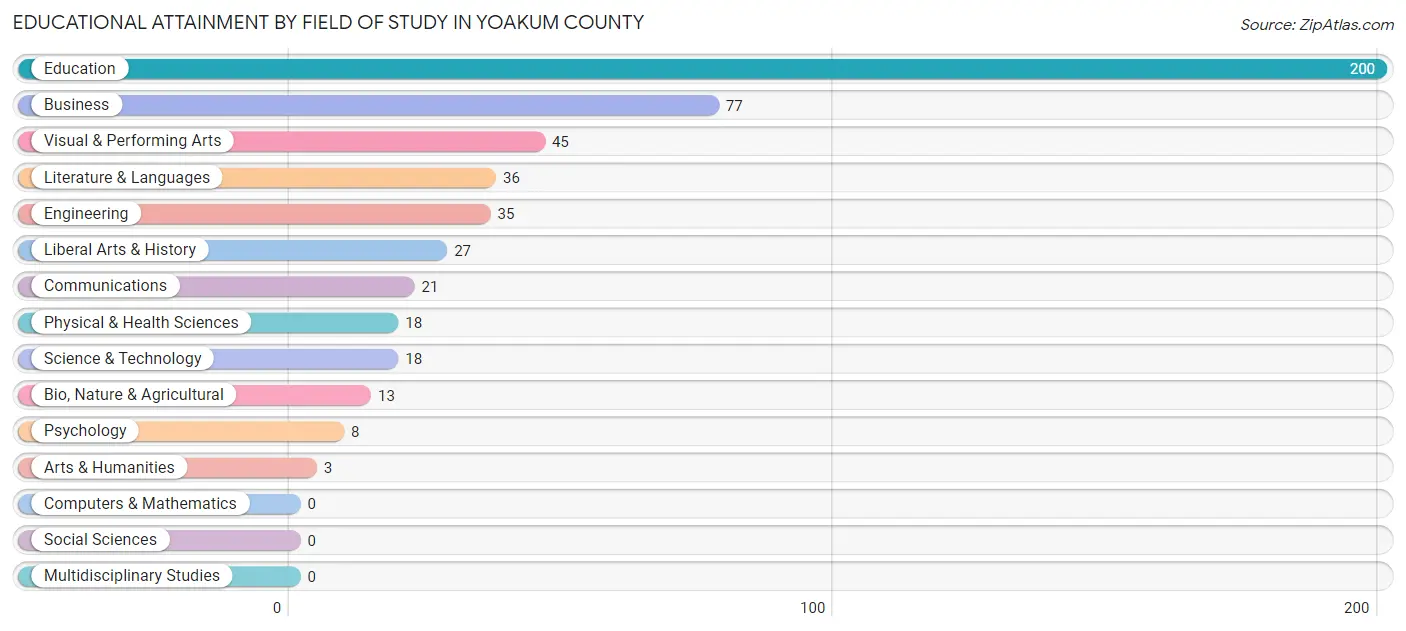
| Field of Study | # Graduates | % Graduates |
| Computers & Mathematics | 0 | 0.0% |
| Bio, Nature & Agricultural | 13 | 2.6% |
| Physical & Health Sciences | 18 | 3.6% |
| Psychology | 8 | 1.6% |
| Social Sciences | 0 | 0.0% |
| Engineering | 35 | 7.0% |
| Multidisciplinary Studies | 0 | 0.0% |
| Science & Technology | 18 | 3.6% |
| Business | 77 | 15.4% |
| Education | 200 | 39.9% |
| Literature & Languages | 36 | 7.2% |
| Liberal Arts & History | 27 | 5.4% |
| Visual & Performing Arts | 45 | 9.0% |
| Communications | 21 | 4.2% |
| Arts & Humanities | 3 | 0.6% |
| Total | 501 | 100.0% |
Transportation & Commute in Yoakum County
Vehicle Availability by Sex in Yoakum County
The most prevalent vehicle ownership categories in Yoakum County are males with 2 vehicles (628, accounting for 30.1%) and females with 2 vehicles (250, making up 52.9%).
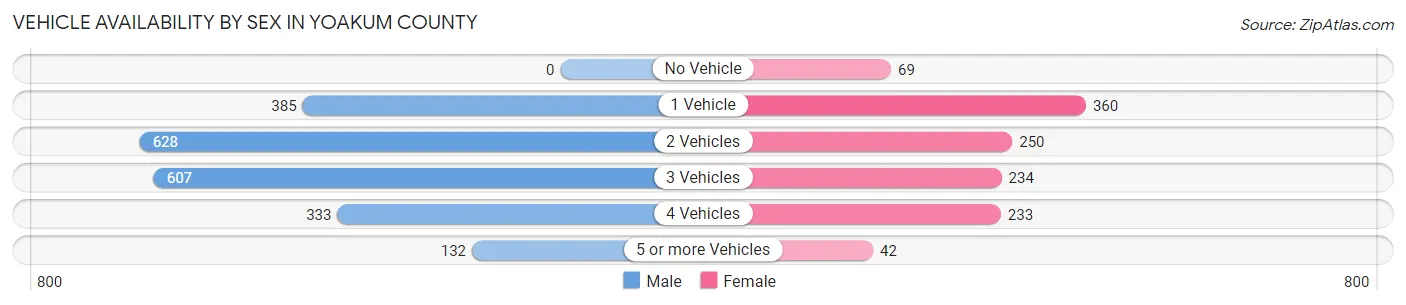
| Vehicles Available | Male | Female |
| No Vehicle | 0 (0.0%) | 69 (5.8%) |
| 1 Vehicle | 385 (18.5%) | 360 (30.3%) |
| 2 Vehicles | 628 (30.1%) | 250 (21.0%) |
| 3 Vehicles | 607 (29.1%) | 234 (19.7%) |
| 4 Vehicles | 333 (16.0%) | 233 (19.6%) |
| 5 or more Vehicles | 132 (6.3%) | 42 (3.5%) |
| Total | 2,085 (100.0%) | 1,188 (100.0%) |
Commute Time in Yoakum County
The most frequently occuring commute durations in Yoakum County are 15 to 19 minutes (629 commuters, 19.8%), less than 5 minutes (566 commuters, 17.8%), and 5 to 9 minutes (522 commuters, 16.4%).
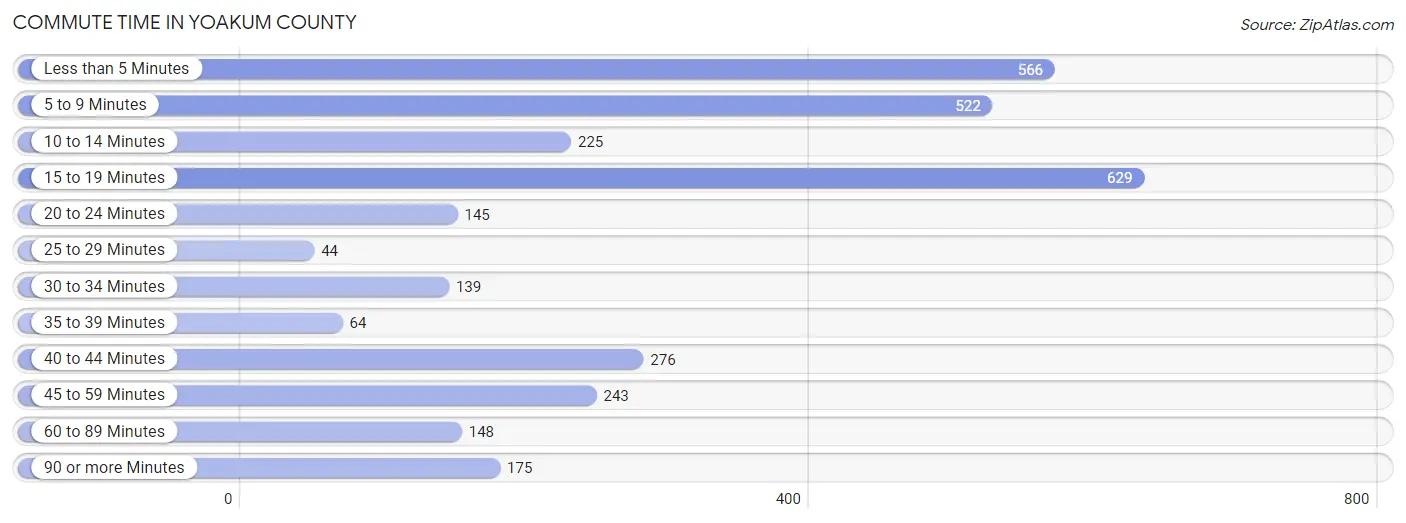
| Commute Time | # Commuters | % Commuters |
| Less than 5 Minutes | 566 | 17.8% |
| 5 to 9 Minutes | 522 | 16.4% |
| 10 to 14 Minutes | 225 | 7.1% |
| 15 to 19 Minutes | 629 | 19.8% |
| 20 to 24 Minutes | 145 | 4.6% |
| 25 to 29 Minutes | 44 | 1.4% |
| 30 to 34 Minutes | 139 | 4.4% |
| 35 to 39 Minutes | 64 | 2.0% |
| 40 to 44 Minutes | 276 | 8.7% |
| 45 to 59 Minutes | 243 | 7.6% |
| 60 to 89 Minutes | 148 | 4.7% |
| 90 or more Minutes | 175 | 5.5% |
Commute Time by Sex in Yoakum County
The most common commute times in Yoakum County are 15 to 19 minutes (397 commuters, 19.4%) for males and 5 to 9 minutes (338 commuters, 29.8%) for females.
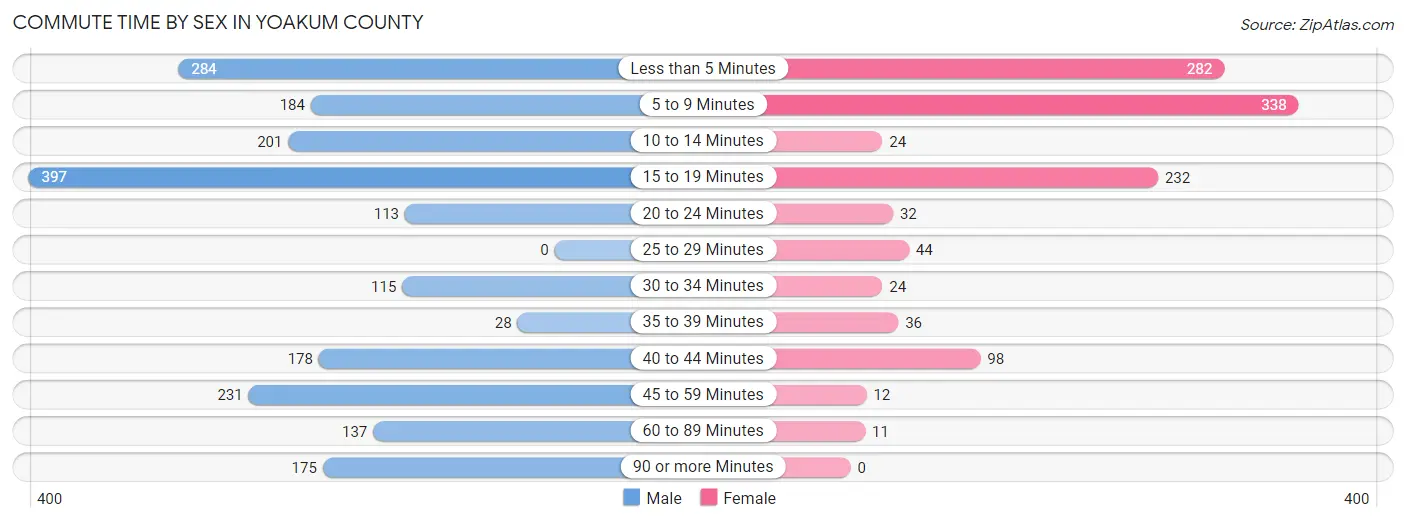
| Commute Time | Male | Female |
| Less than 5 Minutes | 284 (13.9%) | 282 (24.9%) |
| 5 to 9 Minutes | 184 (9.0%) | 338 (29.8%) |
| 10 to 14 Minutes | 201 (9.8%) | 24 (2.1%) |
| 15 to 19 Minutes | 397 (19.4%) | 232 (20.5%) |
| 20 to 24 Minutes | 113 (5.5%) | 32 (2.8%) |
| 25 to 29 Minutes | 0 (0.0%) | 44 (3.9%) |
| 30 to 34 Minutes | 115 (5.6%) | 24 (2.1%) |
| 35 to 39 Minutes | 28 (1.4%) | 36 (3.2%) |
| 40 to 44 Minutes | 178 (8.7%) | 98 (8.6%) |
| 45 to 59 Minutes | 231 (11.3%) | 12 (1.1%) |
| 60 to 89 Minutes | 137 (6.7%) | 11 (1.0%) |
| 90 or more Minutes | 175 (8.6%) | 0 (0.0%) |
Time of Departure to Work by Sex in Yoakum County
The most frequent times of departure to work in Yoakum County are 6:00 AM to 6:29 AM (352, 17.2%) for males and 7:30 AM to 7:59 AM (302, 26.7%) for females.
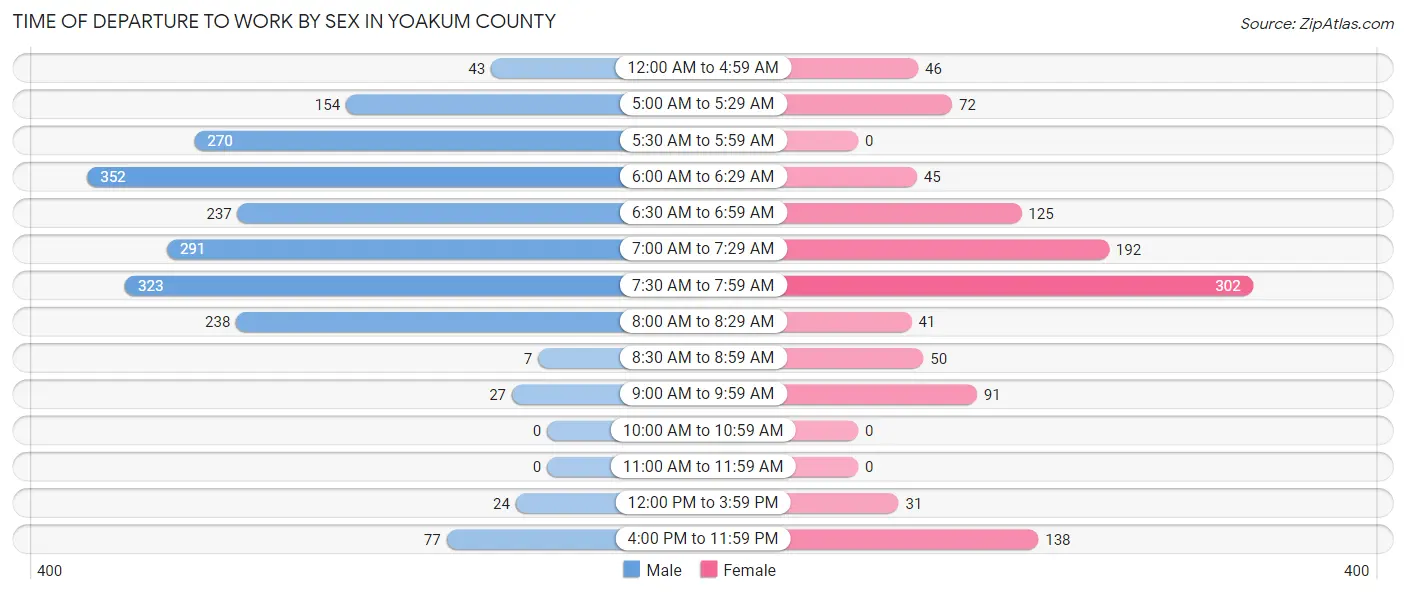
| Time of Departure | Male | Female |
| 12:00 AM to 4:59 AM | 43 (2.1%) | 46 (4.1%) |
| 5:00 AM to 5:29 AM | 154 (7.5%) | 72 (6.4%) |
| 5:30 AM to 5:59 AM | 270 (13.2%) | 0 (0.0%) |
| 6:00 AM to 6:29 AM | 352 (17.2%) | 45 (4.0%) |
| 6:30 AM to 6:59 AM | 237 (11.6%) | 125 (11.0%) |
| 7:00 AM to 7:29 AM | 291 (14.2%) | 192 (17.0%) |
| 7:30 AM to 7:59 AM | 323 (15.8%) | 302 (26.7%) |
| 8:00 AM to 8:29 AM | 238 (11.7%) | 41 (3.6%) |
| 8:30 AM to 8:59 AM | 7 (0.3%) | 50 (4.4%) |
| 9:00 AM to 9:59 AM | 27 (1.3%) | 91 (8.0%) |
| 10:00 AM to 10:59 AM | 0 (0.0%) | 0 (0.0%) |
| 11:00 AM to 11:59 AM | 0 (0.0%) | 0 (0.0%) |
| 12:00 PM to 3:59 PM | 24 (1.2%) | 31 (2.7%) |
| 4:00 PM to 11:59 PM | 77 (3.8%) | 138 (12.2%) |
| Total | 2,043 (100.0%) | 1,133 (100.0%) |
Housing Occupancy in Yoakum County
Occupancy by Ownership in Yoakum County
Of the total 2,654 dwellings in Yoakum County, owner-occupied units account for 1,758 (66.2%), while renter-occupied units make up 896 (33.8%).
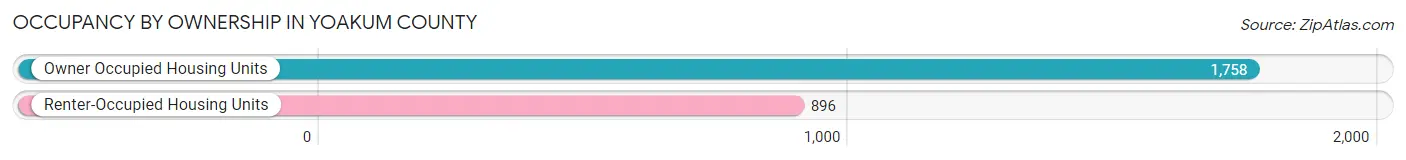
| Occupancy | # Housing Units | % Housing Units |
| Owner Occupied Housing Units | 1,758 | 66.2% |
| Renter-Occupied Housing Units | 896 | 33.8% |
| Total Occupied Housing Units | 2,654 | 100.0% |
Occupancy by Household Size in Yoakum County
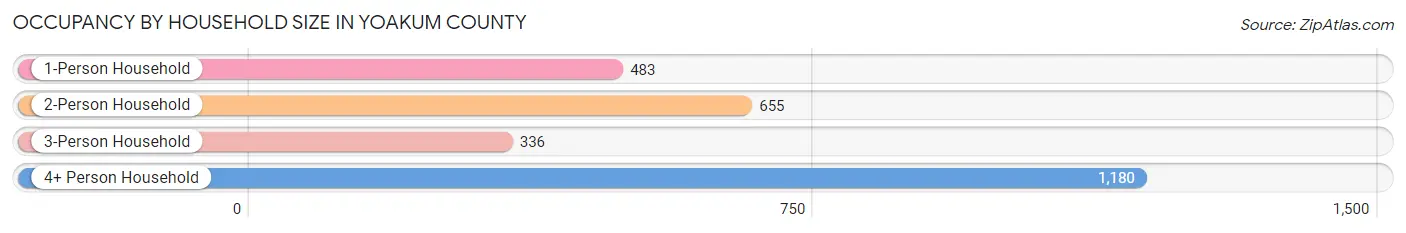
| Household Size | # Housing Units | % Housing Units |
| 1-Person Household | 483 | 18.2% |
| 2-Person Household | 655 | 24.7% |
| 3-Person Household | 336 | 12.7% |
| 4+ Person Household | 1,180 | 44.5% |
| Total Housing Units | 2,654 | 100.0% |
Occupancy by Ownership by Household Size in Yoakum County
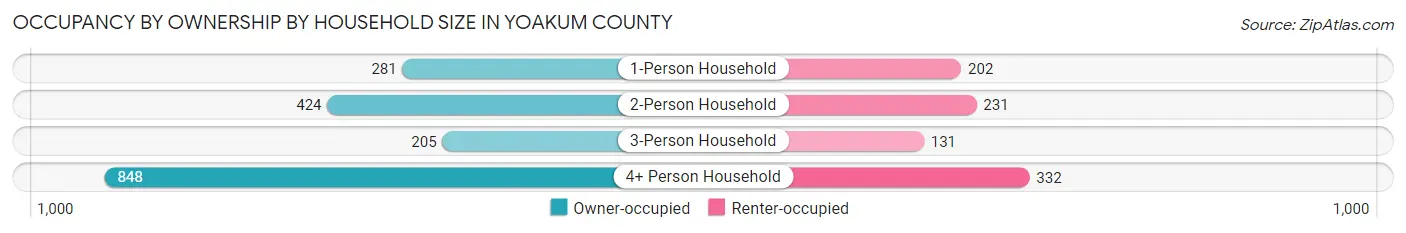
| Household Size | Owner-occupied | Renter-occupied |
| 1-Person Household | 281 (58.2%) | 202 (41.8%) |
| 2-Person Household | 424 (64.7%) | 231 (35.3%) |
| 3-Person Household | 205 (61.0%) | 131 (39.0%) |
| 4+ Person Household | 848 (71.9%) | 332 (28.1%) |
| Total Housing Units | 1,758 (66.2%) | 896 (33.8%) |
Occupancy by Educational Attainment in Yoakum County
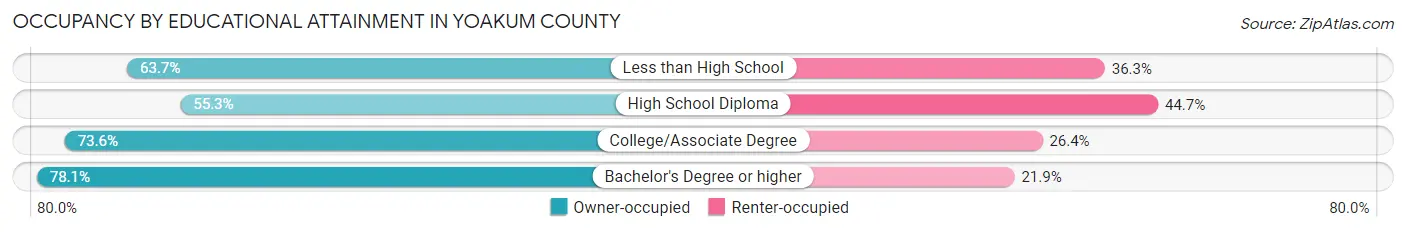
| Household Size | Owner-occupied | Renter-occupied |
| Less than High School | 450 (63.7%) | 256 (36.3%) |
| High School Diploma | 418 (55.3%) | 338 (44.7%) |
| College/Associate Degree | 673 (73.6%) | 241 (26.4%) |
| Bachelor's Degree or higher | 217 (78.1%) | 61 (21.9%) |
Occupancy by Age of Householder in Yoakum County
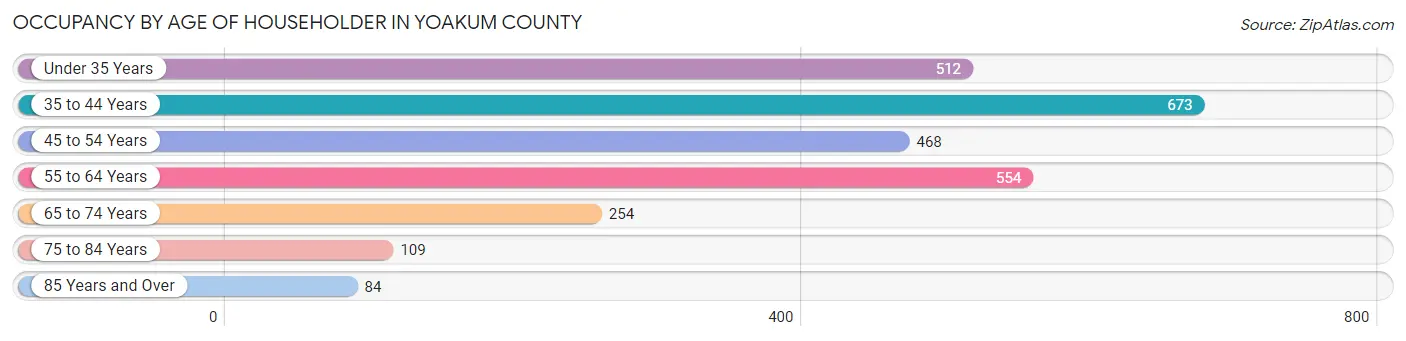
| Age Bracket | # Households | % Households |
| Under 35 Years | 512 | 19.3% |
| 35 to 44 Years | 673 | 25.4% |
| 45 to 54 Years | 468 | 17.6% |
| 55 to 64 Years | 554 | 20.9% |
| 65 to 74 Years | 254 | 9.6% |
| 75 to 84 Years | 109 | 4.1% |
| 85 Years and Over | 84 | 3.2% |
| Total | 2,654 | 100.0% |
Housing Finances in Yoakum County
Median Income by Occupancy in Yoakum County
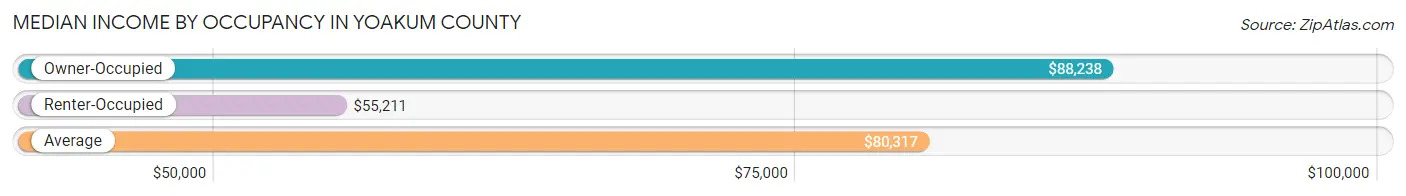
| Occupancy Type | # Households | Median Income |
| Owner-Occupied | 1,758 (66.2%) | $88,238 |
| Renter-Occupied | 896 (33.8%) | $55,211 |
| Average | 2,654 (100.0%) | $80,317 |
Occupancy by Householder Income Bracket in Yoakum County
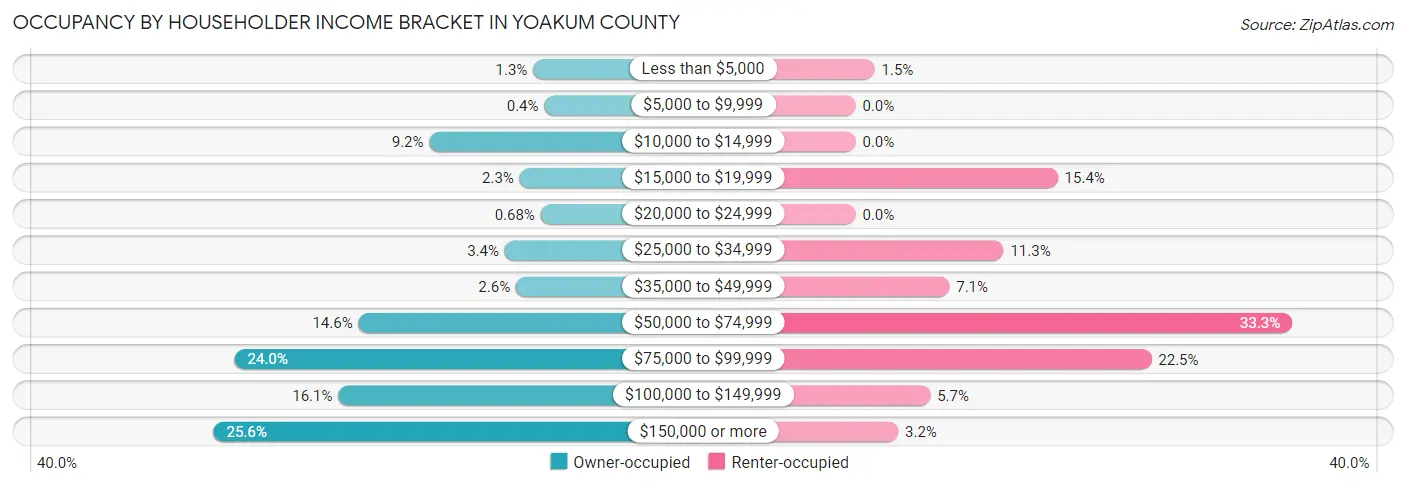
| Income Bracket | Owner-occupied | Renter-occupied |
| Less than $5,000 | 22 (1.3%) | 13 (1.5%) |
| $5,000 to $9,999 | 7 (0.4%) | 0 (0.0%) |
| $10,000 to $14,999 | 161 (9.2%) | 0 (0.0%) |
| $15,000 to $19,999 | 40 (2.3%) | 138 (15.4%) |
| $20,000 to $24,999 | 12 (0.7%) | 0 (0.0%) |
| $25,000 to $34,999 | 60 (3.4%) | 101 (11.3%) |
| $35,000 to $49,999 | 45 (2.6%) | 64 (7.1%) |
| $50,000 to $74,999 | 256 (14.6%) | 298 (33.3%) |
| $75,000 to $99,999 | 422 (24.0%) | 202 (22.5%) |
| $100,000 to $149,999 | 283 (16.1%) | 51 (5.7%) |
| $150,000 or more | 450 (25.6%) | 29 (3.2%) |
| Total | 1,758 (100.0%) | 896 (100.0%) |
Monthly Housing Cost Tiers in Yoakum County
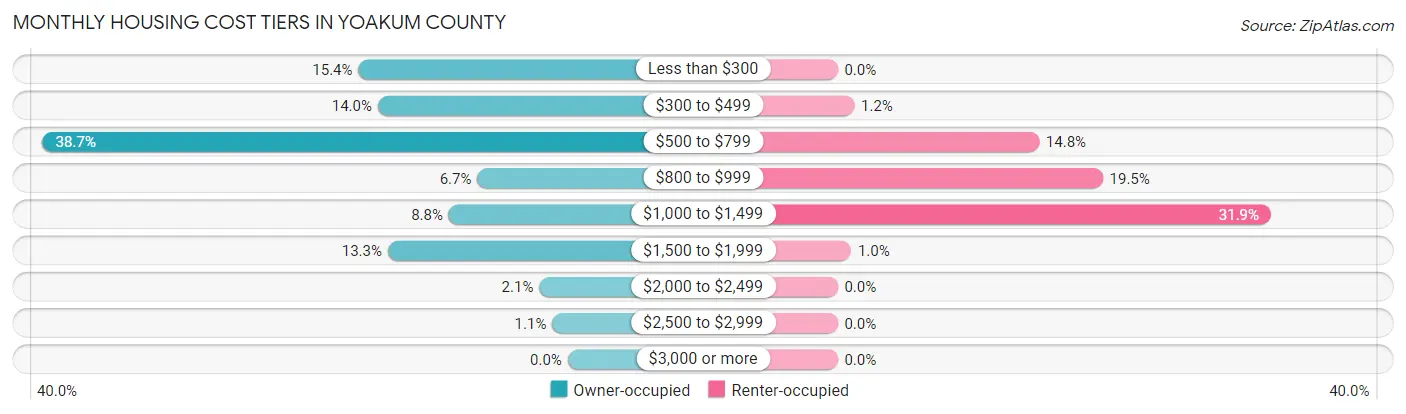
| Monthly Cost | Owner-occupied | Renter-occupied |
| Less than $300 | 271 (15.4%) | 0 (0.0%) |
| $300 to $499 | 246 (14.0%) | 11 (1.2%) |
| $500 to $799 | 680 (38.7%) | 133 (14.8%) |
| $800 to $999 | 117 (6.7%) | 175 (19.5%) |
| $1,000 to $1,499 | 154 (8.8%) | 286 (31.9%) |
| $1,500 to $1,999 | 233 (13.3%) | 9 (1.0%) |
| $2,000 to $2,499 | 37 (2.1%) | 0 (0.0%) |
| $2,500 to $2,999 | 20 (1.1%) | 0 (0.0%) |
| $3,000 or more | 0 (0.0%) | 0 (0.0%) |
| Total | 1,758 (100.0%) | 896 (100.0%) |
Physical Housing Characteristics in Yoakum County
Housing Structures in Yoakum County
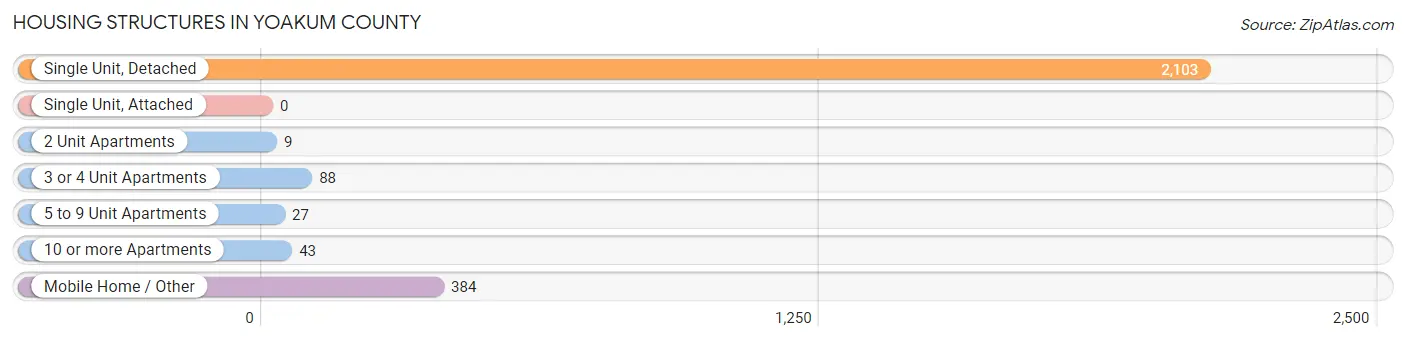
| Structure Type | # Housing Units | % Housing Units |
| Single Unit, Detached | 2,103 | 79.2% |
| Single Unit, Attached | 0 | 0.0% |
| 2 Unit Apartments | 9 | 0.3% |
| 3 or 4 Unit Apartments | 88 | 3.3% |
| 5 to 9 Unit Apartments | 27 | 1.0% |
| 10 or more Apartments | 43 | 1.6% |
| Mobile Home / Other | 384 | 14.5% |
| Total | 2,654 | 100.0% |
Housing Structures by Occupancy in Yoakum County
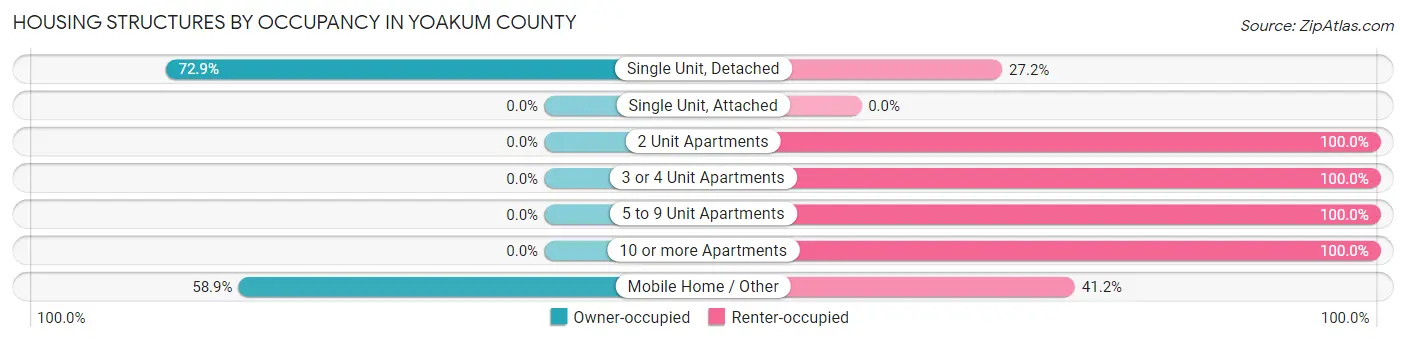
| Structure Type | Owner-occupied | Renter-occupied |
| Single Unit, Detached | 1,532 (72.9%) | 571 (27.2%) |
| Single Unit, Attached | 0 (0.0%) | 0 (0.0%) |
| 2 Unit Apartments | 0 (0.0%) | 9 (100.0%) |
| 3 or 4 Unit Apartments | 0 (0.0%) | 88 (100.0%) |
| 5 to 9 Unit Apartments | 0 (0.0%) | 27 (100.0%) |
| 10 or more Apartments | 0 (0.0%) | 43 (100.0%) |
| Mobile Home / Other | 226 (58.9%) | 158 (41.1%) |
| Total | 1,758 (66.2%) | 896 (33.8%) |
Housing Structures by Number of Rooms in Yoakum County
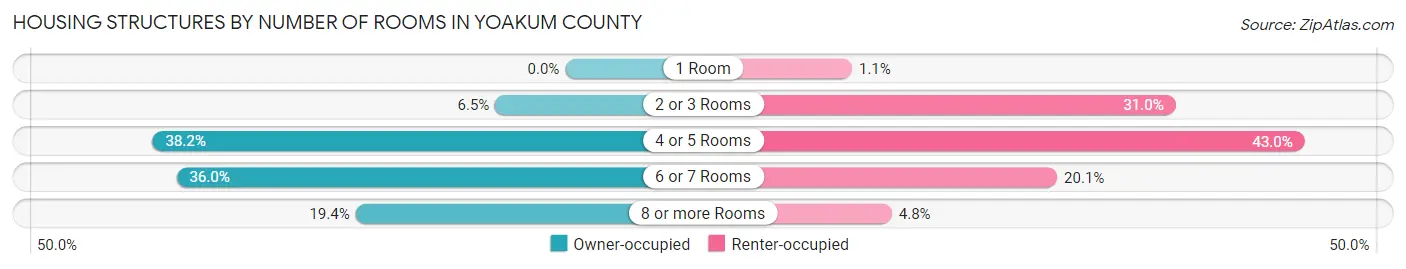
| Number of Rooms | Owner-occupied | Renter-occupied |
| 1 Room | 0 (0.0%) | 10 (1.1%) |
| 2 or 3 Rooms | 114 (6.5%) | 278 (31.0%) |
| 4 or 5 Rooms | 671 (38.2%) | 385 (43.0%) |
| 6 or 7 Rooms | 632 (35.9%) | 180 (20.1%) |
| 8 or more Rooms | 341 (19.4%) | 43 (4.8%) |
| Total | 1,758 (100.0%) | 896 (100.0%) |
Housing Structure by Heating Type in Yoakum County
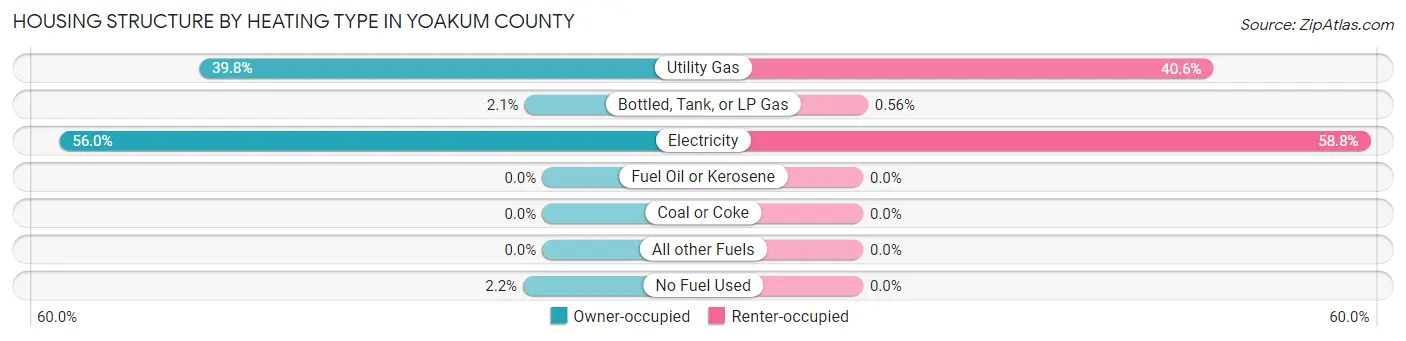
| Heating Type | Owner-occupied | Renter-occupied |
| Utility Gas | 699 (39.8%) | 364 (40.6%) |
| Bottled, Tank, or LP Gas | 36 (2.1%) | 5 (0.6%) |
| Electricity | 984 (56.0%) | 527 (58.8%) |
| Fuel Oil or Kerosene | 0 (0.0%) | 0 (0.0%) |
| Coal or Coke | 0 (0.0%) | 0 (0.0%) |
| All other Fuels | 0 (0.0%) | 0 (0.0%) |
| No Fuel Used | 39 (2.2%) | 0 (0.0%) |
| Total | 1,758 (100.0%) | 896 (100.0%) |
Household Vehicle Usage in Yoakum County
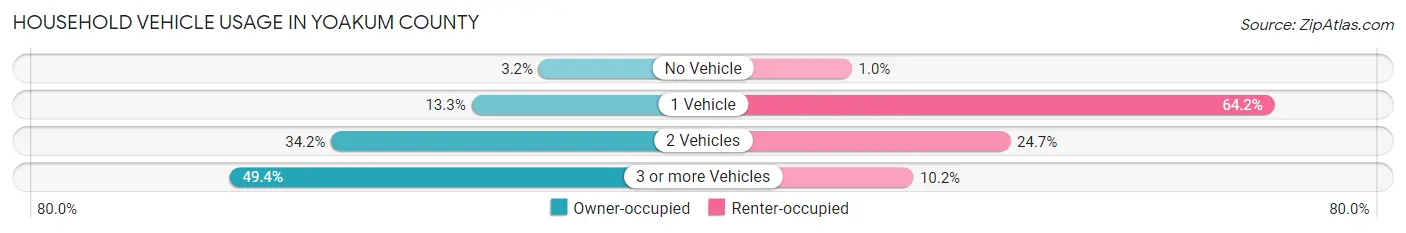
| Vehicles per Household | Owner-occupied | Renter-occupied |
| No Vehicle | 56 (3.2%) | 9 (1.0%) |
| 1 Vehicle | 233 (13.3%) | 575 (64.2%) |
| 2 Vehicles | 601 (34.2%) | 221 (24.7%) |
| 3 or more Vehicles | 868 (49.4%) | 91 (10.2%) |
| Total | 1,758 (100.0%) | 896 (100.0%) |
Real Estate & Mortgages in Yoakum County
Real Estate and Mortgage Overview in Yoakum County
| Characteristic | Without Mortgage | With Mortgage |
| Housing Units | 1,276 | 482 |
| Median Property Value | $162,200 | $181,900 |
| Median Household Income | $80,352 | $195 |
| Monthly Housing Costs | $606 | $0 |
| Real Estate Taxes | $1,721 | $15 |
Property Value by Mortgage Status in Yoakum County
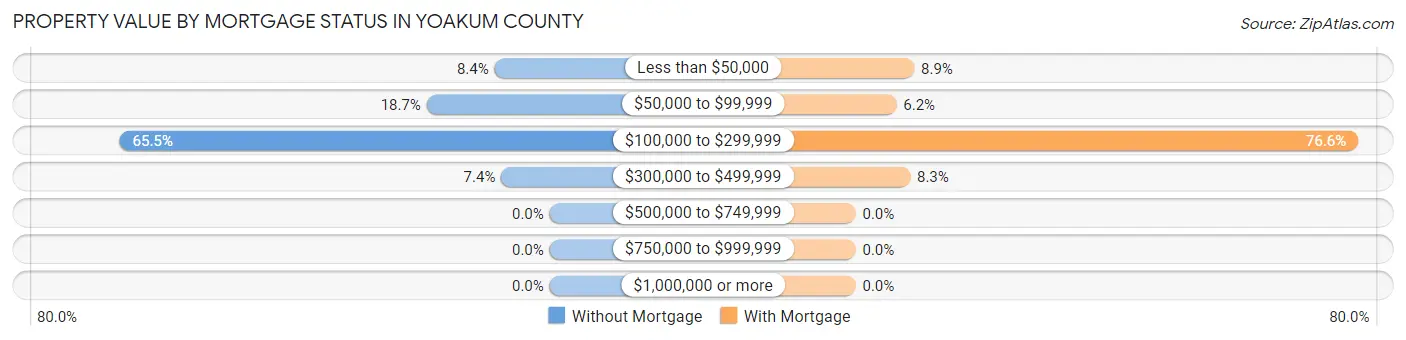
| Property Value | Without Mortgage | With Mortgage |
| Less than $50,000 | 107 (8.4%) | 43 (8.9%) |
| $50,000 to $99,999 | 239 (18.7%) | 30 (6.2%) |
| $100,000 to $299,999 | 836 (65.5%) | 369 (76.6%) |
| $300,000 to $499,999 | 94 (7.4%) | 40 (8.3%) |
| $500,000 to $749,999 | 0 (0.0%) | 0 (0.0%) |
| $750,000 to $999,999 | 0 (0.0%) | 0 (0.0%) |
| $1,000,000 or more | 0 (0.0%) | 0 (0.0%) |
| Total | 1,276 (100.0%) | 482 (100.0%) |
Household Income by Mortgage Status in Yoakum County
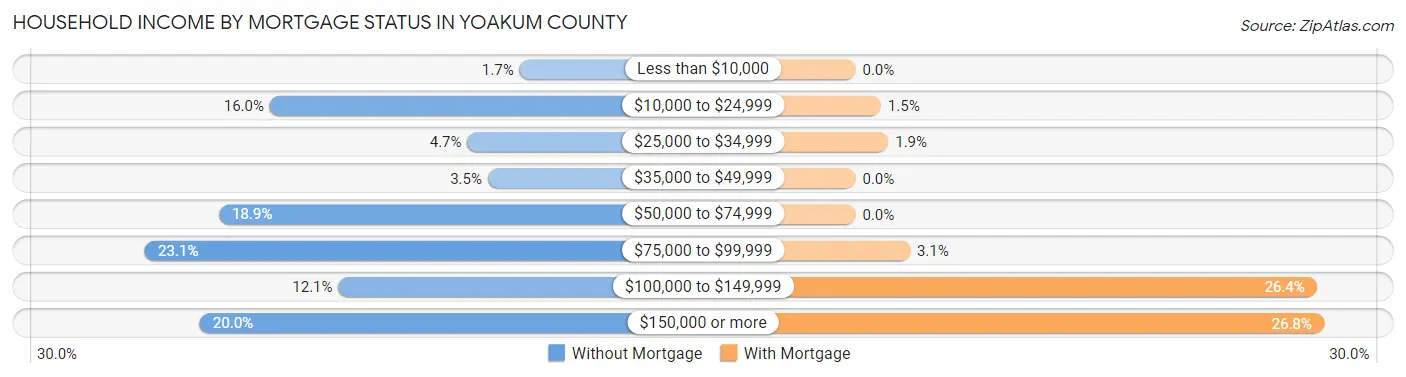
| Household Income | Without Mortgage | With Mortgage |
| Less than $10,000 | 22 (1.7%) | 0 (0.0%) |
| $10,000 to $24,999 | 204 (16.0%) | 7 (1.5%) |
| $25,000 to $34,999 | 60 (4.7%) | 9 (1.9%) |
| $35,000 to $49,999 | 45 (3.5%) | 0 (0.0%) |
| $50,000 to $74,999 | 241 (18.9%) | 0 (0.0%) |
| $75,000 to $99,999 | 295 (23.1%) | 15 (3.1%) |
| $100,000 to $149,999 | 154 (12.1%) | 127 (26.4%) |
| $150,000 or more | 255 (20.0%) | 129 (26.8%) |
| Total | 1,276 (100.0%) | 482 (100.0%) |
Property Value to Household Income Ratio in Yoakum County
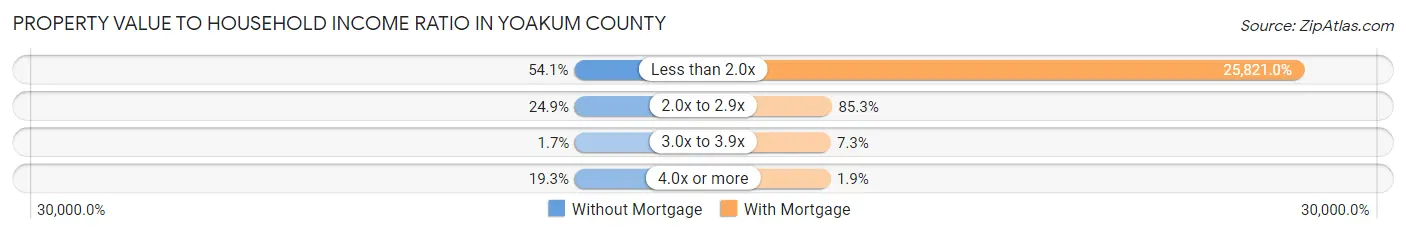
| Value-to-Income Ratio | Without Mortgage | With Mortgage |
| Less than 2.0x | 690 (54.1%) | 124,457 (25,820.9%) |
| 2.0x to 2.9x | 318 (24.9%) | 411 (85.3%) |
| 3.0x to 3.9x | 21 (1.7%) | 35 (7.3%) |
| 4.0x or more | 246 (19.3%) | 9 (1.9%) |
| Total | 1,276 (100.0%) | 482 (100.0%) |
Real Estate Taxes by Mortgage Status in Yoakum County
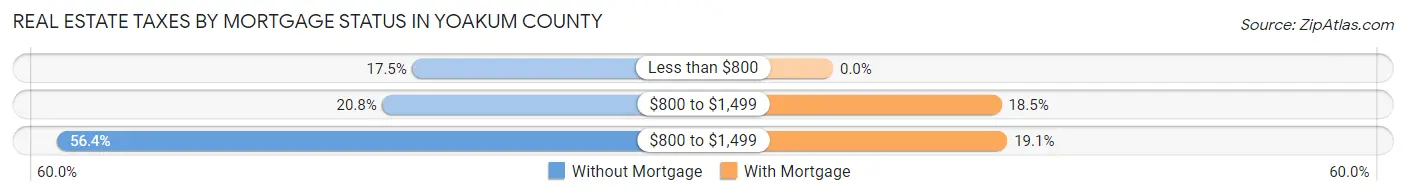
| Property Taxes | Without Mortgage | With Mortgage |
| Less than $800 | 223 (17.5%) | 0 (0.0%) |
| $800 to $1,499 | 265 (20.8%) | 89 (18.5%) |
| $800 to $1,499 | 720 (56.4%) | 92 (19.1%) |
| Total | 1,276 (100.0%) | 482 (100.0%) |
Health & Disability in Yoakum County
Health Insurance Coverage by Age in Yoakum County
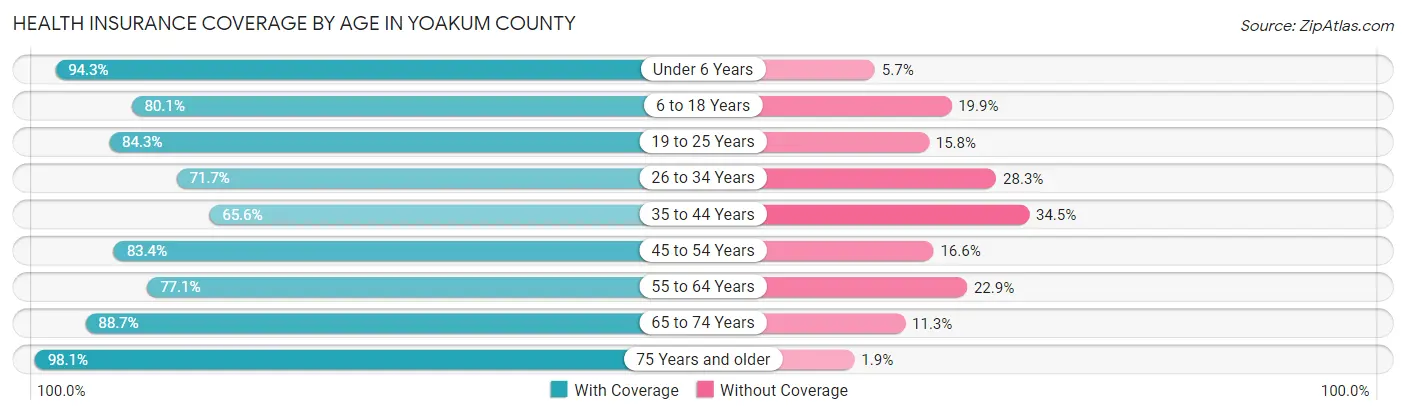
| Age Bracket | With Coverage | Without Coverage |
| Under 6 Years | 793 (94.3%) | 48 (5.7%) |
| 6 to 18 Years | 1,329 (80.1%) | 331 (19.9%) |
| 19 to 25 Years | 551 (84.3%) | 103 (15.8%) |
| 26 to 34 Years | 653 (71.7%) | 258 (28.3%) |
| 35 to 44 Years | 683 (65.5%) | 359 (34.4%) |
| 45 to 54 Years | 707 (83.4%) | 141 (16.6%) |
| 55 to 64 Years | 701 (77.1%) | 208 (22.9%) |
| 65 to 74 Years | 422 (88.7%) | 54 (11.3%) |
| 75 Years and older | 260 (98.1%) | 5 (1.9%) |
| Total | 6,099 (80.2%) | 1,507 (19.8%) |
Health Insurance Coverage by Citizenship Status in Yoakum County
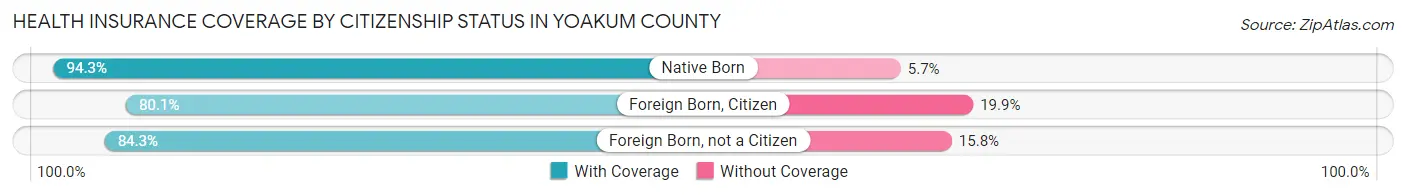
| Citizenship Status | With Coverage | Without Coverage |
| Native Born | 793 (94.3%) | 48 (5.7%) |
| Foreign Born, Citizen | 1,329 (80.1%) | 331 (19.9%) |
| Foreign Born, not a Citizen | 551 (84.3%) | 103 (15.8%) |
Health Insurance Coverage by Household Income in Yoakum County
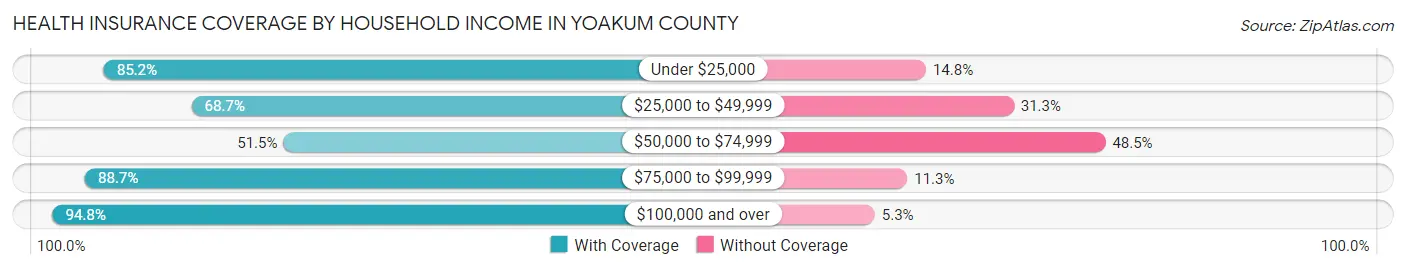
| Household Income | With Coverage | Without Coverage |
| Under $25,000 | 677 (85.2%) | 118 (14.8%) |
| $25,000 to $49,999 | 501 (68.7%) | 228 (31.3%) |
| $50,000 to $74,999 | 901 (51.5%) | 847 (48.5%) |
| $75,000 to $99,999 | 1,260 (88.7%) | 161 (11.3%) |
| $100,000 and over | 2,760 (94.8%) | 153 (5.2%) |
Public vs Private Health Insurance Coverage by Age in Yoakum County
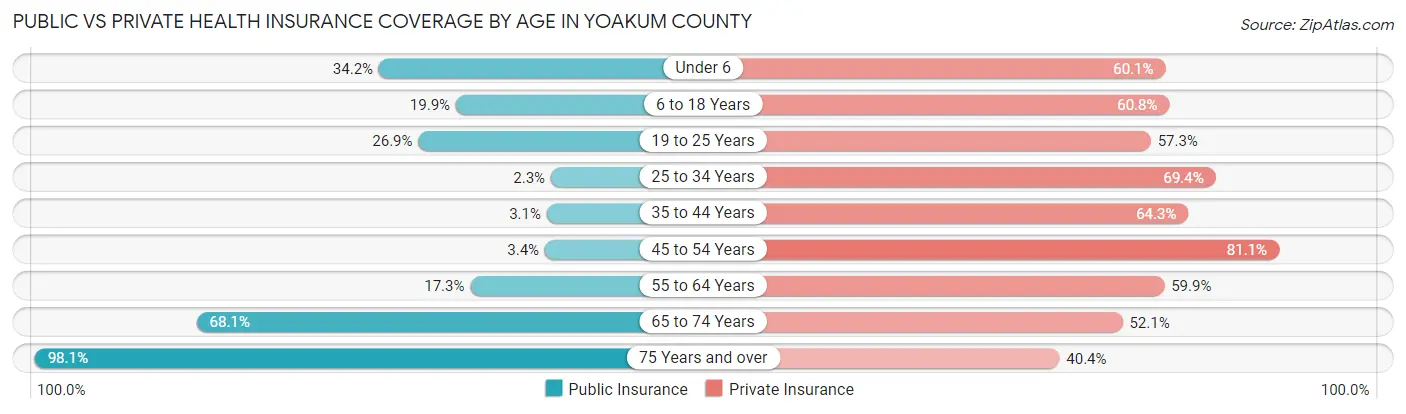
| Age Bracket | Public Insurance | Private Insurance |
| Under 6 | 288 (34.2%) | 505 (60.1%) |
| 6 to 18 Years | 331 (19.9%) | 1,009 (60.8%) |
| 19 to 25 Years | 176 (26.9%) | 375 (57.3%) |
| 25 to 34 Years | 21 (2.3%) | 632 (69.4%) |
| 35 to 44 Years | 32 (3.1%) | 670 (64.3%) |
| 45 to 54 Years | 29 (3.4%) | 688 (81.1%) |
| 55 to 64 Years | 157 (17.3%) | 544 (59.9%) |
| 65 to 74 Years | 324 (68.1%) | 248 (52.1%) |
| 75 Years and over | 260 (98.1%) | 107 (40.4%) |
| Total | 1,618 (21.3%) | 4,778 (62.8%) |
Disability Status by Sex by Age in Yoakum County
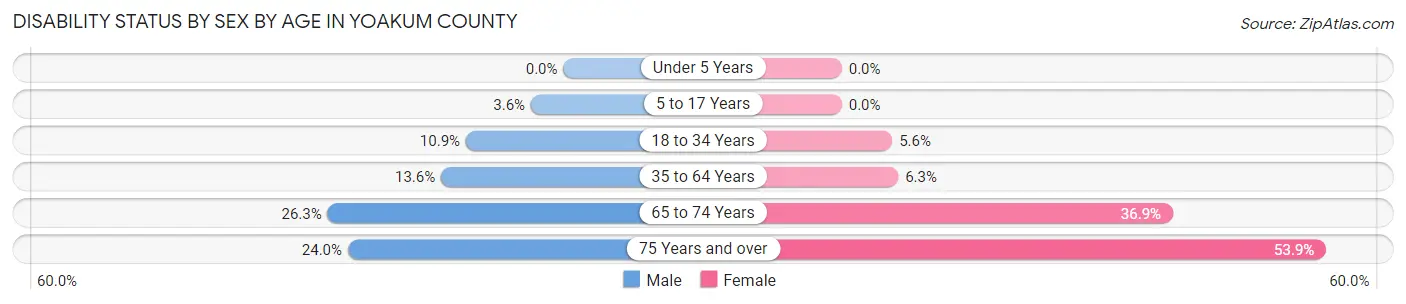
| Age Bracket | Male | Female |
| Under 5 Years | 0 (0.0%) | 0 (0.0%) |
| 5 to 17 Years | 19 (3.6%) | 0 (0.0%) |
| 18 to 34 Years | 91 (10.8%) | 43 (5.6%) |
| 35 to 64 Years | 186 (13.6%) | 90 (6.3%) |
| 65 to 74 Years | 73 (26.3%) | 73 (36.9%) |
| 75 Years and over | 24 (24.0%) | 89 (53.9%) |
Disability Class by Sex by Age in Yoakum County
Disability Class: Hearing Difficulty
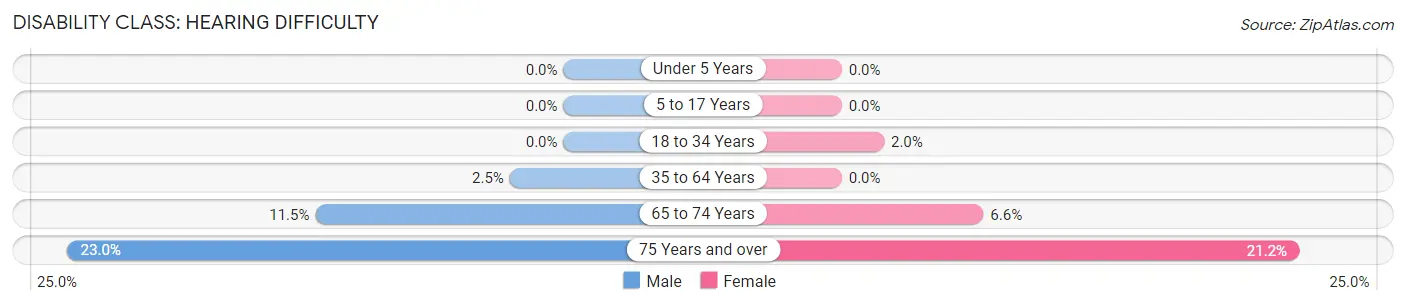
| Age Bracket | Male | Female |
| Under 5 Years | 0 (0.0%) | 0 (0.0%) |
| 5 to 17 Years | 0 (0.0%) | 0 (0.0%) |
| 18 to 34 Years | 0 (0.0%) | 15 (2.0%) |
| 35 to 64 Years | 34 (2.5%) | 0 (0.0%) |
| 65 to 74 Years | 32 (11.5%) | 13 (6.6%) |
| 75 Years and over | 23 (23.0%) | 35 (21.2%) |
Disability Class: Vision Difficulty
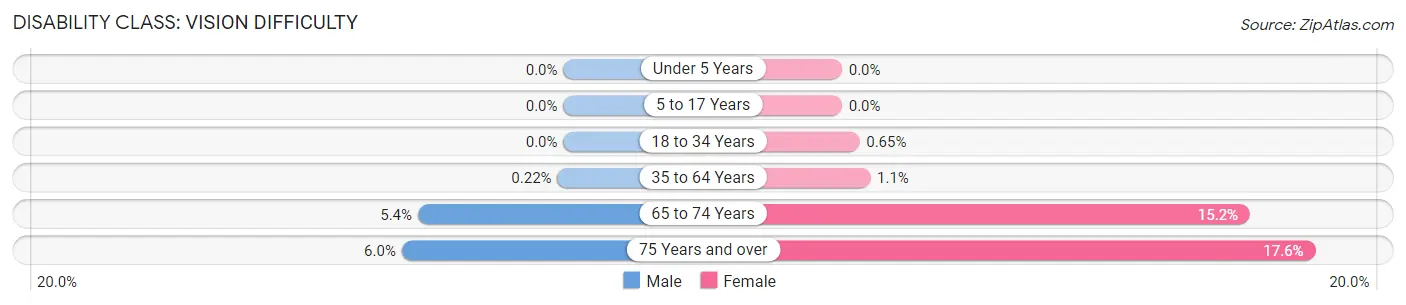
| Age Bracket | Male | Female |
| Under 5 Years | 0 (0.0%) | 0 (0.0%) |
| 5 to 17 Years | 0 (0.0%) | 0 (0.0%) |
| 18 to 34 Years | 0 (0.0%) | 5 (0.6%) |
| 35 to 64 Years | 3 (0.2%) | 15 (1.1%) |
| 65 to 74 Years | 15 (5.4%) | 30 (15.1%) |
| 75 Years and over | 6 (6.0%) | 29 (17.6%) |
Disability Class: Cognitive Difficulty
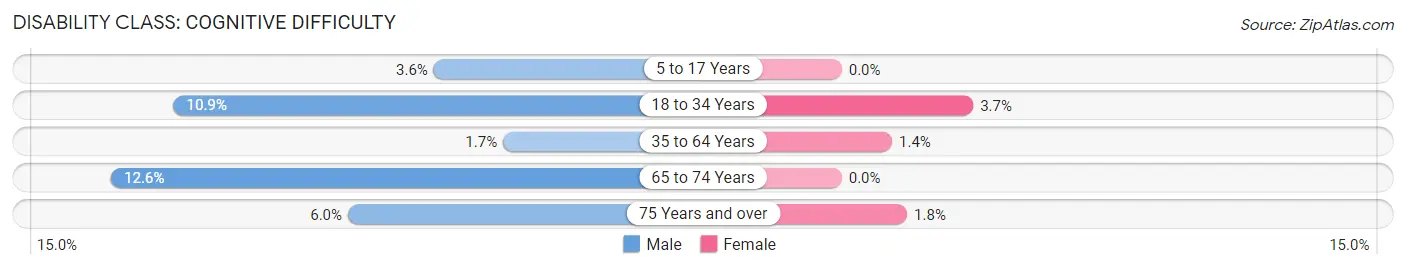
| Age Bracket | Male | Female |
| 5 to 17 Years | 19 (3.6%) | 0 (0.0%) |
| 18 to 34 Years | 91 (10.8%) | 28 (3.7%) |
| 35 to 64 Years | 23 (1.7%) | 20 (1.4%) |
| 65 to 74 Years | 35 (12.6%) | 0 (0.0%) |
| 75 Years and over | 6 (6.0%) | 3 (1.8%) |
Disability Class: Ambulatory Difficulty
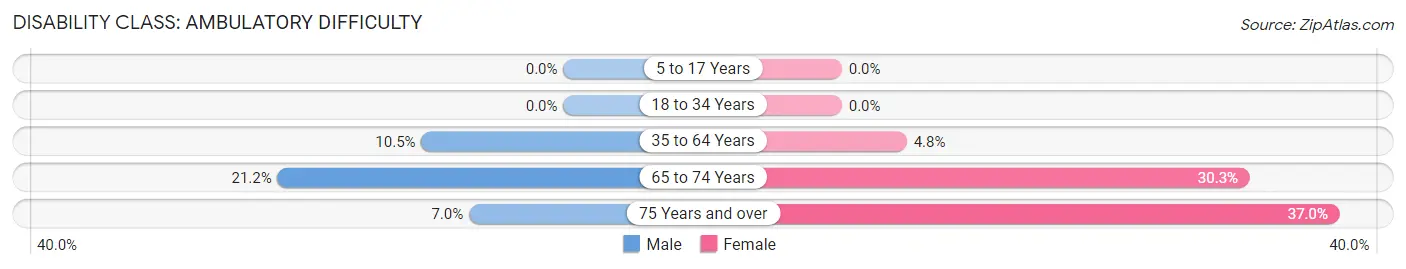
| Age Bracket | Male | Female |
| 5 to 17 Years | 0 (0.0%) | 0 (0.0%) |
| 18 to 34 Years | 0 (0.0%) | 0 (0.0%) |
| 35 to 64 Years | 144 (10.5%) | 69 (4.8%) |
| 65 to 74 Years | 59 (21.2%) | 60 (30.3%) |
| 75 Years and over | 7 (7.0%) | 61 (37.0%) |
Disability Class: Self-Care Difficulty
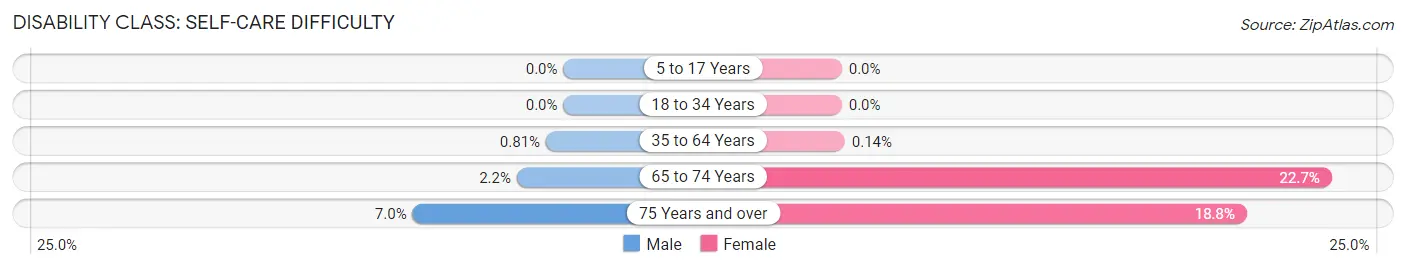
| Age Bracket | Male | Female |
| 5 to 17 Years | 0 (0.0%) | 0 (0.0%) |
| 18 to 34 Years | 0 (0.0%) | 0 (0.0%) |
| 35 to 64 Years | 11 (0.8%) | 2 (0.1%) |
| 65 to 74 Years | 6 (2.2%) | 45 (22.7%) |
| 75 Years and over | 7 (7.0%) | 31 (18.8%) |
Technology Access in Yoakum County
Computing Device Access in Yoakum County
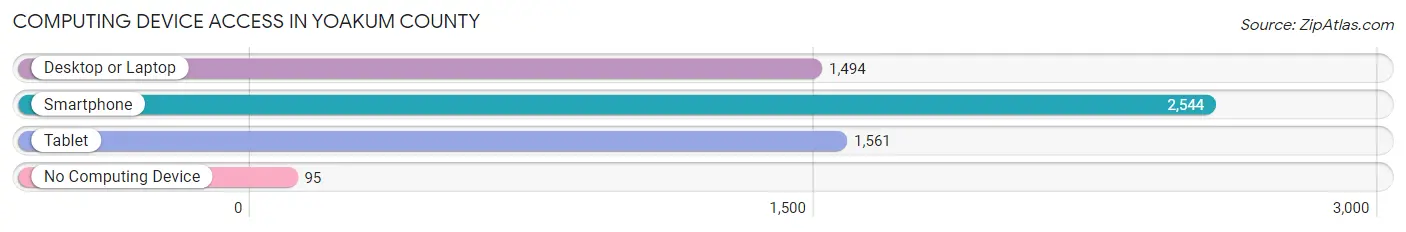
| Device Type | # Households | % Households |
| Desktop or Laptop | 1,494 | 56.3% |
| Smartphone | 2,544 | 95.9% |
| Tablet | 1,561 | 58.8% |
| No Computing Device | 95 | 3.6% |
| Total | 2,654 | 100.0% |
Internet Access in Yoakum County
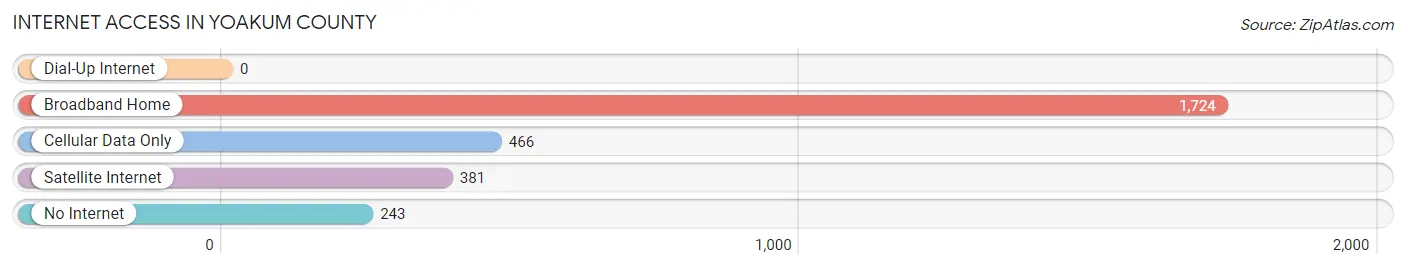
| Internet Type | # Households | % Households |
| Dial-Up Internet | 0 | 0.0% |
| Broadband Home | 1,724 | 65.0% |
| Cellular Data Only | 466 | 17.6% |
| Satellite Internet | 381 | 14.4% |
| No Internet | 243 | 9.2% |
| Total | 2,654 | 100.0% |
Yoakum County Summary
Yoakum County is located in the Texas Panhandle, in the northwestern corner of the state. It is bordered by Deaf Smith County to the north, Lamb County to the east, Terry County to the south, and Cochran County to the west. The county seat is Plains, and the largest city is Denver City. The county was named for Henderson Yoakum, a Texas historian and author.
Geography
Yoakum County covers an area of 902 square miles, making it the second-smallest county in Texas. The terrain is mostly flat, with some rolling hills in the eastern part of the county. The county is drained by the White River, which flows through the northern part of the county. The county is part of the High Plains region of Texas, and is mostly covered in grasslands and croplands.
Demographics
As of the 2010 census, the population of Yoakum County was 8,839. The population density was 10 people per square mile. The racial makeup of the county was 79.2% White, 0.7% African American, 0.7% Native American, 0.3% Asian, 16.3% from other races, and 2.8% from two or more races. Hispanic or Latino of any race were 37.2% of the population.
The median income for a household in the county was $37,945, and the median income for a family was $45,938. The per capita income for the county was $17,945. About 16.2% of families and 20.2% of the population were below the poverty line, including 28.2% of those under age 18 and 11.2% of those age 65 or over.
Economy
The economy of Yoakum County is largely based on agriculture. The county is home to a variety of crops, including cotton, corn, wheat, sorghum, and hay. Livestock production is also important to the local economy, with cattle, sheep, and goats being raised in the area.
Oil and gas production is also an important part of the local economy. The county is home to several oil and gas fields, including the Denver City Field, the Plains Field, and the White River Field.
The county is also home to several manufacturing companies, including a plastics plant, a metal fabrication plant, and a food processing plant.
History
Yoakum County was created in 1876 from portions of Bexar and Young counties. The county was named for Henderson Yoakum, a Texas historian and author.
The first settlers in the area were ranchers, who began arriving in the late 1870s. The first towns in the county were Plains and Denver City, which were both founded in 1881.
The county experienced a period of rapid growth in the early 1900s, as the discovery of oil and gas in the area led to an influx of new residents. The population of the county peaked in the 1940s, when it reached nearly 20,000.
Since then, the population has declined steadily, as many residents have moved away in search of better economic opportunities. Today, the county is home to just over 8,000 people.
Common Questions
What is Per Capita Income in Yoakum County?
Per Capita income in Yoakum County is $34,168.
What is the Median Family Income in Yoakum County?
Median Family Income in Yoakum County is $86,369.
What is the Median Household income in Yoakum County?
Median Household Income in Yoakum County is $80,317.
What is Income or Wage Gap in Yoakum County?
Income or Wage Gap in Yoakum County is 59.2%.
Women in Yoakum County earn 40.8 cents for every dollar earned by a man.
What is Family Income Deficit in Yoakum County?
Family Income Deficit in Yoakum County is $9,728.
Families that are below poverty line in Yoakum County earn $9,728 less on average than the poverty threshold level.
What is Inequality or Gini Index in Yoakum County?
Inequality or Gini Index in Yoakum County is 0.42.
What is the Total Population of Yoakum County?
Total Population of Yoakum County is 7,630.
What is the Total Male Population of Yoakum County?
Total Male Population of Yoakum County is 3,576.
What is the Total Female Population of Yoakum County?
Total Female Population of Yoakum County is 4,054.
What is the Ratio of Males per 100 Females in Yoakum County?
There are 88.21 Males per 100 Females in Yoakum County.
What is the Ratio of Females per 100 Males in Yoakum County?
There are 113.37 Females per 100 Males in Yoakum County.
What is the Median Population Age in Yoakum County?
Median Population Age in Yoakum County is 30.0 Years.
What is the Average Family Size in Yoakum County
Average Family Size in Yoakum County is 3.3 People.
What is the Average Household Size in Yoakum County
Average Household Size in Yoakum County is 2.9 People.
How Large is the Labor Force in Yoakum County?
There are 3,423 People in the Labor Forcein in Yoakum County.
What is the Percentage of People in the Labor Force in Yoakum County?
64.1% of People are in the Labor Force in Yoakum County.
What is the Unemployment Rate in Yoakum County?
Unemployment Rate in Yoakum County is 3.9%.