Winkler County, TX Map & Demographics
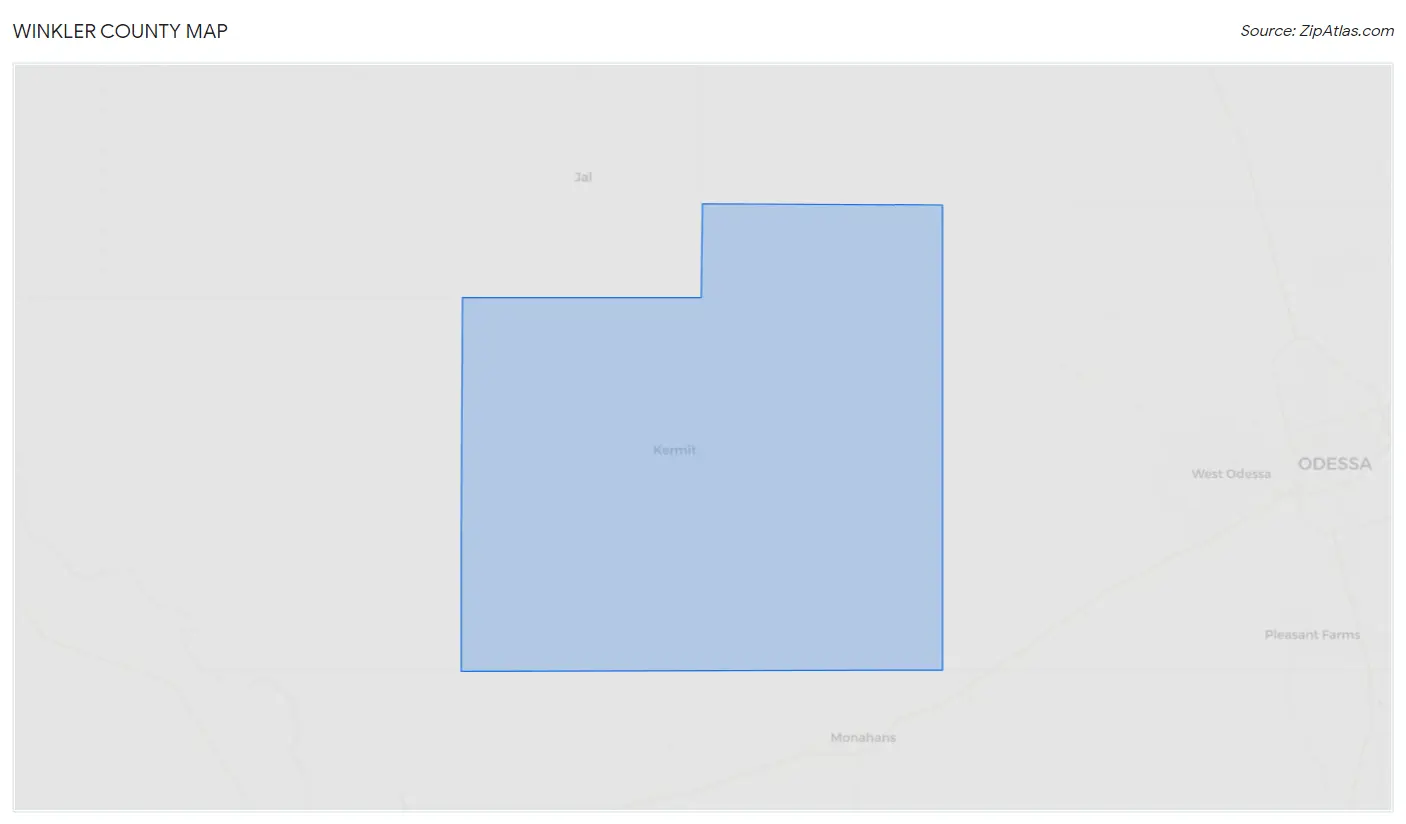
Winkler County Map
Winkler County Overview
$32,325
PER CAPITA INCOME
$88,581
AVG FAMILY INCOME
$89,155
AVG HOUSEHOLD INCOME
31.2%
WAGE / INCOME GAP [ % ]
68.8¢/ $1
WAGE / INCOME GAP [ $ ]
$11,669
FAMILY INCOME DEFICIT
0.34
INEQUALITY / GINI INDEX
7,582
TOTAL POPULATION
3,925
MALE POPULATION
3,657
FEMALE POPULATION
107.33
MALES / 100 FEMALES
93.17
FEMALES / 100 MALES
36.2
MEDIAN AGE
3.2
AVG FAMILY SIZE
2.8
AVG HOUSEHOLD SIZE
3,460
LABOR FORCE [ PEOPLE ]
60.9%
PERCENT IN LABOR FORCE
2.3%
UNEMPLOYMENT RATE
Winkler County Area Codes
Income in Winkler County
Income Overview in Winkler County
Per Capita Income in Winkler County is $32,325, while median incomes of families and households are $88,581 and $89,155 respectively.
| Characteristic | Number | Measure |
| Per Capita Income | 7,582 | $32,325 |
| Median Family Income | 2,052 | $88,581 |
| Mean Family Income | 2,052 | $94,419 |
| Median Household Income | 2,685 | $89,155 |
| Mean Household Income | 2,685 | $91,621 |
| Income Deficit | 2,052 | $11,669 |
| Wage / Income Gap (%) | 7,582 | 31.24% |
| Wage / Income Gap ($) | 7,582 | 68.76¢ per $1 |
| Gini / Inequality Index | 7,582 | 0.34 |
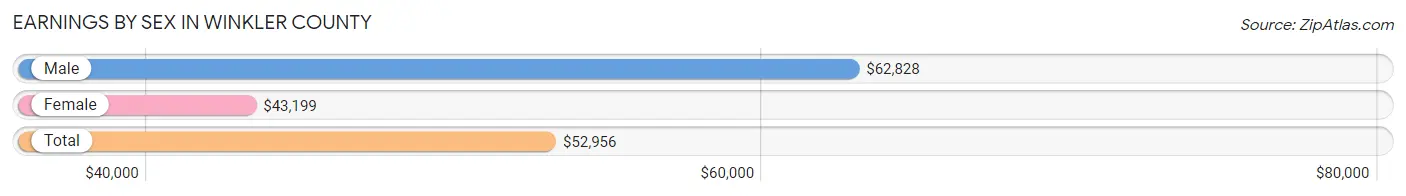
Earnings by Sex in Winkler County
Average Earnings in Winkler County are $52,956, $62,828 for men and $43,199 for women, a difference of 31.2%.
| Sex | Number | Average Earnings |
| Male | 2,389 (65.9%) | $62,828 |
| Female | 1,236 (34.1%) | $43,199 |
| Total | 3,625 (100.0%) | $52,956 |
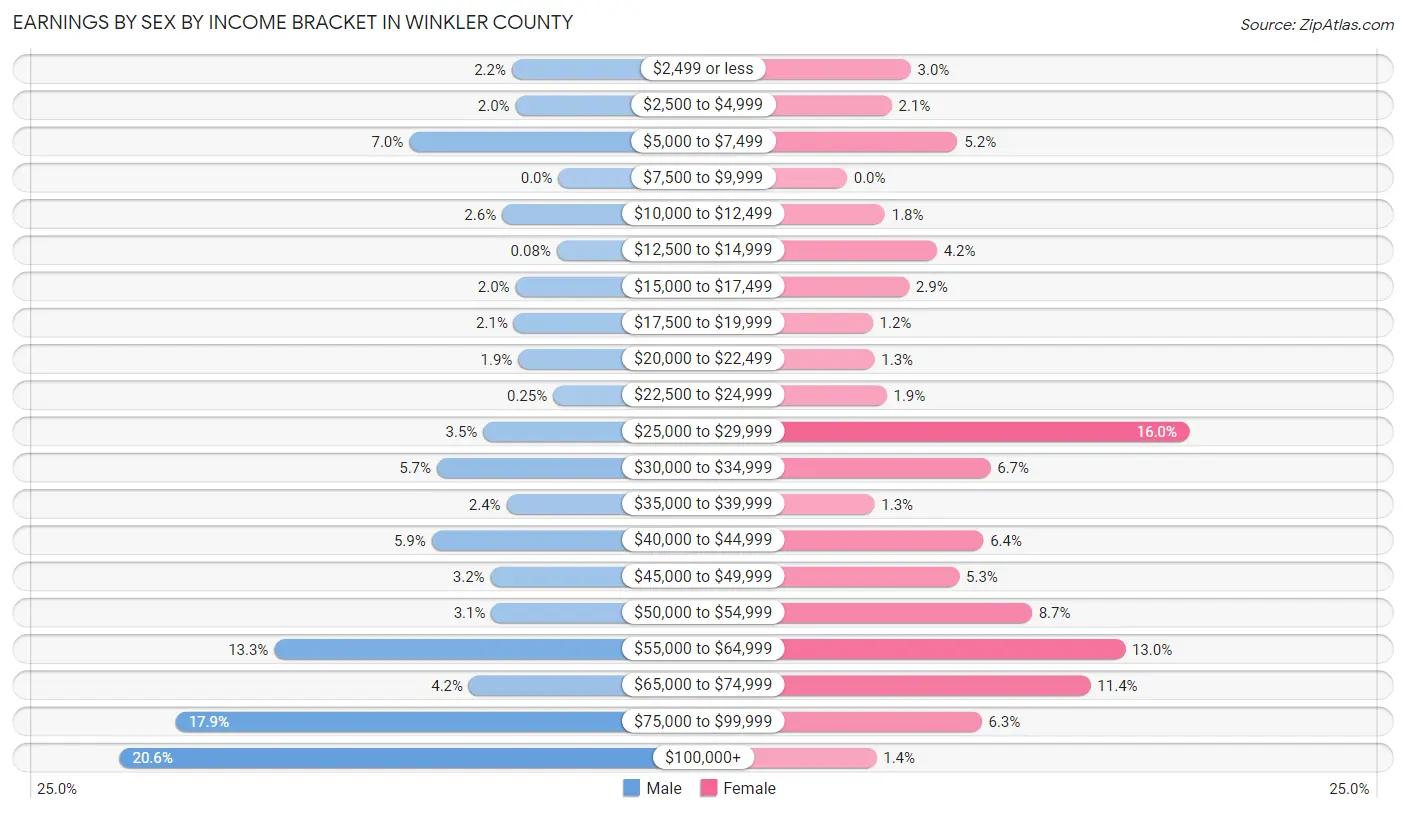
Earnings by Sex by Income Bracket in Winkler County
The most common earnings brackets in Winkler County are $100,000+ for men (491 | 20.5%) and $25,000 to $29,999 for women (198 | 16.0%).
| Income | Male | Female |
| $2,499 or less | 52 (2.2%) | 37 (3.0%) |
| $2,500 to $4,999 | 48 (2.0%) | 26 (2.1%) |
| $5,000 to $7,499 | 167 (7.0%) | 64 (5.2%) |
| $7,500 to $9,999 | 0 (0.0%) | 0 (0.0%) |
| $10,000 to $12,499 | 63 (2.6%) | 22 (1.8%) |
| $12,500 to $14,999 | 2 (0.1%) | 52 (4.2%) |
| $15,000 to $17,499 | 48 (2.0%) | 36 (2.9%) |
| $17,500 to $19,999 | 50 (2.1%) | 15 (1.2%) |
| $20,000 to $22,499 | 45 (1.9%) | 16 (1.3%) |
| $22,500 to $24,999 | 6 (0.3%) | 23 (1.9%) |
| $25,000 to $29,999 | 84 (3.5%) | 198 (16.0%) |
| $30,000 to $34,999 | 136 (5.7%) | 83 (6.7%) |
| $35,000 to $39,999 | 58 (2.4%) | 16 (1.3%) |
| $40,000 to $44,999 | 142 (5.9%) | 79 (6.4%) |
| $45,000 to $49,999 | 76 (3.2%) | 65 (5.3%) |
| $50,000 to $54,999 | 75 (3.1%) | 107 (8.7%) |
| $55,000 to $64,999 | 318 (13.3%) | 161 (13.0%) |
| $65,000 to $74,999 | 100 (4.2%) | 141 (11.4%) |
| $75,000 to $99,999 | 428 (17.9%) | 78 (6.3%) |
| $100,000+ | 491 (20.5%) | 17 (1.4%) |
| Total | 2,389 (100.0%) | 1,236 (100.0%) |
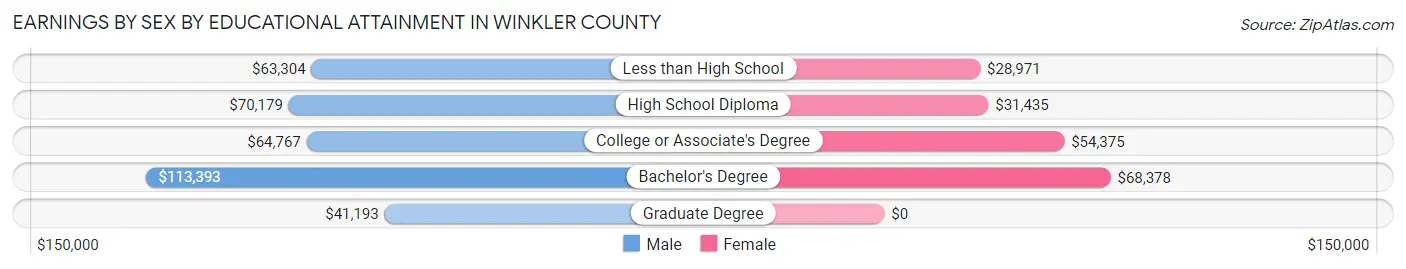
Earnings by Sex by Educational Attainment in Winkler County
Average earnings in Winkler County are $64,585 for men and $44,026 for women, a difference of 31.8%. Men with an educational attainment of bachelor's degree enjoy the highest average annual earnings of $113,393, while those with graduate degree education earn the least with $41,193. Women with an educational attainment of bachelor's degree earn the most with the average annual earnings of $68,378, while those with less than high school education have the smallest earnings of $28,971.
| Educational Attainment | Male Income | Female Income |
| Less than High School | $63,304 | $28,971 |
| High School Diploma | $70,179 | $31,435 |
| College or Associate's Degree | $64,767 | $54,375 |
| Bachelor's Degree | $113,393 | $68,378 |
| Graduate Degree | $41,193 | $0 |
| Total | $64,585 | $44,026 |
Family Income in Winkler County
Family Income Brackets in Winkler County
According to the Winkler County family income data, there are 595 families falling into the $100,000 to $149,999 income range, which is the most common income bracket and makes up 29.0% of all families. Conversely, the $10,000 to $14,999 income bracket is the least frequent group with only 12 families (0.6%) belonging to this category.
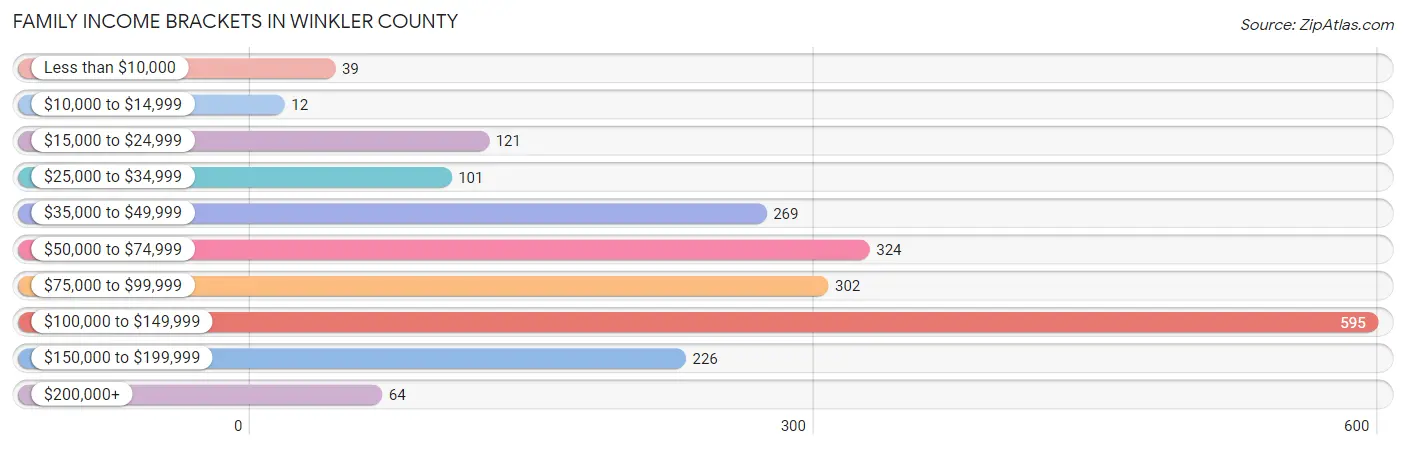
| Income Bracket | # Families | % Families |
| Less than $10,000 | 39 | 1.9% |
| $10,000 to $14,999 | 12 | 0.6% |
| $15,000 to $24,999 | 121 | 5.9% |
| $25,000 to $34,999 | 101 | 4.9% |
| $35,000 to $49,999 | 269 | 13.1% |
| $50,000 to $74,999 | 324 | 15.8% |
| $75,000 to $99,999 | 302 | 14.7% |
| $100,000 to $149,999 | 595 | 29.0% |
| $150,000 to $199,999 | 226 | 11.0% |
| $200,000+ | 64 | 3.1% |
Family Income by Famaliy Size in Winkler County
5-person families (219 | 10.7%) account for the highest median family income in Winkler County with $127,902 per family, while 2-person families (849 | 41.4%) have the highest median income of $34,942 per family member.
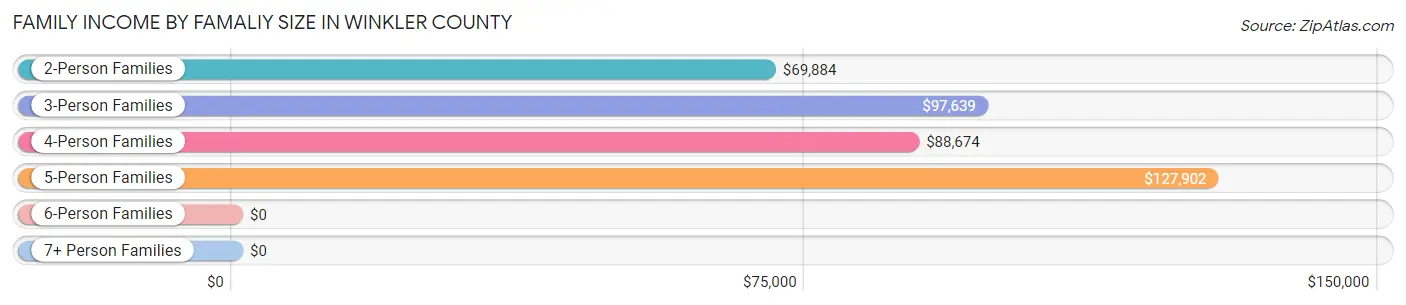
| Income Bracket | # Families | Median Income |
| 2-Person Families | 849 (41.4%) | $69,884 |
| 3-Person Families | 383 (18.7%) | $97,639 |
| 4-Person Families | 433 (21.1%) | $88,674 |
| 5-Person Families | 219 (10.7%) | $127,902 |
| 6-Person Families | 67 (3.3%) | $0 |
| 7+ Person Families | 101 (4.9%) | $0 |
| Total | 2,052 (100.0%) | $88,581 |
Family Income by Number of Earners in Winkler County
The median family income in Winkler County is $88,581, with families comprising 3+ earners (254) having the highest median family income of $112,250, while families with no earners (258) have the lowest median family income of $32,692, accounting for 12.4% and 12.6% of families, respectively.
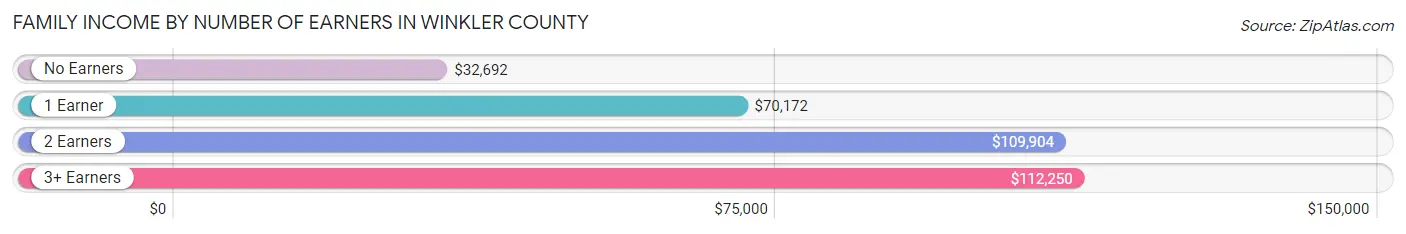
| Number of Earners | # Families | Median Income |
| No Earners | 258 (12.6%) | $32,692 |
| 1 Earner | 711 (34.6%) | $70,172 |
| 2 Earners | 829 (40.4%) | $109,904 |
| 3+ Earners | 254 (12.4%) | $112,250 |
| Total | 2,052 (100.0%) | $88,581 |
Household Income in Winkler County
Household Income Brackets in Winkler County
With 870 households falling in the category, the $100,000 to $149,999 income range is the most frequent in Winkler County, accounting for 32.4% of all households. In contrast, only 24 households (0.9%) fall into the less than $10,000 income bracket, making it the least populous group.
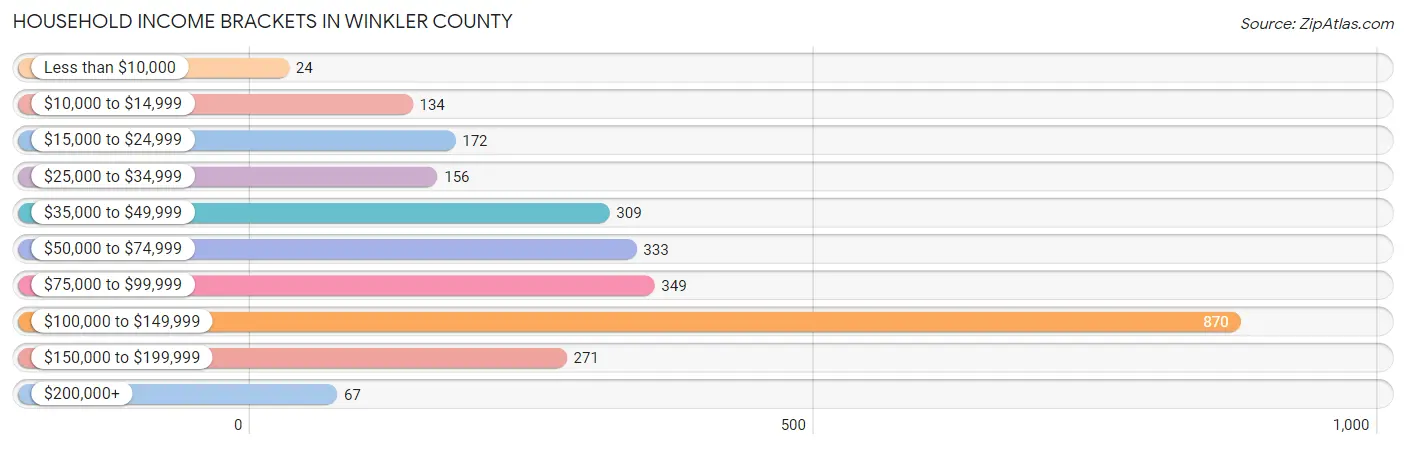
| Income Bracket | # Households | % Households |
| Less than $10,000 | 24 | 0.9% |
| $10,000 to $14,999 | 134 | 5.0% |
| $15,000 to $24,999 | 172 | 6.4% |
| $25,000 to $34,999 | 156 | 5.8% |
| $35,000 to $49,999 | 309 | 11.5% |
| $50,000 to $74,999 | 333 | 12.4% |
| $75,000 to $99,999 | 349 | 13.0% |
| $100,000 to $149,999 | 870 | 32.4% |
| $150,000 to $199,999 | 271 | 10.1% |
| $200,000+ | 67 | 2.5% |
Household Income by Householder Age in Winkler County
The median household income in Winkler County is $89,155, with the highest median household income of $109,825 found in the 25 to 44 years age bracket for the primary householder. A total of 946 households (35.2%) fall into this category. Meanwhile, the 15 to 24 years age bracket for the primary householder has the lowest median household income of $0, with 95 households (3.5%) in this group.
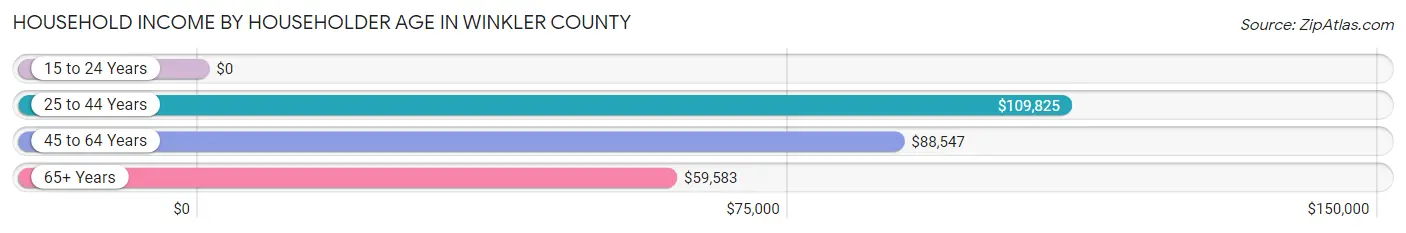
| Income Bracket | # Households | Median Income |
| 15 to 24 Years | 95 (3.5%) | $0 |
| 25 to 44 Years | 946 (35.2%) | $109,825 |
| 45 to 64 Years | 999 (37.2%) | $88,547 |
| 65+ Years | 645 (24.0%) | $59,583 |
| Total | 2,685 (100.0%) | $89,155 |
Poverty in Winkler County
Income Below Poverty by Sex and Age in Winkler County
With 11.2% poverty level for males and 14.1% for females among the residents of Winkler County, 15 year old males and 12 to 14 year old females are the most vulnerable to poverty, with 57 males (73.1%) and 70 females (46.7%) in their respective age groups living below the poverty level.
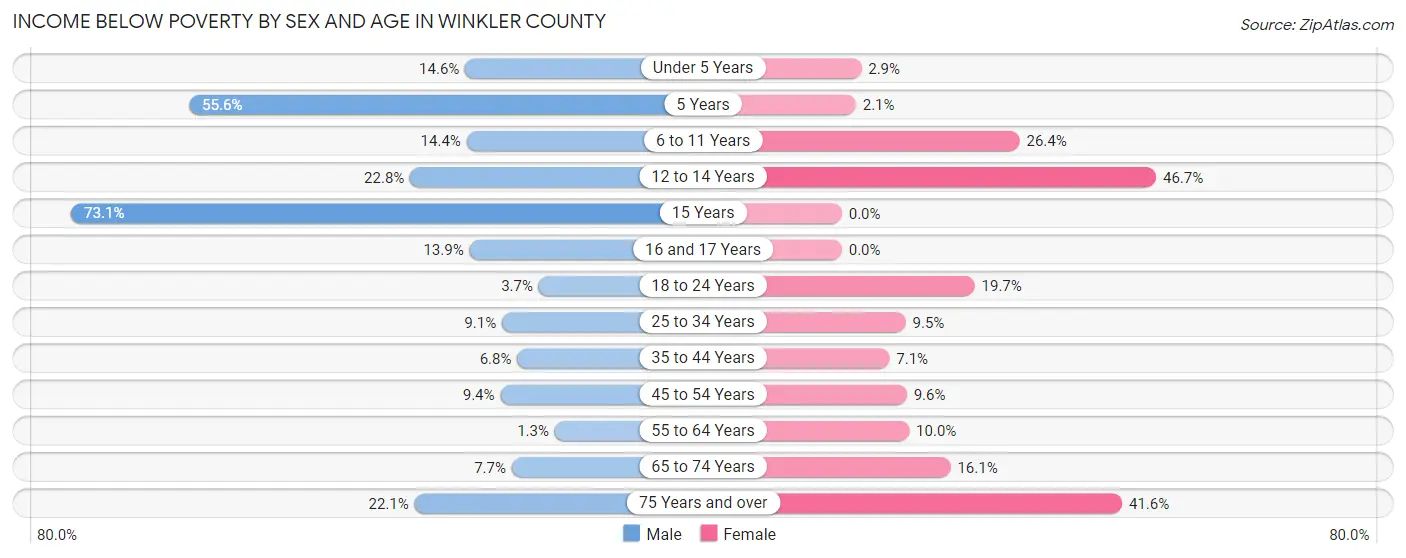
| Age Bracket | Male | Female |
| Under 5 Years | 35 (14.6%) | 8 (2.9%) |
| 5 Years | 35 (55.6%) | 3 (2.1%) |
| 6 to 11 Years | 55 (14.4%) | 85 (26.4%) |
| 12 to 14 Years | 38 (22.8%) | 70 (46.7%) |
| 15 Years | 57 (73.1%) | 0 (0.0%) |
| 16 and 17 Years | 29 (13.9%) | 0 (0.0%) |
| 18 to 24 Years | 13 (3.6%) | 71 (19.7%) |
| 25 to 34 Years | 40 (9.1%) | 29 (9.5%) |
| 35 to 44 Years | 42 (6.8%) | 38 (7.1%) |
| 45 to 54 Years | 33 (9.3%) | 43 (9.6%) |
| 55 to 64 Years | 6 (1.3%) | 40 (10.0%) |
| 65 to 74 Years | 29 (7.6%) | 67 (16.1%) |
| 75 Years and over | 19 (22.1%) | 62 (41.6%) |
| Total | 431 (11.2%) | 516 (14.1%) |
Income Above Poverty by Sex and Age in Winkler County
According to the poverty statistics in Winkler County, males aged 55 to 64 years and females aged 15 years are the age groups that are most secure financially, with 98.7% of males and 100.0% of females in these age groups living above the poverty line.
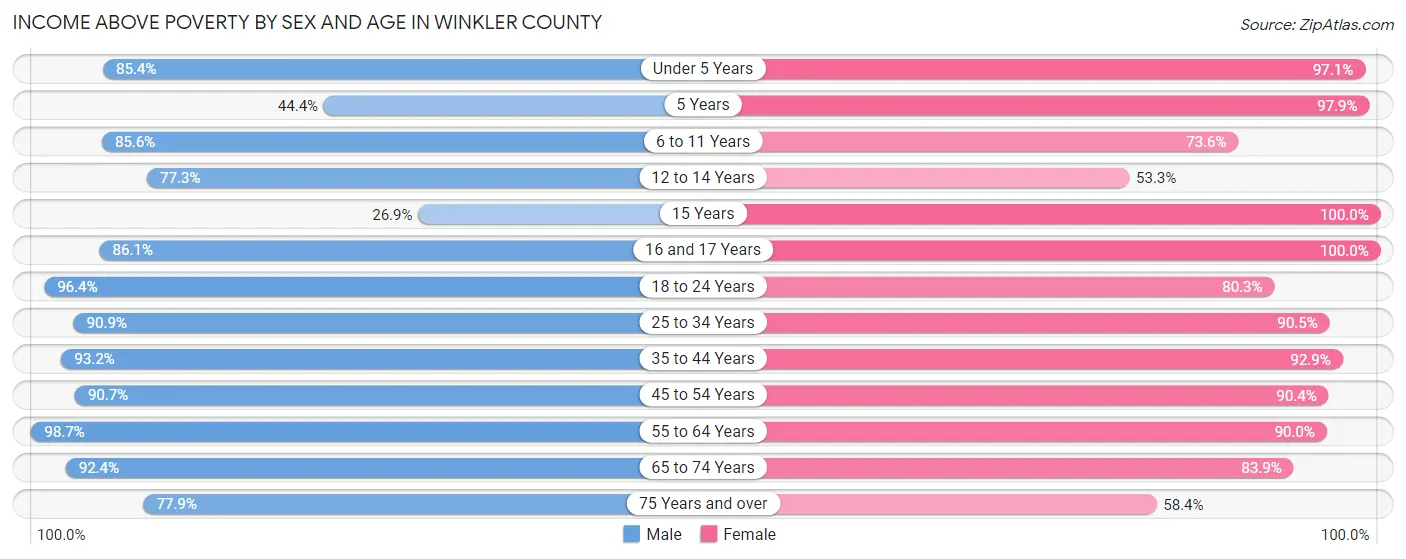
| Age Bracket | Male | Female |
| Under 5 Years | 205 (85.4%) | 269 (97.1%) |
| 5 Years | 28 (44.4%) | 141 (97.9%) |
| 6 to 11 Years | 328 (85.6%) | 237 (73.6%) |
| 12 to 14 Years | 129 (77.2%) | 80 (53.3%) |
| 15 Years | 21 (26.9%) | 76 (100.0%) |
| 16 and 17 Years | 179 (86.1%) | 74 (100.0%) |
| 18 to 24 Years | 343 (96.4%) | 289 (80.3%) |
| 25 to 34 Years | 399 (90.9%) | 277 (90.5%) |
| 35 to 44 Years | 572 (93.2%) | 500 (92.9%) |
| 45 to 54 Years | 320 (90.6%) | 403 (90.4%) |
| 55 to 64 Years | 467 (98.7%) | 360 (90.0%) |
| 65 to 74 Years | 350 (92.3%) | 348 (83.9%) |
| 75 Years and over | 67 (77.9%) | 87 (58.4%) |
| Total | 3,408 (88.8%) | 3,141 (85.9%) |
Income Below Poverty Among Married-Couple Families in Winkler County
The poverty statistics for married-couple families in Winkler County show that 5.5% or 86 of the total 1,563 families live below the poverty line. Families with 3 or 4 children have the highest poverty rate of 27.1%, comprising of 26 families. On the other hand, families with no children have the lowest poverty rate of 2.1%, which includes 17 families.
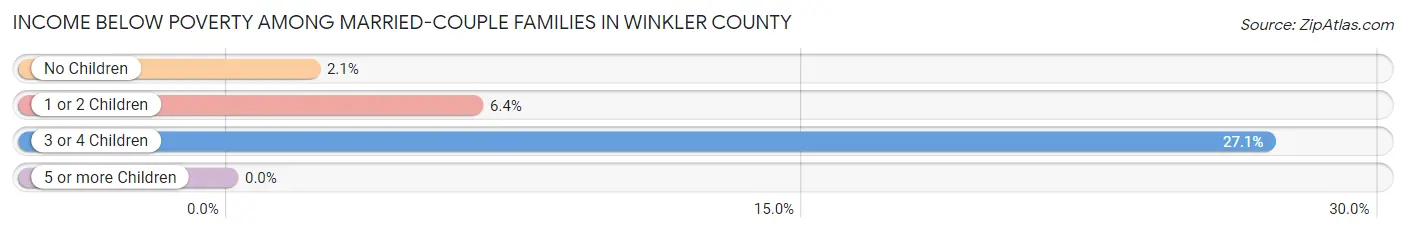
| Children | Above Poverty | Below Poverty |
| No Children | 778 (97.9%) | 17 (2.1%) |
| 1 or 2 Children | 629 (93.6%) | 43 (6.4%) |
| 3 or 4 Children | 70 (72.9%) | 26 (27.1%) |
| 5 or more Children | 0 (0.0%) | 0 (0.0%) |
| Total | 1,477 (94.5%) | 86 (5.5%) |
Income Below Poverty Among Single-Parent Households in Winkler County
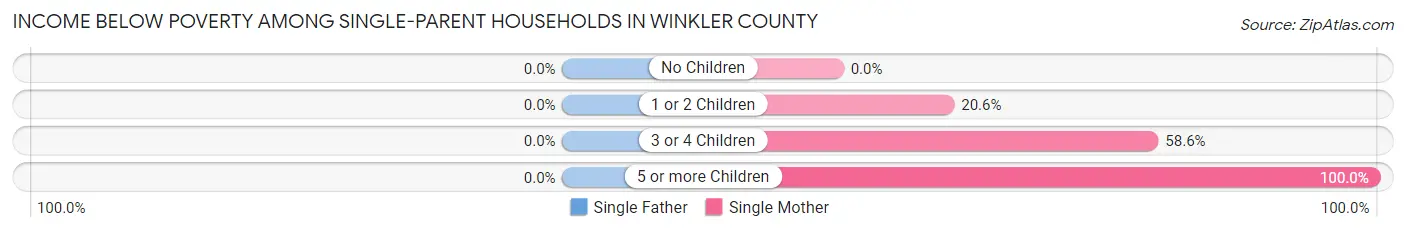
| Children | Single Father | Single Mother |
| No Children | 0 (0.0%) | 0 (0.0%) |
| 1 or 2 Children | 0 (0.0%) | 27 (20.6%) |
| 3 or 4 Children | 0 (0.0%) | 68 (58.6%) |
| 5 or more Children | 0 (0.0%) | 4 (100.0%) |
| Total | 0 (0.0%) | 99 (30.9%) |
Income Below Poverty Among Married-Couple vs Single-Parent Households in Winkler County
The poverty data for Winkler County shows that 86 of the married-couple family households (5.5%) and 99 of the single-parent households (20.3%) are living below the poverty level. Within the married-couple family households, those with 3 or 4 children have the highest poverty rate, with 26 households (27.1%) falling below the poverty line. Among the single-parent households, those with 5 or more children have the highest poverty rate, with 4 household (100.0%) living below poverty.
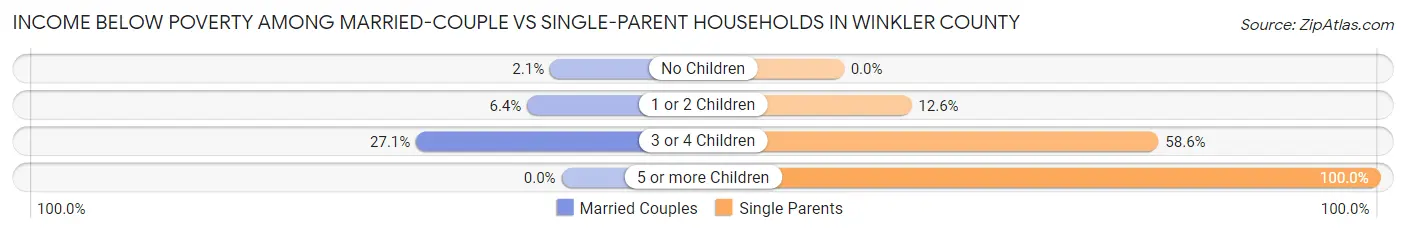
| Children | Married-Couple Families | Single-Parent Households |
| No Children | 17 (2.1%) | 0 (0.0%) |
| 1 or 2 Children | 43 (6.4%) | 27 (12.6%) |
| 3 or 4 Children | 26 (27.1%) | 68 (58.6%) |
| 5 or more Children | 0 (0.0%) | 4 (100.0%) |
| Total | 86 (5.5%) | 99 (20.3%) |
Race in Winkler County
The most populous races in Winkler County are White / Caucasian (4,919 | 64.9%), Hispanic or Latino (4,748 | 62.6%), and Two or more Races (1,219 | 16.1%).
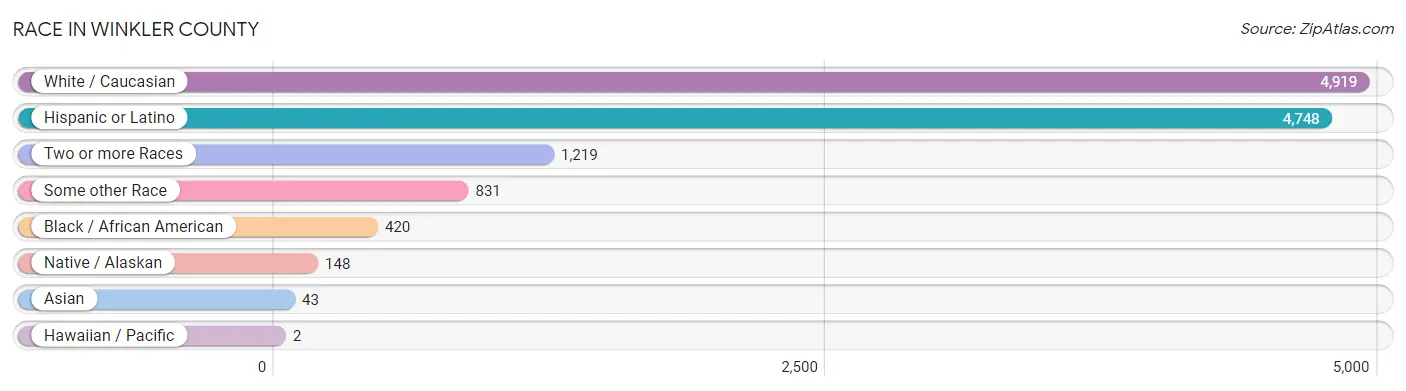
| Race | # Population | % Population |
| Asian | 43 | 0.6% |
| Black / African American | 420 | 5.5% |
| Hawaiian / Pacific | 2 | 0.0% |
| Hispanic or Latino | 4,748 | 62.6% |
| Native / Alaskan | 148 | 1.9% |
| White / Caucasian | 4,919 | 64.9% |
| Two or more Races | 1,219 | 16.1% |
| Some other Race | 831 | 11.0% |
| Total | 7,582 | 100.0% |
Ancestry in Winkler County
The most populous ancestries reported in Winkler County are Mexican (4,353 | 57.4%), German (390 | 5.1%), English (378 | 5.0%), Irish (374 | 4.9%), and American (317 | 4.2%), together accounting for 76.6% of all Winkler County residents.
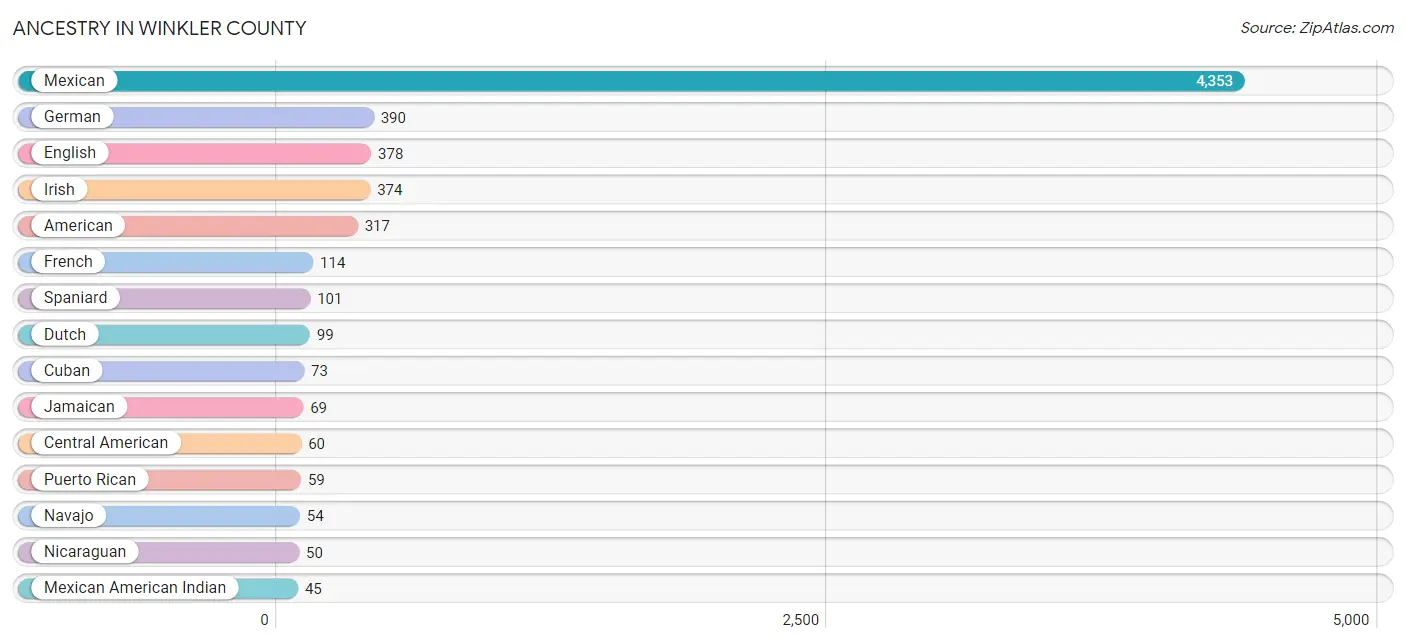
| Ancestry | # Population | % Population |
| American | 317 | 4.2% |
| Apache | 8 | 0.1% |
| British | 15 | 0.2% |
| Central American | 60 | 0.8% |
| Cuban | 73 | 1.0% |
| Czechoslovakian | 4 | 0.1% |
| Dutch | 99 | 1.3% |
| English | 378 | 5.0% |
| European | 25 | 0.3% |
| French | 114 | 1.5% |
| French American Indian | 6 | 0.1% |
| German | 390 | 5.1% |
| Guamanian / Chamorro | 2 | 0.0% |
| Guatemalan | 10 | 0.1% |
| Hungarian | 3 | 0.0% |
| Irish | 374 | 4.9% |
| Italian | 8 | 0.1% |
| Jamaican | 69 | 0.9% |
| Mexican | 4,353 | 57.4% |
| Mexican American Indian | 45 | 0.6% |
| Navajo | 54 | 0.7% |
| Nicaraguan | 50 | 0.7% |
| Norwegian | 15 | 0.2% |
| Polish | 9 | 0.1% |
| Puerto Rican | 59 | 0.8% |
| Scandinavian | 7 | 0.1% |
| Scotch-Irish | 31 | 0.4% |
| Scottish | 20 | 0.3% |
| Spaniard | 101 | 1.3% |
| Sri Lankan | 43 | 0.6% |
| Welsh | 29 | 0.4% | View All 31 Rows |
Immigrants in Winkler County
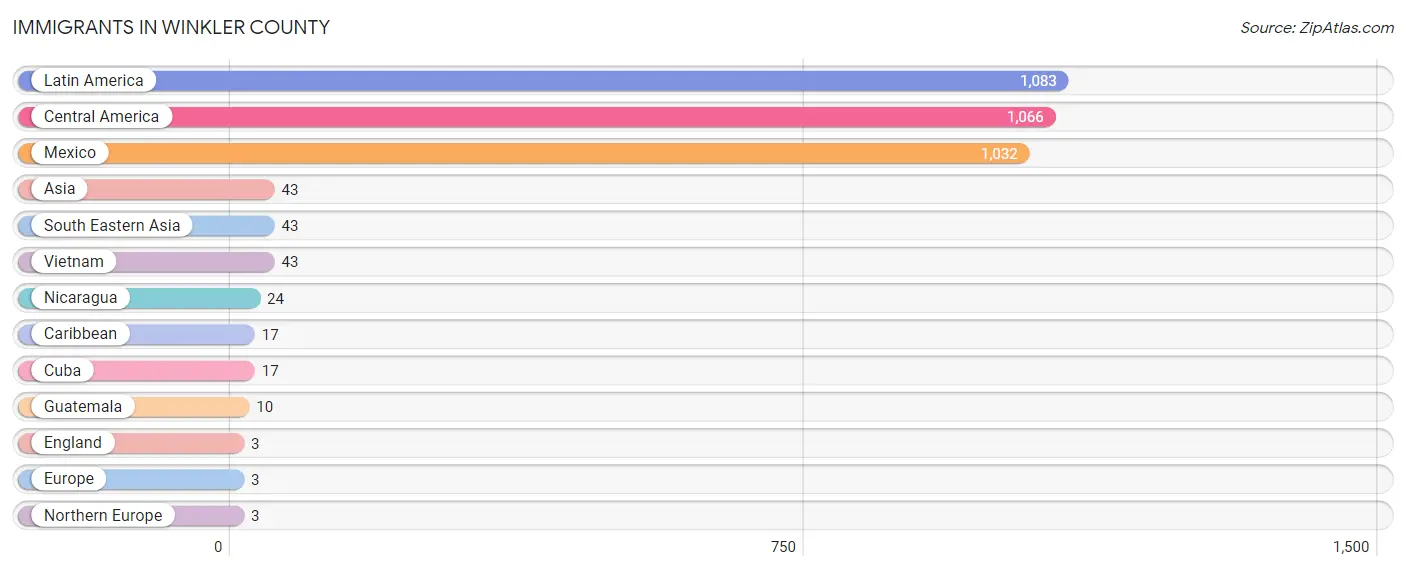
The most numerous immigrant groups reported in Winkler County came from Latin America (1,083 | 14.3%), Central America (1,066 | 14.1%), Mexico (1,032 | 13.6%), Asia (43 | 0.6%), and South Eastern Asia (43 | 0.6%), together accounting for 43.1% of all Winkler County residents.
| Immigration Origin | # Population | % Population |
| Asia | 43 | 0.6% |
| Caribbean | 17 | 0.2% |
| Central America | 1,066 | 14.1% |
| Cuba | 17 | 0.2% |
| England | 3 | 0.0% |
| Europe | 3 | 0.0% |
| Guatemala | 10 | 0.1% |
| Latin America | 1,083 | 14.3% |
| Mexico | 1,032 | 13.6% |
| Nicaragua | 24 | 0.3% |
| Northern Europe | 3 | 0.0% |
| South Eastern Asia | 43 | 0.6% |
| Vietnam | 43 | 0.6% | View All 13 Rows |
Sex and Age in Winkler County
Sex and Age in Winkler County
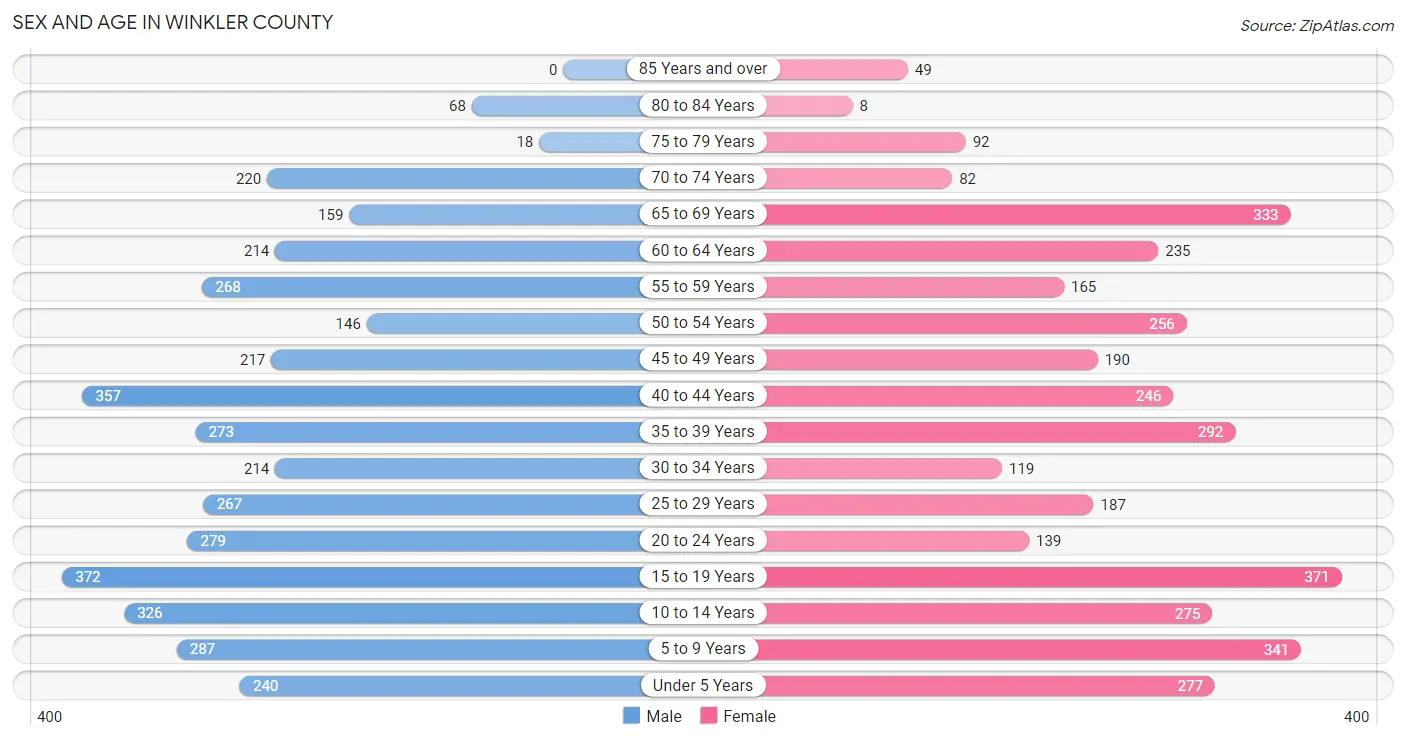
The most populous age groups in Winkler County are 15 to 19 Years (372 | 9.5%) for men and 15 to 19 Years (371 | 10.1%) for women.
| Age Bracket | Male | Female |
| Under 5 Years | 240 (6.1%) | 277 (7.6%) |
| 5 to 9 Years | 287 (7.3%) | 341 (9.3%) |
| 10 to 14 Years | 326 (8.3%) | 275 (7.5%) |
| 15 to 19 Years | 372 (9.5%) | 371 (10.1%) |
| 20 to 24 Years | 279 (7.1%) | 139 (3.8%) |
| 25 to 29 Years | 267 (6.8%) | 187 (5.1%) |
| 30 to 34 Years | 214 (5.4%) | 119 (3.3%) |
| 35 to 39 Years | 273 (7.0%) | 292 (8.0%) |
| 40 to 44 Years | 357 (9.1%) | 246 (6.7%) |
| 45 to 49 Years | 217 (5.5%) | 190 (5.2%) |
| 50 to 54 Years | 146 (3.7%) | 256 (7.0%) |
| 55 to 59 Years | 268 (6.8%) | 165 (4.5%) |
| 60 to 64 Years | 214 (5.4%) | 235 (6.4%) |
| 65 to 69 Years | 159 (4.1%) | 333 (9.1%) |
| 70 to 74 Years | 220 (5.6%) | 82 (2.2%) |
| 75 to 79 Years | 18 (0.5%) | 92 (2.5%) |
| 80 to 84 Years | 68 (1.7%) | 8 (0.2%) |
| 85 Years and over | 0 (0.0%) | 49 (1.3%) |
| Total | 3,925 (100.0%) | 3,657 (100.0%) |
Families and Households in Winkler County
Median Family Size in Winkler County
The median family size in Winkler County is 3.16 persons per family, with single female/mother families (320 | 15.6%) accounting for the largest median family size of 3.52 persons per family. On the other hand, single male/father families (169 | 8.2%) represent the smallest median family size with 2.11 persons per family.

| Family Type | # Families | Family Size |
| Married-Couple | 1,563 (76.2%) | 3.20 |
| Single Male/Father | 169 (8.2%) | 2.11 |
| Single Female/Mother | 320 (15.6%) | 3.52 |
| Total Families | 2,052 (100.0%) | 3.16 |
Median Household Size in Winkler County
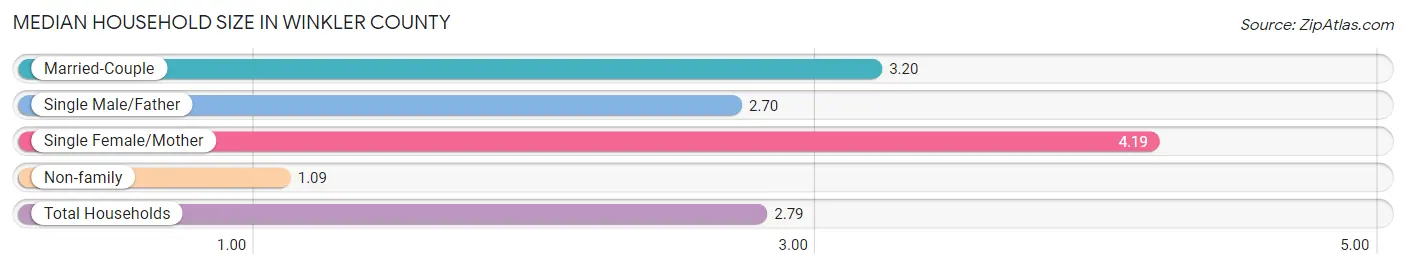
The median household size in Winkler County is 2.79 persons per household, with single female/mother households (320 | 11.9%) accounting for the largest median household size of 4.19 persons per household. non-family households (633 | 23.6%) represent the smallest median household size with 1.09 persons per household.
| Household Type | # Households | Household Size |
| Married-Couple | 1,563 (58.2%) | 3.20 |
| Single Male/Father | 169 (6.3%) | 2.70 |
| Single Female/Mother | 320 (11.9%) | 4.19 |
| Non-family | 633 (23.6%) | 1.09 |
| Total Households | 2,685 (100.0%) | 2.79 |
Household Size by Marriage Status in Winkler County
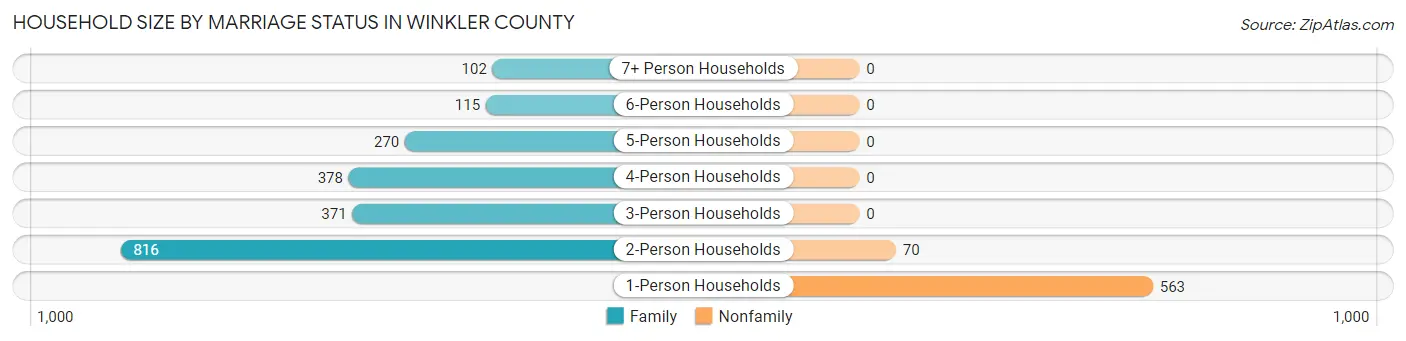
Out of a total of 2,685 households in Winkler County, 2,052 (76.4%) are family households, while 633 (23.6%) are nonfamily households. The most numerous type of family households are 2-person households, comprising 816, and the most common type of nonfamily households are 1-person households, comprising 563.
| Household Size | Family Households | Nonfamily Households |
| 1-Person Households | - | 563 (21.0%) |
| 2-Person Households | 816 (30.4%) | 70 (2.6%) |
| 3-Person Households | 371 (13.8%) | 0 (0.0%) |
| 4-Person Households | 378 (14.1%) | 0 (0.0%) |
| 5-Person Households | 270 (10.1%) | 0 (0.0%) |
| 6-Person Households | 115 (4.3%) | 0 (0.0%) |
| 7+ Person Households | 102 (3.8%) | 0 (0.0%) |
| Total | 2,052 (76.4%) | 633 (23.6%) |
Female Fertility in Winkler County
Fertility by Age in Winkler County
Average fertility rate in Winkler County is 82.0 births per 1,000 women. Women in the age bracket of 20 to 34 years have the highest fertility rate with 252.0 births per 1,000 women. Women in the age bracket of 20 to 34 years acount for 87.5% of all women with births.
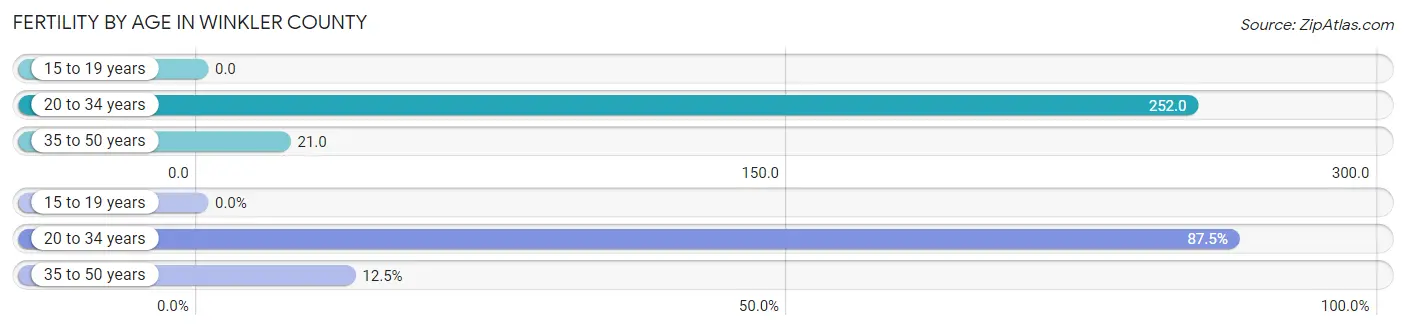
| Age Bracket | Women with Births | Births / 1,000 Women |
| 15 to 19 years | 0 (0.0%) | 0.0 |
| 20 to 34 years | 112 (87.5%) | 252.0 |
| 35 to 50 years | 16 (12.5%) | 21.0 |
| Total | 128 (100.0%) | 82.0 |
Fertility by Age by Marriage Status in Winkler County
38.3% of women with births (128) in Winkler County are married. The highest percentage of unmarried women with births falls into 20 to 34 years age bracket with 70.5% of them unmarried at the time of birth, while the lowest percentage of unmarried women with births belong to 35 to 50 years age bracket with 0.0% of them unmarried.
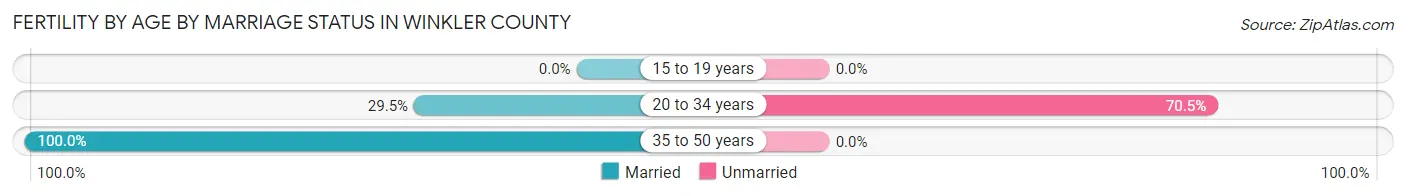
| Age Bracket | Married | Unmarried |
| 15 to 19 years | 0 (0.0%) | 0 (0.0%) |
| 20 to 34 years | 33 (29.5%) | 79 (70.5%) |
| 35 to 50 years | 16 (100.0%) | 0 (0.0%) |
| Total | 49 (38.3%) | 79 (61.7%) |
Fertility by Education in Winkler County
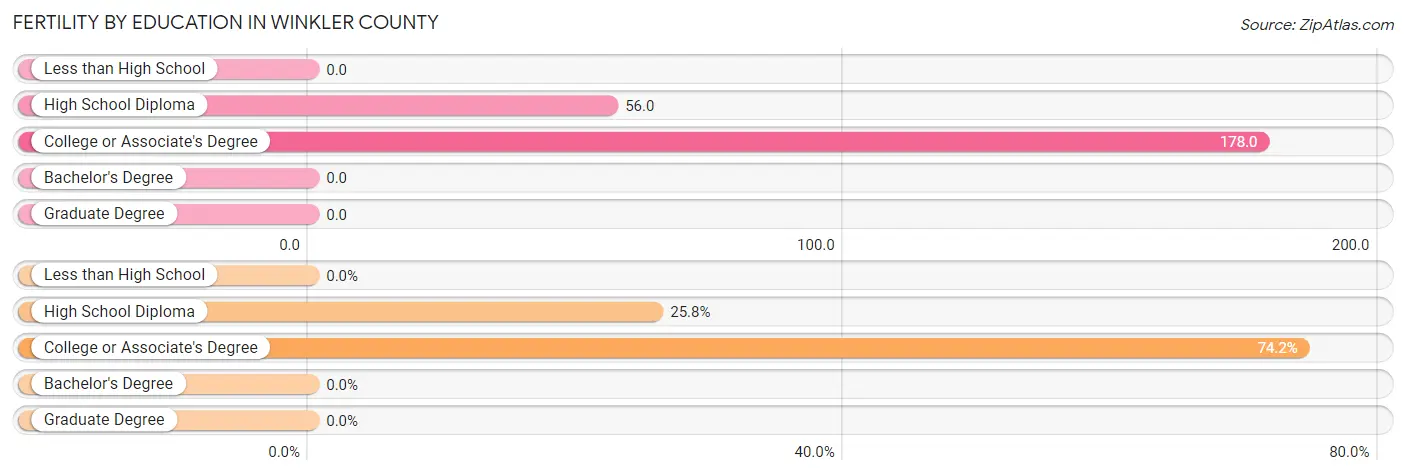
| Educational Attainment | Women with Births | Births / 1,000 Women |
| Less than High School | 0 (0.0%) | 0.0 |
| High School Diploma | 33 (25.8%) | 56.0 |
| College or Associate's Degree | 95 (74.2%) | 178.0 |
| Bachelor's Degree | 0 (0.0%) | 0.0 |
| Graduate Degree | 0 (0.0%) | 0.0 |
| Total | 128 (100.0%) | 82.0 |
Fertility by Education by Marriage Status in Winkler County
61.7% of women with births in Winkler County are unmarried. Women with the educational attainment of high school diploma are most likely to be married with 51.5% of them married at childbirth, while women with the educational attainment of college or associate's degree are least likely to be married with 66.3% of them unmarried at childbirth.
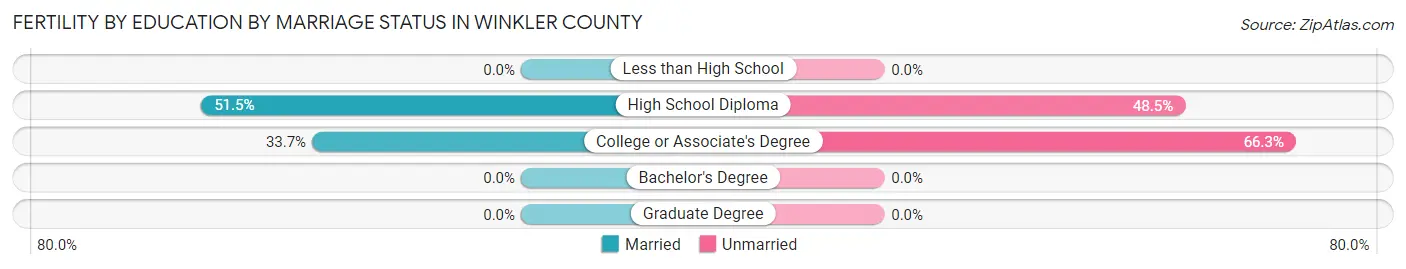
| Educational Attainment | Married | Unmarried |
| Less than High School | 0 (0.0%) | 0 (0.0%) |
| High School Diploma | 17 (51.5%) | 16 (48.5%) |
| College or Associate's Degree | 32 (33.7%) | 63 (66.3%) |
| Bachelor's Degree | 0 (0.0%) | 0 (0.0%) |
| Graduate Degree | 0 (0.0%) | 0 (0.0%) |
| Total | 49 (38.3%) | 79 (61.7%) |
Employment Characteristics in Winkler County
Employment by Class of Employer in Winkler County
Among the 3,380 employed individuals in Winkler County, private company employees (2,101 | 62.2%), local government employees (576 | 17.0%), and federal government employees (182 | 5.4%) make up the most common classes of employment.
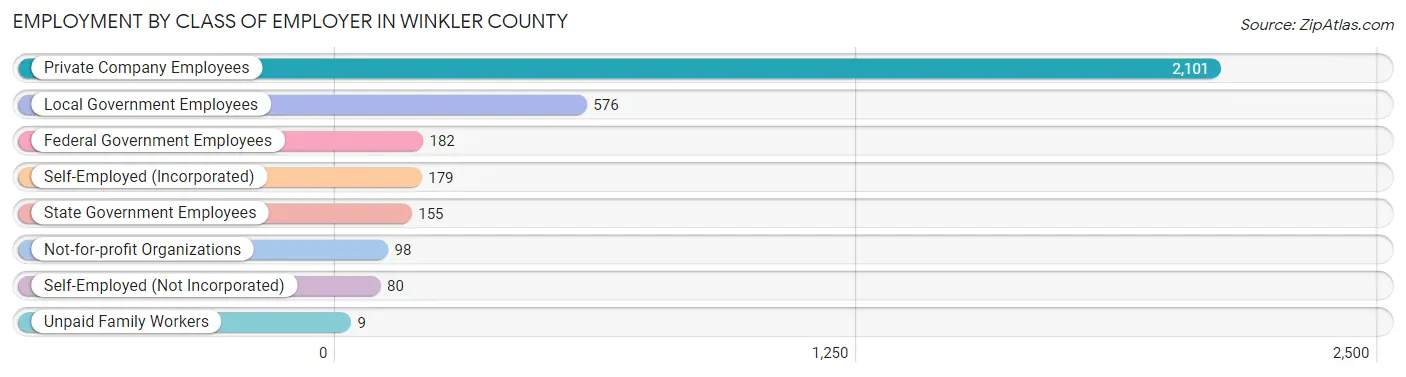
| Employer Class | # Employees | % Employees |
| Private Company Employees | 2,101 | 62.2% |
| Self-Employed (Incorporated) | 179 | 5.3% |
| Self-Employed (Not Incorporated) | 80 | 2.4% |
| Not-for-profit Organizations | 98 | 2.9% |
| Local Government Employees | 576 | 17.0% |
| State Government Employees | 155 | 4.6% |
| Federal Government Employees | 182 | 5.4% |
| Unpaid Family Workers | 9 | 0.3% |
| Total | 3,380 | 100.0% |
Employment Status by Age in Winkler County
According to the labor force statistics for Winkler County, out of the total population over 16 years of age (5,682), 60.9% or 3,460 individuals are in the labor force, with 2.3% or 80 of them unemployed. The age group with the highest labor force participation rate is 25 to 29 years, with 82.8% or 376 individuals in the labor force. Within the labor force, the 16 to 19 years age range has the highest percentage of unemployed individuals, with 34.9% or 22 of them being unemployed.
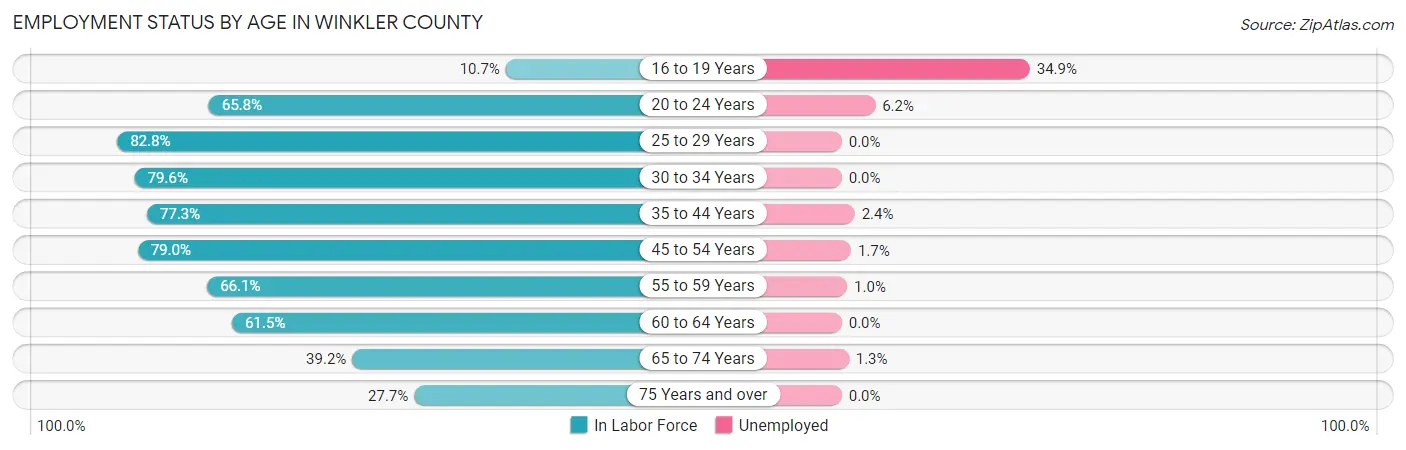
| Age Bracket | In Labor Force | Unemployed |
| 16 to 19 Years | 63 (10.7%) | 22 (34.9%) |
| 20 to 24 Years | 275 (65.8%) | 17 (6.2%) |
| 25 to 29 Years | 376 (82.8%) | 0 (0.0%) |
| 30 to 34 Years | 265 (79.6%) | 0 (0.0%) |
| 35 to 44 Years | 903 (77.3%) | 22 (2.4%) |
| 45 to 54 Years | 639 (79.0%) | 11 (1.7%) |
| 55 to 59 Years | 286 (66.1%) | 3 (1.0%) |
| 60 to 64 Years | 276 (61.5%) | 0 (0.0%) |
| 65 to 74 Years | 311 (39.2%) | 4 (1.3%) |
| 75 Years and over | 65 (27.7%) | 0 (0.0%) |
| Total | 3,460 (60.9%) | 80 (2.3%) |
Employment Status by Educational Attainment in Winkler County
According to labor force statistics for Winkler County, 75.3% of individuals (2,745) out of the total population between 25 and 64 years of age (3,646) are in the labor force, with 1.3% or 36 of them being unemployed. The group with the highest labor force participation rate are those with the educational attainment of high school diploma, with 81.2% or 1,099 individuals in the labor force. Within the labor force, individuals with bachelor's degree or higher education have the highest percentage of unemployment, with 5.2% or 12 of them being unemployed.
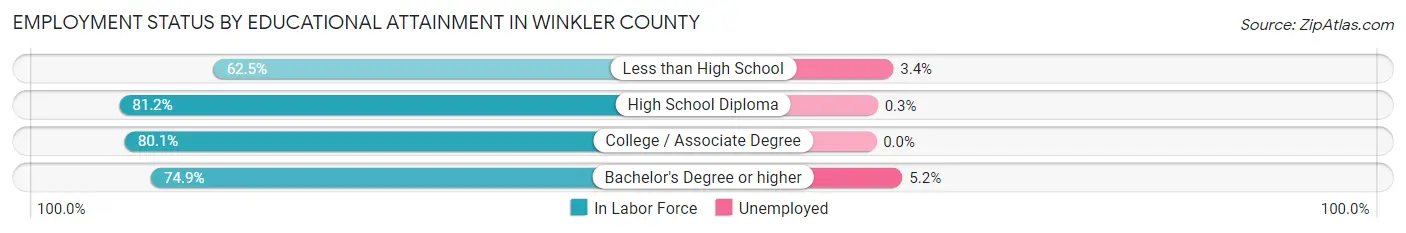
| Educational Attainment | In Labor Force | Unemployed |
| Less than High School | 614 (62.5%) | 33 (3.4%) |
| High School Diploma | 1,099 (81.2%) | 4 (0.3%) |
| College / Associate Degree | 800 (80.1%) | 0 (0.0%) |
| Bachelor's Degree or higher | 233 (74.9%) | 16 (5.2%) |
| Total | 2,745 (75.3%) | 47 (1.3%) |
Employment Occupations by Sex in Winkler County
Management, Business, Science and Arts Occupations
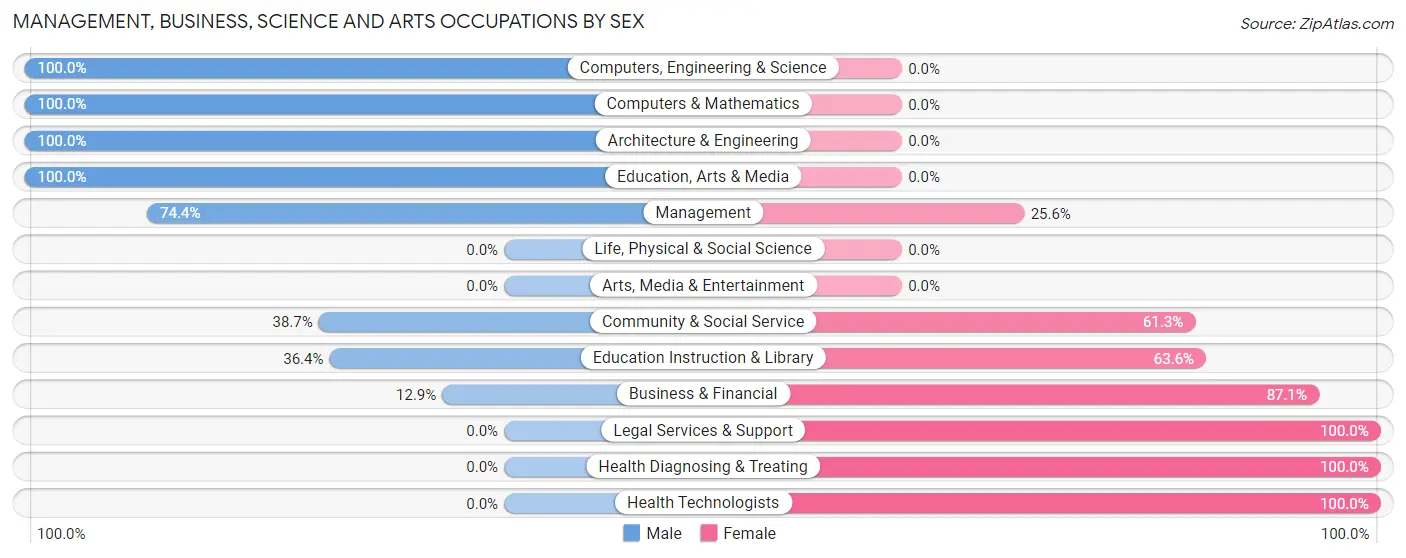
The most common Management, Business, Science and Arts occupations in Winkler County are Community & Social Service (243 | 7.2%), Education Instruction & Library (225 | 6.7%), Management (223 | 6.6%), Computers, Engineering & Science (125 | 3.7%), and Architecture & Engineering (66 | 1.9%).
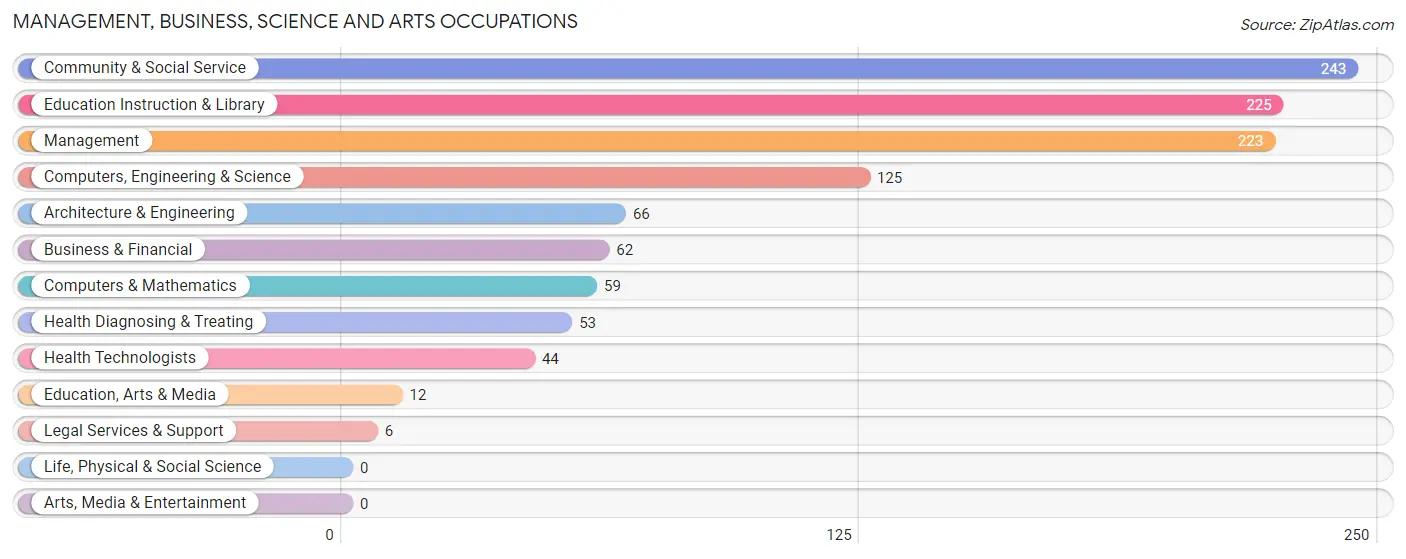
Management, Business, Science and Arts Occupations by Sex
Within the Management, Business, Science and Arts occupations in Winkler County, the most male-oriented occupations are Computers, Engineering & Science (100.0%), Computers & Mathematics (100.0%), and Architecture & Engineering (100.0%), while the most female-oriented occupations are Legal Services & Support (100.0%), Health Diagnosing & Treating (100.0%), and Health Technologists (100.0%).
| Occupation | Male | Female |
| Management | 166 (74.4%) | 57 (25.6%) |
| Business & Financial | 8 (12.9%) | 54 (87.1%) |
| Computers, Engineering & Science | 125 (100.0%) | 0 (0.0%) |
| Computers & Mathematics | 59 (100.0%) | 0 (0.0%) |
| Architecture & Engineering | 66 (100.0%) | 0 (0.0%) |
| Life, Physical & Social Science | 0 (0.0%) | 0 (0.0%) |
| Community & Social Service | 94 (38.7%) | 149 (61.3%) |
| Education, Arts & Media | 12 (100.0%) | 0 (0.0%) |
| Legal Services & Support | 0 (0.0%) | 6 (100.0%) |
| Education Instruction & Library | 82 (36.4%) | 143 (63.6%) |
| Arts, Media & Entertainment | 0 (0.0%) | 0 (0.0%) |
| Health Diagnosing & Treating | 0 (0.0%) | 53 (100.0%) |
| Health Technologists | 0 (0.0%) | 44 (100.0%) |
| Total (Category) | 393 (55.7%) | 313 (44.3%) |
| Total (Overall) | 2,232 (66.0%) | 1,148 (34.0%) |
Services Occupations
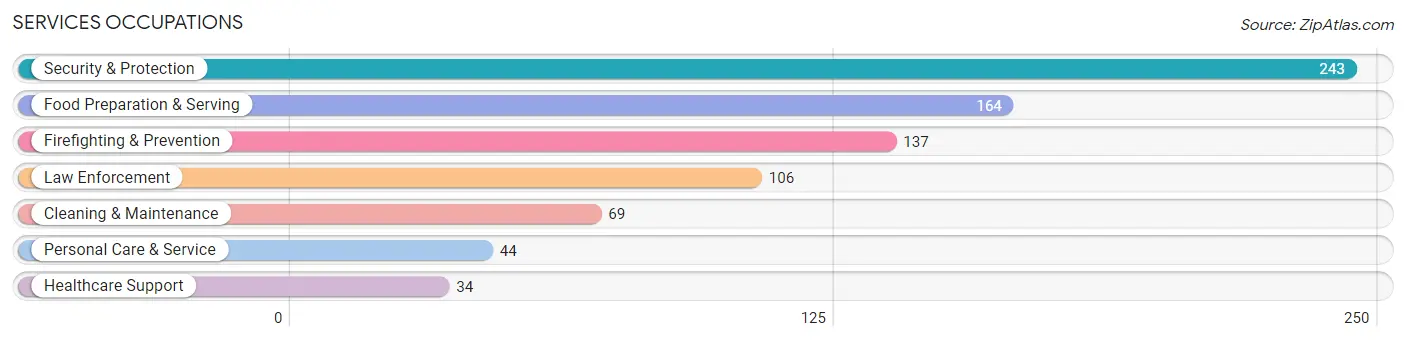
The most common Services occupations in Winkler County are Security & Protection (243 | 7.2%), Food Preparation & Serving (164 | 4.9%), Firefighting & Prevention (137 | 4.1%), Law Enforcement (106 | 3.1%), and Cleaning & Maintenance (69 | 2.0%).
Services Occupations by Sex
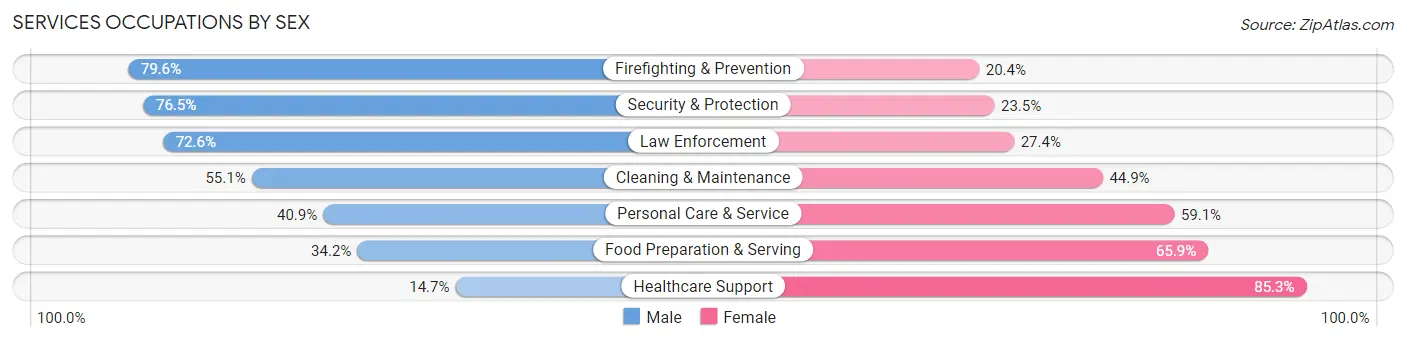
Within the Services occupations in Winkler County, the most male-oriented occupations are Firefighting & Prevention (79.6%), Security & Protection (76.5%), and Law Enforcement (72.6%), while the most female-oriented occupations are Healthcare Support (85.3%), Food Preparation & Serving (65.8%), and Personal Care & Service (59.1%).
| Occupation | Male | Female |
| Healthcare Support | 5 (14.7%) | 29 (85.3%) |
| Security & Protection | 186 (76.5%) | 57 (23.5%) |
| Firefighting & Prevention | 109 (79.6%) | 28 (20.4%) |
| Law Enforcement | 77 (72.6%) | 29 (27.4%) |
| Food Preparation & Serving | 56 (34.2%) | 108 (65.8%) |
| Cleaning & Maintenance | 38 (55.1%) | 31 (44.9%) |
| Personal Care & Service | 18 (40.9%) | 26 (59.1%) |
| Total (Category) | 303 (54.7%) | 251 (45.3%) |
| Total (Overall) | 2,232 (66.0%) | 1,148 (34.0%) |
Sales and Office Occupations
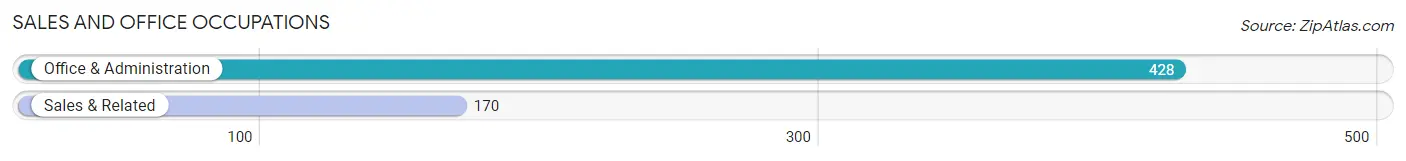
The most common Sales and Office occupations in Winkler County are Office & Administration (428 | 12.7%), and Sales & Related (170 | 5.0%).
Sales and Office Occupations by Sex
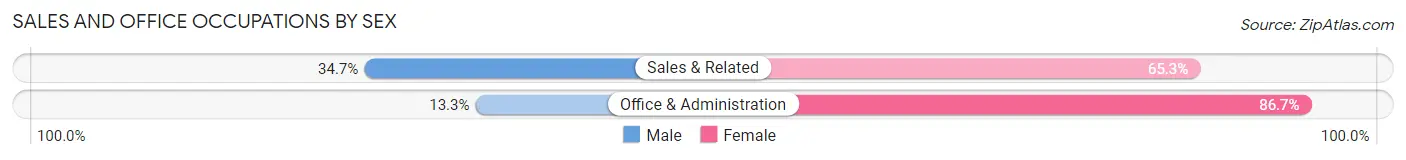
| Occupation | Male | Female |
| Sales & Related | 59 (34.7%) | 111 (65.3%) |
| Office & Administration | 57 (13.3%) | 371 (86.7%) |
| Total (Category) | 116 (19.4%) | 482 (80.6%) |
| Total (Overall) | 2,232 (66.0%) | 1,148 (34.0%) |
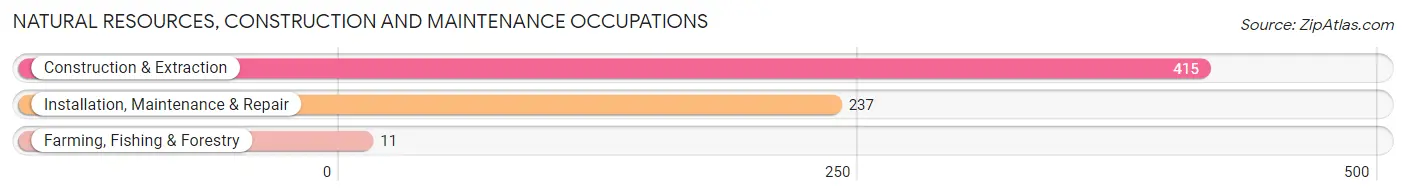
Natural Resources, Construction and Maintenance Occupations
The most common Natural Resources, Construction and Maintenance occupations in Winkler County are Construction & Extraction (415 | 12.3%), Installation, Maintenance & Repair (237 | 7.0%), and Farming, Fishing & Forestry (11 | 0.3%).
Natural Resources, Construction and Maintenance Occupations by Sex
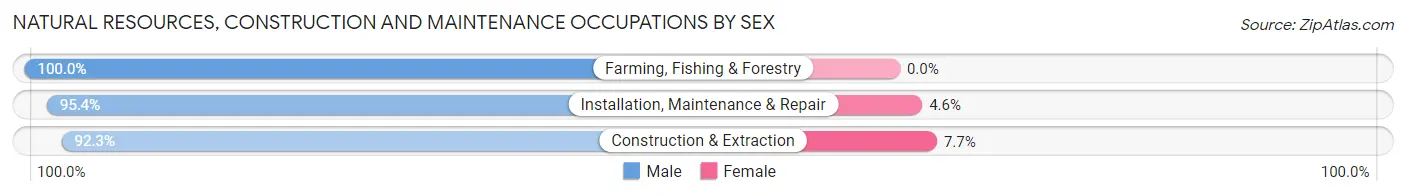
| Occupation | Male | Female |
| Farming, Fishing & Forestry | 11 (100.0%) | 0 (0.0%) |
| Construction & Extraction | 383 (92.3%) | 32 (7.7%) |
| Installation, Maintenance & Repair | 226 (95.4%) | 11 (4.6%) |
| Total (Category) | 620 (93.5%) | 43 (6.5%) |
| Total (Overall) | 2,232 (66.0%) | 1,148 (34.0%) |
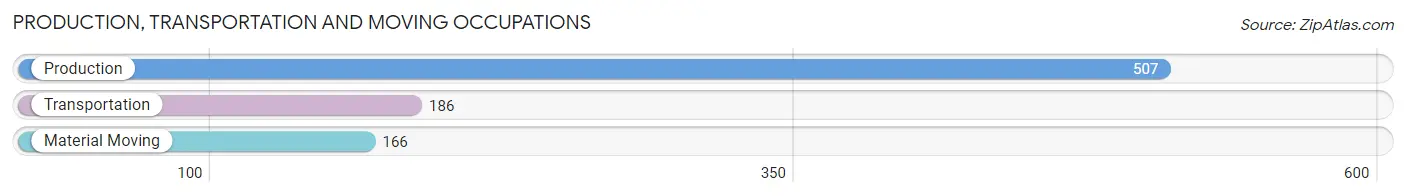
Production, Transportation and Moving Occupations
The most common Production, Transportation and Moving occupations in Winkler County are Production (507 | 15.0%), Transportation (186 | 5.5%), and Material Moving (166 | 4.9%).
Production, Transportation and Moving Occupations by Sex
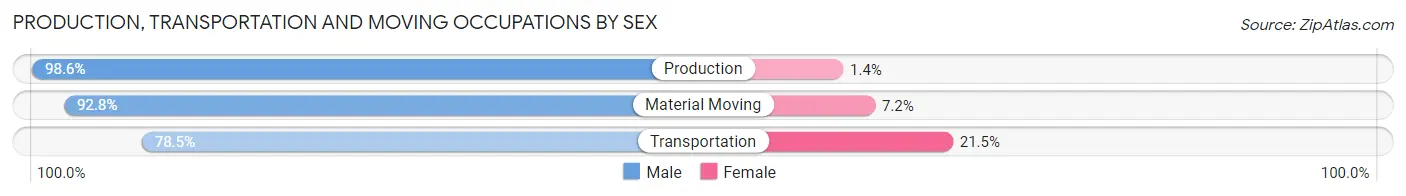
| Occupation | Male | Female |
| Production | 500 (98.6%) | 7 (1.4%) |
| Transportation | 146 (78.5%) | 40 (21.5%) |
| Material Moving | 154 (92.8%) | 12 (7.2%) |
| Total (Category) | 800 (93.1%) | 59 (6.9%) |
| Total (Overall) | 2,232 (66.0%) | 1,148 (34.0%) |
Employment Industries by Sex in Winkler County
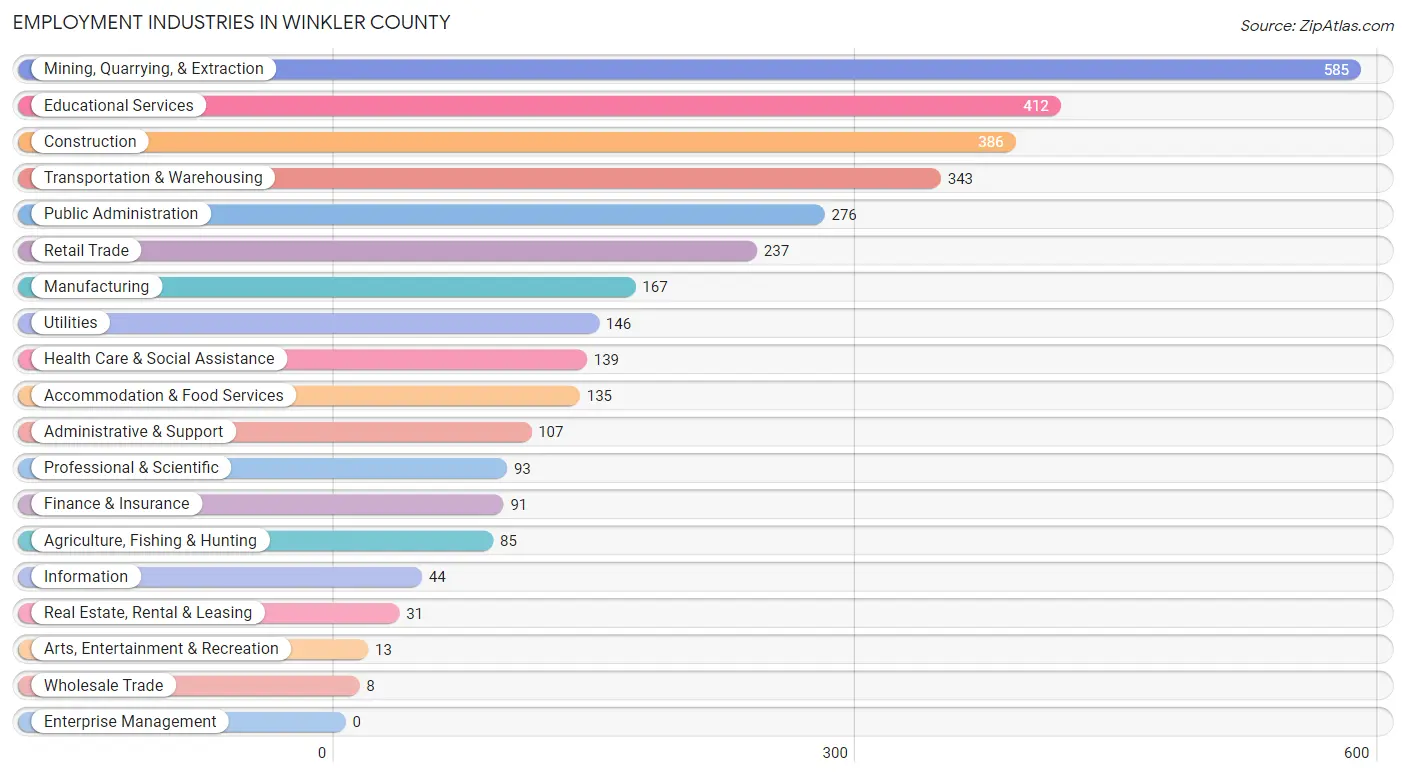
Employment Industries in Winkler County
The major employment industries in Winkler County include Mining, Quarrying, & Extraction (585 | 17.3%), Educational Services (412 | 12.2%), Construction (386 | 11.4%), Transportation & Warehousing (343 | 10.2%), and Public Administration (276 | 8.2%).
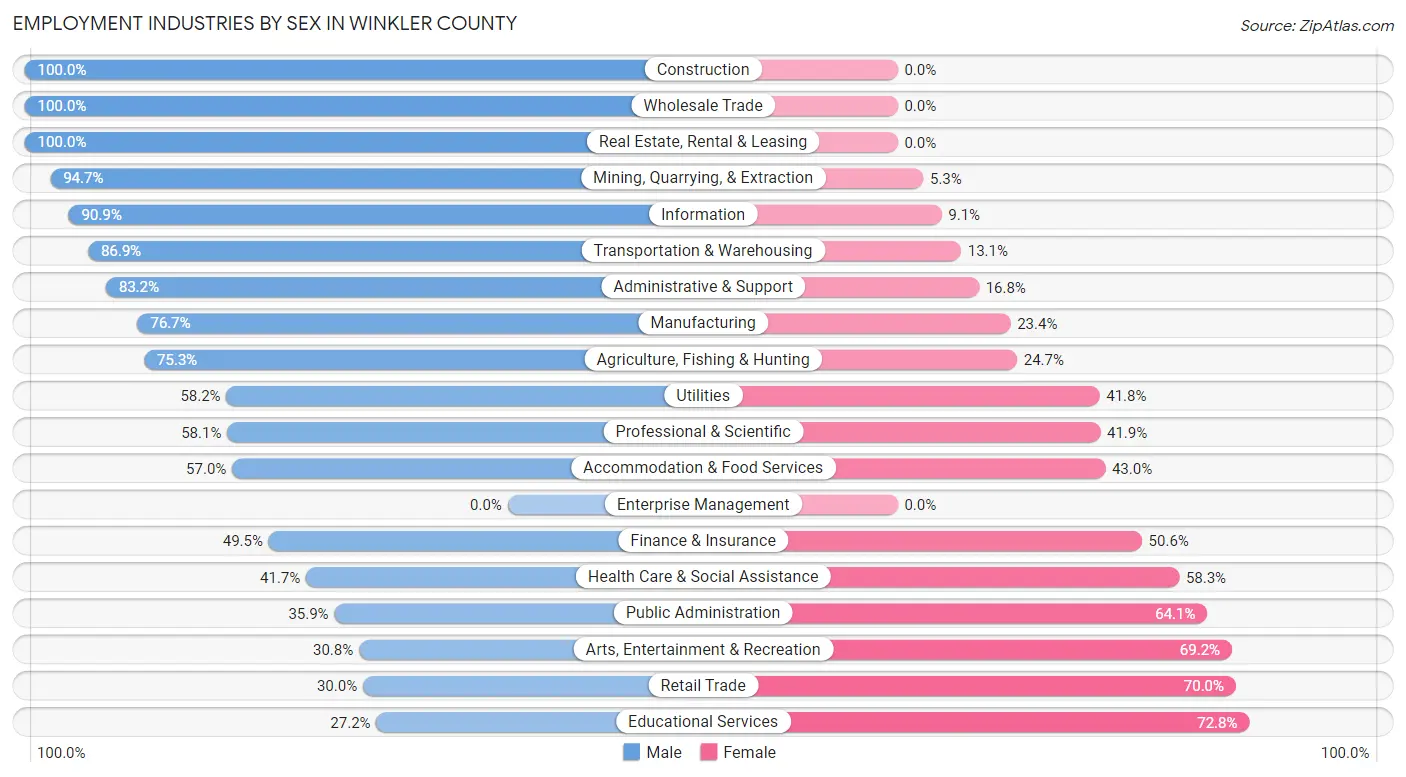
Employment Industries by Sex in Winkler County
The Winkler County industries that see more men than women are Construction (100.0%), Wholesale Trade (100.0%), and Real Estate, Rental & Leasing (100.0%), whereas the industries that tend to have a higher number of women are Educational Services (72.8%), Retail Trade (70.0%), and Arts, Entertainment & Recreation (69.2%).
| Industry | Male | Female |
| Agriculture, Fishing & Hunting | 64 (75.3%) | 21 (24.7%) |
| Mining, Quarrying, & Extraction | 554 (94.7%) | 31 (5.3%) |
| Construction | 386 (100.0%) | 0 (0.0%) |
| Manufacturing | 128 (76.6%) | 39 (23.4%) |
| Wholesale Trade | 8 (100.0%) | 0 (0.0%) |
| Retail Trade | 71 (30.0%) | 166 (70.0%) |
| Transportation & Warehousing | 298 (86.9%) | 45 (13.1%) |
| Utilities | 85 (58.2%) | 61 (41.8%) |
| Information | 40 (90.9%) | 4 (9.1%) |
| Finance & Insurance | 45 (49.4%) | 46 (50.5%) |
| Real Estate, Rental & Leasing | 31 (100.0%) | 0 (0.0%) |
| Professional & Scientific | 54 (58.1%) | 39 (41.9%) |
| Enterprise Management | 0 (0.0%) | 0 (0.0%) |
| Administrative & Support | 89 (83.2%) | 18 (16.8%) |
| Educational Services | 112 (27.2%) | 300 (72.8%) |
| Health Care & Social Assistance | 58 (41.7%) | 81 (58.3%) |
| Arts, Entertainment & Recreation | 4 (30.8%) | 9 (69.2%) |
| Accommodation & Food Services | 77 (57.0%) | 58 (43.0%) |
| Public Administration | 99 (35.9%) | 177 (64.1%) |
| Total | 2,232 (66.0%) | 1,148 (34.0%) |
Education in Winkler County
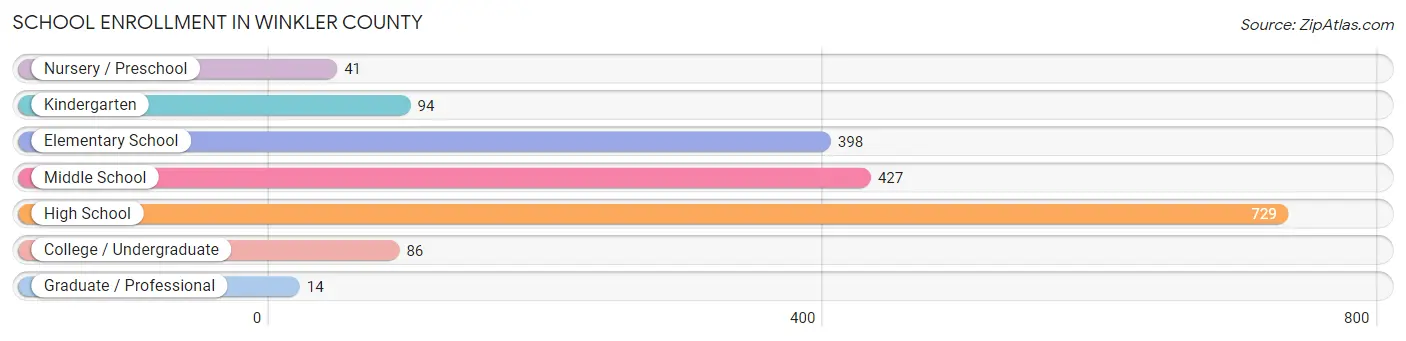
School Enrollment in Winkler County
The most common levels of schooling among the 1,789 students in Winkler County are high school (729 | 40.7%), middle school (427 | 23.9%), and elementary school (398 | 22.3%).
| School Level | # Students | % Students |
| Nursery / Preschool | 41 | 2.3% |
| Kindergarten | 94 | 5.2% |
| Elementary School | 398 | 22.3% |
| Middle School | 427 | 23.9% |
| High School | 729 | 40.7% |
| College / Undergraduate | 86 | 4.8% |
| Graduate / Professional | 14 | 0.8% |
| Total | 1,789 | 100.0% |
School Enrollment by Age by Funding Source in Winkler County
Out of a total of 1,789 students who are enrolled in schools in Winkler County, 61 (3.4%) attend a private institution, while the remaining 1,728 (96.6%) are enrolled in public schools. The age group of 20 to 24 year olds has the highest likelihood of being enrolled in private schools, with 4 (13.3% in the age bracket) enrolled. Conversely, the age group of 3 to 4 year olds has the lowest likelihood of being enrolled in a private school, with 34 (100.0% in the age bracket) attending a public institution.
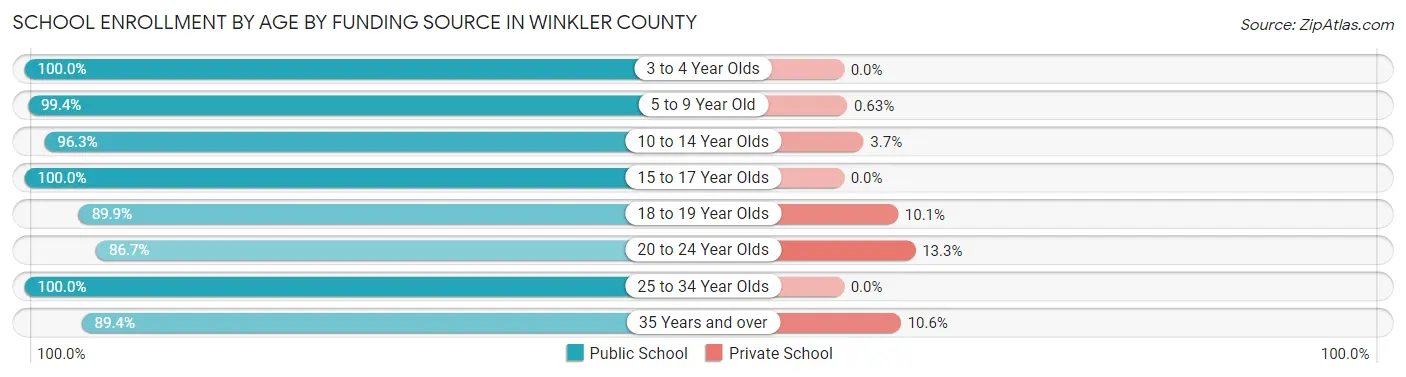
| Age Bracket | Public School | Private School |
| 3 to 4 Year Olds | 34 (100.0%) | 0 (0.0%) |
| 5 to 9 Year Old | 472 (99.4%) | 3 (0.6%) |
| 10 to 14 Year Olds | 497 (96.3%) | 19 (3.7%) |
| 15 to 17 Year Olds | 394 (100.0%) | 0 (0.0%) |
| 18 to 19 Year Olds | 196 (89.9%) | 22 (10.1%) |
| 20 to 24 Year Olds | 26 (86.7%) | 4 (13.3%) |
| 25 to 34 Year Olds | 9 (100.0%) | 0 (0.0%) |
| 35 Years and over | 101 (89.4%) | 12 (10.6%) |
| Total | 1,728 (96.6%) | 61 (3.4%) |
Educational Attainment by Field of Study in Winkler County
Business (138 | 31.7%), education (86 | 19.8%), arts & humanities (56 | 12.9%), computers & mathematics (27 | 6.2%), and engineering (24 | 5.5%) are the most common fields of study among 435 individuals in Winkler County who have obtained a bachelor's degree or higher.
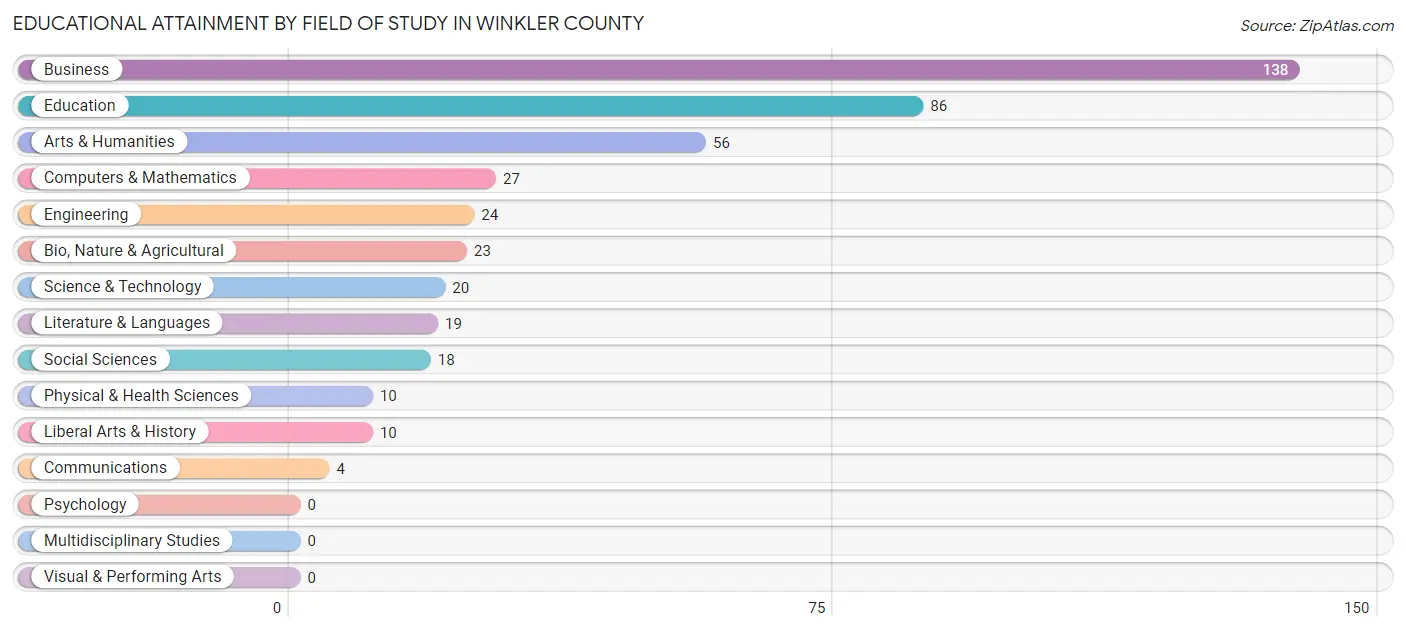
| Field of Study | # Graduates | % Graduates |
| Computers & Mathematics | 27 | 6.2% |
| Bio, Nature & Agricultural | 23 | 5.3% |
| Physical & Health Sciences | 10 | 2.3% |
| Psychology | 0 | 0.0% |
| Social Sciences | 18 | 4.1% |
| Engineering | 24 | 5.5% |
| Multidisciplinary Studies | 0 | 0.0% |
| Science & Technology | 20 | 4.6% |
| Business | 138 | 31.7% |
| Education | 86 | 19.8% |
| Literature & Languages | 19 | 4.4% |
| Liberal Arts & History | 10 | 2.3% |
| Visual & Performing Arts | 0 | 0.0% |
| Communications | 4 | 0.9% |
| Arts & Humanities | 56 | 12.9% |
| Total | 435 | 100.0% |
Transportation & Commute in Winkler County
Vehicle Availability by Sex in Winkler County
The most prevalent vehicle ownership categories in Winkler County are males with 2 vehicles (771, accounting for 34.5%) and females with 2 vehicles (500, making up 67.2%).
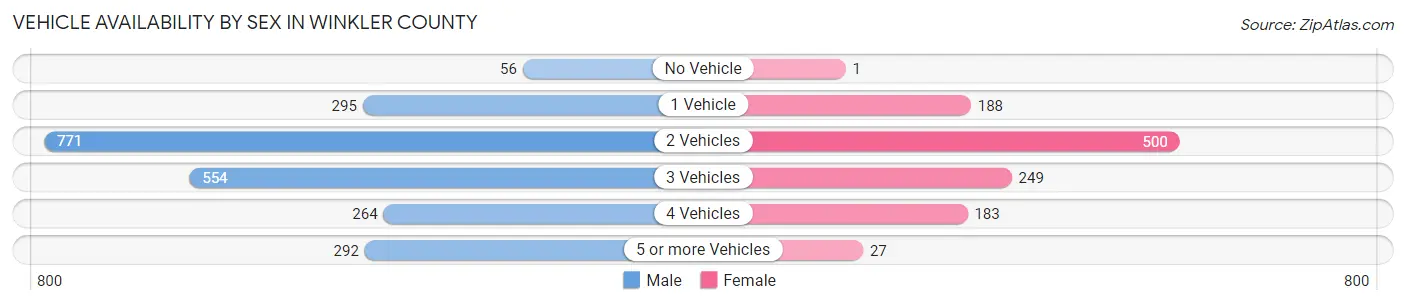
| Vehicles Available | Male | Female |
| No Vehicle | 56 (2.5%) | 1 (0.1%) |
| 1 Vehicle | 295 (13.2%) | 188 (16.4%) |
| 2 Vehicles | 771 (34.5%) | 500 (43.5%) |
| 3 Vehicles | 554 (24.8%) | 249 (21.7%) |
| 4 Vehicles | 264 (11.8%) | 183 (15.9%) |
| 5 or more Vehicles | 292 (13.1%) | 27 (2.4%) |
| Total | 2,232 (100.0%) | 1,148 (100.0%) |
Commute Time in Winkler County
The most frequently occuring commute durations in Winkler County are 5 to 9 minutes (788 commuters, 23.7%), 60 to 89 minutes (600 commuters, 18.0%), and less than 5 minutes (575 commuters, 17.3%).
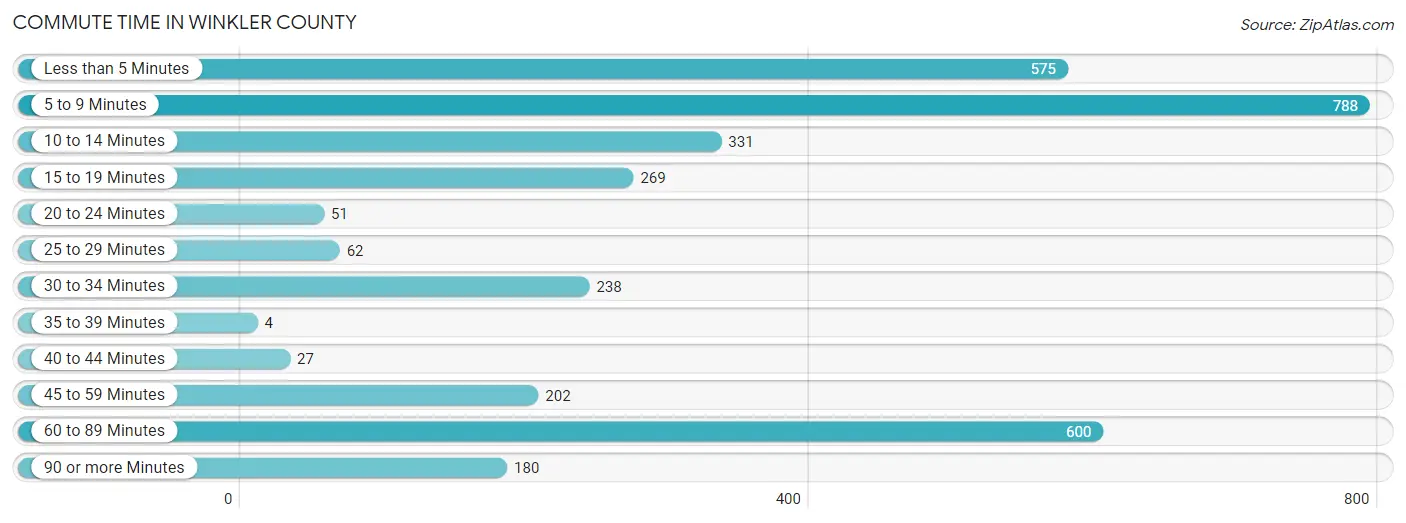
| Commute Time | # Commuters | % Commuters |
| Less than 5 Minutes | 575 | 17.3% |
| 5 to 9 Minutes | 788 | 23.7% |
| 10 to 14 Minutes | 331 | 10.0% |
| 15 to 19 Minutes | 269 | 8.1% |
| 20 to 24 Minutes | 51 | 1.5% |
| 25 to 29 Minutes | 62 | 1.9% |
| 30 to 34 Minutes | 238 | 7.1% |
| 35 to 39 Minutes | 4 | 0.1% |
| 40 to 44 Minutes | 27 | 0.8% |
| 45 to 59 Minutes | 202 | 6.1% |
| 60 to 89 Minutes | 600 | 18.0% |
| 90 or more Minutes | 180 | 5.4% |
Commute Time by Sex in Winkler County
The most common commute times in Winkler County are 60 to 89 minutes (561 commuters, 25.2%) for males and 5 to 9 minutes (448 commuters, 40.6%) for females.
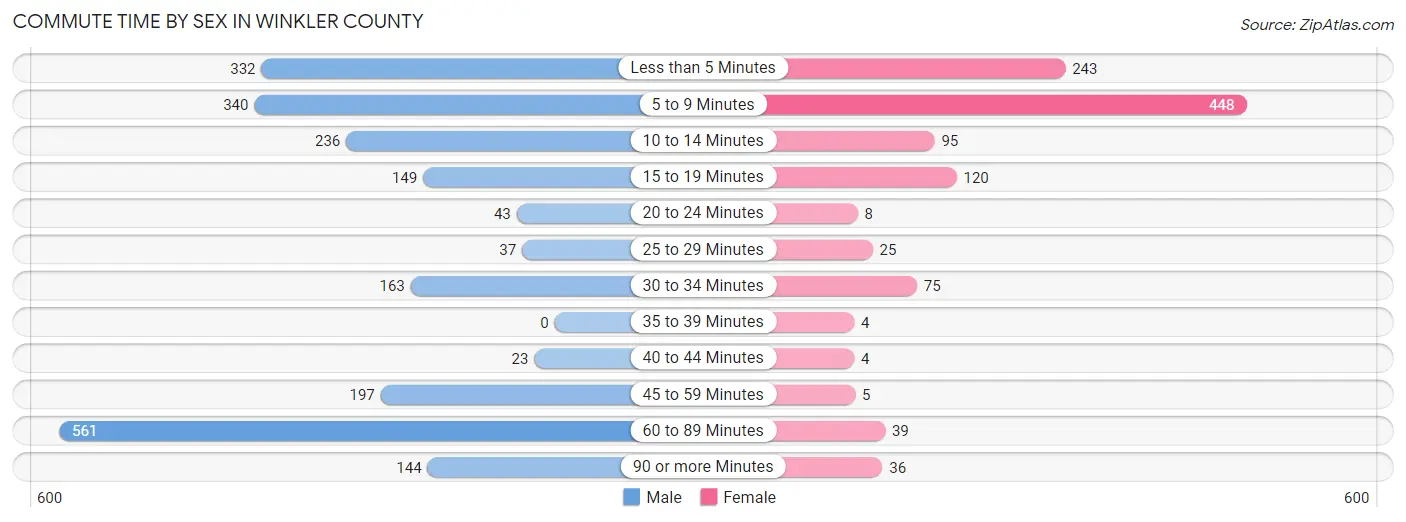
| Commute Time | Male | Female |
| Less than 5 Minutes | 332 (14.9%) | 243 (22.1%) |
| 5 to 9 Minutes | 340 (15.3%) | 448 (40.6%) |
| 10 to 14 Minutes | 236 (10.6%) | 95 (8.6%) |
| 15 to 19 Minutes | 149 (6.7%) | 120 (10.9%) |
| 20 to 24 Minutes | 43 (1.9%) | 8 (0.7%) |
| 25 to 29 Minutes | 37 (1.7%) | 25 (2.3%) |
| 30 to 34 Minutes | 163 (7.3%) | 75 (6.8%) |
| 35 to 39 Minutes | 0 (0.0%) | 4 (0.4%) |
| 40 to 44 Minutes | 23 (1.0%) | 4 (0.4%) |
| 45 to 59 Minutes | 197 (8.8%) | 5 (0.4%) |
| 60 to 89 Minutes | 561 (25.2%) | 39 (3.5%) |
| 90 or more Minutes | 144 (6.5%) | 36 (3.3%) |
Time of Departure to Work by Sex in Winkler County
The most frequent times of departure to work in Winkler County are 7:00 AM to 7:29 AM (517, 23.2%) for males and 7:30 AM to 7:59 AM (316, 28.7%) for females.
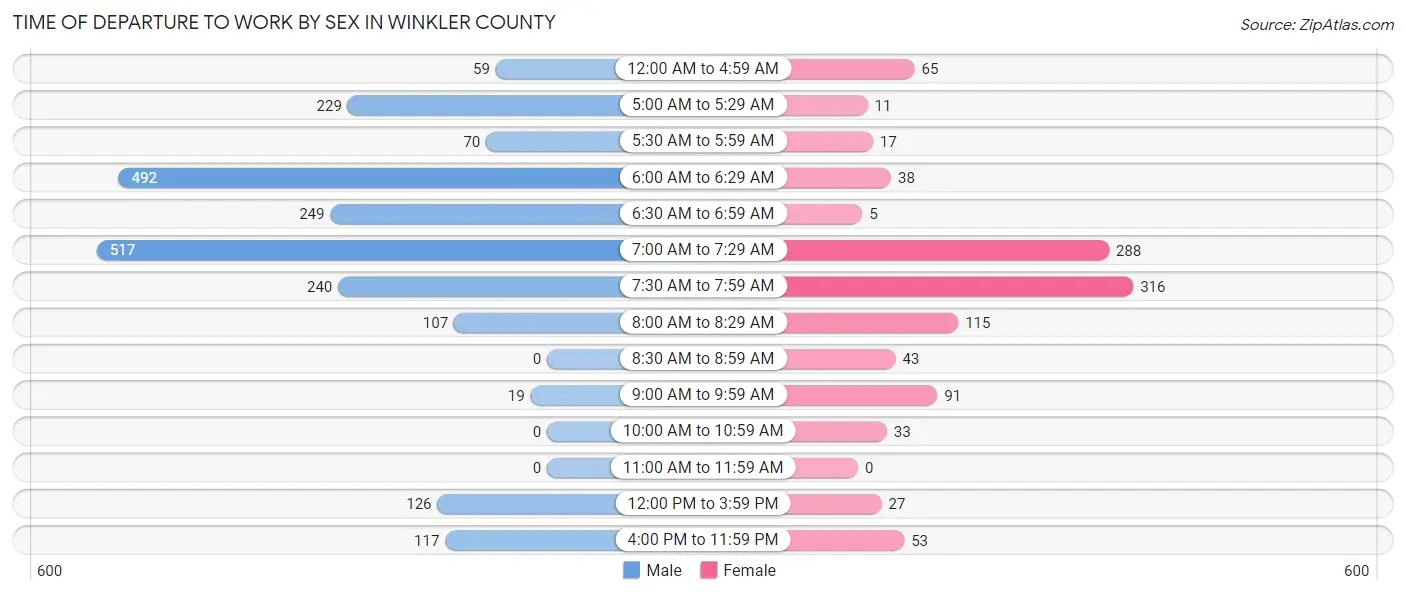
| Time of Departure | Male | Female |
| 12:00 AM to 4:59 AM | 59 (2.6%) | 65 (5.9%) |
| 5:00 AM to 5:29 AM | 229 (10.3%) | 11 (1.0%) |
| 5:30 AM to 5:59 AM | 70 (3.2%) | 17 (1.5%) |
| 6:00 AM to 6:29 AM | 492 (22.1%) | 38 (3.5%) |
| 6:30 AM to 6:59 AM | 249 (11.2%) | 5 (0.4%) |
| 7:00 AM to 7:29 AM | 517 (23.2%) | 288 (26.1%) |
| 7:30 AM to 7:59 AM | 240 (10.8%) | 316 (28.7%) |
| 8:00 AM to 8:29 AM | 107 (4.8%) | 115 (10.4%) |
| 8:30 AM to 8:59 AM | 0 (0.0%) | 43 (3.9%) |
| 9:00 AM to 9:59 AM | 19 (0.9%) | 91 (8.3%) |
| 10:00 AM to 10:59 AM | 0 (0.0%) | 33 (3.0%) |
| 11:00 AM to 11:59 AM | 0 (0.0%) | 0 (0.0%) |
| 12:00 PM to 3:59 PM | 126 (5.7%) | 27 (2.5%) |
| 4:00 PM to 11:59 PM | 117 (5.3%) | 53 (4.8%) |
| Total | 2,225 (100.0%) | 1,102 (100.0%) |
Housing Occupancy in Winkler County
Occupancy by Ownership in Winkler County
Of the total 2,685 dwellings in Winkler County, owner-occupied units account for 2,239 (83.4%), while renter-occupied units make up 446 (16.6%).
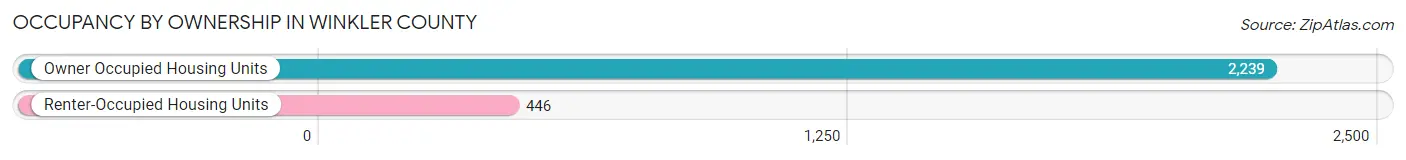
| Occupancy | # Housing Units | % Housing Units |
| Owner Occupied Housing Units | 2,239 | 83.4% |
| Renter-Occupied Housing Units | 446 | 16.6% |
| Total Occupied Housing Units | 2,685 | 100.0% |
Occupancy by Household Size in Winkler County
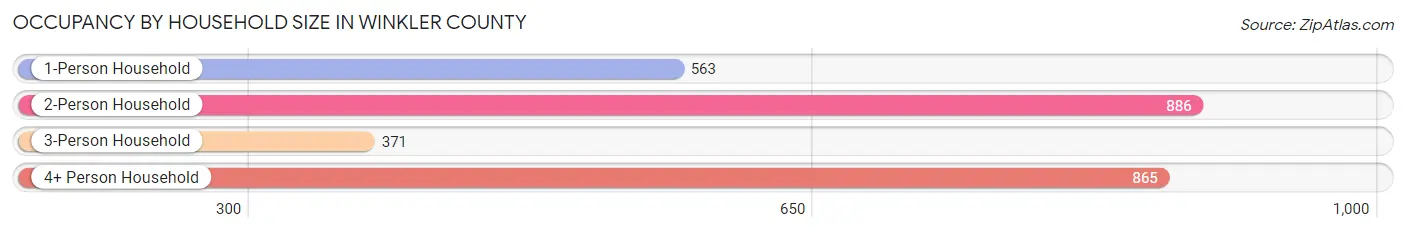
| Household Size | # Housing Units | % Housing Units |
| 1-Person Household | 563 | 21.0% |
| 2-Person Household | 886 | 33.0% |
| 3-Person Household | 371 | 13.8% |
| 4+ Person Household | 865 | 32.2% |
| Total Housing Units | 2,685 | 100.0% |
Occupancy by Ownership by Household Size in Winkler County
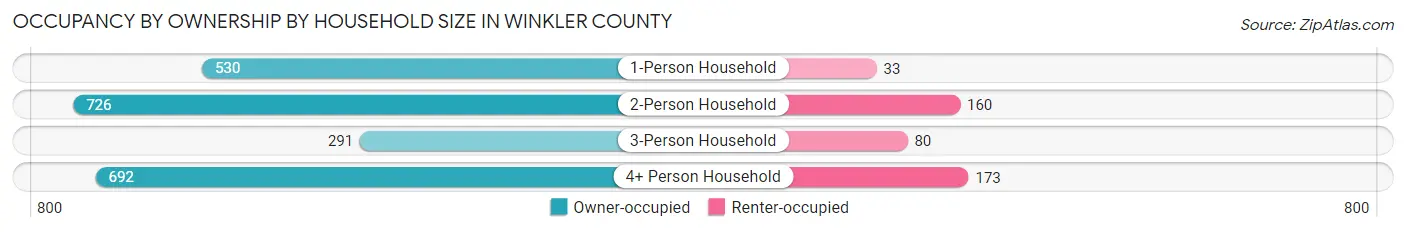
| Household Size | Owner-occupied | Renter-occupied |
| 1-Person Household | 530 (94.1%) | 33 (5.9%) |
| 2-Person Household | 726 (81.9%) | 160 (18.1%) |
| 3-Person Household | 291 (78.4%) | 80 (21.6%) |
| 4+ Person Household | 692 (80.0%) | 173 (20.0%) |
| Total Housing Units | 2,239 (83.4%) | 446 (16.6%) |
Occupancy by Educational Attainment in Winkler County
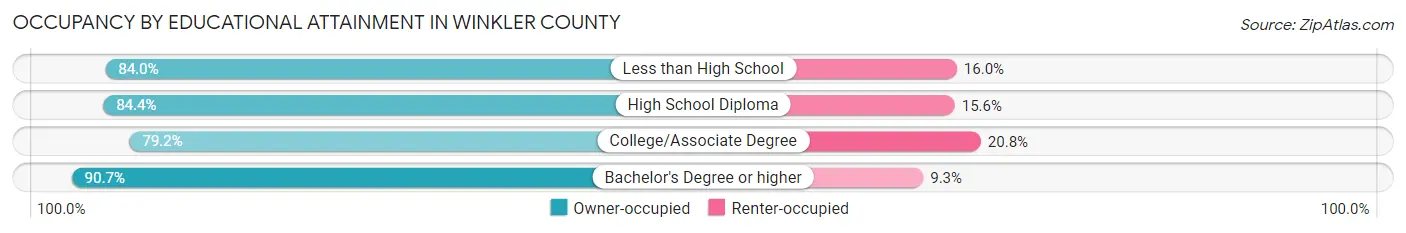
| Household Size | Owner-occupied | Renter-occupied |
| Less than High School | 661 (84.0%) | 126 (16.0%) |
| High School Diploma | 731 (84.4%) | 135 (15.6%) |
| College/Associate Degree | 614 (79.2%) | 161 (20.8%) |
| Bachelor's Degree or higher | 233 (90.7%) | 24 (9.3%) |
Occupancy by Age of Householder in Winkler County
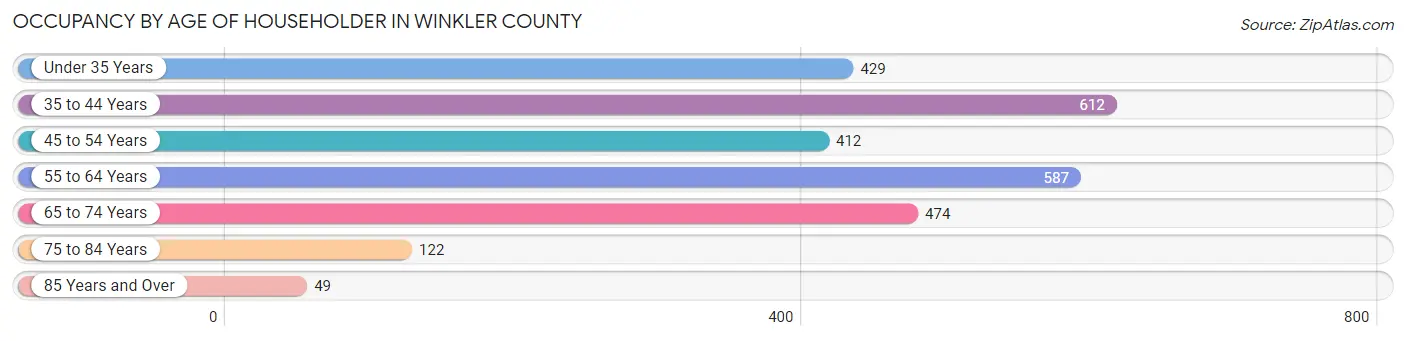
| Age Bracket | # Households | % Households |
| Under 35 Years | 429 | 16.0% |
| 35 to 44 Years | 612 | 22.8% |
| 45 to 54 Years | 412 | 15.3% |
| 55 to 64 Years | 587 | 21.9% |
| 65 to 74 Years | 474 | 17.6% |
| 75 to 84 Years | 122 | 4.5% |
| 85 Years and Over | 49 | 1.8% |
| Total | 2,685 | 100.0% |
Housing Finances in Winkler County
Median Income by Occupancy in Winkler County
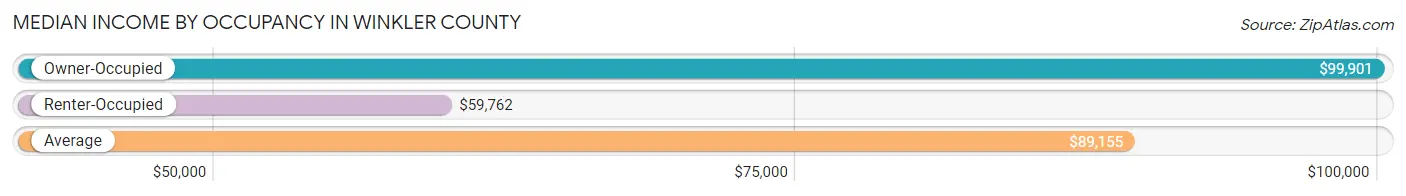
| Occupancy Type | # Households | Median Income |
| Owner-Occupied | 2,239 (83.4%) | $99,901 |
| Renter-Occupied | 446 (16.6%) | $59,762 |
| Average | 2,685 (100.0%) | $89,155 |
Occupancy by Householder Income Bracket in Winkler County
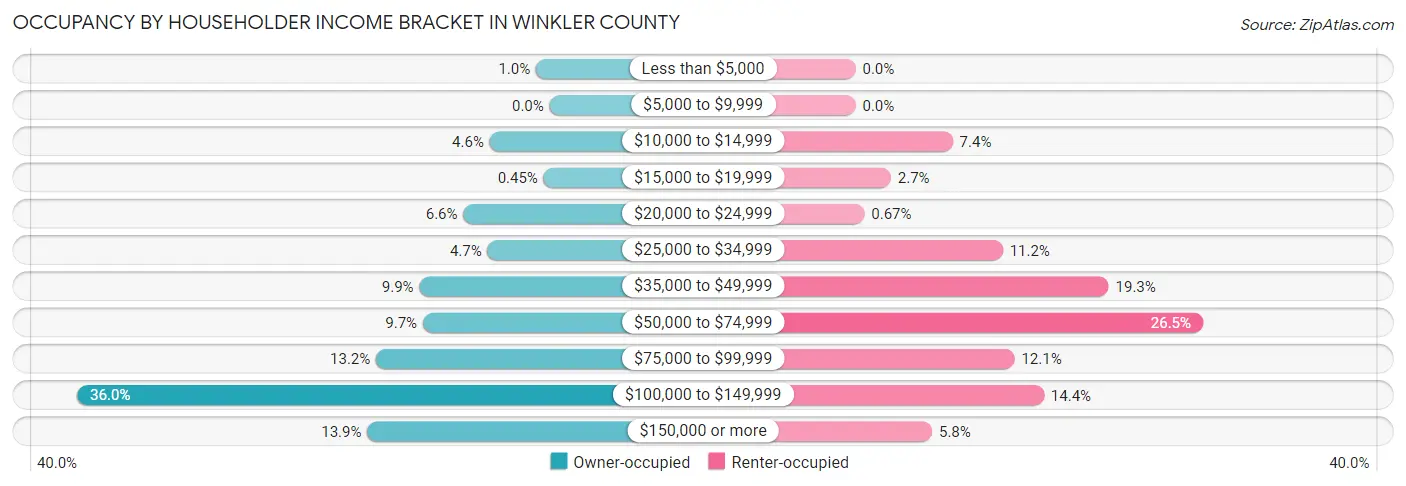
| Income Bracket | Owner-occupied | Renter-occupied |
| Less than $5,000 | 23 (1.0%) | 0 (0.0%) |
| $5,000 to $9,999 | 0 (0.0%) | 0 (0.0%) |
| $10,000 to $14,999 | 102 (4.6%) | 33 (7.4%) |
| $15,000 to $19,999 | 10 (0.4%) | 12 (2.7%) |
| $20,000 to $24,999 | 147 (6.6%) | 3 (0.7%) |
| $25,000 to $34,999 | 106 (4.7%) | 50 (11.2%) |
| $35,000 to $49,999 | 222 (9.9%) | 86 (19.3%) |
| $50,000 to $74,999 | 216 (9.7%) | 118 (26.5%) |
| $75,000 to $99,999 | 296 (13.2%) | 54 (12.1%) |
| $100,000 to $149,999 | 806 (36.0%) | 64 (14.3%) |
| $150,000 or more | 311 (13.9%) | 26 (5.8%) |
| Total | 2,239 (100.0%) | 446 (100.0%) |
Monthly Housing Cost Tiers in Winkler County
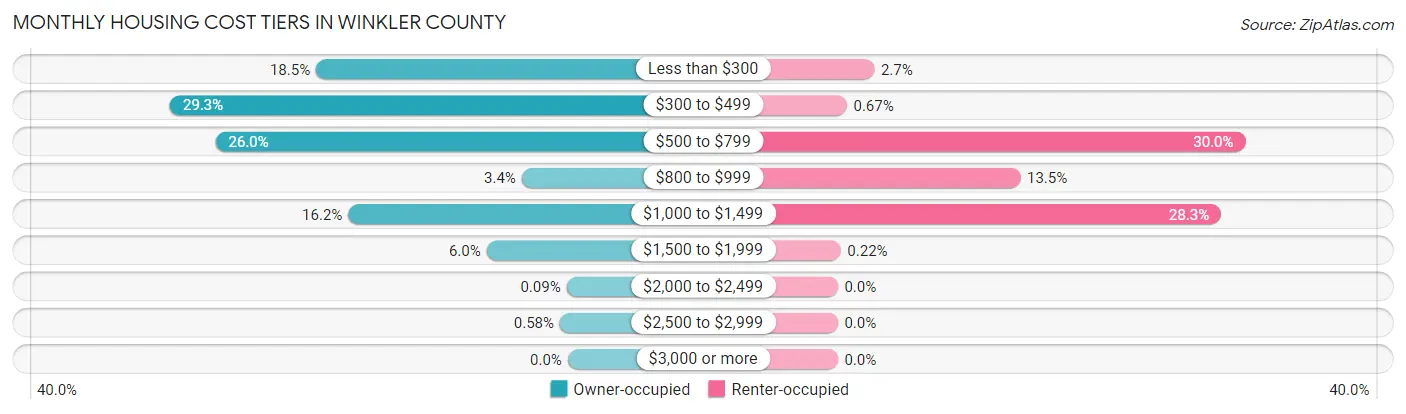
| Monthly Cost | Owner-occupied | Renter-occupied |
| Less than $300 | 415 (18.5%) | 12 (2.7%) |
| $300 to $499 | 656 (29.3%) | 3 (0.7%) |
| $500 to $799 | 581 (26.0%) | 134 (30.0%) |
| $800 to $999 | 76 (3.4%) | 60 (13.5%) |
| $1,000 to $1,499 | 362 (16.2%) | 126 (28.2%) |
| $1,500 to $1,999 | 134 (6.0%) | 1 (0.2%) |
| $2,000 to $2,499 | 2 (0.1%) | 0 (0.0%) |
| $2,500 to $2,999 | 13 (0.6%) | 0 (0.0%) |
| $3,000 or more | 0 (0.0%) | 0 (0.0%) |
| Total | 2,239 (100.0%) | 446 (100.0%) |
Physical Housing Characteristics in Winkler County
Housing Structures in Winkler County
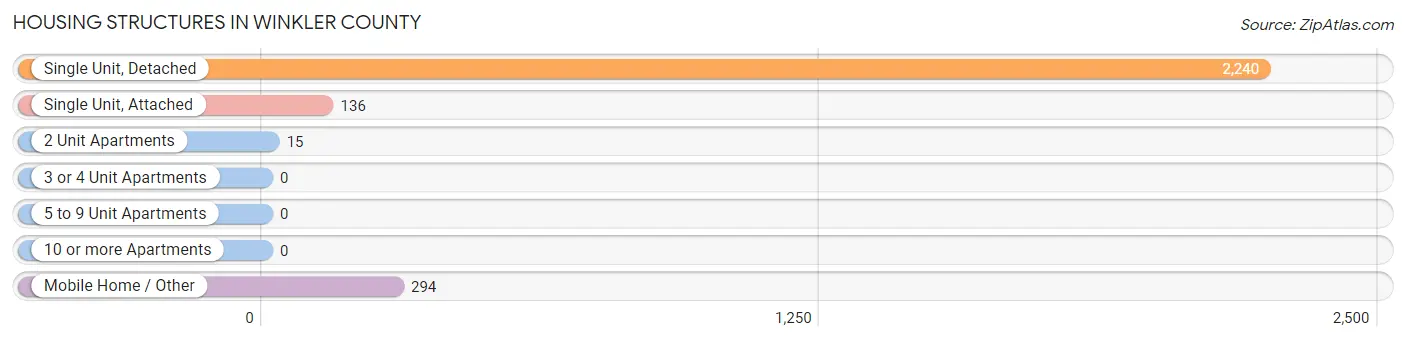
| Structure Type | # Housing Units | % Housing Units |
| Single Unit, Detached | 2,240 | 83.4% |
| Single Unit, Attached | 136 | 5.1% |
| 2 Unit Apartments | 15 | 0.6% |
| 3 or 4 Unit Apartments | 0 | 0.0% |
| 5 to 9 Unit Apartments | 0 | 0.0% |
| 10 or more Apartments | 0 | 0.0% |
| Mobile Home / Other | 294 | 11.0% |
| Total | 2,685 | 100.0% |
Housing Structures by Occupancy in Winkler County
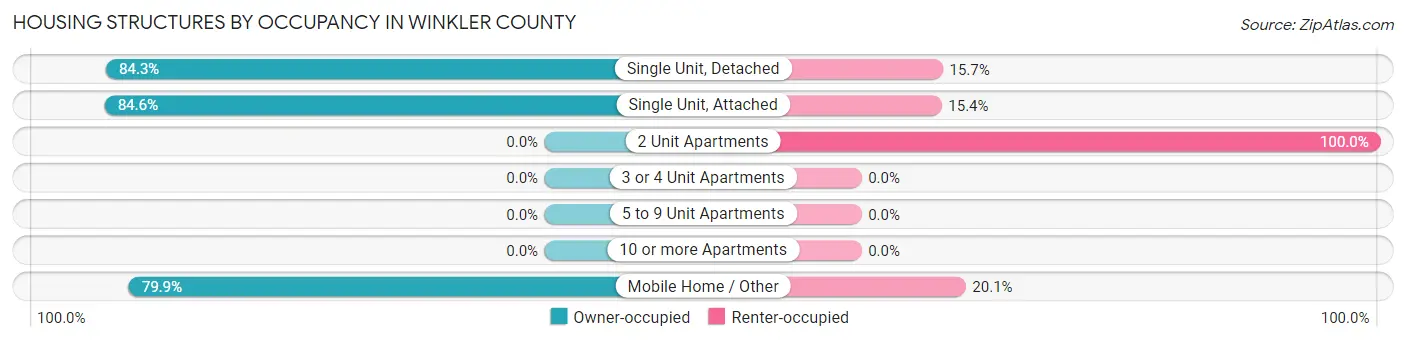
| Structure Type | Owner-occupied | Renter-occupied |
| Single Unit, Detached | 1,889 (84.3%) | 351 (15.7%) |
| Single Unit, Attached | 115 (84.6%) | 21 (15.4%) |
| 2 Unit Apartments | 0 (0.0%) | 15 (100.0%) |
| 3 or 4 Unit Apartments | 0 (0.0%) | 0 (0.0%) |
| 5 to 9 Unit Apartments | 0 (0.0%) | 0 (0.0%) |
| 10 or more Apartments | 0 (0.0%) | 0 (0.0%) |
| Mobile Home / Other | 235 (79.9%) | 59 (20.1%) |
| Total | 2,239 (83.4%) | 446 (16.6%) |
Housing Structures by Number of Rooms in Winkler County
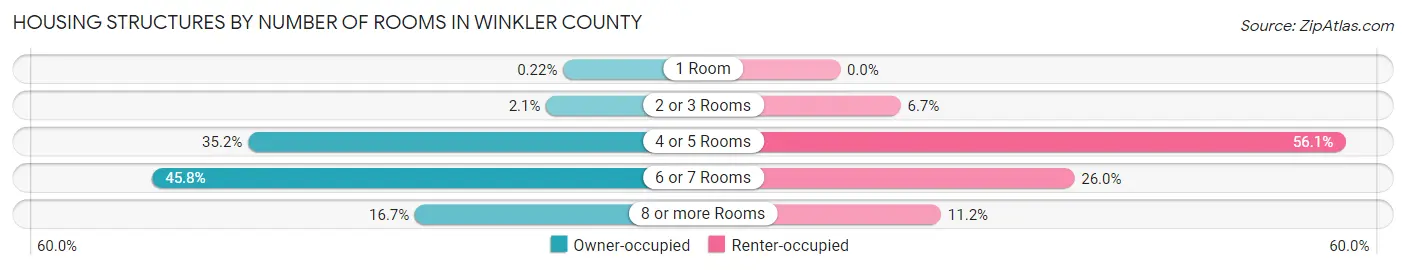
| Number of Rooms | Owner-occupied | Renter-occupied |
| 1 Room | 5 (0.2%) | 0 (0.0%) |
| 2 or 3 Rooms | 47 (2.1%) | 30 (6.7%) |
| 4 or 5 Rooms | 788 (35.2%) | 250 (56.0%) |
| 6 or 7 Rooms | 1,026 (45.8%) | 116 (26.0%) |
| 8 or more Rooms | 373 (16.7%) | 50 (11.2%) |
| Total | 2,239 (100.0%) | 446 (100.0%) |
Housing Structure by Heating Type in Winkler County
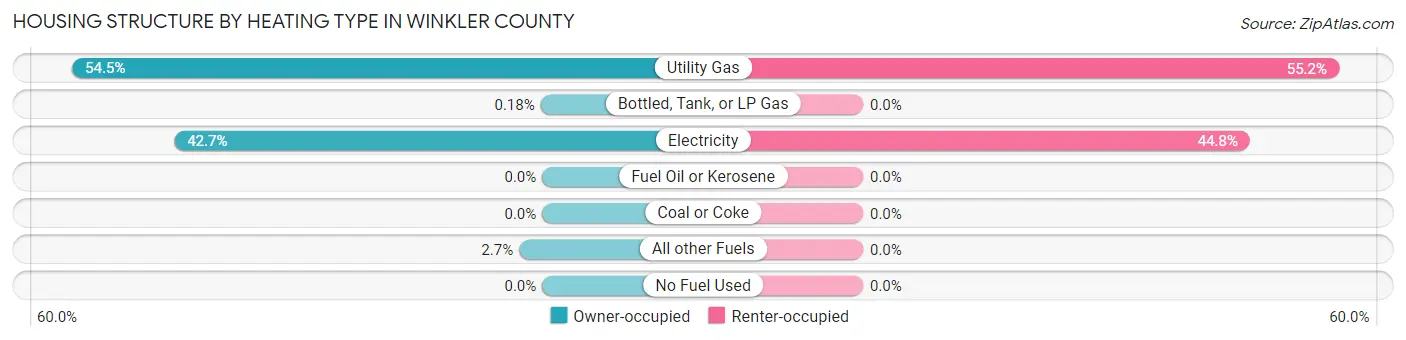
| Heating Type | Owner-occupied | Renter-occupied |
| Utility Gas | 1,220 (54.5%) | 246 (55.2%) |
| Bottled, Tank, or LP Gas | 4 (0.2%) | 0 (0.0%) |
| Electricity | 955 (42.6%) | 200 (44.8%) |
| Fuel Oil or Kerosene | 0 (0.0%) | 0 (0.0%) |
| Coal or Coke | 0 (0.0%) | 0 (0.0%) |
| All other Fuels | 60 (2.7%) | 0 (0.0%) |
| No Fuel Used | 0 (0.0%) | 0 (0.0%) |
| Total | 2,239 (100.0%) | 446 (100.0%) |
Household Vehicle Usage in Winkler County
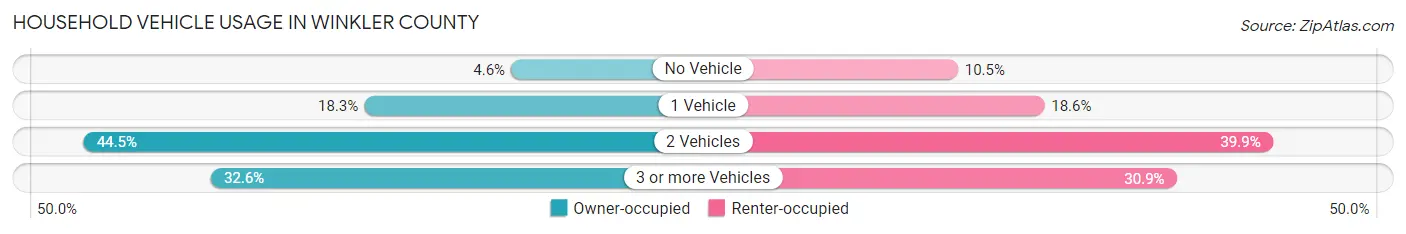
| Vehicles per Household | Owner-occupied | Renter-occupied |
| No Vehicle | 103 (4.6%) | 47 (10.5%) |
| 1 Vehicle | 410 (18.3%) | 83 (18.6%) |
| 2 Vehicles | 996 (44.5%) | 178 (39.9%) |
| 3 or more Vehicles | 730 (32.6%) | 138 (30.9%) |
| Total | 2,239 (100.0%) | 446 (100.0%) |
Real Estate & Mortgages in Winkler County
Real Estate and Mortgage Overview in Winkler County
| Characteristic | Without Mortgage | With Mortgage |
| Housing Units | 1,735 | 504 |
| Median Property Value | $101,500 | $182,700 |
| Median Household Income | $88,818 | $108 |
| Monthly Housing Costs | $450 | $0 |
| Real Estate Taxes | $1,014 | $22 |
Property Value by Mortgage Status in Winkler County
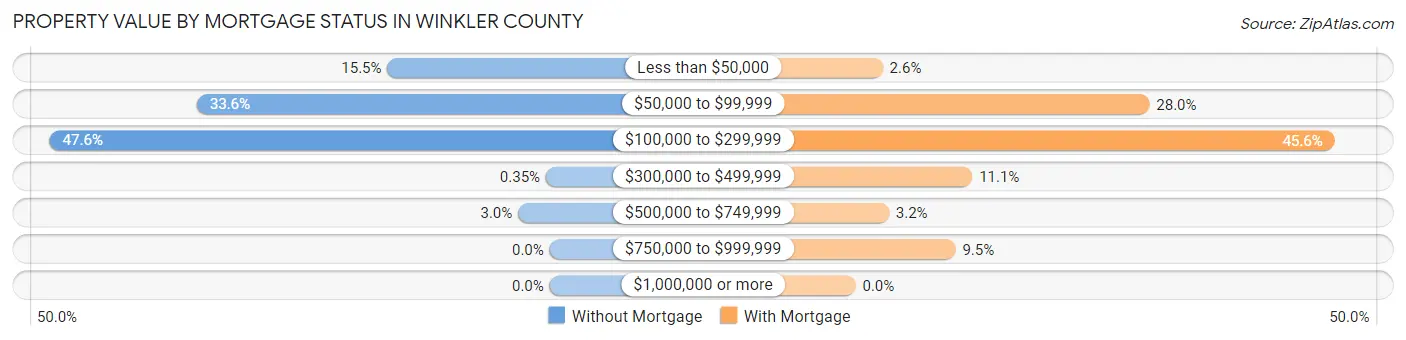
| Property Value | Without Mortgage | With Mortgage |
| Less than $50,000 | 268 (15.4%) | 13 (2.6%) |
| $50,000 to $99,999 | 583 (33.6%) | 141 (28.0%) |
| $100,000 to $299,999 | 826 (47.6%) | 230 (45.6%) |
| $300,000 to $499,999 | 6 (0.4%) | 56 (11.1%) |
| $500,000 to $749,999 | 52 (3.0%) | 16 (3.2%) |
| $750,000 to $999,999 | 0 (0.0%) | 48 (9.5%) |
| $1,000,000 or more | 0 (0.0%) | 0 (0.0%) |
| Total | 1,735 (100.0%) | 504 (100.0%) |
Household Income by Mortgage Status in Winkler County
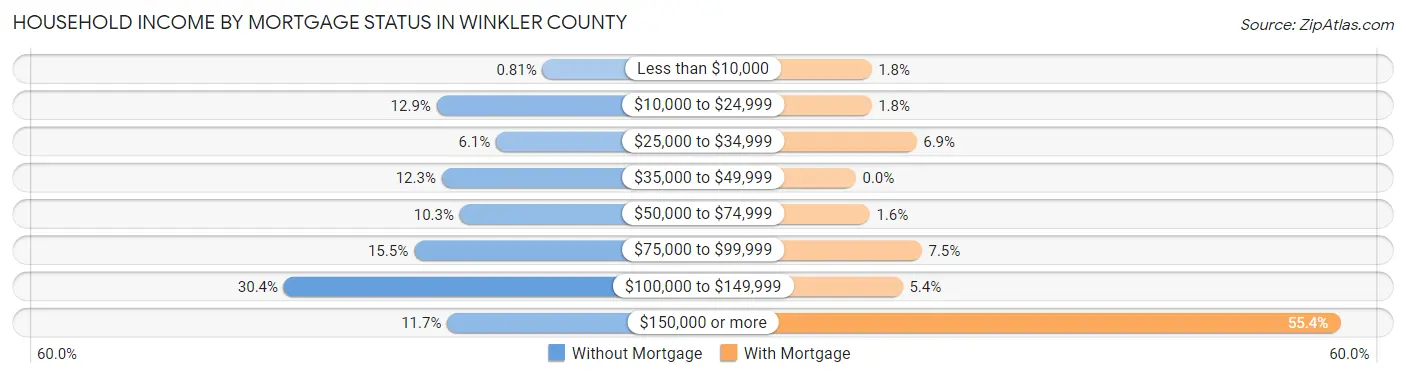
| Household Income | Without Mortgage | With Mortgage |
| Less than $10,000 | 14 (0.8%) | 9 (1.8%) |
| $10,000 to $24,999 | 224 (12.9%) | 9 (1.8%) |
| $25,000 to $34,999 | 106 (6.1%) | 35 (6.9%) |
| $35,000 to $49,999 | 214 (12.3%) | 0 (0.0%) |
| $50,000 to $74,999 | 178 (10.3%) | 8 (1.6%) |
| $75,000 to $99,999 | 269 (15.5%) | 38 (7.5%) |
| $100,000 to $149,999 | 527 (30.4%) | 27 (5.4%) |
| $150,000 or more | 203 (11.7%) | 279 (55.4%) |
| Total | 1,735 (100.0%) | 504 (100.0%) |
Property Value to Household Income Ratio in Winkler County
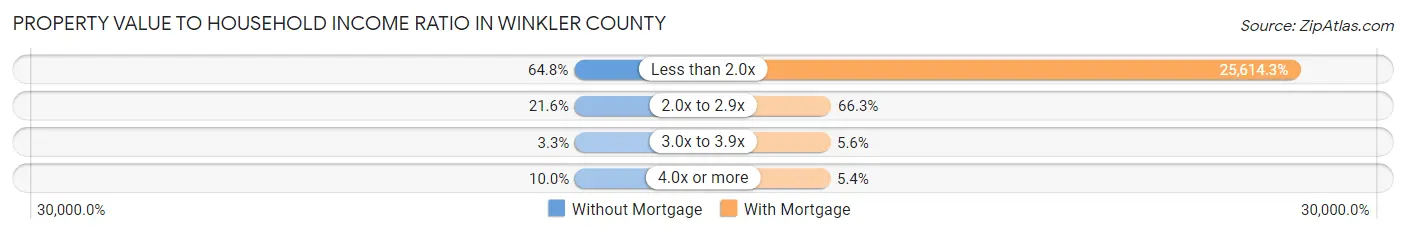
| Value-to-Income Ratio | Without Mortgage | With Mortgage |
| Less than 2.0x | 1,125 (64.8%) | 129,096 (25,614.3%) |
| 2.0x to 2.9x | 375 (21.6%) | 334 (66.3%) |
| 3.0x to 3.9x | 57 (3.3%) | 28 (5.6%) |
| 4.0x or more | 174 (10.0%) | 27 (5.4%) |
| Total | 1,735 (100.0%) | 504 (100.0%) |
Real Estate Taxes by Mortgage Status in Winkler County
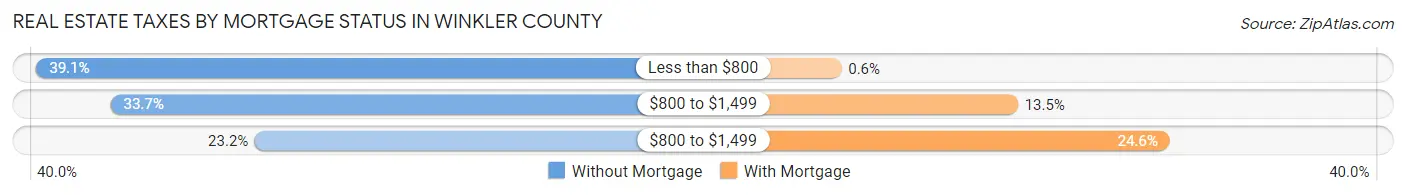
| Property Taxes | Without Mortgage | With Mortgage |
| Less than $800 | 679 (39.1%) | 3 (0.6%) |
| $800 to $1,499 | 585 (33.7%) | 68 (13.5%) |
| $800 to $1,499 | 403 (23.2%) | 124 (24.6%) |
| Total | 1,735 (100.0%) | 504 (100.0%) |
Health & Disability in Winkler County
Health Insurance Coverage by Age in Winkler County
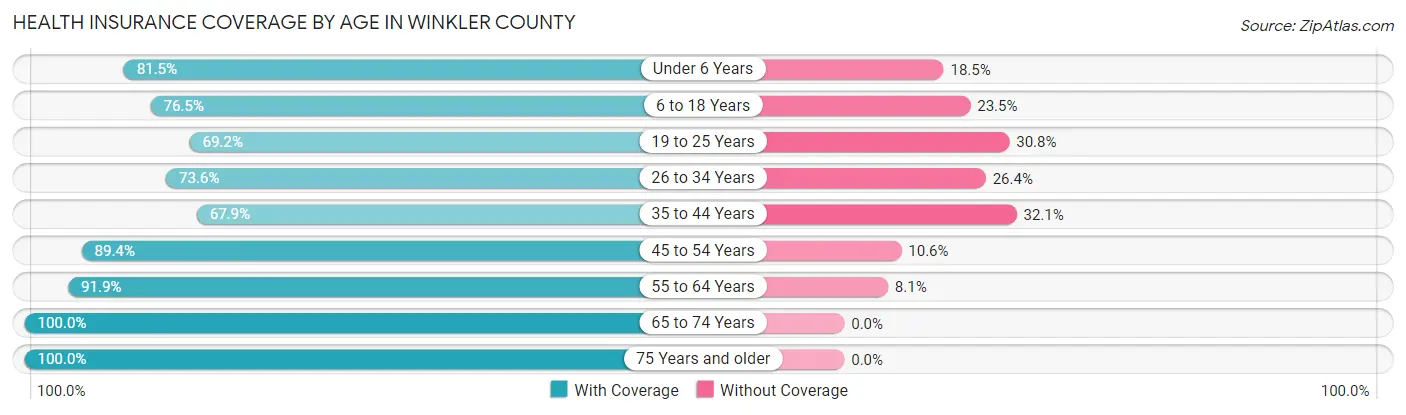
| Age Bracket | With Coverage | Without Coverage |
| Under 6 Years | 590 (81.5%) | 134 (18.5%) |
| 6 to 18 Years | 1,296 (76.5%) | 398 (23.5%) |
| 19 to 25 Years | 360 (69.2%) | 160 (30.8%) |
| 26 to 34 Years | 519 (73.6%) | 186 (26.4%) |
| 35 to 44 Years | 782 (67.9%) | 370 (32.1%) |
| 45 to 54 Years | 714 (89.4%) | 85 (10.6%) |
| 55 to 64 Years | 802 (91.9%) | 71 (8.1%) |
| 65 to 74 Years | 794 (100.0%) | 0 (0.0%) |
| 75 Years and older | 235 (100.0%) | 0 (0.0%) |
| Total | 6,092 (81.3%) | 1,404 (18.7%) |
Health Insurance Coverage by Citizenship Status in Winkler County
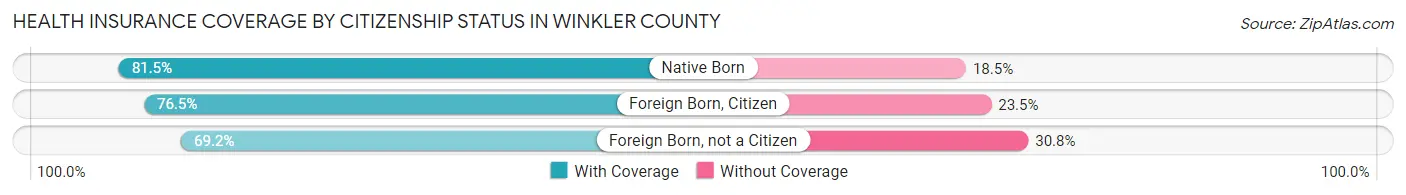
| Citizenship Status | With Coverage | Without Coverage |
| Native Born | 590 (81.5%) | 134 (18.5%) |
| Foreign Born, Citizen | 1,296 (76.5%) | 398 (23.5%) |
| Foreign Born, not a Citizen | 360 (69.2%) | 160 (30.8%) |
Health Insurance Coverage by Household Income in Winkler County
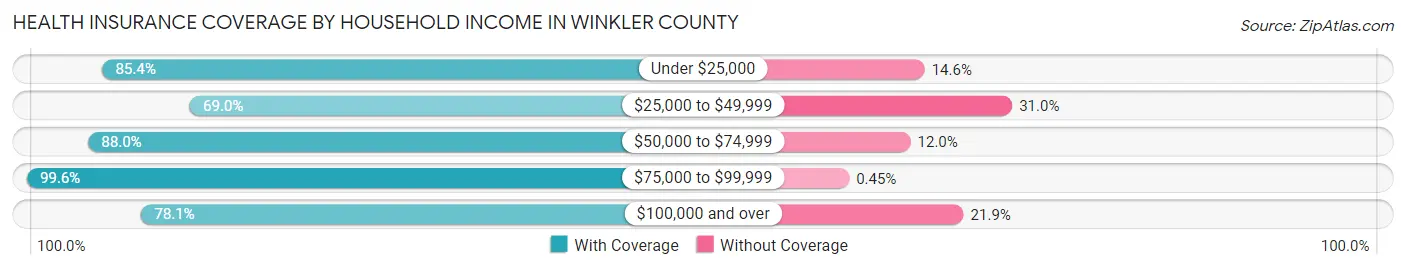
| Household Income | With Coverage | Without Coverage |
| Under $25,000 | 538 (85.4%) | 92 (14.6%) |
| $25,000 to $49,999 | 661 (69.0%) | 297 (31.0%) |
| $50,000 to $74,999 | 780 (88.0%) | 106 (12.0%) |
| $75,000 to $99,999 | 877 (99.6%) | 4 (0.4%) |
| $100,000 and over | 3,230 (78.1%) | 905 (21.9%) |
Public vs Private Health Insurance Coverage by Age in Winkler County
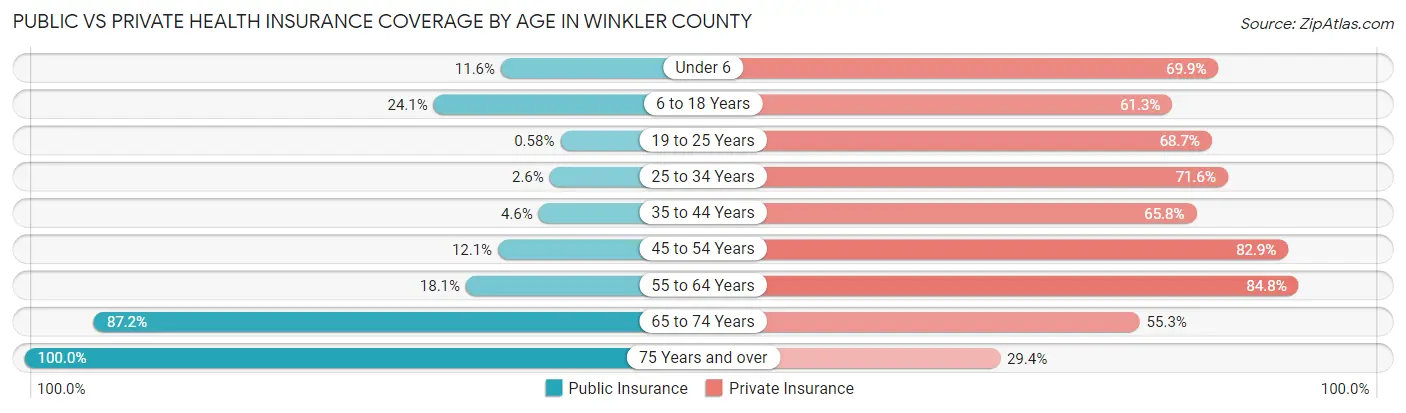
| Age Bracket | Public Insurance | Private Insurance |
| Under 6 | 84 (11.6%) | 506 (69.9%) |
| 6 to 18 Years | 408 (24.1%) | 1,039 (61.3%) |
| 19 to 25 Years | 3 (0.6%) | 357 (68.6%) |
| 25 to 34 Years | 18 (2.5%) | 505 (71.6%) |
| 35 to 44 Years | 53 (4.6%) | 758 (65.8%) |
| 45 to 54 Years | 97 (12.1%) | 662 (82.9%) |
| 55 to 64 Years | 158 (18.1%) | 740 (84.8%) |
| 65 to 74 Years | 692 (87.2%) | 439 (55.3%) |
| 75 Years and over | 235 (100.0%) | 69 (29.4%) |
| Total | 1,748 (23.3%) | 5,075 (67.7%) |
Disability Status by Sex by Age in Winkler County
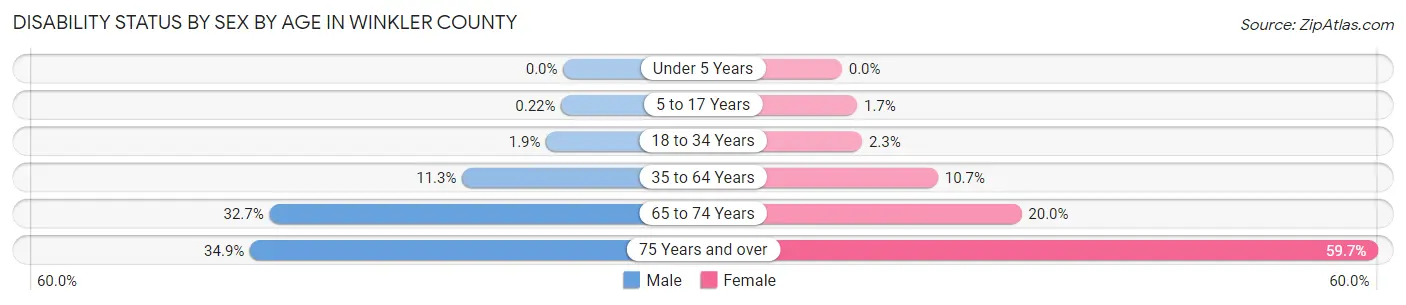
| Age Bracket | Male | Female |
| Under 5 Years | 0 (0.0%) | 0 (0.0%) |
| 5 to 17 Years | 2 (0.2%) | 13 (1.7%) |
| 18 to 34 Years | 15 (1.9%) | 15 (2.2%) |
| 35 to 64 Years | 162 (11.3%) | 148 (10.7%) |
| 65 to 74 Years | 124 (32.7%) | 83 (20.0%) |
| 75 Years and over | 30 (34.9%) | 89 (59.7%) |
Disability Class by Sex by Age in Winkler County
Disability Class: Hearing Difficulty
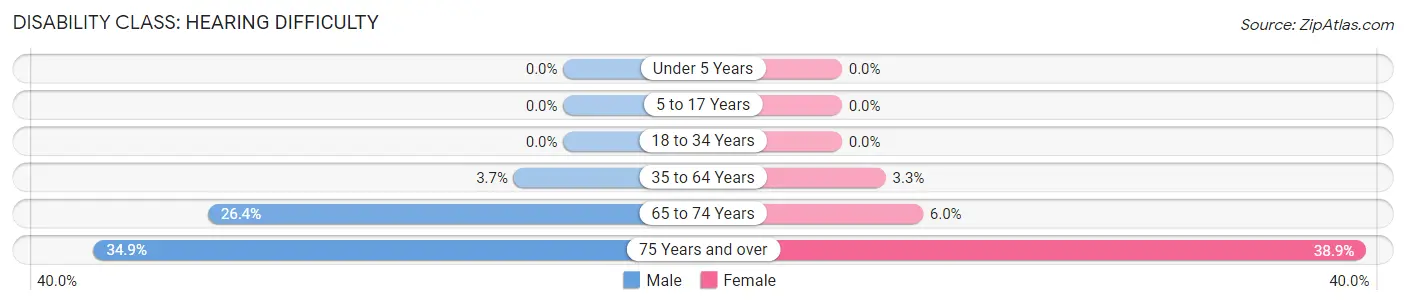
| Age Bracket | Male | Female |
| Under 5 Years | 0 (0.0%) | 0 (0.0%) |
| 5 to 17 Years | 0 (0.0%) | 0 (0.0%) |
| 18 to 34 Years | 0 (0.0%) | 0 (0.0%) |
| 35 to 64 Years | 53 (3.7%) | 45 (3.3%) |
| 65 to 74 Years | 100 (26.4%) | 25 (6.0%) |
| 75 Years and over | 30 (34.9%) | 58 (38.9%) |
Disability Class: Vision Difficulty
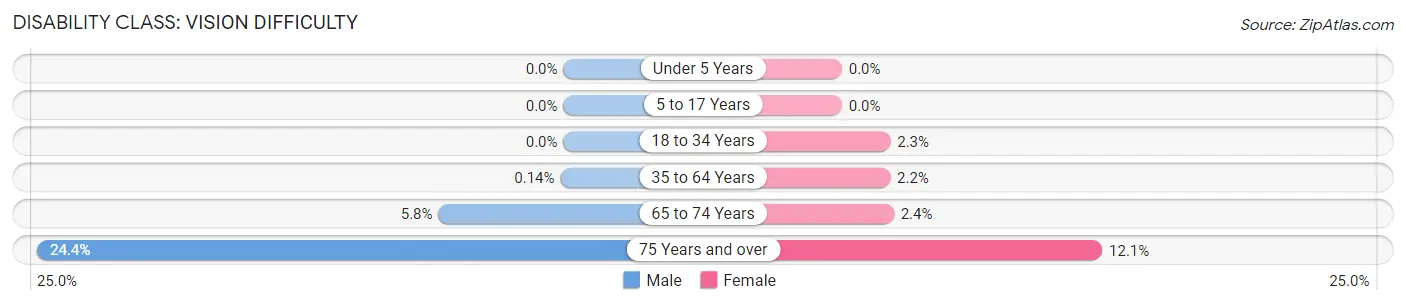
| Age Bracket | Male | Female |
| Under 5 Years | 0 (0.0%) | 0 (0.0%) |
| 5 to 17 Years | 0 (0.0%) | 0 (0.0%) |
| 18 to 34 Years | 0 (0.0%) | 15 (2.2%) |
| 35 to 64 Years | 2 (0.1%) | 31 (2.2%) |
| 65 to 74 Years | 22 (5.8%) | 10 (2.4%) |
| 75 Years and over | 21 (24.4%) | 18 (12.1%) |
Disability Class: Cognitive Difficulty
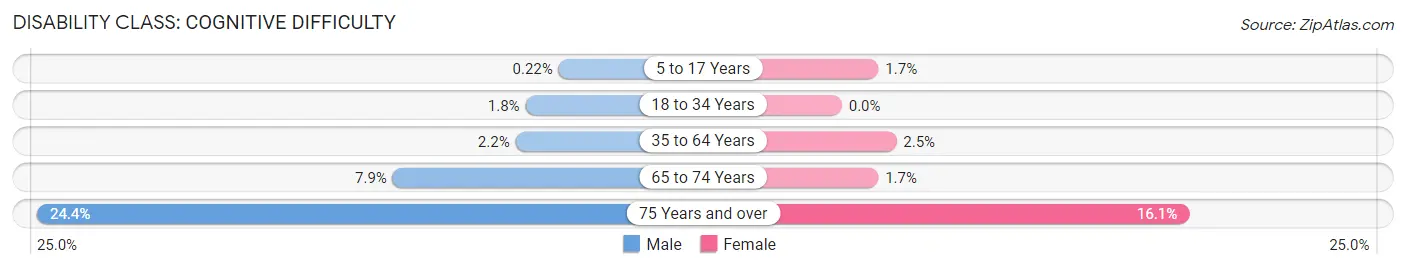
| Age Bracket | Male | Female |
| 5 to 17 Years | 2 (0.2%) | 13 (1.7%) |
| 18 to 34 Years | 14 (1.8%) | 0 (0.0%) |
| 35 to 64 Years | 32 (2.2%) | 35 (2.5%) |
| 65 to 74 Years | 30 (7.9%) | 7 (1.7%) |
| 75 Years and over | 21 (24.4%) | 24 (16.1%) |
Disability Class: Ambulatory Difficulty
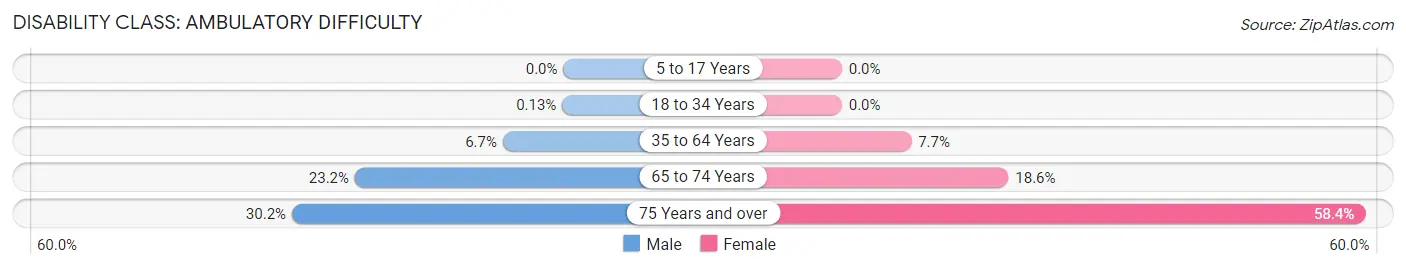
| Age Bracket | Male | Female |
| 5 to 17 Years | 0 (0.0%) | 0 (0.0%) |
| 18 to 34 Years | 1 (0.1%) | 0 (0.0%) |
| 35 to 64 Years | 97 (6.7%) | 107 (7.7%) |
| 65 to 74 Years | 88 (23.2%) | 77 (18.5%) |
| 75 Years and over | 26 (30.2%) | 87 (58.4%) |
Disability Class: Self-Care Difficulty
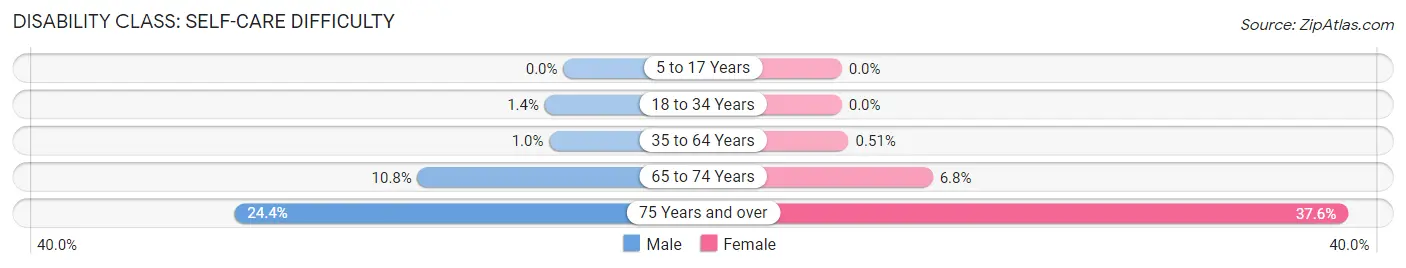
| Age Bracket | Male | Female |
| 5 to 17 Years | 0 (0.0%) | 0 (0.0%) |
| 18 to 34 Years | 11 (1.4%) | 0 (0.0%) |
| 35 to 64 Years | 15 (1.0%) | 7 (0.5%) |
| 65 to 74 Years | 41 (10.8%) | 28 (6.8%) |
| 75 Years and over | 21 (24.4%) | 56 (37.6%) |
Technology Access in Winkler County
Computing Device Access in Winkler County
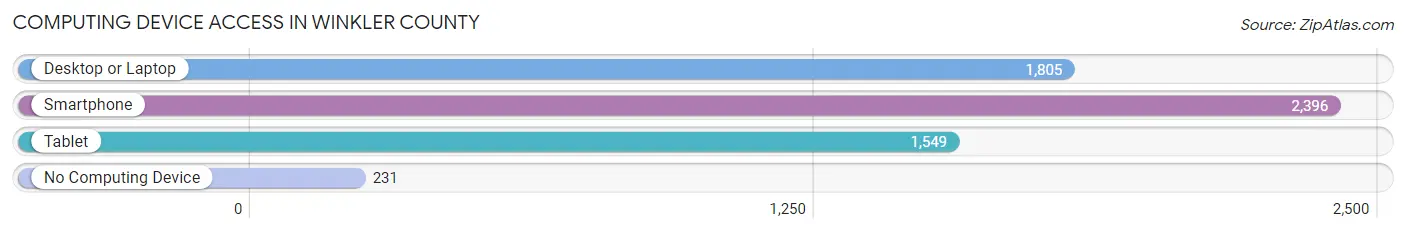
| Device Type | # Households | % Households |
| Desktop or Laptop | 1,805 | 67.2% |
| Smartphone | 2,396 | 89.2% |
| Tablet | 1,549 | 57.7% |
| No Computing Device | 231 | 8.6% |
| Total | 2,685 | 100.0% |
Internet Access in Winkler County
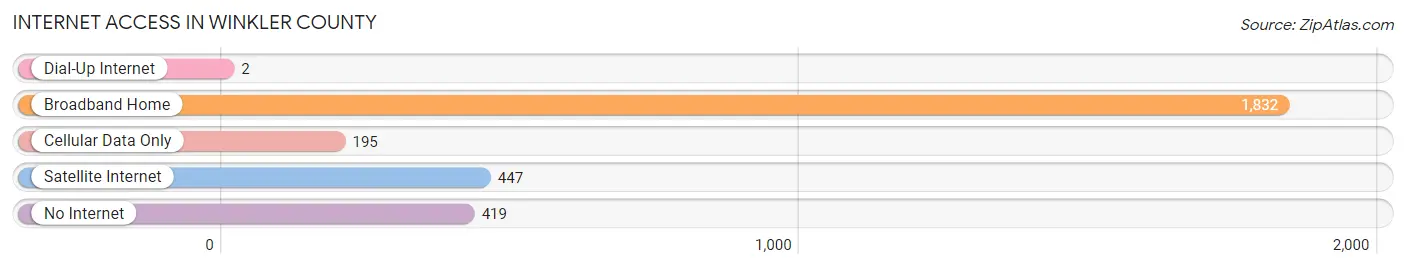
| Internet Type | # Households | % Households |
| Dial-Up Internet | 2 | 0.1% |
| Broadband Home | 1,832 | 68.2% |
| Cellular Data Only | 195 | 7.3% |
| Satellite Internet | 447 | 16.7% |
| No Internet | 419 | 15.6% |
| Total | 2,685 | 100.0% |
Winkler County Summary
Winkler County is located in the western part of the state of Texas, in the Permian Basin region. It is bordered by Loving County to the north, Ward County to the east, Reeves County to the south, and Culberson County to the west. The county seat is Kermit, and the largest city is Wink. The county was named for Clinton M. Winkler, a Confederate colonel and Texas state legislator.
Geography
Winkler County covers an area of 902 square miles, making it the second-smallest county in Texas. The terrain is mostly flat, with some rolling hills in the northern part of the county. The Pecos River forms the county's eastern boundary. The county is part of the Permian Basin, an oil-producing region that stretches across West Texas and southeastern New Mexico.
The climate is semi-arid, with hot summers and mild winters. The average annual precipitation is about 15 inches.
Economy
The economy of Winkler County is largely based on oil and gas production. The county is home to several oil and gas fields, including the Winkler County Oil Field, which is one of the largest in the state. The county also has a large agricultural sector, with cotton, sorghum, and wheat being the main crops.
Demographics
As of the 2010 census, the population of Winkler County was 7,110. The racial makeup of the county was 79.3% White, 0.7% African American, 0.7% Native American, 0.2% Asian, 0.1% Pacific Islander, 16.7% from other races, and 2.3% from two or more races. Hispanic or Latino of any race were 44.2% of the population.
The median household income was $37,945, and the median family income was $45,938. The per capita income was $17,945. About 17.2% of the population was below the poverty line.
Education
Winkler County is served by the Winkler County Independent School District. The district has three elementary schools, one middle school, and one high school. The county is also home to the University of Texas of the Permian Basin, a public university located in Odessa.
Conclusion
Winkler County is a small county in the western part of Texas, in the Permian Basin region. The economy is largely based on oil and gas production, and the county also has a large agricultural sector. The population is mostly White, with a significant Hispanic or Latino population. The county is served by the Winkler County Independent School District, as well as the University of Texas of the Permian Basin.
Common Questions
What is Per Capita Income in Winkler County?
Per Capita income in Winkler County is $32,325.
What is the Median Family Income in Winkler County?
Median Family Income in Winkler County is $88,581.
What is the Median Household income in Winkler County?
Median Household Income in Winkler County is $89,155.
What is Income or Wage Gap in Winkler County?
Income or Wage Gap in Winkler County is 31.2%.
Women in Winkler County earn 68.8 cents for every dollar earned by a man.
What is Family Income Deficit in Winkler County?
Family Income Deficit in Winkler County is $11,669.
Families that are below poverty line in Winkler County earn $11,669 less on average than the poverty threshold level.
What is Inequality or Gini Index in Winkler County?
Inequality or Gini Index in Winkler County is 0.34.
What is the Total Population of Winkler County?
Total Population of Winkler County is 7,582.
What is the Total Male Population of Winkler County?
Total Male Population of Winkler County is 3,925.
What is the Total Female Population of Winkler County?
Total Female Population of Winkler County is 3,657.
What is the Ratio of Males per 100 Females in Winkler County?
There are 107.33 Males per 100 Females in Winkler County.
What is the Ratio of Females per 100 Males in Winkler County?
There are 93.17 Females per 100 Males in Winkler County.
What is the Median Population Age in Winkler County?
Median Population Age in Winkler County is 36.2 Years.
What is the Average Family Size in Winkler County
Average Family Size in Winkler County is 3.2 People.
What is the Average Household Size in Winkler County
Average Household Size in Winkler County is 2.8 People.
How Large is the Labor Force in Winkler County?
There are 3,460 People in the Labor Forcein in Winkler County.
What is the Percentage of People in the Labor Force in Winkler County?
60.9% of People are in the Labor Force in Winkler County.
What is the Unemployment Rate in Winkler County?
Unemployment Rate in Winkler County is 2.3%.